WO2018101128A1 - 試料に対応付けられた推定対象値を推定する方法及び装置 - Google Patents
試料に対応付けられた推定対象値を推定する方法及び装置 Download PDFInfo
- Publication number
- WO2018101128A1 WO2018101128A1 PCT/JP2017/041856 JP2017041856W WO2018101128A1 WO 2018101128 A1 WO2018101128 A1 WO 2018101128A1 JP 2017041856 W JP2017041856 W JP 2017041856W WO 2018101128 A1 WO2018101128 A1 WO 2018101128A1
- Authority
- WO
- WIPO (PCT)
- Prior art keywords
- sample
- stnps
- machine learning
- chemical sensor
- chemical
- Prior art date
Links
Images


Classifications
-
- G—PHYSICS
- G01—MEASURING; TESTING
- G01N—INVESTIGATING OR ANALYSING MATERIALS BY DETERMINING THEIR CHEMICAL OR PHYSICAL PROPERTIES
- G01N29/00—Investigating or analysing materials by the use of ultrasonic, sonic or infrasonic waves; Visualisation of the interior of objects by transmitting ultrasonic or sonic waves through the object
- G01N29/44—Processing the detected response signal, e.g. electronic circuits specially adapted therefor
- G01N29/4409—Processing the detected response signal, e.g. electronic circuits specially adapted therefor by comparison
- G01N29/4427—Processing the detected response signal, e.g. electronic circuits specially adapted therefor by comparison with stored values, e.g. threshold values
-
- G—PHYSICS
- G16—INFORMATION AND COMMUNICATION TECHNOLOGY [ICT] SPECIALLY ADAPTED FOR SPECIFIC APPLICATION FIELDS
- G16C—COMPUTATIONAL CHEMISTRY; CHEMOINFORMATICS; COMPUTATIONAL MATERIALS SCIENCE
- G16C20/00—Chemoinformatics, i.e. ICT specially adapted for the handling of physicochemical or structural data of chemical particles, elements, compounds or mixtures
- G16C20/70—Machine learning, data mining or chemometrics
-
- G—PHYSICS
- G01—MEASURING; TESTING
- G01N—INVESTIGATING OR ANALYSING MATERIALS BY DETERMINING THEIR CHEMICAL OR PHYSICAL PROPERTIES
- G01N1/00—Sampling; Preparing specimens for investigation
-
- G—PHYSICS
- G01—MEASURING; TESTING
- G01N—INVESTIGATING OR ANALYSING MATERIALS BY DETERMINING THEIR CHEMICAL OR PHYSICAL PROPERTIES
- G01N19/00—Investigating materials by mechanical methods
-
- G—PHYSICS
- G01—MEASURING; TESTING
- G01N—INVESTIGATING OR ANALYSING MATERIALS BY DETERMINING THEIR CHEMICAL OR PHYSICAL PROPERTIES
- G01N29/00—Investigating or analysing materials by the use of ultrasonic, sonic or infrasonic waves; Visualisation of the interior of objects by transmitting ultrasonic or sonic waves through the object
- G01N29/02—Analysing fluids
- G01N29/022—Fluid sensors based on microsensors, e.g. quartz crystal-microbalance [QCM], surface acoustic wave [SAW] devices, tuning forks, cantilevers, flexural plate wave [FPW] devices
-
- G—PHYSICS
- G01—MEASURING; TESTING
- G01N—INVESTIGATING OR ANALYSING MATERIALS BY DETERMINING THEIR CHEMICAL OR PHYSICAL PROPERTIES
- G01N29/00—Investigating or analysing materials by the use of ultrasonic, sonic or infrasonic waves; Visualisation of the interior of objects by transmitting ultrasonic or sonic waves through the object
- G01N29/02—Analysing fluids
- G01N29/036—Analysing fluids by measuring frequency or resonance of acoustic waves
-
- G—PHYSICS
- G01—MEASURING; TESTING
- G01N—INVESTIGATING OR ANALYSING MATERIALS BY DETERMINING THEIR CHEMICAL OR PHYSICAL PROPERTIES
- G01N29/00—Investigating or analysing materials by the use of ultrasonic, sonic or infrasonic waves; Visualisation of the interior of objects by transmitting ultrasonic or sonic waves through the object
- G01N29/44—Processing the detected response signal, e.g. electronic circuits specially adapted therefor
- G01N29/4481—Neural networks
-
- G—PHYSICS
- G06—COMPUTING; CALCULATING OR COUNTING
- G06N—COMPUTING ARRANGEMENTS BASED ON SPECIFIC COMPUTATIONAL MODELS
- G06N20/00—Machine learning
-
- G—PHYSICS
- G16—INFORMATION AND COMMUNICATION TECHNOLOGY [ICT] SPECIALLY ADAPTED FOR SPECIFIC APPLICATION FIELDS
- G16C—COMPUTATIONAL CHEMISTRY; CHEMOINFORMATICS; COMPUTATIONAL MATERIALS SCIENCE
- G16C20/00—Chemoinformatics, i.e. ICT specially adapted for the handling of physicochemical or structural data of chemical particles, elements, compounds or mixtures
- G16C20/20—Identification of molecular entities, parts thereof or of chemical compositions
-
- G—PHYSICS
- G16—INFORMATION AND COMMUNICATION TECHNOLOGY [ICT] SPECIALLY ADAPTED FOR SPECIFIC APPLICATION FIELDS
- G16C—COMPUTATIONAL CHEMISTRY; CHEMOINFORMATICS; COMPUTATIONAL MATERIALS SCIENCE
- G16C20/00—Chemoinformatics, i.e. ICT specially adapted for the handling of physicochemical or structural data of chemical particles, elements, compounds or mixtures
- G16C20/50—Molecular design, e.g. of drugs
-
- G—PHYSICS
- G16—INFORMATION AND COMMUNICATION TECHNOLOGY [ICT] SPECIALLY ADAPTED FOR SPECIFIC APPLICATION FIELDS
- G16C—COMPUTATIONAL CHEMISTRY; CHEMOINFORMATICS; COMPUTATIONAL MATERIALS SCIENCE
- G16C20/00—Chemoinformatics, i.e. ICT specially adapted for the handling of physicochemical or structural data of chemical particles, elements, compounds or mixtures
- G16C20/80—Data visualisation
-
- G—PHYSICS
- G01—MEASURING; TESTING
- G01N—INVESTIGATING OR ANALYSING MATERIALS BY DETERMINING THEIR CHEMICAL OR PHYSICAL PROPERTIES
- G01N1/00—Sampling; Preparing specimens for investigation
- G01N1/02—Devices for withdrawing samples
- G01N1/10—Devices for withdrawing samples in the liquid or fluent state
- G01N2001/1087—Categories of sampling
- G01N2001/1093—Composite sampling; Cumulative sampling
-
- G—PHYSICS
- G01—MEASURING; TESTING
- G01N—INVESTIGATING OR ANALYSING MATERIALS BY DETERMINING THEIR CHEMICAL OR PHYSICAL PROPERTIES
- G01N2291/00—Indexing codes associated with group G01N29/00
- G01N2291/02—Indexing codes associated with the analysed material
- G01N2291/021—Gases
- G01N2291/0215—Mixtures of three or more gases, e.g. air
-
- G—PHYSICS
- G01—MEASURING; TESTING
- G01N—INVESTIGATING OR ANALYSING MATERIALS BY DETERMINING THEIR CHEMICAL OR PHYSICAL PROPERTIES
- G01N2291/00—Indexing codes associated with group G01N29/00
- G01N2291/02—Indexing codes associated with the analysed material
- G01N2291/025—Change of phase or condition
- G01N2291/0255—(Bio)chemical reactions, e.g. on biosensors
-
- G—PHYSICS
- G01—MEASURING; TESTING
- G01N—INVESTIGATING OR ANALYSING MATERIALS BY DETERMINING THEIR CHEMICAL OR PHYSICAL PROPERTIES
- G01N2291/00—Indexing codes associated with group G01N29/00
- G01N2291/02—Indexing codes associated with the analysed material
- G01N2291/025—Change of phase or condition
- G01N2291/0256—Adsorption, desorption, surface mass change, e.g. on biosensors
-
- G—PHYSICS
- G01—MEASURING; TESTING
- G01N—INVESTIGATING OR ANALYSING MATERIALS BY DETERMINING THEIR CHEMICAL OR PHYSICAL PROPERTIES
- G01N2291/00—Indexing codes associated with group G01N29/00
- G01N2291/02—Indexing codes associated with the analysed material
- G01N2291/028—Material parameters
- G01N2291/02809—Concentration of a compound, e.g. measured by a surface mass change
-
- G—PHYSICS
- G16—INFORMATION AND COMMUNICATION TECHNOLOGY [ICT] SPECIALLY ADAPTED FOR SPECIFIC APPLICATION FIELDS
- G16C—COMPUTATIONAL CHEMISTRY; CHEMOINFORMATICS; COMPUTATIONAL MATERIALS SCIENCE
- G16C60/00—Computational materials science, i.e. ICT specially adapted for investigating the physical or chemical properties of materials or phenomena associated with their design, synthesis, processing, characterisation or utilisation
Definitions
- the present invention relates to a method and apparatus for estimating an estimation target value associated with a sample, and more particularly, to a method and apparatus for realizing this using machine learning.
- the estimation target value may be a physical quantity of the sample such as a concentration of a specific component contained in the sample, or may be an amount obtained by combining several physical quantities and other quantities, not a simple physical quantity. Alternatively, it may be some abstract or sensory amount associated with the sample.
- the signal is a signal in which signals based on a plurality of components are superimposed as a result of the chemical sensor responding to each of the plurality of components in the measured sample.
- odors are made up of thousands of chemicals with different concentrations, so it is still possible to extract specific information from odors, even though various analyzes based on odors have been conducted since ancient times. Have difficulty.
- Quantification is an important process in most analyses, and many methods have been developed over the centuries to accurately determine the values that are characteristic of the object being measured. Typical values to be obtained are, for example, volume, weight, density, concentration, etc., and many methods for measuring these values are currently available. However, many of these methods require that the measurement target component be a single component, and at least the measurement target component needs to be analyzed independently of other components. Therefore, it is possible to quantify each component by separating individual components from a complex mixture, usually using chromatography or the like.
- An object of the present invention is to perform quantitative analysis on a specific chemical substance from a measurement target sample that may contain a plurality of chemical substances even when a sensor that responds to the plurality of chemical substances is used. It is to make it easy to implement. More generally speaking, the subject of the present invention is to be able to estimate from the output of a chemical sensor an estimation object that may be a complex, abstract, or other indirect quantity that cannot be directly obtained from measurement of a sample. Is to make it.
- machine learning is performed on the relationship between the value of the estimation target and the corresponding output from the output from the chemical sensor for a plurality of samples whose specific estimation target values are known.
- a method for estimating an estimation target value associated with a sample is provided that estimates a specific estimation target value using the machine learning result based on an output from the chemical sensor for the unknown sample.
- the output to be the learning target may be a value at a time point selected from among all the outputs.
- the output to be learned may be a group of values obtained by performing a predetermined calculation using the output.
- you may use the some chemical sensor from which the response with respect to at least one part of the component which can be contained in the said unknown sample mutually differs as said chemical sensor.
- the amount of the sample given to the chemical sensor may be varied over time.
- the temporal variation may be a periodic variation.
- the estimation target may be a physical quantity of the sample.
- the physical quantity may be a concentration of a specific component in the sample.
- various samples to be estimated from chemical sensor output can be obtained, for example, by analyzing a sample that may contain a plurality of chemical substances and easily measuring and estimating the amount of a specific component contained therein. Can be estimated.
- FIG. 11A to 11D It is a figure which shows the FT-IR spectrum of four types of nanoparticles (Aminopropyl-STNPs, (Vinyl-STNPs), (C18-STNPs), (Phenyl-STNPs)) used in the Example of this invention. It is a SEM image of four types of nanoparticles used in the example of the present invention. It is a figure which shows the tendency of the affinity of four types of nanoparticles used in the Example of this invention. In the figure, the normalized output was defined based on the signal strength of the third response cycle in FIGS. 11A to 11D. The reason why the first and second responses are omitted is that a certain amount of time needs to elapse to obtain a stable and reproducible response. FIG.
- FIG. 6 shows a Principal Component Analysis (PCA) plot that identifies 15 chemicals using a nanoparticle-coated MSS.
- PCA Principal Component Analysis
- Numerical values indicating the combination of parameters are expressed in decimal numbers from 1 to 15, but each bit position when this numerical value is expressed in 4-bit binary numbers It indicates whether or not each parameter is used in the combination. That is, if the bit position of the first digit is 0, parameter 1 is not used and if it is 1, it is used. With respect to the bit positions of the second digit to the fourth digit, whether or not parameters 2 to 4 are used is similarly expressed. Since no parameter 1 to 4 is used, no numerical value indicating a combination of parameters will be 0. For example, if the numerical value indicating the combination of parameters is 10, this is represented as 1010 in binary. Therefore, only parameter 2 and parameter 4 are used in this combination.
- the lower diagram shows a parity plot of the predicted alcohol concentration (vertical axis, expressed as Prediction%) vs. actual alcohol concentration (horizontal axis, expressed as Real%) in an atmospheric environment.
- the small gray circle represents the known sake used to train the machine learning model. Black small circles represent unknown liquors (red wine (12%), potato shochu (25%), whiskey (40%)). Predicted alcohol concentration (Prediction%) vs. actual alcohol concentration (Real%) in the atmospheric environment when using Phenyl-STNPs parameter 3, polysulfone parameter 4 and polycaprolactone parameters 1 and 3 It is a figure which shows the parity plot of.
- the small gray circle represents the known sake used to train the machine learning model.
- Black small circles represent unknown liquors (red wine (12%), potato shochu (25%), whiskey (40%)). It is the optical microscope image of MSS each coat
- each graph in the figure is 0, 20, 40, 60, 80, 100, 120 on the horizontal axis, and the numerical values on the vertical axis are -1, 0, 1, 2, 3, 4, 5. It is a figure which shows the response of Phenyl-STNPs nanoparticle coating
- the horizontal axis of each graph in the figure is 0, 20, 40, 60, 80, 100, 120 on the horizontal axis, and the numerical values on the vertical axis are -0.5, 0, 0.5, 1.. 0, 1.5, and 2.0.
- FIG. 13 is a diagram showing a liquid sample corresponding to each of the 35 graphs in FIGS. 12A to 12D.
- Water is a diagram showing the response of an N 2 environment of aqueous EtOH, Aminopropyl-STNPs nanoparticles coated MSS for 21 kinds of liquid samples of liquor and the like.
- Water is a diagram showing the response of an N 2 environment of 21 kinds of Vinyl-STNPs nanoparticles coated MSS for liquid samples such as aqueous EtOH, liquor.
- Water is a diagram showing the response of an N 2 environment of C18-STNPs nanoparticles coated MSS for 21 kinds of liquid samples, such as aqueous EtOH, liquor.
- Water is a diagram showing the response of an N 2 environment of aqueous EtOH, Phenyl-STNPs nanoparticles coated MSS for 21 kinds of liquid samples of liquor and the like.
- FIG. 14 is a view showing a liquid sample corresponding to each of the 21 graphs in FIGS. 13A to 13D.
- Water is a diagram showing the response of an N 2 environment of Polysulfone coating MSS for 21 kinds of liquid samples, such as aqueous EtOH, liquor.
- Water is a diagram showing the response of an N 2 environment of Polycaprolactone-coated MSS for 21 kinds of liquid samples, such as aqueous EtOH, liquor. It is a figure which shows the liquid sample corresponding to each of 21 graphs in FIG. 14A and 14B. It is a figure which shows the response of Polysulfone coating
- FIG. 16A and 16B It is a figure which shows the response of Polycaprolactone coating
- the upper diagram shows the dependence of the prediction error on the combination of the four parameters extracted from the signal in the atmospheric environment. The definition of the decimal number indicating the combination of parameters is the same as in FIG.
- the lower diagram shows a parity plot of predicted alcohol concentration versus actual alcohol concentration in an atmospheric environment.
- the small gray circle represents the known sake used to train the machine learning model.
- Black small circles represent unknown liquors (red wine (12%), potato shochu (25%), whiskey (40%)).
- the notation of the vertical axis and the horizontal axis is the same as in FIG. Is a diagram showing an alcohol concentration dependence of parameters extracted from the measured signal under conditions in N 2.
- the upper figure is a diagram showing the dependence of the prediction errors to a combination of the four parameters extracted from the signal in an environment in N 2.
- the definition of the decimal number indicating the combination of parameters is the same as in FIG.
- the lower diagram shows a parity plot of predicted alcohol concentration versus actual alcohol concentration in an N 2 environment.
- the small gray circle represents the known sake used to train the machine learning model.
- Black small circles represent unknown liquors (red wine (12%), potato shochu (25%), whiskey (40%)).
- the notation of the vertical axis and the horizontal axis is the same as in FIG.
- the concentration of the chemical substance and the sample based on response signals from the chemical sensor to a plurality of samples whose estimation targets are known such as the concentration of a specific component (hereinafter also referred to as a chemical substance).
- Machine learning is performed on the relationship between the response signal and the response signal.
- a sample (unknown sample) for which the concentration of a specific chemical substance is desired is given to the chemical sensor, and the concentration of the unknown sample is estimated from the response signal to the chemical sensor based on the result of the machine learning.
- the present invention is not limited to the estimation of concentration, but can be used for estimation of an arbitrary estimation target value correlated with the output of the chemical sensor.
- This estimation target may be a physical quantity other than the concentration of a specific component, or may be any estimation target that is more complex, abstract, or sensory.
- a substance such as gas or liquid released from a living body with a chemical sensor and taking in an evaluation value of the health state of the living body and performing machine learning
- the health state from the substance released by an unknown living body Can be estimated. Even if it is not a living body, it can automatically estimate and evaluate the state of the machine comprehensively by machine learning of the measurement output of chemical emissions from machines such as internal combustion engines and the normality of the operating state of the machine. You can also.
- the above-mentioned known and unknown samples are given to a plurality of chemical sensors having different responses to various chemical substances, and learning is performed based on the response signals from them to perform a more accurate estimation. You can also.
- machine learning may be performed on the entire response signal from the chemical sensor.
- the amount of data to be processed becomes enormous. Therefore, instead of subjecting the entire response signal to machine learning, only the portion of the response signal with a large amount of information (characteristic in the sense that it varies greatly depending on the difference in the sample), or in addition to these, If machine learning is performed by selecting a reference part for obtaining a value, the amount of calculation can be greatly reduced without substantially reducing the accuracy of machine learning.
- machine learning may be performed based on a group of values obtained by performing a predetermined calculation between them instead of the selected portion itself as described above. As used herein, “a group of values obtained by performing a predetermined calculation” is not limited to this.
- the signal slope, differential value, integral value, response time, or a specific function is used for fitting.
- Values, values obtained through various transformations such as Fourier transform, or values calculated using signals from different channels, signals from other sensors, and the like can be mentioned.
- values features / explanatory variables
- a sample to be measured and a carrier gas (of course, the sample is a liquid instead of a gas)
- the case of gas is used, but the following explanation is given for the case of gas, but the generality is switched alternately in the form of a rectangular wave, and based on the machine learning and the result based on the response signal Estimation was performed.
- the response signal in this case is basically a periodic signal, several points can be selected by selecting characteristic points within each period and combining the values of those points and their occurrence times as necessary. Parameters were obtained and machine learning was performed based on these parameters.
- the selection method is not intended to be limited to those described in the embodiments, and a suitable location is appropriately selected according to the sample supply mode to the chemical sensor, the characteristics of the chemical sensor used, and the like. be able to.
- the flow rate of the sample applied to the chemical sensor is changed over time.
- the dynamic behavior of the chemical sensor with respect to the chemical substance to be detected in the sample can be detected.
- sufficient information can be obtained only by detecting a relatively static behavior of the chemical sensor, it is not always necessary to perform alternate switching or the like.
- a chemical sensor is a kind of nanomechanical sensor, and a sensitive film (also referred to as a receptor layer) applied on a film-like portion on the surface of the sensor element and supported at a plurality of surrounding positions is supplied.
- a sensitive film also referred to as a receptor layer
- MESF Membrane-type MSSurface ⁇ ⁇ ⁇ Stress Sensor
- Patent Document 1 Non-Patent Document 2
- the MSS is used here because it has useful features such as high sensitivity and high stability compared to the cantilever-like sensor element that has been proposed before.
- MSS response is determined by the interaction between the sample (various chemical substances in the sample) and the receptor layer (adsorption / desorption of the sample, and associated expansion / contraction of the receptor layer).
- this expansion / contraction differs depending on the chemical substance adsorbed / desorbed to / from the receptor layer, and that this difference varies depending on the material / structure, etc. of the receptor layer.
- a sample containing many kinds of (and often unknown) chemical substances by using a collection of a plurality of MSSs (hereinafter sometimes referred to as sensor arrays) and combining it with machine learning.
- concentration of a specific chemical substance can be quantitatively measured.
- concentration of alcohol in liquor is taken, and from the gas obtained by evaporation from these liquid samples (hereinafter often referred to as “odor”), Estimate alcohol concentration.
- these samples and chemical substances to be measured are merely examples, and it is obvious that various other types of samples and chemical substances can be arbitrarily selected.
- silica / titania composite nanoparticles with various surface functionalization Hydrolysis and co-condensation of two alkoxides, titanium tetraisopropoxide (TTIP) and various silane coupling reagents combined with a multi-step microfluidic approach. reaction) (detailed later), silica / titania composite nanoparticles (NPs) (hereinafter also simply referred to as nanoparticles) having various surface functionalizations were produced.
- TTIP titanium tetraisopropoxide
- NPs silica / titania composite nanoparticles having various surface functionalizations
- FT-IR spectra of two characteristic absorption in 1406Cm -1 and 1600 cm -1 of the nanoparticles modified with vinyl groups (Vinyl-STNPs) Indicates a band.
- the FT-IR spectrum of nanoparticles modified with octadecyl groups (C18-STNPs) showed very strong absorption at 2848 cm ⁇ 1 and 2916 cm ⁇ 1 . These can be attributed to the C—H stretching vibration of the octadecyl group.
- one absorption band appearing at 1430 cm -1 and 738cm -1 is due phenyl group that is covalently bonded to Si, 1954nm -1, 1571nm -1, 1490cm -1, 1067cm -1, 1027cm -
- the absorption bands appearing at 1 and 694 cm ⁇ 1 are due to the various vibration modes of the phenyl group itself.
- the FT-IR spectrum shown in FIG. 1 is in good agreement with that previously reported in Non-Patent Document 2, and the aminopropyl groups are appropriately It shows that it has become functional.
- nanoparticles From the SEM image shown in FIG. 2, it can be seen that the average size of these four types of nanoparticles is several tens of nanometers, and therefore it is legitimate to call them nanoparticles (NPs). Their size distribution is sufficiently narrow and it can be concluded that by-products are not formed by uniform nucleation and subsequent growth associated with the reaction of TTIP with the silane coupling reagent. This indicates that functionalized NPs were formed by coprecipitation of silane-based functional groups with titania.
- the nanoparticles functionalized with functional groups used here are expressed as [functional group name] -STNPs (Aminopropyl-STNPs etc.) as mentioned above.
- the detection performance of nanoparticle-coated MSS under atmospheric environment was examined by measuring 15 types of chemical substances.
- the sensor array used here was composed of four MSSs.
- the MSS in the sensor array may be referred to as a channel.
- These chemicals can be roughly classified into the following six categories: water-based substances (ultra pure water, formalin (represented as Ultrapure water (or Water) and Formaline in the figure)), alkanes (hexane, heptane, respectively) , Octane (represented as Hexane, Heptane, Octane in the figure), alcohol (methanol, ethanol, isopropanol (represented as Methanol (or MeOH), Ethanol (or EtOH), Isopropanol (or IPA), respectively)) , Aromatic (benzene, toluene, xylene (represented as Benzene, Toluene, Xylene in the figure)), ketone (acetone, 2-butanone (represented as Acetone
- the four channels responded to these chemicals in different ways.
- These response signal trends can be interpreted based on the expected properties of the nanoparticles used in each channel.
- Aminopropyl-STNPs and Phenyl-STNPs responded well to water-based substances and alcohol, while C18-STNPs and Pheni--STNPs responded well to aromatic compounds.
- C18-STNPs showed the highest affinity for alkanes, as can be imagined from their structural similarities.
- PCA principal component analysis
- a sensor array with various functionalized channels can identify a large number of chemicals simply by extracting simple parameters from the measured response signal (details will be described later with reference to FIG. 6). I was able to. This is because a sensor array having a plurality of channels that exhibit different responses to a plurality of types of chemical substances as described above can derive quantitative information from a sample having a complex composition such as an odor. It means that it can be a good tool.
- the odors of various alcoholic beverages that is, the steam generated from them is taken up as an example of a machine learning (ML) model. Specifically, a large number of training data was collected and machine learning was performed, and based on this, the alcohol concentration of an unknown liquor was estimated.
- ML machine learning
- the odors of 35 kinds of liquid samples are measured, and the responses of the sensor array having channels with the four kinds of nanoparticles coated thereon are obtained. As shown in FIGS. 12A to 12D, these responses are It was confirmed that the shape and strength were different from each other.
- liquids of 35 types commercially available alcoholic beverages, non-alcoholic beverages, and those obtained by simply mixing water and ethyl alcohol (EtOH) were used.
- EtOH ethyl alcohol
- the response waveforms do not become the same even when liquid samples having the same alcohol concentration (for example, 40%) are compared. From these results, it can be seen that it is almost impossible to determine the alcohol concentration directly from these measurement signals.
- Non-patent Document 3 when the system to be measured contains more than three components, it has been reported that it is actually difficult to determine the concentration of the components (Non-patent Document 3). Therefore, instead of analytically obtaining the concentration of the specific component from the response signal, the machine learning technique is used to learn the phase between the response signals with respect to the alcohol concentration. Thus, a machine learning model for estimating the alcohol concentration of the liquor from the signal measured by the sensor array was constructed.
- KRR kernel ridge regression
- a, b, c, d, e, t a , t b , t c and t d are sensors that switch between odor (steam) and a reference gas (air or N 2 ) at a predetermined cycle.
- there are multiple peaks within each signal the different values of t a of the respective peaks.
- parameter 1 relates to the adsorption process of the substance to be measured, while parameter 3 includes information on the desorption process.
- Parameter 2 was defined as the slope during the adsorption / desorption process, which is considered the quasi-equilibrium state that adsorption is trying to stabilize. That is, depending on the combination of the receptor and the analyte molecule, this cannot be said to be an equilibrium, but in associating the adsorption parameter 3 with desorption, the state of a gradual change between the parameter 1 and the parameter 3 is defined as a quasi-equilibrium.
- Parameter 4 was defined as the maximum height obtained from the curve of each response signal cycle, which reflects the adsorption capacity of the receptor layer.
- FIG. 7 shows the dependency of parameters extracted from 35 types of liquor signals (details of the measurement method will be described later) on the alcohol concentration measured by the sensor array using the above four types of nanoparticles. Specific names of these 35 kinds of liquors will be described later.
- alcoholic beverages liquids such as tap water that do not contain alcohol, or liquids that contain alcohol but are not normally considered alcoholic beverages (specifically, Note that it also includes alcohol that is simply diluted with water.
- KRR KRR was performed using these extracted parameters. Training a machine learning model to predict the alcohol concentration of alcoholic beverages for all combinations of four parameters when using each receptor layer material (in this application, “predict” means “estimate”) Went.
- the upper four graphs in FIG. 8 show the prediction error ⁇ depending on the combination of parameters when the 24-division cross-validation is performed. Table 1 below summarizes the optimum value of the prediction error and the optimum combination of parameters (shown as optimum in the graph for each upper receptor layer material in FIG. 8) for each receptor layer material.
- a parity plot of predicted alcohol concentration versus actual alcohol concentration using the optimal combination of parameters is shown in the lower graph of FIG.
- a small gray circle represents a known liquor used for training the machine learning model
- a small black circle is an unknown liquor (here, red wine, shochu liquor, and whiskey).
- C18-STNPs or Phenyl-STPNs were used as the receptor layer material, but the prediction error was much larger for Aminopropyl-STNPs and Vinyl-STNPs. It was. Judging from these results, it is considered important to use a hydrophobic receptor layer material in order to predict the alcohol concentration of alcoholic beverages.
- the receptor layer material can be selected according to the object of prediction by using machine learning and evaluating the prediction error. As described below with reference to FIGS. 13A-13D (when nanoparticle receptor layer is used) and FIGS. 14A and 14B (when polymer receptor layer is used), the same results under N 2 environment Please note that I confirmed.
- FIG. 9 shows a parity plot of predicted alcohol concentration versus actual alcohol concentration when using the optimal combination.
- gray small circles indicate known liquors used for machine learning
- black small circles indicate unknown liquors. From this, it can be seen that the prediction by the machine learning model was successfully performed with high accuracy not only for known liquors but also for unknown liquors. This fact indicates that machine learning is one of powerful tools for deriving the amount of an object to be measured from a plurality of signals obtained by measurement using a chemical sensor represented by MSS.
- Table 2 Appearance rate of each parameter in the top 100 parameter combinations when using 4 channels
- the prediction error ⁇ due to the combination of the top 100 was distributed between 0.4315 and 0.5735. From this table, it can be seen that the appearance rate of parameter 2 is small except in the case of polysulfone. The correlation of parameter 2 to the alcohol concentration was shown only for polysulfone, as will be described later. Furthermore, the appearance rate of parameter 3 is larger than the appearance rate of parameter 1 in the case of C18-STNPs and Phenyl-STNPs, but the opposite result is obtained in the case of polysulfone and polycaprolactone. These results suggest that the nanoparticle coating here draws more information from the desorption process than the adsorption process, whereas these polymers show the opposite trend.
- delayed desorption should provide more information in the form of parameter 3.
- a polymer since it has a dense structure as compared with a polymer nanoparticle-based porous structure, both sorption and desorption require a longer time. Therefore, useful information for prediction was obtained from both parameter 1 and parameter 3.
- the interaction between the receptor layer coating and the adsorbate also affects the results in question.
- * 1 to * 3 in the table are as follows: * 1 Aminopropyl-STNPs-> APTES Vinyl-STNPs-> TEVS C18-STNPs-> ODTES Phenyl-STNPs-> TMPS
- solution A to solution D are individually perfluoroalkoxyalkane (PFA) tubes (inner diameter 1.0 mm, outer diameter 1/16 inch, YMC Corporation product) ) At 10 mL / min.
- PFA perfluoroalkoxyalkane
- PTFE Polytetrafluoroethylene
- KeyChem mixer product of YMC Co., Ltd., whose cross-sectional area of the flow path is about 1 mm 2
- the resulting two reaction solutions, solution A + B and solution C + D were mixed in the second fluid path immediately after these two fluid paths.
- the first and second fluid paths were connected by a 10 cm PFA tube.
- the four mixed solutions A to D were added to solution E under magnetic stirring by flowing through a 70 cm long PFA tube. After the addition, the final reaction was aged at room temperature for 24 hours. Finally, a slightly turbid dispersion was obtained.
- FT-IR Fourier transform infrared spectra
- Scanning electron microscope (SEM) images were obtained at an acceleration voltage of 10 kV using a Hitachi Ultra-high Resolution Scanning Electron Microscope SU8000. Prior to each measurement, the sample was coated with a few nm thick platinum.
- the dispersion was taken into a syringe, and was passed through a PTFE tube at a flow rate of 3 mL / min using a syringe pump (YSP-201, a product of YMC Co., Ltd.).
- the dispersion was introduced into the spray nozzle to form uniform microdroplets using two types of carrier air (atomizing air: 0.030 MPa, patterning air: 0.030 MPa).
- a sensor array having four MSSs was mounted on the stage. This stage was heated to about 100 ° C. to quickly evaporate the microdroplets.
- the stage was moved back and forth, while the spray nozzle was also moved from left to right at a pitch of 0.3 mm at 15 mm / min.
- the distance between the spray nozzle and the stage was set to 100 mm.
- This coating process was repeated to obtain a coating thickness of approximately 1 ⁇ m.
- a mask was used to cover the other three channels while coating one channel.
- n-heptane, n-octane, n-nonane, n-decane, n-undecane, n-dodecane Nacalai Tesque Purchased from Co., Ltd.
- ⁇ 1,2-dichlorobenzene, acetone Sigma Purchased from Aldrich Japan
- GK ⁇ 1,3-dichlorobenzene d Purchased from Aldrich Inc. All of these were used as purchased.
- alcohol content meaning ethanol volume concentration
- a mixture of water and ethyl alcohol having various concentrations are 95: 5, 90:10, 85:15, 80:20, 75:25, 70:30, 65:35, 60:40). And 55:45) (95/5 Water / EtOH, 90/10 Water / EtOH, 85/15 Water / EtOH, 80/20 Water / EtOH, 75/25 Water / EtOH, 70/30 Water / EtOH, 65/35 Water / EtOH, 60/40 Water / EtOH, and 55/45 Water / EtOH) were used.
- the other end of the PTFE tube was connected to a piezoelectric pump so that the sample vapor could be drawn from the head space.
- the other hollow needle connected with another PTFE tube having the other end opened in the air was pierced into the head space so that the fluid flowed smoothly.
- the sample introduction-purging cycle was repeated. This cycle was repeated 5 times.
- -1V was supplied to the MSS as a bridge voltage and output was obtained from the MSS (as is well known, four piezoresistive elements were provided to detect surface stress on the MSS, and these The elements are bridge-connected, and a bridge voltage is supplied between two opposing terminals of the bridge, and a voltage generated between the remaining two terminals is used as a detection output. (See 1 etc.). The output voltage from the MSS was sampled at 20 Hz. All experiments were conducted under atmospheric conditions where temperature and humidity were not controlled.
- Kernel Gilley Regression Kernel Ridge Regression is a powerful machine learning technique for predicting unknown data from a known data set. Since KRR itself is a matter well known to those skilled in the art, a detailed description thereof will be omitted, but the process of machine learning in the present embodiment using KRR will be described below.
- Alcohol concentration of an unknown liquor with (this parameter is determined from a signal measuring the smell of an unknown liquor)
- ⁇ and ⁇ are hyperparameters that should be given before analysis.
- the prediction ability depends strongly on the value of the hyperparameter.
- Cross validation Cross validation is used here to determine the values of the hyperparameters ⁇ and ⁇ in the KRR. Since cross-validation is also a matter well known to those skilled in the art, details thereof will not be described here, but simply put, some data is removed from the data set before training and the removed data is referred to as test data. It is considered to be used for verification of prediction. The cross-validation error is estimated as representing the prediction error, and the hyperparameter value is evaluated so as to minimize the cross-validation error. Below, the procedure of S division
- a data set D consisting of N data is randomly divided into S data subsets.
- D s 1,..., S
- N / S the number of data in each data subset
- One of the S data subsets is considered as test data and the remaining S-1 data subsets are used as training data.
- KRR is performed by giving various ⁇ and ⁇ , and parameters
- Polymer receptor layer material As the receptor layer material, as described above, a polymer and other materials can be used as well as materials other than nanoparticles. Here, additional data is shown for the case of using two previously mentioned polymers, namely polysulfone and polycaprolactone.
- FIG. 17A shows the alcohol concentration dependency of parameters extracted from signals obtained by measuring 35 kinds of alcohol by MSS when polysulfone and polycaprolactone are used as the receptor layer material. In this case, a certain degree of correlation was confirmed between all parameters 1 to 4 and the alcohol concentration.
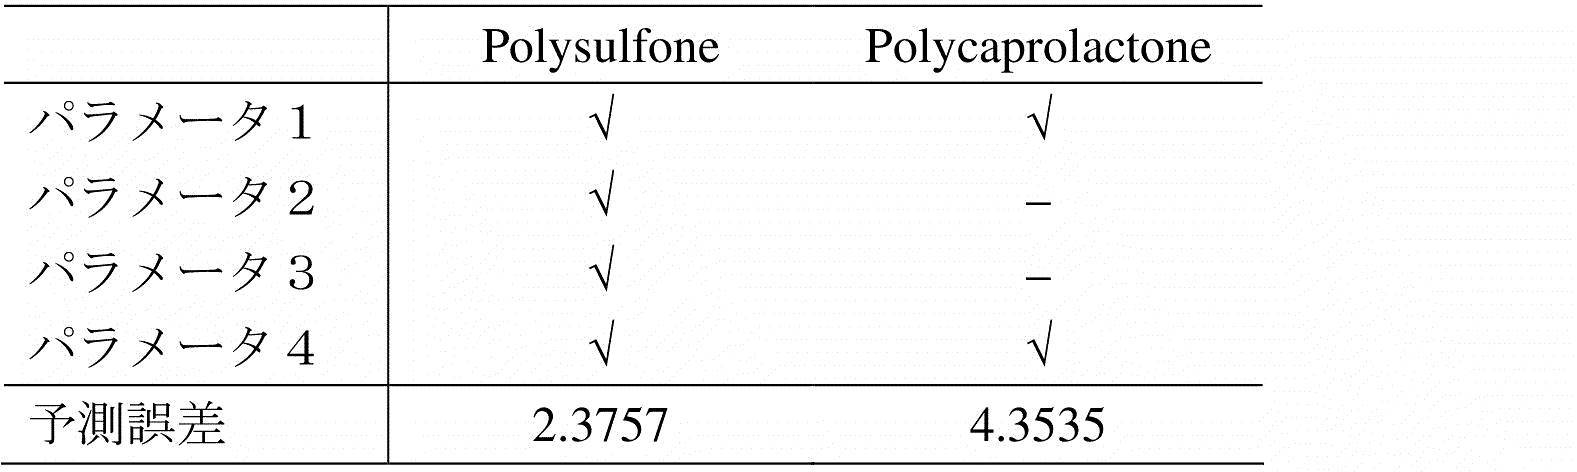
- FIG. 17B and Table 4 show the training results under atmospheric conditions when polysulfone and polycaprolactone are used as the receptor layer material. Here, all the various settings were completely the same as in the case of nanoparticles. For known alcoholic beverages, the machine learning model gave good results with any receptor layer.
- N 2 environment The description so far has been based on the behavior of the receptor layer in the atmosphere, but here, the results of prediction by machine learning when an experiment is performed in N 2 instead of the atmosphere are shown.
- FIG. 18A shows 21 types of sake by MSS using the four types of nanoparticle receptor layer materials used in the above examples, namely Aminopropyl-STNPs, Vinyl-STNPs, C18-STNPs, and Pheni-STNPs.
- the dependence of the parameter extracted from the measured signal on the alcohol concentration is shown.
- FIG. 18A A certain degree of correlation with the alcohol concentration was confirmed for all parameters other than parameter 2.
- FIG. 18B and Table 5 show training in an N 2 environment when Aminopropyl-STNPs, Vinyl-STNPs, C18-STNPs, and Pheni-STNPs are used as receptor layer materials. The settings here were exactly the same as those under atmospheric conditions. For known liquors, machine learning models gave good results when the receptor layer material was C18-STNPs or Pheni-STNPs, but in the case of Aminopropyl-STNPs or Vinyl-STNPs As in the case of, a considerably large prediction error was shown.
- FIG. 18C shows the alcohol concentration dependency of parameters extracted from signals obtained by measuring 21 kinds of alcohol by MSS when polysulfone and polycaprolactone are used as the receptor layer material. In this case as well, a certain degree of correlation was confirmed between all parameters 1 to 4 and the alcohol concentration.
- FIG. 18D and Table 6 show the training results under N 2 conditions when polysulfone and polycaprolactone are used as the receptor layer material. Here, all the various settings were completely the same as in the atmosphere. For known liquors, the machine learning model gave good results with any receptor layer.
- the application field of the present invention is of course not limited to odor quantitative analysis, and a specific component is quantitatively analyzed from a gas or liquid in which a plurality of components are mixed or possibly mixed. It can be used anywhere that is useful to detect. For example, by using the present invention for a device that quantitatively analyzes exhaled breath, sweat, saliva, tears, any other body fluid, gas emitted from the body, smell, etc., it can be used for diagnosis and screening of diseases. .
- the present invention is expected to be widely used in all fields in which the above-described quantitative detection / analysis is useful, such as food production, storage, distribution, security, and pharmaceutical fields.
Landscapes
- Physics & Mathematics (AREA)
- Chemical & Material Sciences (AREA)
- Engineering & Computer Science (AREA)
- Life Sciences & Earth Sciences (AREA)
- General Health & Medical Sciences (AREA)
- Health & Medical Sciences (AREA)
- General Physics & Mathematics (AREA)
- Pathology (AREA)
- Immunology (AREA)
- Biochemistry (AREA)
- Analytical Chemistry (AREA)
- Theoretical Computer Science (AREA)
- Bioinformatics & Cheminformatics (AREA)
- Computing Systems (AREA)
- Bioinformatics & Computational Biology (AREA)
- Crystallography & Structural Chemistry (AREA)
- Artificial Intelligence (AREA)
- Data Mining & Analysis (AREA)
- Evolutionary Computation (AREA)
- Acoustics & Sound (AREA)
- Software Systems (AREA)
- Computer Vision & Pattern Recognition (AREA)
- Medical Informatics (AREA)
- Spectroscopy & Molecular Physics (AREA)
- Signal Processing (AREA)
- Databases & Information Systems (AREA)
- Medicinal Chemistry (AREA)
- Pharmacology & Pharmacy (AREA)
- General Engineering & Computer Science (AREA)
- Mathematical Physics (AREA)
- Other Investigation Or Analysis Of Materials By Electrical Means (AREA)
Abstract
特定の推定対象の値が既知の複数の試料に対する化学センサからの出力から、推定対象の値とそれに対応する出力との関係を機械学習し、与えられた未知の試料に対する化学センサからの出力に基づいて、この機械学習結果を使用して特定の推定対象の値を推定することにより、試料に対応付けられた推定対象値を推定する方法及び装置を提供する。
Description
本発明は試料に対応付けられた推定対象値を推定する方法及び装置に関し、特に機械学習を利用してこれを実現する方法及び装置に関する。ここで、推定対象値とは試料中に含まれる特定の成分の濃度等の試料の物理量でもよいし、あるいは単純な物理量ではなく、いくつかの物理量その他の量を複合させた量でもよい。あるいは、試料に対応付けられる何らかの抽象的であったり感覚的であったりする量であってもよい。
膜型表面応力センサ(MSS)(特許文献1)等の化学センサ及び各種の化学物質を吸着することなどによりその物理量が変化する受容体の開発の進展によって、多様な化学物質の検出等が容易に実現できるようになってきた。
しかし、自然界に存在するか人工的につくられたものであるかを問わず、大部分の分析対象は複数の、またしばしば非常に多くの種類の成分を含んでおり、従って化学センサから得られる信号は、多くの場合は、測定された試料中の複数の成分のそれぞれに化学センサが応答したことにより、複数の成分に基づいた信号が重畳したものになっている。例えば、においはそれぞれ濃度が異なる数千もの化学物質からなり、従って古代から今に至るまでにおいに基づく様々な解析が行なわれてきたにもかかわらず、においから特定の情報を抽出することは依然として困難である。
定量化は大部分の分析において重要なプロセスであり、測定対象の特徴である値を正確に求めるための多くの方法が数世紀にわたって開発されてきた。求められる値としては例えば体積、重量、密度、濃度等が代表的なものであり、現在、これらの値を測定するための多数の手法が利用可能である。しかし、それらの手法の多くは、測定対象が単一の成分である必要があるなど、少なくとも測定対象成分は他の成分とは独立して分析できる必要がある。そのため、通常はクロマトグラフィーなどを使用して、複雑な混合物から個々の成分を分離することで、各成分の定量化ができるようにしている。
しかしながら、このような方法では、複数の種類の化学物質に対して応答する特性を有するセンサを使用して、多数の成分を含有する試料の分析を行うには、先ず検出すべき成分を試料から単離し、次にそれをセンサに供給するという複数段階の処理が必要となり、分析に長時間を要する上に、単離のためのクロマトグラフィー装置等の高価な機器が必要となり、更には試料の得られる現場やその近くで分析を行うという要求に対応するのが困難な場合が多いなどの問題がある。
G. Yoshikawa, T. Akiyama, S. Gautsch, P. Vettiger, and H. Rohrer, "Nanomechanical Membrane-type Surface Stress Sensor" Nano Letters 11, 1044-1048 (2011).
Shiba, K., Sugiyama, T., Takei, T. & Yoshikawa, G. Controlled growth of silica-titania hybrid functional nanoparticles through a multistep microfluidic approach. Chem. Commun. 51, 15854-15857, doi:10.1039/C5CC07230A (2015).
Hsieh, M.-D. & Zellers, E. T. Limits of Recognition for Simple Vapor Mixtures Determined with a Microsensor Array. Anal. Chem. 76, 1885-1895, doi:10.1021/ac035294w (2004).
Wang Yongwei, Jun Wang, Bo Zhou, Qiujun Lu, "Monitoring storage time and quality attribute of egg based on electronic nose" Analytica Chimica Acta 650 (2009) 183-188.
N. El Barbri, J. Mirhisse, R. Ionescu, N. El Bari, X. Correig, B. Bouchikhi, E. Llobet, "An electronic nose system based on a micro-machined gas sensor array to assess the freshness of sardines" Sensors and Actuators B 141 (2009) 538-543.
本発明の課題は、複数の化学物質に対して応答するセンサを使用した場合であっても、複数の化学物質を含有する可能性のある測定対象試料から特定の化学物質に対して定量分析を簡単に実現できるようにすることにある。本発明の課題は、更に一般的に言えば、試料の測定から直接的に得られない複合的、抽象的、その他の間接的な量であってよい推定対象を化学センサの出力から推定できるようにすることにある。
本発明の一側面によれば、特定の推定対象の値が既知の複数の試料に対する化学センサからの出力から、前記推定対象の値とそれに対応する前記出力との関係を機械学習し、与えられた未知の試料に対する前記化学センサからの出力に基づいて、前記機械学習結果を使用して特定の推定対象の値を推定する、試料に対応付けられた推定対象値を推定する方法が与えられる。
ここで、前記学習の対象となる前記出力は、前記出力全体のうちから選択された時点の値であってよい。
また、前記学習の対象となる前記出力は、前記出力を用いて所定の演算を行って得られた一群の値であってよい。
また、前記化学センサとして、前記未知の試料に含まれ得る成分の少なくとも一部に対する応答が互いに異なる複数の化学センサを使用してよい。
また、前記試料が前記化学センサに対して与えられる量を時間的に変動させてよい。
また、前記時間的な変動は周期的な変動であってよい。
また、前記推定対象は前記試料の物理量であってよい。
また、前記物理量は前記試料中の特定成分の濃度であってよい。
本発明の他の側面によれば、試料が導入される化学センサを備え、上記いずれかの方法を用いて前記化学センサの応答から前記試料の推定対象の値を推定する、試料に対応付けられた推定対象値を推定する装置が与えられる。
本発明によれば、複数の化学物質を含む可能性のある試料を分析してそこに含まれる特定の成分の量の測定・推定を簡単に行う等、化学センサ出力から試料の多様な推定対象の値を推定することができる。
本発明の一形態では、例えば特定の成分(以下、化学物質とも称する)の濃度等の推定対象が既知の複数の試料に対する化学センサからの応答信号に基づいて、上記化学物質の濃度と当該試料に対する応答信号との間の関係について機械学習を行う。次に、特定の化学物質の濃度を求めたい試料(未知試料)を上記化学センサに与え、これに対する応答信号から、前記機械学習の結果に基づいて未知試料の濃度を推定する。また、本発明は濃度の推定に限定されるものではなく、化学センサの出力と相関する任意の推定対象の値の推定に利用できる。この推定対象としては特定の成分の濃度以外の物理量であってもよいし、さらにはより複合的、抽象的、感覚的である任意の推定対象であってよい。例えば、生体から放出される気体、液体等の物質を化学センサで測定する一方で当該生体の健康状態の評価値を取り込んで機械学習を行うことで、未知の生体が放出する物質からその健康状態を推定することができる。生体でなくとも、内燃機関等の機械の排出物の化学センサによる測定出力と、当該機械の動作状態の正常度とを機械学習すれば、機械の状態を総合的に自動的に推定・評価することもできる。感覚的な推定対象としては、においとその不快度を機械学習することで、におい評価のために訓練された人間なしで、各種の状況での悪臭の自動計測・評価を行うことも可能となる。以下では推定対象としてもっぱら試料中の特定成分の濃度に例を取って説明を行うが、これによって一般性を失うものでないことは当業者にとっては自明なことであろう。なお、機械学習一般の理論は情報処理分野、統計学分野で従来から多様な研究がおこなわれ、その成果も広く知られている。本願実施例では多様な機械学習についての非限定的な例としてカーネルリッジ回帰法(Kernel ridge regression)を使用して説明するが、当然ながら他の機械学習手法も適宜使用できる。
ここで、上述した既知及び未知の試料を、各種の化学物質に対する応答が互いに異なる複数の化学センサに与え、それらからの応答信号に基づいて学習を行うことで、より精度の高い推定を行うこともできる。
機械学習は原理的には化学センサからの応答信号全体に対して行ってよいが、多くの場合にはそれでは処理すべきデータ量が膨大なものになってしまう。そのため、応答信号全体を機械学習に供する代わりに、応答信号のうちの、情報量の多い(試料の違いに大きく変化するという意味で特徴的な)部分だけ、あるいはこれらに加えて、応答信号の値を求める際の基準となる部分を選択して機械学習すれば、機械学習の精度をほとんど低下させることなく、計算量を大幅に低減することができるようになる。また、上述のような選択された部分それ自体ではなく、それらの間で所定の演算を行って得られた一群の値に基づいて機械学習を行ってもよい。ここで言う「所定の演算を行って得られた一群の値」としては、これに限定するものではないが、例えばシグナルの傾きや微分値、積分値、応答時間や、特定の関数でフィッティングした値、フーリエ変換などの各種変換を介した値、あるいは、これらを異なるチャンネルからのシグナルや、別のセンサからのシグナルなどを用いて計算した値などが挙げられる。このように機械学習に供する値(特徴量・説明変数)としては、多種多様なものが利用可能であり、さらにそれらは「値」に限定されるものでは無く、各種の関数などを組み合わせた任意のモデルを利用しても良い。
応答信号のうちの特徴的な部分や基準となる部分の選択の具体例として、実施例では、複数の化学センサに対して測定対象の試料とキャリアガス(もちろん、試料が気体ではなく液体の場合には適宜選択された液体を使用する。以下では気体の場合について説明するが一般性を失うものではない)とを矩形波状に交互に切り換えて与え、その応答信号により機械学習及びその結果に基づく推定を行った。この場合の応答信号は基本的には周期信号となるため、各周期内で特徴的な点を選択し、それらの点の値、また必要に応じてその生起時刻を組み合わせることで、いくつかのパラメータを求め、これらのパラメータに基づいて機械学習を行った。もちろん、選択の手法を実施例に説明されているものに限定する意図はなく、化学センサへの試料供給の態様や、使用される化学センサの特性等に応じて、適宜好適な箇所を選択することができる。
化学センサに与えられる試料の流れを上述したように交互切り替えによって(あるいはこれ以外のやり方で試料の流れに任意の変化を与えることによって)、化学センサに与えられる試料の流量を時間的に変動させ、これによって試料中の検出対象の化学物質に対する化学センサの動的な挙動を検出することができる。あるいは、化学センサの比較的静的な挙動を検出するだけで十分な情報が得られるのであれば、必ずしも交互切り替え等を行わなくてもよい。
また、実施例では化学センサとして、ナノメカニカルセンサの一種であり、センサ素子表面であって周囲の複数個所を支持された膜状部上に塗布された感応膜(受容体層ともいう)が供給された試料を吸収し膨張することで発生する応力をピエゾ抵抗で検知することでセンサシグナルを得る膜型表面応力センサ(Membrane-type Surface Stress Sensor、MSS)(特許文献1、非特許文献2)を使用した。MSSはそれ以前に提案されていたカンチレバー状のセンサ素子に比べて高感度・高安定性などの有用な特徴を有することから、ここで使用したものである。
MSSの応答は、試料(試料中の各種の化学物質)と受容体層との相互作用(試料の吸着・脱着、及びそれに伴う受容体層の膨張・収縮など)により決まる。この膨張・収縮などが受容体層との間で吸着・脱着する化学物質により相違し、更にはこの相違が受容体層の材料・構造等により異なることを利用することで、上記機械学習結果に基づく推定が可能となる。なお、当然のことであるが、化学センサとしてMSS以外にも多くの種類が知られており、MSSに代えて、他の化学センサを適宜使用することもできる。更には、実施例ではMSSの受容体層として各種の官能基で修飾したナノ粒子を主に使用しているが、もちろん感応膜はこのような形態に限定されるものではなく、例えば粒子状物を含まないポリマー類などによる被覆などの一様構造の受容体層等の多様な形態の材料・構造のものを使用することもできる。
以下では、複数のMSSの集合体(以下、センサアレイと称することがある)を使用し、これを機械学習と組み合わせることにより、多くの種類の(また、しばしば未知の)化学物質を含有する試料中の特定の化学物質の濃度を定量的に測定できることを示す。試料及び特定の化学物質の例として、酒類中のアルコール濃度を取り上げ、これらの液体の試料からの蒸発により得られた気体(以下では、しばしば「におい」とも呼ぶ)から、元の液体試料中のアルコール濃度を推定する。しかしながら、以下の説明から、これらの試料や測定対象の化学物質は単なる例示であり、他の多様な種類の試料や化学物質を任意に選択できることは自明であろう。
[各種の表面機能化を行ったシリカ/チタニア複合ナノ粒子の製造]
2つのアルコキシド、すなわちチタンテトライソプロポキシド(titanium tetraisopropoxide、TTIP)と各種のシランカップリング試薬を多段階微小流体(multi-step microfluidic)手法と組み合わせた、加水分解及び共縮合重合反応(co-condensation reaction)(詳細後述)により、各種の表面機能化を行ったシリカ/チタニア複合ナノ粒子(NPs)(以下、単にナノ粒子とも表記)を製造した。本実施例では、アミノプロピル基、ビニル基、オクタデシル基及びフェニル基の4種類の官能基(図及び表中では夫々Aminopropyl、Vinyl、C18、及びPhenylと表記)をナノ粒子表面に固定した。これらの官能基がそこに存在することを確認するため、これらナノ粒子のFT-IRスペクトル測定を行い、図1に示す結果を得た。図1に示すFT-IRスペクトルから、これら4種類の官能基の存在は皆明らかである。
2つのアルコキシド、すなわちチタンテトライソプロポキシド(titanium tetraisopropoxide、TTIP)と各種のシランカップリング試薬を多段階微小流体(multi-step microfluidic)手法と組み合わせた、加水分解及び共縮合重合反応(co-condensation reaction)(詳細後述)により、各種の表面機能化を行ったシリカ/チタニア複合ナノ粒子(NPs)(以下、単にナノ粒子とも表記)を製造した。本実施例では、アミノプロピル基、ビニル基、オクタデシル基及びフェニル基の4種類の官能基(図及び表中では夫々Aminopropyl、Vinyl、C18、及びPhenylと表記)をナノ粒子表面に固定した。これらの官能基がそこに存在することを確認するため、これらナノ粒子のFT-IRスペクトル測定を行い、図1に示す結果を得た。図1に示すFT-IRスペクトルから、これら4種類の官能基の存在は皆明らかである。
図1中のFT-IRスペクトルの各々について簡単に説明すれば、ビニル基で修飾されたナノ粒子(Vinyl-STNPs)のFT-IRスペクトルは1406cm-1及び1600cm-1に2つの特徴的な吸収バンドを示す。その前者は-CH2面内屈曲変形によるものであり、後者はC=C伸縮モードに帰属される。オクタデシル基で修飾されたナノ粒子(C18-STNPs)のFT-IRスペクトルは2848cm-1及び2916cm-1において非常に強い吸収を示した。これらはオクタデシル基のC-H伸縮振動に帰属させることができる。それらに続いて、1430cm-1及び738cm-1に現れる吸収バンドはSiに共有結合しているフェニル基によるものである一方、1954nm-1、1571nm-1、1490cm-1、1067cm-1、1027cm-1及び694cm-1に現れる吸収バンドはフェニル基自身の各種の振動モードによるものである。アミノプロピル基で修飾されたナノ粒子(Aminopropyl-STNPs)については、図1に示すそのFT-IRスペクトルは非特許文献2で以前報告されたものに良く一致しており、アミノプロピル基によって適切に機能化されたことを示している。C18-STNPs及びフェニル基で修飾されたナノ粒子(Phenyl-STNPs)については3000~3500cm-1付近で水素結合ネットワークの特徴を示す吸収バンドはほとんど何も認められないが、このことはこれらの官能基に固有の疎水性を反映している。これとは対照的に、Aminopropyl-STNPs及びVinyl-STNPsでは、同じ波数領域中で明確な吸収バンドが現れている。アミノプロピル基で修飾した固体についてのFT-IRスペクトルは、その親水的な表面の性質により同様な傾向を示すことが知られている。しかしながら、ビニル基で機能化された固体は基本的には疎水性であると考えられる。熱重量分析によって定量した固定されたビニル基の量を勘案すれば、アクセス可能な水酸基がまだ多数残されており、親水性を示すと結論付けられる。
図2に示すSEM像から、これら4種類のナノ粒子の平均サイズは数十nmであることがわかり、従って、ナノ粒子(NPs)と呼ぶことは正当である。それらのサイズ分布は十分に狭く、TTIPとシランカップリング試薬との反応に伴う一様な核形成とその後の成長により副産物はできていないと結論付けることができる。このことは、シランベースの官能基はチタニアと共沈殿して機能化したNPsが形成されたことを示している。ここで使用した官能基で表面機能化されたナノ粒子を、上で言及したように[官能基名]-STNPsと表記する(Aminopropyl-STNPs等)。
[各種のNPsで被覆されたMSSの大気中条件下の検出特性]
ナノメカニカルセンシングのための受容体層材料としての機能化ナノ粒子の各々の性能を調べるため、これらのナノ粒子をMSSの表面にスプレーコーティングにより被覆した(詳細は後述)。図10に示す光学顕微鏡像で確認できるように、センサ表面全体が被覆層によって覆われた。被覆の厚さは約1μmと見積もられた。C18-STNPs及びPhenyl-STNPsは水とIPAとの混合液中に良好に分散しなかったので、同図中のこれらの光学顕微鏡像中には多数の集塊が視認できる。
ナノメカニカルセンシングのための受容体層材料としての機能化ナノ粒子の各々の性能を調べるため、これらのナノ粒子をMSSの表面にスプレーコーティングにより被覆した(詳細は後述)。図10に示す光学顕微鏡像で確認できるように、センサ表面全体が被覆層によって覆われた。被覆の厚さは約1μmと見積もられた。C18-STNPs及びPhenyl-STNPsは水とIPAとの混合液中に良好に分散しなかったので、同図中のこれらの光学顕微鏡像中には多数の集塊が視認できる。
大気環境下でのナノ粒子被覆MSSの検出性能を15種類の化学物質について測定を行うことによって調べた。ここで使用したセンサアレイは4つのMSSで構成されていた。センサアレイ中のMSSをチャンネルと称する場合がある。これらの化学物質は大まかに以下の6つのカテゴリに分類できる:水ベースの物質(超純水、ホルマリン(図中ではそれぞれUltrapure water(またはWater)、Formalineと表記))、アルカン(ヘキサン、へプタン、オクタン(図中ではそれぞれHexane、Heptane、Octaneと表記))、アルコール(メタノール、エタノール、イソプロパノール(図中ではそれぞれMethanol(またはMeOH)、Ethanol(またはEtOH)、Isopropanol(またはIPA)と表記))、芳香族(ベンゼン、トルエン、キシレン(図中ではそれぞれBenzene、Toluene、Xyleneと表記))、ケトン(アセトン、2-ブタノン(図中ではそれぞれAcetone、2-butanoneと表記))、及びその他(酢酸エチル、酢酸(図中ではそれぞれEthyl acetate(またはAcOEt)、Acetic acidと表記))。その結果、図11A~図11Dに示された応答波形からわかるように、4つのチャンネルはこれらの化学物質に対して互いに異なる態様で応答した。これらの応答信号の傾向は各チャンネルで使用されているナノ粒子について予期される性質に基づいて解釈できる。例えば、Aminopropyl-STNPs及びPhenyl-STNPsは水ベースの物質及びアルコールによく応答し、他方C18-STNPs及びPheny--STNPsは芳香族化合物によく応答した。特に、C18-STNPsは、その構造上の類似性から想像できるように、アルカンに対して最も高い親和性を示した。
図3に示すように、これらのチャンネルは各種の化学物質に対して互いに補う形で良好な応答性を有するので、上述の機能化ナノ粒子を組み合わせることにより、検出のための受容体層材料として使用した場合に充分な識別能力を有するということができる。この着想を検証するため、これら15種類の化学物質を測定した結果得られたデータセット上で主成分分析(PCA)を行った。図4に示すPCAプロットは、これらの化学物質がその化学構造に従って明確に識別できることを示している。
[機械学習に基づく各種の酒類のアルコール濃度の推定]
上で示したように、各種の機能化チャンネルを有するセンサアレイは測定された応答信号から単純なパラメータを抽出するだけで(詳細は図6を参照して後述)多数の化学物質を識別することができた。このことは、上述のような複数の種類の化学物質に対して互いに異なる応答を示す複数のチャンネルを有するセンサアレイは、においなどの複雑な組成を有する試料から定量的な情報を導出するための良好な手段となる可能性があることを意味している。本実施例では各種の酒類のにおい、つまりこれらから発生する蒸気を機械学習(machine learning、ML)のモデルの例として取り上げた。具体的にはこれらについての多数のトレーニングデータを収集して機械学習を行い、それに基づいて未知の酒類のアルコール濃度を推定した。
上で示したように、各種の機能化チャンネルを有するセンサアレイは測定された応答信号から単純なパラメータを抽出するだけで(詳細は図6を参照して後述)多数の化学物質を識別することができた。このことは、上述のような複数の種類の化学物質に対して互いに異なる応答を示す複数のチャンネルを有するセンサアレイは、においなどの複雑な組成を有する試料から定量的な情報を導出するための良好な手段となる可能性があることを意味している。本実施例では各種の酒類のにおい、つまりこれらから発生する蒸気を機械学習(machine learning、ML)のモデルの例として取り上げた。具体的にはこれらについての多数のトレーニングデータを収集して機械学習を行い、それに基づいて未知の酒類のアルコール濃度を推定した。
先ず、35種類の液体試料のにおいを測定し、これらに対する上記4種類のナノ粒子被覆を行ったチャンネルを有するセンサアレイの応答を得て、図12A~図12Dに示すように、これらの応答がその形状及び強度の点で互いに異なることを確認した。ここで、35種類の液体として、市販の酒類、非アルコール飲料、及び単に水とエチルアルコール(EtOH)とを混合したものを使用した。例えば図5に示すように、応答波形は、たとえアルコール濃度が同じ(例えば40%)液体試料同士を比較してみても、同じにはならない。これらの結果から、アルコール濃度はこれらの測定信号から直接求めることはほとんど無理であることがわかる。また、測定される系が3つよりも多くの成分を含んでいる場合には、成分の濃度を判定することは現実的に困難であることが報告されている(非特許文献3)。従って、特定成分の濃度を応答信号から解析的に求める代わりに、機械学習技術を用いることで、アルコール濃度に関して応答信号間の相間を学習させた。これによって、センサアレイによって測定された信号から酒類のアルコール濃度を推定するための機械学習モデルを構築した。
機械学習技術としては各種のものが利用可能であるが、本実施例では例示としてカーネルリッジ回帰(kernel ridge regression、KRR)を採用した。KRRにおけるハイパーパラメータを、交差検証(cross validation)を行うことにより得られる予測誤差Δ(図中ではPrediction errorと表記;詳細は後述)を最小化するように決定した。KRR及び交差検証の詳細についても後述する。KRRを行うため、以下のように定義されるパラメータ(パラメータ1~パラメータ4、図中ではそれぞれParameter 1~Parameter 4と表記)により、センサアレイの各チャンネルによって測定された信号の特徴を表した:

ここで、a、b、c、d、e、ta、tb、tc及びtdは、におい(蒸気)と基準となる気体(空気またはN2)とを所定の周期で切り替えながらセンサアレイに供給したときの各チャンネルからの応答信号の各サイクルから、図6に示すようにして抽出される信号値あるいはその時刻である。より具体的には、ここではtb=ta+1(秒)、tc=ta+10(秒)、及びtd=ta+11(秒)とした。また、各シグナルにピークが複数あり、それぞれのピークのtaの値は異なる。パラメータ1の物理的な意味は測定対象物質の吸着過程に関係し、一方パラメータ3については脱着過程に関する情報を含むとも言うことができよう。パラメータ2は吸着/脱着過程の間の傾斜として定義したが、これは吸着が静定しようとする準平衡状態(quasi-equilibrium state)とみなされる。すなわち、受容体と検体分子の組合せによってはこれは平衡と言うことはできないが、吸着パラメータ3を脱着と関連付けるにあたり、パラメータ1とパラメータ3との緩やかな変化の状態を準平衡と定義している。パラメータ4は各応答信号のサイクルのカーブから得られる最大高と定義したが、これは受容体層の吸着容量を反映している。
図7は上記4種類のナノ粒子を使用したセンサアレイによって測定された35種類の酒類の信号(この測定方法の詳細は後述)から抽出されたパラメータのアルコール濃度に対する依存性を示している。これら35種類の酒類の具体的な名称は後述する。なお、ここで「酒類」と呼んでいるものの内には、アルコールを含有していない水道水などの液体や、アルコールを含有しているが通常は酒類とは考えられない液体(具体的にはアルコールを単に水で薄めただけのもの)も含んでいることに注意されたい。
酒類の各々について、ta=60、80及び100での3つのピークを使用し、また図7中の各グラフには105個のデータが存在する。パラメータ2以外については、パラメータがアルコール濃度に対してある程度の相関性を持つことが確認された。従って、アルコール濃度について機械学習モデルをトレーニングするにはパラメータ1、3及び4が有用であるということができる。他方、この段階ではアルコール濃度を推定するのにどの受容体層材料が適切であるかについては結論付けることはできない。
これらの抽出されたパラメータを使用して、KRRを行った。各受容体層材料を使用したときの4つのパラメータの全ての組み合わせについて、酒類のアルコール濃度を予測する(本願では「予測する」は「推定する」の意味である)ために機械学習モデルのトレーニングを行った。トレーニングされた機械学習モデルの個数は24-1、すなわち15である。35種類の酒類の内から赤ワイン、芋焼酎及びウイスキーを除いた32種類の酒類を既知データとしてトレーニングに使用した。機械学習モデルのトレーニングに当たって、各々の酒類についてta=60、80及び100の3つの信号、都合3×32=96の信号を使用した。図8の上側の4つのグラフは、24分割交差検証を行ったときの、パラメータの組み合わせに依存した予測誤差Δを示す。各受容体層材料についての予測誤差の最適値及びパラメータの最適な組み合わせ(図8中の上側の各受容体層材料についてのグラフ中にそれぞれoptimumとして示す)を以下の表1にまとめて示す。
表1 大気中の条件下での、受容体層材料に依存するパラメータの最適な組み合わせ及び最適な予測誤差

この表から、酒類中のアルコール濃度を予測するためには、C18-STNPs及びPhenyl-STNPsの方がAminopropyl-STPNs及びVinyl-STNPsよりも有用であることが示唆される。この結果は、単にパラメータを抽出しただけでは得られない。これに加えて、予期したように、パラメータ2はアルコール濃度を予測するには有用でないことが確認できた。
更に、パラメータの最適の組み合わせを使用した場合の予測されたアルコール濃度対実際のアルコール濃度のパリティプロットを図8の下側のグラフに示す。これらのグラフ中で、灰色の小円は機械学習モデルのトレーニングに使用した既知の酒類を表し、黒い小円は未知の酒類(ここでは、赤ワイン、芋焼酎、及びウイスキー)である。既知の酒類については、受容体層材料としてC18-STNPsあるいはPhenyl-STPNsを使用した場合には機械学習による予測はうまく行ったが、Aminopropyl-STNPs及びVinyl-STNPsについては予測誤差がはるかに大きくなった。これらの結果から判断するに、酒類のアルコール濃度を予測するためには疎水性の受容体層材料を使用することが重要であると考えられる。その一方で、未知の酒類についての予測の性能は、C18-STNPsあるいはPhynyl-STNPsを使用した場合でも充分ではなかった。機械学習を用い、また予測誤差を評価することによって、予測の対象に応じた受容体層材料を選択することができることをここで強調しておく。以下で図13A~図13D(ナノ粒子受容体層を使用した場合)並びに図14A及び図14B(ポリマー受容体層を使用した場合)を参照して説明するように、N2環境下でも同じ結果を確認したことに注意されたい。
予測性能をさらに向上させるために、ある疎水性の受容体層材料から得られた複数の信号を使用して機械学習モデルをトレーニングした場合を検討した。C18-STNPs及びPhenyl-STNPsに加えて、2種類の市販の疎水性ポリマーであるポリサルフォン及びポリカプロラクトン(図及び表中ではそれぞれpolysulfone及びpolycaprolactoneと表記)を使用した。以下で、図15A、図15B、図16A及び図16Bを参照して、これらのポリマーを使用した場合の測定された応答、トレーニング結果などを説明する。ここで、各ポリマーによる信号の特徴もまた上述の4つのパラメータによって表現したので、センサアレイの4つのチャンネルから16のパラメータが得られた。酒類のアルコール濃度を予測する機械学習モデルは16のパラメータのすべての組み合わせに対して構築されたので、トレーニングされた機械学習モデルは216-1=65535個となった。24分割交差検証を行うことによって、上記すべての組み合わせについての予測誤差Δを評価して、最適な組み合わせを探索した。受容体層にPhenyl-STMPsを使用したMSSのパラメータ3、ポリサルフォンを使用したMSSのパラメータ4、並びにポリカプロラクトンを使用したMSSのパラメータ1及びパラメータ3を使用した最適の組み合わせでは、予測誤差Δ=0.4315となった。これは、単一の受容体層を使用した場合に比べて予測性能が劇的に改善されたことを意味する。図9は、最適な組み合わせを使用した場合の、予測されたアルコール濃度対実際のアルコール濃度のパリティプロットを示す。図9においても図8下段のパリティプロットと同じく灰色の小円は機械学習に使用した既知の酒類を、また黒い小円は未知の酒類を示す。これより、機械学習モデルによる予測は既知の酒類だけではなく、未知の酒類に対しても高精度で成功裏に行われたことが判る。この事実は、機械学習はMSSに代表される化学センサによる測定で得られた複数の信号から測定対象物の量を導き出す強力なツールの一つであることを示している。
最後に、センサアレイ中の4つのMSSチャンネルを使用した場合、パラメータの組み合わせを予測誤差が小さい順に並べた時の上位100個の組み合わせ中での各パラメータの出現率を以下の表2に示す。
表2: 4つのチャンネルを使用した場合の、最上位100通りのパラメータ組み合わせにおける、各パラメータの出現率

上位100個の組み合わせによる予測誤差Δは0.4315~0.5735の間に分布していた。この表から、パラメータ2の出現率は、ポリサルフォンの場合を除いて小さいことが判る。アルコール濃度に対するパラメータ2の相関は、後述する通り、ポリサルフォンの場合だけ示された。さらに、パラメータ3の出現率はC18-STNPs及びPhenyl-STNPsの場合にはパラメータ1の出現率よりも大きいが、ポリサルフォン及びポリカプロラクトンの場合にはそれと逆の結果が出た。これらの結果から、ここでのナノ粒子被覆は吸着過程よりも脱着過程から多くの情報を引き出すのに対して、これらのポリマーは逆の傾向を示すことが示唆される。これらの傾向を解釈するには、ナノ粒子及びポリマーの物理化学的な性質を検討する必要がある。応答の形状を決める主要なファクターの一つは収着(sorption)と拡散の時定数の間の比の値であることが報告されている。ナノ粒子被覆は当然ナノ粒子間の隙間によって形成される多数の細孔を有している。この多孔質構造によりポリマーよりも高速の収着が起こるようになり、したがって上述のパラメータ抽出条件では収着過程からより多くの情報を導き出すのが困難になる。一方、脱着の挙動は毛細管からの脱着と同様となるであろう。ここで、典型的な細孔サイズが2nm~50nmの範囲であるメソポーラス材料の場合、通常はヒステリシスが観察される。したがって、遅延した脱着がパラメータ3の形態でより多くの情報を提供するはずである。ポリマーの場合には、ポリマーのナノ粒子ベースの多孔質構造に比べて稠密な構造であるため、収着と脱着のいずれもより長い時間を要する。したがって、予測のために有用な情報はパラメータ1とパラメータ3の両方から得られたのである。もちろん、受容体層被覆と吸着質との間の相互作用も今問題としている結果に影響を与える。
[実施例の細部]
<各種の機能化を行ったシリカ/チタニア複合ナノ粒子の微小流体合成(microfluidic synthesis)>
1.1 使用薬品
以下の薬品を使用した:テトラエトキシシラン(TEOS:東京化成工業株式会社)、トリエトキシビニルシラン(TEVS:東京化成工業株式会社)、オクタデシルトリエトキシシラン(ODTES:東京化成工業株式会社)、トリメトキシフェニルシラン(TMPS:東京化成工業株式会社)、チタンテトライソプロポキシド(TTIP:東京化成工業株式会社)、イソプロピルアルコール(IPA:和光純薬工業株式会社)、アンモニア28%水溶液(NH3aq:関東化学株式会社)、オクタデシルアミン(ODA:Aldrich, Inc.)、及び3-アミノプロピルトリエトキシシラン(APTES:Sigma, Inc.)。なお、これらの薬品は入手したものをそのまま使用した。
1.2 実験手順
以前に報告された多段階核形成制御成長法(multi-step nucleation controlled growth method)に多少修正を加えた方法により、各種の表面機能化を行ったシリカ/チタニア複合ナノ粒子を合成した。簡単に説明すれば、先ず5種類の出発溶液(溶液A~溶液E)を準備した。これらの溶液の組成を表3にまとめて示す。
以前に報告された多段階核形成制御成長法(multi-step nucleation controlled growth method)に多少修正を加えた方法により、各種の表面機能化を行ったシリカ/チタニア複合ナノ粒子を合成した。簡単に説明すれば、先ず5種類の出発溶液(溶液A~溶液E)を準備した。これらの溶液の組成を表3にまとめて示す。
表3 各種の機能化ナノ粒子の合成に使用した各化学薬品の量

ここで、表中の※1~※3は以下の通りである:
※1
Aminopropyl-STNPs -> APTES
Vinyl-STNPs -> TEVS
C18-STNPs -> ODTES
Phenyl-STNPs -> TMPS
※1
Aminopropyl-STNPs -> APTES
Vinyl-STNPs -> TEVS
C18-STNPs -> ODTES
Phenyl-STNPs -> TMPS
※2
Aminopropyl-STNPs -> 1.481
Vinyl-STNPs -> 1.330
C18-STNPs -> 2.000
Phenyl-STNPs -> 1.160
Aminopropyl-STNPs -> 1.481
Vinyl-STNPs -> 1.330
C18-STNPs -> 2.000
Phenyl-STNPs -> 1.160
※3
Aminopropyl-STNPs -> 8.639
Vinyl-STNPs -> 8.757
C18-STNPs -> 8.232
Phenyl-STNPs -> 8.890
Aminopropyl-STNPs -> 8.639
Vinyl-STNPs -> 8.757
C18-STNPs -> 8.232
Phenyl-STNPs -> 8.890
シリンジポンプ(CXN1070、ISIS株式会社の製品)を使用して、溶液A~溶液Dを個別にパーフルオロアルコキシアルカン(PFA)チューブ(内径1.0mm、外径1/16インチ、株式会社ワイエムシィの製品)中に10mL/分で流した。溶液Aと溶液B、また溶液Cと溶液Dを、それぞれY字状の接続部(流路の断面積が約1mm2のKeyChem mixer、株式会社ワイエムシィの製品)付きのポリテトラフルオロエチレン(PTFE)製の流体経路中で混合した。その結果の2つの反応溶液、すなわち溶液A+Bと溶液C+Dを、これら2つの流体経路の直後におかれた2段目の流体経路中で混合した。1段目と2段目の流体経路は10cmのPFAチューブで連結した。混合された4種類の溶液A~Dを長さ70cmのPFAチューブ中を流して磁気撹拌中の溶液E中に添加した。添加後、最終的な反応液を室温で24時間エージングした。最後に、わずかに濁った分散液が得られた。
1.3 測定
フーリエ変換赤外スペクトル(FT-IR)をNicolet 4700 FT-IR spectrometer(Thermo Fisher Scientific Inc.)を使用して分解能2.0cm-1で測定した。この測定では、試料粉末をKBrと均一に混合し、透過率測定のために混合物をプレスしてKBrディスクを成型した。
フーリエ変換赤外スペクトル(FT-IR)をNicolet 4700 FT-IR spectrometer(Thermo Fisher Scientific Inc.)を使用して分解能2.0cm-1で測定した。この測定では、試料粉末をKBrと均一に混合し、透過率測定のために混合物をプレスしてKBrディスクを成型した。
Hitachi Ultra-high Resolution Scanning Electron Microscope SU8000を使用して、加速電圧10kVで走査型電子顕微鏡(SEM)像を得た。それぞれの測定の前に、試料を数nm厚の白金でコーティングした。
2.MSS上への各種のナノ粒子のスプレーコーティング
MSS自体の製造についてはすでに知られている事項であり、例えば特許文献1、非特許文献2等を参照されたい。上述のようにして得られた4種類のナノ粒子分散液を、スプレーコーティング装置(rCoater、旭サナック株式会社の製品)を使用してMSSの表面にスプレーコーティングした。ナノ粒子分散液の準備にあたって、機能化されたいずれのナノ粒子の場合でも、9000rpmで10分間遠心分離を行った。その沈殿物をIPAで慎重に数回洗浄し、その後IPA/水混合物(混合比は3:5(体積比))を添加した。4種類の分散液の濃度は約1g/Lに設定した。スプレーコーティングを行う前に、分散液を十分に超音波処理して、ナノ粒子を可能な限り分散させた(ただし、集塊がまだ幾分か認められた)。
MSS自体の製造についてはすでに知られている事項であり、例えば特許文献1、非特許文献2等を参照されたい。上述のようにして得られた4種類のナノ粒子分散液を、スプレーコーティング装置(rCoater、旭サナック株式会社の製品)を使用してMSSの表面にスプレーコーティングした。ナノ粒子分散液の準備にあたって、機能化されたいずれのナノ粒子の場合でも、9000rpmで10分間遠心分離を行った。その沈殿物をIPAで慎重に数回洗浄し、その後IPA/水混合物(混合比は3:5(体積比))を添加した。4種類の分散液の濃度は約1g/Lに設定した。スプレーコーティングを行う前に、分散液を十分に超音波処理して、ナノ粒子を可能な限り分散させた(ただし、集塊がまだ幾分か認められた)。
次に、分散液をシリンジに取り、シリンジポンプ(YSP-201、株式会社ワイエムシィの製品)を使用して、3mL/分の流速でPTFEチューブを通して流した。分散液をスプレーノズルに導入して、2種類のキャリアエア(霧化エア(atomizing air):0.030MPa、パターニングエア(patterning air):0.030MPa)を用いて均一な微小液滴を形成した。4つのMSSを有するセンサアレイをステージ上に搭載した。このステージを、微小液滴を素早く蒸発させるために約100℃に加熱した。このステージを前後に移動させ、その間にスプレーノズルの方も15mm/分で0.3mmピッチで左から右へ移動させた。スプレーノズルとステージ間の距離は100mmに設定した。このコーティングプロセスを繰り返して、ほぼ1μmのコーティング厚を得た。交差汚染を防止するため、マスクを使用して、一つのチャンネルのコーティングを行っている間は他の3つのチャンネルを覆っておいた。
3.検出の実験
3.1 試料液体
酒類を使用して実験を行う前に、以下の15種類の試料液体に対する上記コーティングを行ったセンサアレイ上のMSSの出力を測定した:
○ホルムアルデヒド溶液(35~38%)、n-ヘキサン、エタノール、イソプロピルアルコール、1-ブタノール、1-ペンタノール、ベンゼン、トルエン、キシレン、2-ブタノン、酢酸、トリクロロメタン、N,N-ジメチルホルムアミド:和光純薬工業株式会社より購入
○メタノール、エチルアセテート、テトラヒドロフラン:関東化学株式会社より購入
○n-へプタン、n-オクタン、n-ノナン、n-デカン、n-ウンデカン、n-ドデカン:ナカライテスク株式会社より購入
○1,2-ジクロロベンゼン、アセトン:シグマ アルドリッチ ジャパン合同会社より購入
○1,3-ジクロロベンゼンd:Aldrich Inc.より購入
これらはすべて購入したままの状態で使用した。
アルコール濃度の定量測定のために、以下の試料を使用した。以下で、アルコール濃度(「アルコール度数」と呼ばれるものであって、エタノール体積濃度を意味する)をカッコ内に示す:
超純水(0%)、市販の水(0%)、水道水(0%)、リン酸緩衝生理食塩水(0%)、緑茶(0%)、烏龍茶(0%)、焼酎の緑茶割り(4%)、ビール(5%)、焼酎の烏龍茶割り(6%)、サングリア(9%)、梅酒(12%)、赤ワイン(12%)、純米料理酒(14%)、味醂(14.5%)、日本酒(15%)、紹興酒(17.5%)、麦焼酎(20%)、カシスリキュール(20%)、冬虫夏草酒(25%)、芋焼酎(25%)、ウオッカ(40%)、ジン(40%)、パリンカ(40%)、ラム(40%)、ブランディ(40%)、ウイスキー(40%)(図中では、それぞれUltrapure water、Commercial water、Tap water、PBS、Green tea、Oolong tea、Shochu & green tea、Beer、Shochu & oolong tea、Sangria、Umeshu、Red wine、Ryorishu、Mirin、Japanese sake、Shokoshu、Shochu (barley)、Cassis liqueur、Shochu (plant worm)、Shochu (sweet potatoes)、Vodka、Gin、Palinka、Rum、Brandy、Whiskyと表記)。これに加えて、各種濃度の水とエチルアルコールの混合液(混合比は95:5、90:10、85:15、80:20、75:25、70:30、65:35、60:40及び55:45)(図中ではそれぞれ95/5 Water/EtOH、90/10 Water/EtOH、85/15 Water/EtOH、80/20 Water/EtOH、75/25 Water/EtOH、70/30 Water/EtOH、65/35 Water/EtOH、60/40 Water/EtOH、及び55/45 Water/EtOHと表記)を使用した。
超純水(0%)、市販の水(0%)、水道水(0%)、リン酸緩衝生理食塩水(0%)、緑茶(0%)、烏龍茶(0%)、焼酎の緑茶割り(4%)、ビール(5%)、焼酎の烏龍茶割り(6%)、サングリア(9%)、梅酒(12%)、赤ワイン(12%)、純米料理酒(14%)、味醂(14.5%)、日本酒(15%)、紹興酒(17.5%)、麦焼酎(20%)、カシスリキュール(20%)、冬虫夏草酒(25%)、芋焼酎(25%)、ウオッカ(40%)、ジン(40%)、パリンカ(40%)、ラム(40%)、ブランディ(40%)、ウイスキー(40%)(図中では、それぞれUltrapure water、Commercial water、Tap water、PBS、Green tea、Oolong tea、Shochu & green tea、Beer、Shochu & oolong tea、Sangria、Umeshu、Red wine、Ryorishu、Mirin、Japanese sake、Shokoshu、Shochu (barley)、Cassis liqueur、Shochu (plant worm)、Shochu (sweet potatoes)、Vodka、Gin、Palinka、Rum、Brandy、Whiskyと表記)。これに加えて、各種濃度の水とエチルアルコールの混合液(混合比は95:5、90:10、85:15、80:20、75:25、70:30、65:35、60:40及び55:45)(図中ではそれぞれ95/5 Water/EtOH、90/10 Water/EtOH、85/15 Water/EtOH、80/20 Water/EtOH、75/25 Water/EtOH、70/30 Water/EtOH、65/35 Water/EtOH、60/40 Water/EtOH、及び55/45 Water/EtOHと表記)を使用した。
3.2 検出実験の詳細手順及び条件
本実施例の実験では、各種のナノ粒子で機能化されたMSSを有するセンサアレイをチャンバに搭載し、このチャンバをOリングによって慎重に封止した。2台の圧電ポンプを使用して、14mL/分の流量でチャンバに外気を導入した。一方のポンプはパージング、すなわち吸着材の脱着を加速するために、また他方は試料蒸気を空気とともに導入するために使用した。ここでは、所与の量の液体試料をゴム製の蓋がかぶせられた小さなバイアルに入れ、PTFEチューブに接続された中空針をゴム製の蓋を通してバイアルのヘッドスペースにまで突き刺した。このPTFEチューブの他端を圧電ポンプに接続して、ヘッドスペースから試料蒸気を引き出すことができるようにした。他端が空気中に開いた他のPTFEチューブが接続された別の中空針をヘッドスペースにまで突き刺すことで、流体がスムーズに流れるようにした。2つの圧電ポンプを10秒ごとに切り替えることによって、試料導入-パージングのサイクルが繰り返されるようにした。このサイクルを5回繰り返した。MSSへ-1Vをブリッジ電圧として供給して、MSSから出力を得た(よく知られているように、MSS上で表面応力を検出するために4つのピエゾ抵抗素子が設けられていて、これらの素子はブリッジ接続されている。このブリッジの対抗する2つの端子間にブリッジ電圧を供給し、残った2つの端子間に発生する電圧を検出出力とする。詳細は例えば特許文献1、非特許文献1などを参照されたい)。MSSからの出力電圧を20Hzでサンプリングした。すべての実験は温度や湿度を制御しない大気中という条件下で行われた。
本実施例の実験では、各種のナノ粒子で機能化されたMSSを有するセンサアレイをチャンバに搭載し、このチャンバをOリングによって慎重に封止した。2台の圧電ポンプを使用して、14mL/分の流量でチャンバに外気を導入した。一方のポンプはパージング、すなわち吸着材の脱着を加速するために、また他方は試料蒸気を空気とともに導入するために使用した。ここでは、所与の量の液体試料をゴム製の蓋がかぶせられた小さなバイアルに入れ、PTFEチューブに接続された中空針をゴム製の蓋を通してバイアルのヘッドスペースにまで突き刺した。このPTFEチューブの他端を圧電ポンプに接続して、ヘッドスペースから試料蒸気を引き出すことができるようにした。他端が空気中に開いた他のPTFEチューブが接続された別の中空針をヘッドスペースにまで突き刺すことで、流体がスムーズに流れるようにした。2つの圧電ポンプを10秒ごとに切り替えることによって、試料導入-パージングのサイクルが繰り返されるようにした。このサイクルを5回繰り返した。MSSへ-1Vをブリッジ電圧として供給して、MSSから出力を得た(よく知られているように、MSS上で表面応力を検出するために4つのピエゾ抵抗素子が設けられていて、これらの素子はブリッジ接続されている。このブリッジの対抗する2つの端子間にブリッジ電圧を供給し、残った2つの端子間に発生する電圧を検出出力とする。詳細は例えば特許文献1、非特許文献1などを参照されたい)。MSSからの出力電圧を20Hzでサンプリングした。すべての実験は温度や湿度を制御しない大気中という条件下で行われた。
4.カーネルジッリ回帰法
カーネルリッジ回帰法(KRR)は既知のデータセットから未知のデータを予測するための強力な機械学習手法のひとつである。KRR自体は当業者に周知な事項であるので詳細な説明は省略するが、以下ではKRRを使用した本実施例における機械学習の過程を説明する。
カーネルリッジ回帰法(KRR)は既知のデータセットから未知のデータを予測するための強力な機械学習手法のひとつである。KRR自体は当業者に周知な事項であるので詳細な説明は省略するが、以下ではKRRを使用した本実施例における機械学習の過程を説明する。
N個のデータ
が与えられたとする。ここで、
は、その要素が本実施例においてnでラベル付けられた酒類のにおいとして測定された信号から抽出されたパラメータであるベクトルを表す。さらに、
はその酒類のアルコール濃度を表す。ここで
の次元は使用されるパラメータの個数及びMSSのチャンネル数に依存することに注意されたい。ここではパラメータ
(このパラメータは未知の酒類のにおいを測定した信号から求められる)を有する未知の酒類のアルコール濃度
はKRRによって
で予測される。ここにおいて、

である。また、
はN×Nの単位ベクトルであり、また
は、
と
との間の類似性を表すカーネル関数である。ここでは以下のガウスカーネルを使用する。

この手続きでは、λ及びσは解析を行う前に与えられるべきハイパーパラメータである。予測能力はハイパーパラメータの値に強く依存する。
なお、機械学習分野では多様な回帰方法が存在しており、本願実施例はそのほんの一例であるあることに注意されたい。
5.交差検証
KRRにおけるハイパーパラメータλ及びσの値を決定するため、ここでは交差検証(cross validation)を使用する。交差検証も当業者には周知の事項であるため、その詳細はここでは説明しないが、簡単に言えば、トレーニングを行う前に一部のデータをデータセットから取り除き、取り除いたデータをテストデータとみなして予測の検証に使用するというものである。交差検証誤差を、予測誤差を表すものとして見積もり、交差検証誤差を最小化するようにハイパーパラメータの値を評価する。以下では、S分割交差検証の手順を示す。
KRRにおけるハイパーパラメータλ及びσの値を決定するため、ここでは交差検証(cross validation)を使用する。交差検証も当業者には周知の事項であるため、その詳細はここでは説明しないが、簡単に言えば、トレーニングを行う前に一部のデータをデータセットから取り除き、取り除いたデータをテストデータとみなして予測の検証に使用するというものである。交差検証誤差を、予測誤差を表すものとして見積もり、交差検証誤差を最小化するようにハイパーパラメータの値を評価する。以下では、S分割交差検証の手順を示す。
最初に、N個のデータからなるデータセットDをS個のデータサブセットに無作為に分割する。各データサブセットをDsで表す。ここで、s=1,・・・,Sであり、各データサブセット中のデータの個数はN/Sである。S個のデータサブセットの一つをテストデータであるとみなし、残りのS-1個のデータサブセットをトレーニングデータとして使用する。テストデータの個数及びトレーニングデータの個数はそれぞれNte=N/S及びNtr=N(S-1)/Sで与えられる。
次に、Ntr個のデータからなる各データサブセットGs=D\Dsについて、いろいろなλ及びσを与えてKRRを行い、パラメータ
についてのハイパーパラメータλ及びσに依存したアルコール濃度の予測
を得る。これにより、テストデータDsのアルコール濃度と予測されたアルコール濃度との間の平均2乗偏差

を計算する。
更に、S個の異なる平均2乗偏差を平均することにより、λ及びσ依存する交差検証誤差を得る。この値は以下のようになる。

λ及びσについてこのΔ(λ,σ)の値を最小化することにより、ハイパーパラメータの最適値λ*及びσ*を評価する。これらの値により良好な予測が実現される。最後に、予測の性能を表すところの機械学習の予測誤差を
と定義する。この予測誤差を使用することによって、本実施例において酒類のアルコール濃度を予測するための、信号から抽出されたパラメータの最適な組み合わせ及び受容体層材料を探索した。
機械学習モデルにおけるハイパーパラメータを決定するための多様な方法が存在し、また予測誤差にも多様な定義が存在する。したがって、上で説明した機械学習方法もほんの一例に過ぎないことに注意する必要がある。
[ポリマー受容体層材料について]
受容体層材料としては、上で説明したように、ナノ粒子以外の材料にもポリマーその他の材料も当然使用することができる。ここではすでに言及した2種類のポリマー、すなわちポリサルフォン及びポリカプロラクトンを使用した場合についての追加のデータを示す。
受容体層材料としては、上で説明したように、ナノ粒子以外の材料にもポリマーその他の材料も当然使用することができる。ここではすでに言及した2種類のポリマー、すなわちポリサルフォン及びポリカプロラクトンを使用した場合についての追加のデータを示す。
図17Aに、ポリサルフォン及びポリカプロラクトンを受容体層材料として使用した場合に、MSSによって35種類の酒類を測定した信号から抽出したパラメータのアルコール濃度依存性を示す。この場合は、すべてのパラメータ1~4についてアルコール濃度との間にある程度の相関が確認された。図17B及び表4はポリサルフォン及びポリカプロラクトンを受容体層材料として使用した場合の大気中の条件下でのトレーニング結果を示す。ここにおいて、各種の設定は全てナノ粒子の場合と完全に同一なものとした。既知の酒類については、機械学習モデルはいずれの受容体層を使用した場合も良好な結果が得られた。
表4 大気中の条件下での、感応膜材料に依存するパラメータの最適な組み合わせ及び最適な予測誤差
[N2環境下の場合について]
ここまでの説明は大気中での受容体層の挙動を前提としていたが、ここで大気に代えてN2中で実験を行った場合の機械学習による予測の結果を示す。
ここまでの説明は大気中での受容体層の挙動を前提としていたが、ここで大気に代えてN2中で実験を行った場合の機械学習による予測の結果を示す。
N2環境下でのアルコール濃度の定量測定のために、以下の試料を使用した。以下で、アルコール濃度をカッコ内に示す:
超純水(0%)、ビール(5%)、サングリア(9%)、梅酒(12%)、赤ワイン(12%)、純米料理酒(14%)、味醂(14.5%)、日本酒(15%)、紹興酒(17.5%)、麦焼酎(20%)、カシスリキュール(20%),冬虫夏草酒(25%)、芋焼酎(25%)、ウオッカ(40%)、ジン(40%)、パリンカ(40%)、ラム(40%)、ブランディ(40%)、ウイスキー(40%)(図中では、それぞれUltrapure water、Beer、Sangria、Umeshu、Red wine、Ryorishu、Mirin、Japanese sake、Shokoshu、Shochu (barley)、Cassis liqueur、Shochu (plant worm)、Shochu (sweet potatoes)、Vodka、Gin、Palinka、Rum、Brandy、Whiskyと表記)。これに加えて、各種濃度の水とエチルアルコールの混合液(混合比は80:20及び60:40)(図中ではそれぞれ80/20 Water/EtOH及び60/40 Water/EtOHと表記)を使用した。
超純水(0%)、ビール(5%)、サングリア(9%)、梅酒(12%)、赤ワイン(12%)、純米料理酒(14%)、味醂(14.5%)、日本酒(15%)、紹興酒(17.5%)、麦焼酎(20%)、カシスリキュール(20%),冬虫夏草酒(25%)、芋焼酎(25%)、ウオッカ(40%)、ジン(40%)、パリンカ(40%)、ラム(40%)、ブランディ(40%)、ウイスキー(40%)(図中では、それぞれUltrapure water、Beer、Sangria、Umeshu、Red wine、Ryorishu、Mirin、Japanese sake、Shokoshu、Shochu (barley)、Cassis liqueur、Shochu (plant worm)、Shochu (sweet potatoes)、Vodka、Gin、Palinka、Rum、Brandy、Whiskyと表記)。これに加えて、各種濃度の水とエチルアルコールの混合液(混合比は80:20及び60:40)(図中ではそれぞれ80/20 Water/EtOH及び60/40 Water/EtOHと表記)を使用した。
<ナノ粒子を使用した場合>
図18Aに、上の実施例で使用した4種類のナノ粒子受容体層材料、すなわちAminopropyl-STNPs、Vinyl-STNPs、C18-STNPs、及びPheny-STNPsを使用した場合の、MSSによる21種類の酒の測定信号から抽出されたパラメータのアルコール濃度への依存性を示す。ここでも、パラメータ1~4は先に示した式(1)~(4)を使用して抽出し、tb=ta+3[秒]、tc=ta+30[秒]、及びtd=ta+33[秒]とした。さらに、酒類の各々において、ta=90、150及び210の3つのピークを使用し、これにより図18A中には63個のデータが存在している。パラメータ2以外のすべてのパラメータについて、アルコール濃度に対してある程度の相関が確認された。図18B及び表5に、受容体層材料としてAminopropyl-STNPs、Vinyl-STNPs、C18-STNPs、及びPheny-STNPsを使用した場合のN2環境下でのトレーニングを示す。ここでの設定は大気中での条件下の場合と全く同一とした。既知の酒類については、受容体層材料がC18-STNPsあるいはPheny-STNPsの場合には機械学習モデルは良い結果を出したが、Aminopropyl-STNPsあるいはVinyl-STNPsの場合には大気中での条件下の場合と同様に、かなり大きな予測誤差を示した。
図18Aに、上の実施例で使用した4種類のナノ粒子受容体層材料、すなわちAminopropyl-STNPs、Vinyl-STNPs、C18-STNPs、及びPheny-STNPsを使用した場合の、MSSによる21種類の酒の測定信号から抽出されたパラメータのアルコール濃度への依存性を示す。ここでも、パラメータ1~4は先に示した式(1)~(4)を使用して抽出し、tb=ta+3[秒]、tc=ta+30[秒]、及びtd=ta+33[秒]とした。さらに、酒類の各々において、ta=90、150及び210の3つのピークを使用し、これにより図18A中には63個のデータが存在している。パラメータ2以外のすべてのパラメータについて、アルコール濃度に対してある程度の相関が確認された。図18B及び表5に、受容体層材料としてAminopropyl-STNPs、Vinyl-STNPs、C18-STNPs、及びPheny-STNPsを使用した場合のN2環境下でのトレーニングを示す。ここでの設定は大気中での条件下の場合と全く同一とした。既知の酒類については、受容体層材料がC18-STNPsあるいはPheny-STNPsの場合には機械学習モデルは良い結果を出したが、Aminopropyl-STNPsあるいはVinyl-STNPsの場合には大気中での条件下の場合と同様に、かなり大きな予測誤差を示した。
表5 N2環境下での、感応膜材料に依存するパラメータの最適な組み合わせ及び最適な予測誤差

<ポリマーを使用した場合>
図18Cに、ポリサルフォン及びポリカプロラクトンを受容体層材料として使用した場合に、MSSによって21種類の酒類を測定した信号から抽出したパラメータのアルコール濃度依存性を示す。この場合も、すべてのパラメータ1~4についてアルコール濃度との間にある程度の相関が確認された。図18D及び表6はポリサルフォン及びポリカプロラクトンを受容体層材料として使用した場合のN2条件下でのトレーニング結果を示す。ここにおいて、各種の設定は全て大気中の場合と完全に同一なものとした。既知の酒類について、機械学習モデルはいずれの受容体層を使用した場合も良好な結果が得られた。
図18Cに、ポリサルフォン及びポリカプロラクトンを受容体層材料として使用した場合に、MSSによって21種類の酒類を測定した信号から抽出したパラメータのアルコール濃度依存性を示す。この場合も、すべてのパラメータ1~4についてアルコール濃度との間にある程度の相関が確認された。図18D及び表6はポリサルフォン及びポリカプロラクトンを受容体層材料として使用した場合のN2条件下でのトレーニング結果を示す。ここにおいて、各種の設定は全て大気中の場合と完全に同一なものとした。既知の酒類について、機械学習モデルはいずれの受容体層を使用した場合も良好な結果が得られた。
表6 N2環境下での、感応膜材料に依存するパラメータの最適な組み合わせ及び最適な予測誤差

本発明の適用分野はもちろんにおいの定量的な分析に限定されるものではなく、複数の成分が混在している、あるいは混在している可能性のある気体あるいは液体中から特定の成分を定量的に検出することが有用である分野であればどこにでも利用することができる。例えば、呼気、汗、唾液、涙、その他の任意の体液や身体から発する気体、においなどを定量的に分析する装置に本発明を利用することによって、病気の診断やスクリーニングに利用することができる。また、食品の製造、保管、流通や警備、あるいは薬剤分野など、上記定量的な検出・分析が有用であるあらゆる分野で本発明が大いに利用されることが期待される。
Claims (7)
- 特定の推定対象の値が既知の複数の試料に対する化学センサからの出力から、前記推定対象の値とそれに対応する前記出力との関係を機械学習し、
与えられた未知の試料に対する前記化学センサからの出力に基づいて、前記機械学習結果を使用して特定の推定対象の値を推定する
試料に対応付けられた推定対象値を推定する方法であって、
前記試料が前記化学センサに対して与えられる量を周期的に変動させ、
前記学習の対象となる前記出力は、前記出力の前記周期的変動の各々において複数の選択された時点の値であるとともに、
前記出力の飽和した値を使用せずに前記試料に対応付けられた推定対象値を推定する方法。 - 基準試料と前記試料とを周期的に切り替えて前記化学センサに与えることにより前記試料が前記化学センサに対して与えられる量を周期的に変動させる、請求項1に記載の方法。
- 前記学習の対象となる前記出力は、前記出力を用いて所定の演算を行って得られた一群の値である、請求項1に記載の方法。
- 前記化学センサとして、前記未知の試料に含まれ得る成分の少なくとも一部に対する応答が互いに異なる複数の化学センサを使用する、請求項1から3の何れかに記載の方法。
- 前記推定対象は前記試料の物理量である、請求項1から4の何れかに記載の方法。
- 前記物理量は前記試料中の特定成分の濃度である、請求項5に記載の方法。
- 試料が導入される化学センサを備え、
請求項1から6のいずれかの方法を用いて前記化学センサの応答から前記試料の推定対象の値を推定する
試料に対応付けられた推定対象値を推定する装置。
Priority Applications (4)
| Application Number | Priority Date | Filing Date | Title |
|---|---|---|---|
| EP17875540.1A EP3550284B1 (en) | 2016-11-29 | 2017-11-21 | Method for estimating a value associated with a specimen |
| JP2018553801A JP6663151B2 (ja) | 2016-11-29 | 2017-11-21 | 試料に対応付けられた推定対象値を推定する方法及び装置 |
| US16/463,867 US20200075134A1 (en) | 2016-11-29 | 2017-11-21 | Method and Device for Estimating Value to be Estimated Associated with Specimen |
| CN201780067537.1A CN109923397A (zh) | 2016-11-29 | 2017-11-21 | 推断与试样相应的推断对象值的方法和装置 |
Applications Claiming Priority (2)
| Application Number | Priority Date | Filing Date | Title |
|---|---|---|---|
| JP2016-230793 | 2016-11-29 | ||
| JP2016230793 | 2016-11-29 |
Publications (1)
| Publication Number | Publication Date |
|---|---|
| WO2018101128A1 true WO2018101128A1 (ja) | 2018-06-07 |
Family
ID=62241407
Family Applications (1)
| Application Number | Title | Priority Date | Filing Date |
|---|---|---|---|
| PCT/JP2017/041856 WO2018101128A1 (ja) | 2016-11-29 | 2017-11-21 | 試料に対応付けられた推定対象値を推定する方法及び装置 |
Country Status (5)
| Country | Link |
|---|---|
| US (1) | US20200075134A1 (ja) |
| EP (1) | EP3550284B1 (ja) |
| JP (1) | JP6663151B2 (ja) |
| CN (1) | CN109923397A (ja) |
| WO (1) | WO2018101128A1 (ja) |
Cited By (9)
| Publication number | Priority date | Publication date | Assignee | Title |
|---|---|---|---|---|
| WO2020026327A1 (ja) * | 2018-07-31 | 2020-02-06 | 日本電気株式会社 | 情報処理装置、制御方法、及びプログラム |
| WO2020026326A1 (ja) * | 2018-07-31 | 2020-02-06 | 日本電気株式会社 | 情報処理装置、制御方法、及びプログラム |
| JP2021018211A (ja) * | 2019-07-23 | 2021-02-15 | サイマックス株式会社 | 健康モニタリングシステム、健康モニタリング方法および健康モニタリングプログラム |
| WO2021053758A1 (ja) * | 2019-09-18 | 2021-03-25 | 日本電気株式会社 | データ処理装置、学習装置、データ処理方法、及び、記録媒体 |
| CN113167717A (zh) * | 2018-11-26 | 2021-07-23 | 国立研究开发法人物质材料研究机构 | 液体试样分析方法和装置 |
| JPWO2020065807A1 (ja) * | 2018-09-27 | 2021-09-09 | 日本電気株式会社 | 情報処理装置、処理装置、情報処理方法、処理方法、決定方法、およびプログラム |
| JPWO2021200262A1 (ja) * | 2020-03-30 | 2021-10-07 | ||
| JP2022550531A (ja) * | 2019-10-02 | 2022-12-02 | エックス デベロップメント エルエルシー | 嗅覚センサシステム及び方法 |
| WO2023037999A1 (ja) * | 2021-09-07 | 2023-03-16 | パナソニックIpマネジメント株式会社 | ガス分析方法及びガス分析システム |
Families Citing this family (1)
| Publication number | Priority date | Publication date | Assignee | Title |
|---|---|---|---|---|
| WO2018221283A1 (ja) | 2017-05-31 | 2018-12-06 | 国立研究開発法人物質・材料研究機構 | 低吸湿性材料からなるナノメカニカルセンサ用受容体及びそれを受容体として使用するナノメカニカルセンサ |
Citations (6)
| Publication number | Priority date | Publication date | Assignee | Title |
|---|---|---|---|---|
| JPH02285248A (ja) * | 1989-04-27 | 1990-11-22 | Oki Electric Ind Co Ltd | 化学センサ |
| JPH06160317A (ja) * | 1992-11-20 | 1994-06-07 | Nok Corp | ガス識別方法とガス識別装置 |
| JP2000292403A (ja) * | 1999-04-05 | 2000-10-20 | Figaro Eng Inc | ガス検出方法 |
| JP2006275606A (ja) * | 2005-03-28 | 2006-10-12 | Kyoto Univ | ガス検出方法及びガス検出装置 |
| WO2011148774A1 (ja) | 2010-05-24 | 2011-12-01 | 独立行政法人物質・材料研究機構 | 表面応力センサ |
| JP2017156254A (ja) * | 2016-03-03 | 2017-09-07 | 国立研究開発法人物質・材料研究機構 | シグナル解析方法及び試料ガス識別方法 |
Family Cites Families (6)
| Publication number | Priority date | Publication date | Assignee | Title |
|---|---|---|---|---|
| CN1381721A (zh) * | 2002-06-04 | 2002-11-27 | 复旦大学 | 便携式智能电子鼻及其制备方法 |
| CN101311711A (zh) * | 2007-05-25 | 2008-11-26 | 浙江工商大学 | 一种用于液体样品的智能化学分析系统 |
| US9211092B2 (en) * | 2013-01-03 | 2015-12-15 | Dexcom, Inc. | End of life detection for analyte sensors |
| EP2972397B1 (en) * | 2013-03-14 | 2021-10-13 | Ascensia Diabetes Care Holdings AG | System error compensation of analyte concentration determinations |
| CN105699463B (zh) * | 2015-08-27 | 2018-06-12 | 索武生 | 一种化学场效应晶体管气敏传感器及其制造方法 |
| CN105510412B (zh) * | 2015-11-27 | 2018-03-23 | 中国农业科学院作物科学研究所 | 快速无损检测种子生活力的方法 |
-
2017
- 2017-11-21 CN CN201780067537.1A patent/CN109923397A/zh active Pending
- 2017-11-21 WO PCT/JP2017/041856 patent/WO2018101128A1/ja unknown
- 2017-11-21 EP EP17875540.1A patent/EP3550284B1/en active Active
- 2017-11-21 US US16/463,867 patent/US20200075134A1/en active Pending
- 2017-11-21 JP JP2018553801A patent/JP6663151B2/ja active Active
Patent Citations (6)
| Publication number | Priority date | Publication date | Assignee | Title |
|---|---|---|---|---|
| JPH02285248A (ja) * | 1989-04-27 | 1990-11-22 | Oki Electric Ind Co Ltd | 化学センサ |
| JPH06160317A (ja) * | 1992-11-20 | 1994-06-07 | Nok Corp | ガス識別方法とガス識別装置 |
| JP2000292403A (ja) * | 1999-04-05 | 2000-10-20 | Figaro Eng Inc | ガス検出方法 |
| JP2006275606A (ja) * | 2005-03-28 | 2006-10-12 | Kyoto Univ | ガス検出方法及びガス検出装置 |
| WO2011148774A1 (ja) | 2010-05-24 | 2011-12-01 | 独立行政法人物質・材料研究機構 | 表面応力センサ |
| JP2017156254A (ja) * | 2016-03-03 | 2017-09-07 | 国立研究開発法人物質・材料研究機構 | シグナル解析方法及び試料ガス識別方法 |
Non-Patent Citations (7)
| Title |
|---|
| G. YOSHIKAWAT. AKIYAMAS. GAUTSCHP. VETTIGERH. ROHRER: "Nanomechanical Membrane-type Surface Stress Sensor", NANO LETTERS, vol. 11, 2011, pages 1044 - 1048 |
| HSIEH, M. -D.ZELLERS, E. T.: "Limits of Recognition for Simple Vapor Mixtures Determined with a Microsensor Array", ANAL. CHEM., vol. 76, 2004, pages 1885 - 1895, XP001196726, DOI: doi:10.1021/ac035294w |
| N. EL BARBRIJ. MIRHISSER. IONESCUN. EL BARIX. CORREIGB. BOUCHIKHIE. LLOBET: "An electronic nose system based on a micro-machined gas sensor array to assess the freshness of sardines", SENSORS AND ACTUATORS B, vol. 141, 2009, pages 538 - 543, XP026501705, DOI: doi:10.1016/j.snb.2009.07.034 |
| RADISLAV, A., POTYRAILO, RALPH J. MAY: "Dynamic high throughput screening of chemical libraries using acoustic-wave sensor system", vol. 73, no. 3, 1 March 2002 (2002-03-01), pages 1277 - 1283, XP012039816, DOI: 10.1063/1.1448905 * |
| See also references of EP3550284A4 |
| SHIBA, K.SUGIYAMA, T.TAKEI, T.YOSHIKAWA, G.: "Controlled growth of silica-titania hybrid functional nanoparticles through a multistep microfluidic approach", CHEM. COMMUN., vol. 51, 2015, pages 15854 - 15857 |
| WANG YONGWEIJUN WANGBO ZHOUQIUJUN LU: "Monitoring storage time and quality attribute of egg based on electronic nose", ANALYTICA CHIMICA ACTA, vol. 650, 2009, pages 183 - 188, XP026542483, DOI: doi:10.1016/j.aca.2009.07.049 |
Cited By (20)
| Publication number | Priority date | Publication date | Assignee | Title |
|---|---|---|---|---|
| US20210311009A1 (en) * | 2018-07-31 | 2021-10-07 | Nec Corporation | Information processing apparatus, control method, and non-transitory storage medium |
| WO2020026326A1 (ja) * | 2018-07-31 | 2020-02-06 | 日本電気株式会社 | 情報処理装置、制御方法、及びプログラム |
| JP7140191B2 (ja) | 2018-07-31 | 2022-09-21 | 日本電気株式会社 | 情報処理装置、制御方法、及びプログラム |
| JP7074194B2 (ja) | 2018-07-31 | 2022-05-24 | 日本電気株式会社 | 情報処理装置、制御方法、及びプログラム |
| WO2020026327A1 (ja) * | 2018-07-31 | 2020-02-06 | 日本電気株式会社 | 情報処理装置、制御方法、及びプログラム |
| JPWO2020026326A1 (ja) * | 2018-07-31 | 2021-08-02 | 日本電気株式会社 | 情報処理装置、制御方法、及びプログラム |
| JPWO2020026327A1 (ja) * | 2018-07-31 | 2021-08-02 | 日本電気株式会社 | 情報処理装置、制御方法、及びプログラム |
| JP7056747B2 (ja) | 2018-09-27 | 2022-04-19 | 日本電気株式会社 | 情報処理装置、処理装置、情報処理方法、処理方法、決定方法、およびプログラム |
| JPWO2020065807A1 (ja) * | 2018-09-27 | 2021-09-09 | 日本電気株式会社 | 情報処理装置、処理装置、情報処理方法、処理方法、決定方法、およびプログラム |
| CN113167717A (zh) * | 2018-11-26 | 2021-07-23 | 国立研究开发法人物质材料研究机构 | 液体试样分析方法和装置 |
| EP3889577A4 (en) * | 2018-11-26 | 2022-08-03 | National Institute for Materials Science | METHOD AND APPARATUS FOR LIQUID SAMPLE ANALYSIS |
| US11879863B2 (en) | 2018-11-26 | 2024-01-23 | National Institute For Materials Science | Method for analyzing liquid sample and apparatus |
| JP2021018211A (ja) * | 2019-07-23 | 2021-02-15 | サイマックス株式会社 | 健康モニタリングシステム、健康モニタリング方法および健康モニタリングプログラム |
| JPWO2021053758A1 (ja) * | 2019-09-18 | 2021-03-25 | ||
| WO2021053758A1 (ja) * | 2019-09-18 | 2021-03-25 | 日本電気株式会社 | データ処理装置、学習装置、データ処理方法、及び、記録媒体 |
| JP2022550531A (ja) * | 2019-10-02 | 2022-12-02 | エックス デベロップメント エルエルシー | 嗅覚センサシステム及び方法 |
| WO2021200262A1 (ja) * | 2020-03-30 | 2021-10-07 | 国立研究開発法人農業・食品産業技術総合研究機構 | サイレージ発酵品質評価方法及び装置 |
| JPWO2021200262A1 (ja) * | 2020-03-30 | 2021-10-07 | ||
| JP7320803B2 (ja) | 2020-03-30 | 2023-08-04 | 国立研究開発法人農業・食品産業技術総合研究機構 | サイレージ発酵品質評価方法及び装置 |
| WO2023037999A1 (ja) * | 2021-09-07 | 2023-03-16 | パナソニックIpマネジメント株式会社 | ガス分析方法及びガス分析システム |
Also Published As
| Publication number | Publication date |
|---|---|
| CN109923397A (zh) | 2019-06-21 |
| EP3550284B1 (en) | 2022-10-26 |
| EP3550284A4 (en) | 2020-09-30 |
| EP3550284A1 (en) | 2019-10-09 |
| JP6663151B2 (ja) | 2020-03-11 |
| JPWO2018101128A1 (ja) | 2019-06-27 |
| US20200075134A1 (en) | 2020-03-05 |
Similar Documents
| Publication | Publication Date | Title |
|---|---|---|
| JP6663151B2 (ja) | 試料に対応付けられた推定対象値を推定する方法及び装置 | |
| Shiba et al. | Data-driven nanomechanical sensing: Specific information extraction from a complex system | |
| Li et al. | The optoelectronic nose | |
| Minami et al. | Discrimination of structurally similar odorous molecules with various concentrations by using a nanomechanical sensor | |
| Hu et al. | Formaldehyde sensors based on nanofibrous polyethyleneimine/bacterial cellulose membranes coated quartz crystal microbalance | |
| Bordbar et al. | Structural elucidation and ultrasensitive analyses of volatile organic compounds by paper-based nano-optoelectronic noses | |
| LaGasse et al. | Colorimetric sensor arrays: Interplay of geometry, substrate and immobilization | |
| Shiba et al. | Functional nanoparticles-coated nanomechanical sensor arrays for machine learning-based quantitative odor analysis | |
| Jha et al. | Polyacrylic acid polymer and aldehydes template molecule based MIPs coated QCM sensors for detection of pattern aldehydes in body odor | |
| US11988662B2 (en) | Methods for detecting and quantifying gas species analytes using differential gas species diffusion | |
| Gholami et al. | Preparation of hollow porous molecularly imprinted and aluminum (III) doped silica nanospheres for extraction of the drugs valsartan and losartan prior to their quantitation by HPLC | |
| JP2008268170A (ja) | センサー | |
| Liu et al. | Preparation of molecularly imprinted polymer nanobeads for selective sensing of carboxylic acid vapors | |
| Macias et al. | Whisky tasting using a bimetallic nanoplasmonic tongue | |
| Chen et al. | Selective terpene vapor detection using molecularly imprinted polymer coated Au nanoparticle LSPR sensor | |
| Ahmadou et al. | Reduction of drift impact in gas sensor response to improve quantitative odor analysis | |
| Wong et al. | State-of-the-art of differential sensing techniques in analytical sciences | |
| Speller et al. | Assessment of QCM array schemes for mixture identification: Citrus scented odors | |
| JPWO2018221283A1 (ja) | 低吸湿性材料からなるナノメカニカルセンサ用受容体及びそれを受容体として使用するナノメカニカルセンサ | |
| Li et al. | A metal ion-regulated colorimetric sensor array: discriminating Chinese Baijiu from other beverages | |
| Xu et al. | Determination of quasi-primary odors by endpoint detection | |
| Minami et al. | Sorption-induced static mode nanomechanical sensing with viscoelastic receptor layers for multistep injection-purge cycles | |
| Shiba et al. | Odor-based nanomechanical discrimination of fuel oils using a single type of designed nanoparticles with nonlinear viscoelasticity | |
| Sun et al. | Hydrophobic and Rapid-Response Sensor Inks: Array-Based Fingerprinting of Perfumes | |
| EP3805730B1 (en) | Material analysis method and material analysis device |
Legal Events
| Date | Code | Title | Description |
|---|---|---|---|
| 121 | Ep: the epo has been informed by wipo that ep was designated in this application |
Ref document number: 17875540 Country of ref document: EP Kind code of ref document: A1 |
|
| ENP | Entry into the national phase |
Ref document number: 2018553801 Country of ref document: JP Kind code of ref document: A |
|
| NENP | Non-entry into the national phase |
Ref country code: DE |
|
| ENP | Entry into the national phase |
Ref document number: 2017875540 Country of ref document: EP Effective date: 20190701 |