WO2021200262A1 - サイレージ発酵品質評価方法及び装置 - Google Patents
サイレージ発酵品質評価方法及び装置 Download PDFInfo
- Publication number
- WO2021200262A1 WO2021200262A1 PCT/JP2021/011325 JP2021011325W WO2021200262A1 WO 2021200262 A1 WO2021200262 A1 WO 2021200262A1 JP 2021011325 W JP2021011325 W JP 2021011325W WO 2021200262 A1 WO2021200262 A1 WO 2021200262A1
- Authority
- WO
- WIPO (PCT)
- Prior art keywords
- silage
- gas
- fermentation quality
- surface stress
- stress sensor
- Prior art date
Links
- 239000004460 silage Substances 0.000 title claims abstract description 216
- 238000000855 fermentation Methods 0.000 title claims abstract description 101
- 230000004151 fermentation Effects 0.000 title claims abstract description 101
- 238000000034 method Methods 0.000 title claims abstract description 59
- 238000013441 quality evaluation Methods 0.000 title claims description 45
- 239000007789 gas Substances 0.000 claims abstract description 303
- 150000007524 organic acids Chemical class 0.000 claims abstract description 79
- 238000011156 evaluation Methods 0.000 claims abstract description 46
- QTBSBXVTEAMEQO-UHFFFAOYSA-N Acetic acid Chemical compound CC(O)=O QTBSBXVTEAMEQO-UHFFFAOYSA-N 0.000 claims description 72
- 238000010926 purge Methods 0.000 claims description 68
- 230000008859 change Effects 0.000 claims description 56
- FERIUCNNQQJTOY-UHFFFAOYSA-N Butyric acid Chemical compound CCCC(O)=O FERIUCNNQQJTOY-UHFFFAOYSA-N 0.000 claims description 50
- 239000000463 material Substances 0.000 claims description 47
- GWEVSGVZZGPLCZ-UHFFFAOYSA-N Titan oxide Chemical compound O=[Ti]=O GWEVSGVZZGPLCZ-UHFFFAOYSA-N 0.000 claims description 24
- 239000000203 mixture Substances 0.000 claims description 21
- -1 nitrogen-containing compound Chemical class 0.000 claims description 21
- 230000004044 response Effects 0.000 claims description 15
- 239000002131 composite material Substances 0.000 claims description 12
- 239000002105 nanoparticle Substances 0.000 claims description 12
- 229920000314 poly p-methyl styrene Polymers 0.000 claims description 8
- LBCHYKTUUMRFHG-UHFFFAOYSA-N 3,5-diphenyl-7-oxabicyclo[2.2.1]hepta-1(6),2,4-triene Chemical compound C=1C(C=2C=CC=CC=2)=C2OC=1C=C2C1=CC=CC=C1 LBCHYKTUUMRFHG-UHFFFAOYSA-N 0.000 claims description 6
- 239000007788 liquid Substances 0.000 claims description 6
- 229920002873 Polyethylenimine Polymers 0.000 claims description 5
- 239000004793 Polystyrene Substances 0.000 claims description 5
- 229920006217 cellulose acetate butyrate Polymers 0.000 claims description 5
- 229920001610 polycaprolactone Polymers 0.000 claims description 5
- 239000004632 polycaprolactone Substances 0.000 claims description 5
- 229920002223 polystyrene Polymers 0.000 claims description 5
- 239000007787 solid Substances 0.000 claims description 5
- 229920002620 polyvinyl fluoride Polymers 0.000 claims description 4
- 229920003229 poly(methyl methacrylate) Polymers 0.000 claims description 3
- 239000004926 polymethyl methacrylate Substances 0.000 claims description 3
- OMIHGPLIXGGMJB-UHFFFAOYSA-N 7-oxabicyclo[4.1.0]hepta-1,3,5-triene Chemical compound C1=CC=C2OC2=C1 OMIHGPLIXGGMJB-UHFFFAOYSA-N 0.000 claims 1
- 238000005259 measurement Methods 0.000 abstract description 139
- QJGQUHMNIGDVPM-UHFFFAOYSA-N nitrogen group Chemical group [N] QJGQUHMNIGDVPM-UHFFFAOYSA-N 0.000 abstract description 4
- 235000005985 organic acids Nutrition 0.000 description 34
- 238000002347 injection Methods 0.000 description 25
- 239000007924 injection Substances 0.000 description 25
- IJGRMHOSHXDMSA-UHFFFAOYSA-N Atomic nitrogen Chemical compound N#N IJGRMHOSHXDMSA-UHFFFAOYSA-N 0.000 description 20
- 239000007864 aqueous solution Substances 0.000 description 20
- QGZKDVFQNNGYKY-UHFFFAOYSA-N Ammonia Chemical compound N QGZKDVFQNNGYKY-UHFFFAOYSA-N 0.000 description 16
- JVTAAEKCZFNVCJ-UHFFFAOYSA-N lactic acid Chemical compound CC(O)C(O)=O JVTAAEKCZFNVCJ-UHFFFAOYSA-N 0.000 description 16
- 230000000875 corresponding effect Effects 0.000 description 12
- 239000012528 membrane Substances 0.000 description 10
- 239000000126 substance Substances 0.000 description 10
- 238000004458 analytical method Methods 0.000 description 9
- 229910052757 nitrogen Inorganic materials 0.000 description 9
- 229910021529 ammonia Inorganic materials 0.000 description 8
- 239000004310 lactic acid Substances 0.000 description 8
- 235000014655 lactic acid Nutrition 0.000 description 8
- 238000010801 machine learning Methods 0.000 description 7
- 238000005070 sampling Methods 0.000 description 7
- 239000013076 target substance Substances 0.000 description 7
- XLYOFNOQVPJJNP-UHFFFAOYSA-N water Substances O XLYOFNOQVPJJNP-UHFFFAOYSA-N 0.000 description 7
- 235000019645 odor Nutrition 0.000 description 6
- 230000002411 adverse Effects 0.000 description 5
- XBDQKXXYIPTUBI-UHFFFAOYSA-N dimethylselenoniopropionate Natural products CCC(O)=O XBDQKXXYIPTUBI-UHFFFAOYSA-N 0.000 description 5
- 239000000284 extract Substances 0.000 description 5
- 238000004519 manufacturing process Methods 0.000 description 5
- 239000002994 raw material Substances 0.000 description 5
- 241000283690 Bos taurus Species 0.000 description 4
- 238000003795 desorption Methods 0.000 description 4
- 230000000694 effects Effects 0.000 description 4
- 230000010365 information processing Effects 0.000 description 4
- 230000008569 process Effects 0.000 description 4
- 238000012545 processing Methods 0.000 description 4
- 230000008786 sensory perception of smell Effects 0.000 description 4
- 241001465754 Metazoa Species 0.000 description 3
- XUIMIQQOPSSXEZ-UHFFFAOYSA-N Silicon Chemical compound [Si] XUIMIQQOPSSXEZ-UHFFFAOYSA-N 0.000 description 3
- 239000002253 acid Substances 0.000 description 3
- 125000004432 carbon atom Chemical group C* 0.000 description 3
- 238000010586 diagram Methods 0.000 description 3
- 238000005516 engineering process Methods 0.000 description 3
- 230000006872 improvement Effects 0.000 description 3
- 229920006395 saturated elastomer Polymers 0.000 description 3
- 229910052710 silicon Inorganic materials 0.000 description 3
- 239000010703 silicon Substances 0.000 description 3
- 238000001179 sorption measurement Methods 0.000 description 3
- 238000002336 sorption--desorption measurement Methods 0.000 description 3
- 238000003860 storage Methods 0.000 description 3
- NQPDZGIKBAWPEJ-UHFFFAOYSA-N valeric acid Chemical compound CCCCC(O)=O NQPDZGIKBAWPEJ-UHFFFAOYSA-N 0.000 description 3
- 241000209504 Poaceae Species 0.000 description 2
- 241000282849 Ruminantia Species 0.000 description 2
- VYPSYNLAJGMNEJ-UHFFFAOYSA-N Silicium dioxide Chemical class O=[Si]=O VYPSYNLAJGMNEJ-UHFFFAOYSA-N 0.000 description 2
- 235000002017 Zea mays subsp mays Nutrition 0.000 description 2
- 241000482268 Zea mays subsp. mays Species 0.000 description 2
- 230000008901 benefit Effects 0.000 description 2
- 238000006243 chemical reaction Methods 0.000 description 2
- 238000004891 communication Methods 0.000 description 2
- 150000001875 compounds Chemical class 0.000 description 2
- 230000002596 correlated effect Effects 0.000 description 2
- 229910001873 dinitrogen Inorganic materials 0.000 description 2
- 238000007429 general method Methods 0.000 description 2
- 230000020169 heat generation Effects 0.000 description 2
- 244000144972 livestock Species 0.000 description 2
- 238000000691 measurement method Methods 0.000 description 2
- 238000000879 optical micrograph Methods 0.000 description 2
- 235000019260 propionic acid Nutrition 0.000 description 2
- IUVKMZGDUIUOCP-BTNSXGMBSA-N quinbolone Chemical compound O([C@H]1CC[C@H]2[C@H]3[C@@H]([C@]4(C=CC(=O)C=C4CC3)C)CC[C@@]21C)C1=CCCC1 IUVKMZGDUIUOCP-BTNSXGMBSA-N 0.000 description 2
- 230000002123 temporal effect Effects 0.000 description 2
- BJEPYKJPYRNKOW-REOHCLBHSA-N (S)-malic acid Chemical compound OC(=O)[C@@H](O)CC(O)=O BJEPYKJPYRNKOW-REOHCLBHSA-N 0.000 description 1
- JLBJTVDPSNHSKJ-UHFFFAOYSA-N 4-Methylstyrene Chemical compound CC1=CC=C(C=C)C=C1 JLBJTVDPSNHSKJ-UHFFFAOYSA-N 0.000 description 1
- DUGLMATUSUVYMV-UHFFFAOYSA-N 7-oxabicyclo[2.2.1]hepta-1,3,5-triene Chemical compound C1=C(O2)C=CC2=C1 DUGLMATUSUVYMV-UHFFFAOYSA-N 0.000 description 1
- 244000025254 Cannabis sativa Species 0.000 description 1
- OKTJSMMVPCPJKN-UHFFFAOYSA-N Carbon Chemical compound [C] OKTJSMMVPCPJKN-UHFFFAOYSA-N 0.000 description 1
- KDYFGRWQOYBRFD-UHFFFAOYSA-N Succinic acid Natural products OC(=O)CCC(O)=O KDYFGRWQOYBRFD-UHFFFAOYSA-N 0.000 description 1
- BJEPYKJPYRNKOW-UHFFFAOYSA-N alpha-hydroxysuccinic acid Natural products OC(=O)C(O)CC(O)=O BJEPYKJPYRNKOW-UHFFFAOYSA-N 0.000 description 1
- XKMRRTOUMJRJIA-UHFFFAOYSA-N ammonia nh3 Chemical compound N.N XKMRRTOUMJRJIA-UHFFFAOYSA-N 0.000 description 1
- 238000013459 approach Methods 0.000 description 1
- KDYFGRWQOYBRFD-NUQCWPJISA-N butanedioic acid Chemical compound O[14C](=O)CC[14C](O)=O KDYFGRWQOYBRFD-NUQCWPJISA-N 0.000 description 1
- 238000004364 calculation method Methods 0.000 description 1
- 229910052799 carbon Inorganic materials 0.000 description 1
- 239000013626 chemical specie Substances 0.000 description 1
- 239000011248 coating agent Substances 0.000 description 1
- 238000000576 coating method Methods 0.000 description 1
- 238000009833 condensation Methods 0.000 description 1
- 230000005494 condensation Effects 0.000 description 1
- 230000001276 controlling effect Effects 0.000 description 1
- 238000001816 cooling Methods 0.000 description 1
- 239000013078 crystal Substances 0.000 description 1
- 238000005520 cutting process Methods 0.000 description 1
- 238000011982 device technology Methods 0.000 description 1
- 235000013325 dietary fiber Nutrition 0.000 description 1
- 238000009792 diffusion process Methods 0.000 description 1
- 238000004821 distillation Methods 0.000 description 1
- 238000001704 evaporation Methods 0.000 description 1
- 230000003203 everyday effect Effects 0.000 description 1
- 238000002474 experimental method Methods 0.000 description 1
- 235000013305 food Nutrition 0.000 description 1
- 230000036541 health Effects 0.000 description 1
- 244000038280 herbivores Species 0.000 description 1
- 239000011261 inert gas Substances 0.000 description 1
- 230000003993 interaction Effects 0.000 description 1
- 230000007774 longterm Effects 0.000 description 1
- 239000001630 malic acid Substances 0.000 description 1
- 235000011090 malic acid Nutrition 0.000 description 1
- 238000002360 preparation method Methods 0.000 description 1
- 238000011160 research Methods 0.000 description 1
- 230000000630 rising effect Effects 0.000 description 1
- 239000004065 semiconductor Substances 0.000 description 1
- 230000035945 sensitivity Effects 0.000 description 1
- 238000005507 spraying Methods 0.000 description 1
- 230000000087 stabilizing effect Effects 0.000 description 1
- 238000001256 steam distillation Methods 0.000 description 1
- 229920003002 synthetic resin Polymers 0.000 description 1
- 239000000057 synthetic resin Substances 0.000 description 1
- 230000036962 time dependent Effects 0.000 description 1
- 238000006276 transfer reaction Methods 0.000 description 1
- 238000011144 upstream manufacturing Methods 0.000 description 1
- 229940070710 valerate Drugs 0.000 description 1
- 229940005605 valeric acid Drugs 0.000 description 1
- 229920002554 vinyl polymer Polymers 0.000 description 1
- 239000002699 waste material Substances 0.000 description 1
Images


Classifications
-
- G—PHYSICS
- G01—MEASURING; TESTING
- G01N—INVESTIGATING OR ANALYSING MATERIALS BY DETERMINING THEIR CHEMICAL OR PHYSICAL PROPERTIES
- G01N33/00—Investigating or analysing materials by specific methods not covered by groups G01N1/00 - G01N31/00
- G01N33/0004—Gaseous mixtures, e.g. polluted air
- G01N33/0009—General constructional details of gas analysers, e.g. portable test equipment
- G01N33/0027—General constructional details of gas analysers, e.g. portable test equipment concerning the detector
- G01N33/0036—Specially adapted to detect a particular component
- G01N33/0047—Specially adapted to detect a particular component for organic compounds
-
- A—HUMAN NECESSITIES
- A23—FOODS OR FOODSTUFFS; TREATMENT THEREOF, NOT COVERED BY OTHER CLASSES
- A23K—FODDER
- A23K30/00—Processes specially adapted for preservation of materials in order to produce animal feeding-stuffs
- A23K30/10—Processes specially adapted for preservation of materials in order to produce animal feeding-stuffs of green fodder
- A23K30/15—Processes specially adapted for preservation of materials in order to produce animal feeding-stuffs of green fodder using chemicals or microorganisms for ensilaging
-
- A—HUMAN NECESSITIES
- A23—FOODS OR FOODSTUFFS; TREATMENT THEREOF, NOT COVERED BY OTHER CLASSES
- A23K—FODDER
- A23K50/00—Feeding-stuffs specially adapted for particular animals
- A23K50/10—Feeding-stuffs specially adapted for particular animals for ruminants
-
- G—PHYSICS
- G01—MEASURING; TESTING
- G01N—INVESTIGATING OR ANALYSING MATERIALS BY DETERMINING THEIR CHEMICAL OR PHYSICAL PROPERTIES
- G01N33/00—Investigating or analysing materials by specific methods not covered by groups G01N1/00 - G01N31/00
- G01N33/0004—Gaseous mixtures, e.g. polluted air
- G01N33/0009—General constructional details of gas analysers, e.g. portable test equipment
- G01N33/0027—General constructional details of gas analysers, e.g. portable test equipment concerning the detector
- G01N33/0036—Specially adapted to detect a particular component
- G01N33/0037—Specially adapted to detect a particular component for NOx
-
- Y—GENERAL TAGGING OF NEW TECHNOLOGICAL DEVELOPMENTS; GENERAL TAGGING OF CROSS-SECTIONAL TECHNOLOGIES SPANNING OVER SEVERAL SECTIONS OF THE IPC; TECHNICAL SUBJECTS COVERED BY FORMER USPC CROSS-REFERENCE ART COLLECTIONS [XRACs] AND DIGESTS
- Y02—TECHNOLOGIES OR APPLICATIONS FOR MITIGATION OR ADAPTATION AGAINST CLIMATE CHANGE
- Y02P—CLIMATE CHANGE MITIGATION TECHNOLOGIES IN THE PRODUCTION OR PROCESSING OF GOODS
- Y02P60/00—Technologies relating to agriculture, livestock or agroalimentary industries
- Y02P60/80—Food processing, e.g. use of renewable energies or variable speed drives in handling, conveying or stacking
- Y02P60/87—Re-use of by-products of food processing for fodder production
Definitions
- the present invention relates mainly to silage used as feed for cattle, and particularly to evaluation of fermentation quality of silage during the manufacturing process or storage of silage.
- a large amount of silage fermented from pasture, grasses, grasses, and waste from the food processing process is used as feed for domestic ruminants such as cattle and other herbivores. Fermentation during the production of silage is mainly lactic acid fermentation, but fermentation other than lactic acid fermentation also proceeds depending on the fermentation conditions and subsequent storage conditions, and in some cases, rot may occur.
- the fermentation quality deteriorates, that is, fermentation or decay other than lactic acid fermentation causes an increase in volatile basic nitrogen such as butyric acid and valerate, which has a large number of carbon atoms, and ammonia
- the silage animal causes an increase in silage. It becomes a silage that I don't like. Also, if ruminants ingest such low quality silage, it can be harmful to their health. Therefore, it is important for the livestock industry to inspect and control the fermentation quality of silage in the process of manufacturing, storing, distributing and using silage.
- Non-Patent Document 1 The V score evaluates fermentation quality on a scale of 100 points, but 50 points are allocated and the remaining 50 points are organic, assuming that the value of ammonia nitrogen content (VBN) / total nitrogen content (TN) should be small. It is distributed to acid (VFA). As for the score for organic acids, the smaller the organic acid having butyric acid or higher carbon number (that is, C4 or higher), the higher the score (out of 40 points), and the lower the acetic acid + propionic acid content, the higher the score (10). Perfect score). Then, the V score is calculated as the total of these evaluation points.
- Patent Document 1 in order to evaluate the fermentation quality of silage coated with a synthetic resin film, the change over time in the ammonia concentration in the gas leaked to the outside of the coating was observed, and the increase / decrease was observed. It describes how to evaluate the quality.
- the present invention evaluates the fermentation quality of silage at that time by detecting volatile components (odor) from silage with a surface stress sensor, and also provides an apparatus for this evaluation.
- the challenge is to provide it.
- the gas generated from the silage is given to the surface stress sensor, and the signal output from the surface stress sensor in response to the gas generated from the silage is used to generate the gas from the silage.
- a silage fermentation quality evaluation method for evaluating the fermentation quality of the silage based on the composition of the gas is provided.
- the evaluation of the fermentation quality of the silage based on the composition of the gas generated from the silage may be based on at least the amount of one of the organic acid and the nitrogen-containing compound in the gas.
- the evaluation of the fermentation quality may be performed based on the time-varying pattern of the signal.
- the fermentation quality may be evaluated based on the evaluation of the influence of the amount of butyric acid in the gas generated from the silage on the pattern of time change. Further, the fermentation quality may be evaluated based on the evaluation of the influence of the amount of acetic acid in the gas generated from the silage on the pattern of time change.
- the surface stress sensor uses the gas obtained by passing a gas containing substantially no component affecting the evaluation of fermentation quality through the container containing the silage to be evaluated as the gas generated from the silage. May be supplied to. Further, the fermentation quality of the silage may be evaluated by using the signal after the gas generated from the silage is started to be supplied to the surface stress sensor. Further, the surface stress sensor may be a film type surface stress sensor.
- the material of the sensitive film of the surface stress sensor is selected from the group consisting of Poly (methyl vinyl ether-alt-maleic anhydride), Poly (2,6-diphenyl-p-phenylene oxide) and Poly (4-methylstyrene). You may use at least one. Further, as the material of the sensitive film of the surface stress sensor, Polymethylryl, Poly (4-methylstyrene), phenyl group-modified silica / titania composite nanoparticles, octadecyl group-modified silica / titania composite nanoparticles, Poly (2,6-diphenyl-).
- At least one selected from the group consisting of p-phenylene oxide), Polyvinyl condensation, Polystyrene, Polycaprolactone, Cellulose acetate butyrate, Polyethyleneimine, and tetraethoxysilane modified silica / titania composite nanoparticles may be used.
- a first surface stress sensor using one material selected from the above group for the sensitive film and a second surface using another material selected from the above group as the sensitive film. At least a stress sensor may be used as the surface stress sensor.
- the gas generated from the silage and the purge gas are alternately applied to the surface stress sensor, and the signal corresponding to the gas generated from the silage and the signal corresponding to the purge gas are used to obtain the fermentation quality of the silage. May be evaluated. Further, in addition to the time interval for supplying the gas generated from the silage to the surface stress sensor and the time interval for applying the purge gas to the surface stress sensor, a time interval for applying a predetermined standard gas to the surface stress sensor is provided. , The signal corresponding to the standard gas may be further used in assessing the fermentation quality of the silage. Further, the standard gas may be a gas generated from a liquid or a solid.
- the gas generated from the silage may be supplied to an additional gas sensor, and the fermentation quality of the silage may be evaluated based on the signal from the surface stress sensor and the signal from the additional gas sensor.
- at least one surface stress sensor, a first gas flow path for supplying the sample gas generated from the silage to be measured, and a purge gas containing no gas component to be measured are supplied.
- a second gas flow path is provided, and the sample gas supplied from the first gas flow path and the purge gas supplied from the second gas flow path are alternately switched to the at least one surface stress sensor.
- an additional gas sensor and an additional gas flow path for supplying the sample gas to the additional gas sensor are provided, based on the signal from the at least one surface stress sensor and the signal from the additional gas sensor.
- the fermentation quality of the silage may be evaluated.
- at least one surface stress sensor, a first gas flow path for supplying the sample gas generated from the silage to be measured, and a purge gas containing no gas component to be measured are supplied.
- a second gas flow path and a third gas flow path for supplying a standard gas having a predetermined component composition are provided, and a sample gas supplied from the first gas flow path and the second gas flow path are provided.
- the purge gas supplied from the path and the standard gas supplied from the third gas flow path are switched in a predetermined order and supplied to the at least one surface stress sensor to generate a signal from the at least one surface stress sensor.
- This provides a silage fermentation quality evaluation device that performs any of the above silage fermentation quality evaluation methods.
- an additional gas sensor and an additional gas flow path for supplying the sample gas to the additional gas sensor are provided, based on the signal from the at least one surface stress sensor and the signal from the additional gas sensor.
- the fermentation quality of the silage may be evaluated.
- the composition of organic acid which is one of the important evaluation items for the fermentation quality of silage, for example, the ratio of butyric acid and acetic acid in the gas volatilized from silage can be easily evaluated.
- the ratio of the C2 and C3 components in the organic acid generated by the fermentation of silage to the components of C4 and above and the amount of the C2 and C3 components can be easily determined.
- the fermentation quality of silage can be comprehensively evaluated from the output signals from a plurality of surface stress sensors coated with a sensitive film capable of detecting organic acids, volatile basic nitrogen and the like with high sensitivity.
- the surface stress sensor can detect multiple target substances with one sensitive film by selecting an appropriate sensitive film material, but the sensor's response to each target substance should have different amplitudes and response waveforms. Therefore, by combining a plurality of surface stress sensor outputs, it is possible to obtain a fermentation quality evaluation value in which parameters corresponding to a plurality of target substances are appropriately combined.
- Example 1 the time change (unit: mV) of the signal (unit: mV) from the MSS of ChA when a 1% aqueous solution of each organic acid was contained in a vial and measured by the measuring device shown in FIG.
- FIG. 5 by the same procedure as the case of FIG.
- the figure which shows the result of having individually contained the silage to be measured which is the same as the measurement of FIG.
- It is a figure which shows the result of having measured the mixed organic acid aqueous solution (pseudo silage aqueous solution) which has the same organic acid composition as the extract of silage to be measured which is the same as the measurement of FIG. 5 by the same procedure as the case of FIG.
- FIG. 1 The figure which shows the result of having individually contained the silage to be measured which is the same as the measurement of FIG.
- the three types of silage samples to be measured which are the same as the measurement in FIG.
- the three types of silage samples to be measured which are the same as the measurement in FIG. 13
- ⁇ Criteria 1 The value of the ratio of the amount of an organic acid having 4 or more carbon atoms (hereinafter referred to as C4) in the molecule to the amount of an organic acid having 2 or 3 carbon atoms (hereinafter referred to as C2 and C3, respectively) is Large silage is of poor quality (evaluation from this point of view is also called C4 evaluation).
- C4 evaluation The value of the ratio of the amount of an organic acid having 4 or more carbon atoms (hereinafter referred to as C4) in the molecule to the amount of an organic acid having 2 or 3 carbon atoms (hereinafter referred to as C2 and C3, respectively) is Large silage is of poor quality (evaluation from this point of view is also called C4 evaluation).
- C4 evaluation the amount of an organic acid having 4 or more carbon atoms
- Silage with a large amount of organic acids with 2 or 3 carbons is also of poor quality (evaluation from this point of view is also called C2 + C3 evaluation). Is said to be.
- the inventor of the present application was inspired by the idea of evaluating silage quality by detecting the amount of various organic acids in such silage with a surface stress sensor, and as a result of proceeding with research, the present invention was completed. ..
- At least one surface stress sensor is provided in which the response characteristics to at least one of the organic acids belonging to C2 and / or C3 and the response characteristics to at least one of the organic acids belonging to C4 are different.
- the silage is evaluated based on the output of such a surface stress sensor. More specifically, the output of the surface stress sensor is evaluated for at least one of the above criteria 1 and 2, and the silage is evaluated from the result.
- individual surface stress sensors may be provided corresponding to individual organic acids.
- the amount of a smaller number of representative organic acids and the mutual ratio are obtained. May be good. This is because the reaction to produce these organic acids and the composition of the raw materials are not so flexible, so the amount of one component is not completely independent of the amount of other similar components.
- acetic acid may be used as a representative component as C2 + C3
- butyric acid may be used as a representative component as C4. If the representative component is selected in this way, acetic acid and butyric acid have the highest volatility in each group of organic acids and are easily detected as gas, which is advantageous in measurement.
- the fermentation quality of silage is evaluated solely by measuring the amount and ratio of various organic acids volatilized from silage
- the components to be measured are not limited to this. No.
- silage fermentation quality evaluation can be realized by obtaining the amount and the ratio between the components of both the organic acid and nitrogen-containing compounds categories.
- knowing only one of them can evaluate the fermentation quality of silage to a fairly practical degree.
- the bark score described in Non-Patent Document 2 evaluates based on the composition of organic acids such as lactic acid, acetic acid, and butyric acid, but as explained there, it also depends on the silage production conditions and fermentation conditions.
- organic acids such as lactic acid, acetic acid, and butyric acid
- the difference from the V score becomes large, etc.
- nitrogen in many cases nitrogen.
- Good quality evaluation that is well correlated with the V score that measures up to the contained compound becomes possible.
- butyric acid concentration which is reported to increase the risk of illness when the intake is high (45 g / day or more)
- more accurate and stable quality evaluation can be performed by measuring the amount of an organic acid selected from C2 + C3 organic acids, for example, acetic acid as shown in Examples.
- the organic acid is added to or in place of the measurement of the organic acid and / or the nitrogen-containing compound. It is also possible to evaluate the silage quality by measuring components other than the compounds containing nitrogen and nitrogen.
- the surface stress sensor can obtain response signals (also called signals) for a plurality of target substances from one sensitive film in a form in which they are superimposed. That is, by appropriately selecting the sensitive film material for many target substances, the amplitude and response waveform of the surface stress sensor can be made different from each other in the response of the surface stress sensor to each target substance. Therefore, by combining a plurality of surface stress sensor outputs, it is possible to obtain a fermentation quality evaluation value in which parameters corresponding to a plurality of target substances are appropriately combined. At this time, as described above, by performing pattern matching and machine learning of the output of the surface stress sensor, features can be appropriately extracted from these outputs, and the surface stress can be obtained by using a relatively small number of surface stress sensors.
- silage fermentation quality evaluation based on more parameters than the number of sensors.
- other types of gas sensors that are particularly convenient for detecting specific components that are present in the gas generated from the measurement target and are useful for silage quality evaluation can be used.
- such a gas sensor can be used in combination with the surface stress sensor, if necessary.
- FIG. 1 shows an outline of a measurement system configuration that can be used for this purpose.
- a film-type surface stress sensor MMS
- the two gas flow paths are not the gas components to be measured as shown by the white arrows from the left side of the figure, respectively, and the measurement of such gas components is not affected as much as possible.
- an inert gas also called purge gas or reference gas.
- purge gas for example, nitrogen gas or air can be used, but here, nitrogen gas was used.
- the gas flow path shown on the upper side gives the MSS a purge gas that does not contain a gas component to be measured, thereby desorbing various gases diffused in the sensitive film coated on the surface of the MSS. Perform a purge process to initialize the MSS.
- the gas flow passing through the gas flow path on the lower side of FIG. 1 is supplied to the MSS in a state of containing the gas component volatilized from the sample in the vial placed immediately after the MFC.
- a configuration that does not use a vial can be adopted.
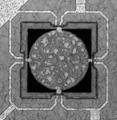
- FIG. 2 An example of an optical micrograph of MSS is shown in FIG.
- the MSS shown in FIG. 2 is formed from a silicon wafer used in the field of semiconductor device technology, which is cut out from a silicon single crystal, and a circular portion in the center (may be another shape such as a square) is around the silicon wafer. It is connected and fixed to the frame-shaped portion of the circular portion at four places on the top, bottom, left and right of the circular portion.
- the gas component given to the MSS is adsorbed and desorbed on the sensitive film applied to the surface of the circular portion, so that the surface stress applied to the MSS is concentrated in these four fixed regions and is provided in these fixed regions.
- a change in the electrical resistance of the piezoresistive element is brought about.
- piezoresistive elements are interconnected by a conductive region (shown as a grain-like region in FIG. 2) provided in the frame-shaped portion to form a Wheatstone bridge.
- a voltage is applied between the two opposing nodes of the Wheatstone bridge, and the voltage appearing between the remaining two nodes is taken out of the MSS as a signal output from the MSS to perform the required analysis.
- the structure and operation of such an MSS are described in detail in Patent Document 3, for example.
- the sensitive film is widely applied not only to the circular portion of the MSS but also to the surface of the MSS chip including the frame-shaped portion. This is a state seen when the sensitive film is applied by spray coating, but since the sensitive film applied to the frame-shaped part etc.
- FIG. 3 shows a conceptual diagram of the time change of the signal intensity when the sample gas is applied to a surface stress sensor such as MSS.
- FIG. 3A shows on the time axis whether the gas given to the MSS is a sample gas or a purge gas.
- the concentration of the gas to be measured in the gas given to the MSS is a concentration Cg larger than 0 during the sample gas injection period in which the sample gas is given, and the gas flow path on the downstream side is given by giving the purge gas.
- the sample gas concentration becomes 0 during the purging period in which the sample gas inside is flushed away and the sample gas component adsorbed on the sensitive film of the MSS (and the tube wall of the gas flow path, etc.) is desorbed.
- FIG. 3 (b) shows the intensity of the signal from the MSS when the type of gas shown in FIG. 3 (a) is switched, with the time axis aligned with that of FIG. 3 (a).
- the signal intensity is governed by many factors, but basically between the gas and the sensitive film caused by the difference between the concentration of the component in the gas near the sensitive film on the MSS and the concentration of the same component on the surface of the sensitive film.
- the speed of adsorption and desorption of the relevant component is a major factor. Therefore, the signal intensity starts immediately after the gas is switched as shown in FIG. 3A, and becomes close to a curve that exponentially asymptotically approaches the upper and lower saturation values.
- FIG. 3B shows the curve in an ideal case.
- the actual shape of the curve, the maximum value of the curve, etc. may vary considerably depending on the rate of adsorption / desorption to the sensitive film and the type of component adsorbed / desorbed to the sensitive film, and the range of signal change may also differ significantly. many. Furthermore, the signal may show more complicated changes over time due to the viscoelastic properties of the sensitive membrane, the diffusion of the gas to be measured into the sensitive membrane, or the physicochemical interaction between the sensitive membrane material and the gas to be measured. be. In this way, it is possible to obtain the amount / concentration of each principal component in the sample, the ratio between the plurality of components, and the like based on the time-dependent change and amplitude of the signal from the MSS.
- a surface stress sensor coated with an appropriately selected material from these materials can be used alone to measure the gas obtained from silage, or a plurality of types of surface stress sensors coated with different materials can be used in the same manner. By making various measurements, it is possible to make an evaluation based on the desired characteristics of silage.
- the adsorption / desorption characteristics of the material forming the sensitive film are various, and there are also sensitive film materials that show a response that deviates from the above-mentioned simplified model.
- it can be said that it is often useful to make the first examination using the above model.
- the sample gas injection period and the purge period are often set to the same time length.
- the purge period may be longer than the sample gas injection period if better results can be obtained by sufficiently desorbing the components adsorbed on the sensitive membrane from the sample gas.
- the purge period can be lengthened by setting the above ratio to 1: 2.
- the measurement is performed based on the measurement sequence of switching between the sample gas and the purge gas, but the present invention is not limited thereto.
- a measurement of another gas (standard gas) containing a component contained in the sample gas whose concentration may affect the fermentation quality evaluation of the silage is inserted into the measurement sequence to form three types of gases. Fermentation quality evaluation can be performed based on the signal from the switching measurement.
- a standard gas for example, a standard silage may be assumed, and a gas having the same component composition as the sample gas component generated from the standard silage may be used as the standard gas.
- a gas having the same composition for some components of the sample gas assumed as such for example, a component for which a slight difference in the amount of components is desired to be measured with particularly high accuracy
- Various compositions can be set accordingly.
- these three types of gas supply sequences are appropriately set in consideration of various measurement requirements and constraint conditions. For example, a measurement sequence involving repetition of gas supply time intervals such as: A. Supply purge gas ⁇ [Supply one of sample gas and standard gas ⁇ Supply purge gas ⁇ Supply the other of sample gas and standard gas ⁇ Supply purge gas] (or repeat in []) B.
- Supply purge gas ⁇ [Supply sample gas and standard gas alternately ⁇ Supply purge gas] (or repeat in [])
- Supply purge gas ⁇ [Repeat alternating supply of sample gas and standard gas and purge gas ⁇
- Supply purge gas ⁇ Repeat alternating supply of sample gas and standard gas and purge gas] (or repeat in [] )
- various gas supply sequences in the gas supply time section can be considered. In any gas supply sequence, it is considered that the measurement conditions such as temperature, gas pressure / flow rate, and change in sensor characteristics over time do not change significantly within the sequence during the series of measurement sequences. , The minute difference in composition between the two gases can be measured accurately, and the influence of disturbance on the measurement result can be reduced, so that the stability of measurement can be improved.
- the standard gas may be prepared in a gaseous state from the beginning, or may be introduced into the gas supply system by evaporating from a liquid or a solid like the sample gas.
- another gas such as a purge gas may be mixed with the gas generated from the initially prepared gas or liquid / solid.
- the three flow paths may be merged at one place, or a part of the upstream side of the sample gas flow path may be merged.
- a configuration is also conceivable in which a standard gas flow path is configured, and after the standard gas is introduced into the standard gas flow path, both gas flow paths are merged before the confluence point with the purge gas.
- the sensitive film material is not intended to be limited to this, but in one exemplary embodiment, Poly (methyl vinyl ether-alt-maleic anhydride), Poly (2,6-diphenyl-p-phenylene) At least one selected from the group consisting of oxide) and Poly (4-methylstyrene) can be used. In another embodiment, Polymethylmethacrylate, Poly (4-methylstyrene), phenyl group-modified silica / titania composite nanoparticles, octadecyl group-modified silica / titania composite nanoparticles, Poly (2,6-diphenyl-p-phenylene oxide).
- Polyvinylfluoride, Polystyrene, Polycaprolactone, Cellulose acetate butyrate, Polyethyleneimine, and at least one selected from the group consisting of tetraethoxysilane-modified silica / titania composite nanoparticles can be used.
- one material may be used alone, or the first MSS using the selected one material for the sensitive membrane and the other selected from the above group.
- a second MSS that uses the same material as the sensitive film, a plurality of types of materials may be used in combination.
- the MSS used when a plurality of types of materials are used in combination is not limited to two, and a third, fourth or higher MSS is used, and the sensitive membranes of each MSS are selected from each other from the above group. It is also possible to use different materials.
- Example 1 In this embodiment, a measurement system whose schematic configuration is shown in FIG. 1 is housed in an incubator, and as a sample to be measured, an aqueous solution of an organic acid contained in a large amount in the silage and silage of various qualities are used. The measurement was carried out in a vial. The incubator temperature was set to 20 ° C, 30 ° C, and 45 ° C for measurement, but the best discriminability (the degree to which the difference in the sample appears as the difference in the MSS response signal waveform) is the best at 30 ° C. Therefore, the results of measurement with this temperature setting are shown below.
- the flow rates of the sample gas and the purge gas were measured in two ways, 10 sccm and 30 sccm, but the discriminating property was better at 10 sccm.
- the discriminability is considered to be greatly affected by the divergence rate of the sample gas, the adsorption rate of the sensitive film, and the flow rate. Therefore, the above reference to the discriminability is the conclusion that 10 sccm was higher than 30 sccm in the current measurement system. For example, if the thickness of the sensitive membrane or the amount of the sample to be collected changes, the optimum flow rate changes. there's a possibility that.
- 10 sccm which can suppress heat generation from the pump has a great merit.
- the measurement system used in this embodiment does not take measures against heat for the gas flow path such as mounting a cooling fan, it can be said that the above flow rate is a measurement condition suitable for such a measurement configuration.
- the measurement was performed in two ways of sampling time (time for performing sample gas injection in each measurement cycle) of 30 seconds and 120 seconds, but there was no difference in discriminability. The data below shows the data when the sampling time is 120 seconds.
- the measurement was performed with the ratio of the sampling time to the purge time (the time when the purge gas is given to the MSS in each measurement cycle and the purge is performed) at 1: 2.
- the purge time is shortened by setting the ratio of the sampling time to the purge time to 1: 1
- the purging that is, the desorption of the components adsorbed on the sensitive film on the MSS during the sample gas injection is not possible. It was confirmed that it became sufficient and the fluctuation of the baseline became large. For this reason, if only a short purge is performed, the discrimination accuracy may be adversely affected.
- the long measurement time not only has the inconvenience of reducing the measurement throughput itself, but also causes various parameters (flow velocity, gas pressure, temperature, etc.) of the environment inside and outside the measurement system to be measured for a long time.
- various parameters flow velocity, gas pressure, temperature, etc.
- the measurement system usually includes active parts such as a pump, a long-term temperature change due to heat generation in the future may adversely affect the accuracy. Therefore, in the present invention, it is desirable to allocate the measurement cycle time as short as possible within the range in which an effective signal value can be obtained for the sampling time, and to make the purge time as long as possible.
- aqueous solution of the organic acid As the aqueous solution of the organic acid, a single 1% aqueous solution of the organic acid was prepared, and these aqueous solutions were measured individually. Further, the silage was measured by containing the silage of a predetermined weight as it is in a vial without adding water or the like.
- the MSS used was actually an aggregate consisting of a plurality of MSS coated with different sensitive film materials, but among them, Poly (methyl vinyl ether-alt-maleic anhydride) was used as the sensitive film material.
- MSS No. ChA
- ChB sensitive film material: Poly (2,6-diphenyl-p-phenylene oxide)
- ChC sensitive film material: Poly
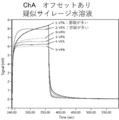
- the time change (unit: seconds) of the signal (unit: mV) from the MSS of ChA when a 1% aqueous solution of each organic acid is contained in a vial and measured by the measuring device shown in FIG. 1 is shown in FIG. Is shown.
- organic acids acetic acid, butyric acid, lactic acid, propionic acid and valeric acid were measured. Furthermore, for comparison, water before dissolving the organic acid was also measured.
- the purge gas was first flowed for 240 seconds, then the sample gas was flowed for 120 seconds, and then the purge gas was flown again for 240 seconds.
- the flow rate of the purge gas and the sample gas was 10 sccm. Also, as can be seen from FIG.
- each sample was measured twice and both results were plotted here.
- the same measurement sequence and flow rate were used.
- the signal for acetic acid was saturated in a short time, and about 60 seconds had passed after the start of the sample gas injection. After that, it shows a peculiar signal change (change with time) that the signal is greatly reduced.
- the signal to other organic acids such as butyric acid tends to decrease slightly from almost constant after saturation, or the signal increases slowly, so that at the end of the sample gas injection period (sample gas injection). The signal continues to increase even after 120 seconds have passed since the start. Since the lactic acid in the organic acid measured here is not volatile, its signal was almost the same as that of water.
- the MSS is a signal in which the responses of the individual components are superimposed while maintaining relatively linearity. It is shown in the table above to verify whether the contributions of the individual components cannot be easily separated by looking at the signals from the MSS because they influence each other.
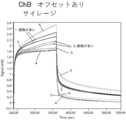
- FIG. 5 shows the results of measurement of a mixed organic acid aqueous solution (pseudo-silage aqueous solution) having an organic acid composition in the extracts of the silage samples 1 to 6 in the same procedure as in FIG.
- each pseudo silage is displayed by adding the character string "-VFA" after the sample number of the corresponding silage.
- the signal is the signal for each organic acid gas. It was confirmed that the change with time was almost the same as that of the linearly superimposed one. That is, the signal for 1-VFA corresponding to sample 1 with a high butyric acid concentration shows a slow rise similar to that of gas from a pure butyric acid aqueous solution, whereas the butyric acid concentration is low while the acetic acid concentration is low. The rise of the signal for 2-VFA corresponding to the higher sample 2 was as steep as the gas from pure aqueous acetic acid.
- the relatively large decrease in signal value seen in the signal for gas from pure acetic acid does not change much during the sample gas injection period, which is the signal for other gases. It appears in a slightly relaxed form due to superposition. Furthermore, the signals for 3-VFA, 4-VFA, and 5-VFA corresponding to the samples 3, 4 and 5, which have zero butyric acid concentration and low acetic acid concentration, are all raised in a relatively short time. , It was confirmed that the value was maintained at an almost constant value. It is considered that this is because the effect of butyric acid, which has the slowest increase in signal, is not present, and the effect of acetic acid, which turns into a rapid decrease in a relatively short time, is also very small.
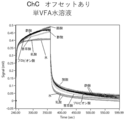
- silages 1 to 6 were individually housed in vials, and the same measurement was performed for the sample gas generated from each. The result is shown in FIG. However, in the measurements shown in FIGS. 4 and 5, individual organic acids or aqueous solutions of a plurality of kinds of organic acids were measured, but in the measurement of silage shown in FIG. 6, only the silage was contained in a vial by a predetermined weight. No liquids such as water or other substances were mixed.
- FIG. 6 which shows the signals from the actual silages
- FIG. 5 which shows the signals from the pseudo silages having the same organic acid composition as these silages
- the order between the actual silages when compared at the maximum value of the signals It can be seen that the characteristics described above for the temporal variation of the signal are almost the same between the actual silage and the pseudo silage, although the relationship and the order relationship between the pseudo silage are different. Therefore, it is possible to measure the amount and composition of various organic acids in silage by the characteristic of the time change pattern of the signal of the surface stress sensor such as MSS during the injection period of the gas generated from the silage itself. .. In particular, it can be seen that the measurement using ChA is particularly useful for the above-mentioned C4 evaluation.
- the amount of organic acid of C4 or higher such as butyric acid is evaluated, and if necessary, the amount of C2 and C3 organic acid such as acetic acid is further evaluated to evaluate the fermentation quality of silage by a simple procedure. be able to.
- the evaluation results of the signals for various silages and the amounts of butyric acid and acetic acid as explained above are V. It can also be seen that it has a high correlation with the score value. Further, as can be seen from the comparison result between FIGS.
- the result of measuring the gas generated from the organic acid mixed aqueous solution with a surface stress sensor such as MSS and the gas generated from the silage itself measured in the present invention Since the degree of agreement with the result measured by the surface stress sensor is also high, the calibration of the measurement system in the measurement of the present invention and the comparison with the evaluation result by the silage evaluation method using the existing silage extract as the measurement target. It also has the advantage of being easy to match.
- the silage evaluated in this example was produced by a general method using dent corn and pasture, and is a type widely used as feed for animals such as cattle. However, the method of the present invention is advantageously applied to other silages having different raw materials, fermentation methods, etc., or a wide range of silages such as fermented TMR (Total Mixed Ratios) obtained by secondary processing thereof. Is possible.
- FIG. 9 shows the time change of the signal when the actual silage (Samples 1 to 6) is measured using ChB, and the sample 1 containing a large amount of butyric acid, the sample 2 containing a large amount of acetic acid, and the sample 6 containing a large amount of C2 + C3 are shown.
- the rate of saturation of signal rise and fall is significantly different from each other. ..
- the silage of sample numbers 1, 2 and 6 has a relatively low saturation rate (saturation is slow) while the signals for other silages of sample numbers 3 to 5 are rapidly saturated after gas switching. Is).
- the silages of Samples 1, 2 and 6 clearly have a lower C2 + C3 rating than the other silages. Therefore, it can be said that the rate of saturation of the rising and falling ends of the ChB signal is strongly correlated with the C2 + C3 evaluation. Therefore, by using either or both of ChB and ChC MSS, it is possible to perform C2 + C3 evaluation of the silage to be measured.
- the time change pattern of the signal can be seen from FIGS. 9 and 12. Rather than being different from each other, this time variation is similar in the intensity direction of the signal (multiplying the temporal variation of the intensity of the signal from one sample by a constant and then translating in the intensity direction from another sample. It almost overlaps with the time change of the signal intensity of. Therefore, the silage evaluation system can be further enhanced by stabilizing the sample gas supply by making the amount of the sample used for the measurement as constant as possible, and by normalizing and standardizing the signal.
- Example 2 In this example, a measurement system whose schematic configuration is shown in FIG. 1 is housed in an incubator, and three types of silage different from those used in Example 1 are used as samples to be measured. The measurement was carried out in a bottle. Each silage was measured by containing the silage of a predetermined weight as it was in a vial without adding water or the like. The temperature of the incubator was 30 ° C., and the flow rates of the sample gas and the purge gas were 10 sccm. The sampling time was 120 seconds, and the ratio of the sampling time to the purge time was 1: 2.
- the temperature and relative humidity in the incubator may inevitably change slightly, but in this embodiment, the temperature and relative humidity in the incubator (in the module of the measurement system) at the time of measurement change. was limited to a range that could not be considered to have a significant effect on the measurement results.
- the sample gas and the purge gas to be measured are set to the same flow rate as the actual measurement, and the switching cycle of both gases is the same as the actual measurement.
- the operation was performed by setting and flowing to the measurement system.
- the measurement data can be made more stable (that is, the accuracy of the measurement data can be further improved).
- Such a preliminary operation is often performed in a measurement using an arbitrary gas as a sample to be measured, and the number of cycles (time) thereof is not particularly limited, but in this embodiment, 200 cycles (20 hours in total) are performed. )went.
- the measurement data shown in the first embodiment is also acquired after performing the same preliminary operation.
- the silages to be measured in this example are "high quality silage sample”, “low quality silage sample” and “high quality silage sample with reduced volatile components”.
- the "high quality silage sample” and the “low quality silage sample” are high quality as a result of evaluating the superiority or inferiority of the quality of the silage sample based on the result of the chemical analysis including the organic acid content shown in the table below, respectively.
- the "high quality silage sample with reduced volatile components” is a silage sample in which a certain amount of the above "high quality silage sample” is contained in a vial and exposed to purge gas for a certain period of time to reduce the volatile components. ..
- “high quality silage sample”, “low quality silage sample” and “high quality silage sample with reduced volatile components” are also referred to as sample 7, sample 8 and sample 9, respectively.
- the table below shows the measurement results of organic acids contained in samples 7-9.
- the MSS used was actually an aggregate consisting of a plurality of MSS coated with different sensitive film materials.
- the description will be made mainly based on the signals output from ChD, but the signals output from the remaining MSS will also be described with reference to them as appropriate.
- the number of each MSS and the applied sensitive film material are as follows.
- ChD Polymethylcrylic ChE: Poly (4-methylstyrene)
- ChF Phenyl group-modified silica / titania composite nanoparticles (hereinafter, also referred to as "Phenyl-STNPs”)
- ChG Octadecyl group-modified silica / titania composite nanoparticles (hereinafter, also referred to as "C18-STNPs”)
- ChH Poly (2,6-diphenyl-p-phenylene oxide) (Tenax TA (Mesh: 60/80))
- ChI Polyvinyl fluoride
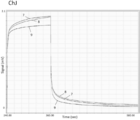
- ChJ Polystyrene
- ChK Polycaprolactone
- ChL Cellulose acetate butyrate
- ChM Polyethyleneimine
- ChN Tetraethoxysilane-modified silica / titania composite nanoparticles (hereinafter, also referred to as "TEOS-STNPs”)
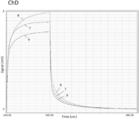
- FIG. 13 shows a signal (unit) from the MSS of ChD when three types of silage samples to be measured are individually contained in a vial and the sample gas generated from them is measured by the measuring device shown in FIG. Indicates the time change (unit: seconds) of mV).
- the purge gas was first flowed for 240 seconds, then the sample gas was flowed for 120 seconds, and then the purge gas was flowed again for 240 seconds.
- each sample is measured a plurality of times, and FIG. 13 shows representative data among the measurement results.
- the signal change (signal waveform) of the sample gas injection period 120 seconds is clearly different among the three types of silage samples. .. More specifically, in the measurement using ChD, in addition to being able to distinguish the difference between sample 7 and sample 8 in which the superiority or inferiority of the quality was identified by the chemical analysis, the same level of quality (high) was obtained by the chemical analysis. It was confirmed that the difference in the content of volatile components in the silage samples (Sample 7 and Sample 9) evaluated as (quality) can also be identified.
- the concentrations of acetic acid and butyric acid which are typical volatile components, were 57 ppm acetic acid and 21 ppm butyric acid in sample 7, 32 ppm acetic acid and 23 ppm butyric acid in sample 8, respectively.
- acetic acid was 16 ppm and butyric acid was 6 ppm, and the MSS signal is considered to reflect the difference in these concentrations.
- the rate of saturation of the signal fall during the purge period after the end of the sample gas injection period is also significantly different between the samples 7, the sample 8 and the sample 9.
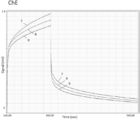
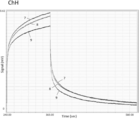
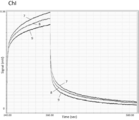
- the characteristics of the signal change (change with time) obtained from each MSS are different due to the difference in the sensitive film material used, but from FIGS. 14 to 23, even in the measurement using ChE to ChN, the sample gas It can be seen that the signal change (signal waveform) during the injection period (120 seconds) differs among the three types of silage samples.
- ChE sensitive film material: Poly (4-methylstyrene), the same material as ChC of Example 1
- ChH sensitive film material: Poly (2,6-diphenyl-p-phenylene oxide
- Example 1 In the measurement using ChB (same material as ChB), ChI (sensitive film material: Polyvinylfluoride), ChJ (sensitive film material: Polystyrene), ChL (sensitive film material: Cellulose acetate butyrate), ChM (sensitive film material: Polyethyleneimine) Similar to the measurement using ChD shown in FIG. 13, the signal change (signal waveform) of the sample gas injection period (120 seconds) is clearly different among the three types of silage samples (FIGS. 14, 17, 18). , 19, 21, 22).
- MSSs tended to differ in the rate of signal fall saturation during the purge period after the end of the sample gas injection period.
- ChE and ChI as in the case of ChD, a difference in the saturation rate of the signal fall was observed between Sample 7, Sample 8 and Sample 9, but ChH, ChJ,
- the rate of signal fall saturation of sample 7 and sample 8 was about the same or slightly different, whereas the signal fall saturation of sample 9 was saturated.
- the speed of sample 7 and sample 8 tended to be faster than that of sample 8.
- the sample gas injection period and the purge period after the end of the sample gas injection period were both significantly between the sample 7, the sample 8 and the sample 9. Different signal changes were seen (Fig. 15).
- ChG sensitive membrane material: C18-STNPs
- the signal change between the samples 7 and 8 and the sample 9 was more important than the difference in the signal change between the sample 7 and the sample 8 during the sample gas injection period. There was a tendency for the difference to be large.
- the purge period after the end of the sample gas injection period there was a difference in the rate of saturation of the signal fall between the sample 8 and the samples 7 and 9, and the superiority or inferiority of the quality was identified between the samples by chemical analysis.
- Sample 7, Sample 8 and Sample 9 showed a difference in signal change. Further, in the purge period after the end of the sample gas injection period, as in the case of ChG, a difference in the saturation rate of the signal fall between the sample 8 and the samples 7 and 9 was observed, and the quality was determined by chemical analysis. It was suggested that the differences between the samples whose superiority and inferiority were identified are distinguishable (Fig. 23).
- the silage evaluated in this example was produced by a general method using dent corn and pasture, as in the case of Example 1, and was used as feed for animals such as cattle. It is a type widely used as. Therefore, from the results of this example, the present invention is also applied to other silages having different raw materials, fermentation methods, etc., or a wide range of silages such as fermented TMR (Total Mixed Ratios) obtained by secondary processing thereof. It can be seen that it is possible to apply the method of.
- the time change pattern of the signal corresponding to the above as a reference pattern and performing pattern matching that is common in the measurement technology field in general, the time change pattern and the reference pattern of the signal obtained from the silence to be measured can be obtained. It may be collated.
- the silage quality can be evaluated from the time-varying pattern of the signal obtained from the silage by using a machine learning method that has become frequently used in the field of measurement technology in recent years. Such pattern matching, machine learning, etc.
- an information processing device provided in the measurement system, or an arbitrary information processing device such as an information processing device connected to the measurement system by an interface or a communication line. Can be executed. Since the principles of pattern matching and machine learning and the method of applying these to various measurement results are well-known matters, further description thereof will be omitted.
- the fermentation quality of silage can be evaluated in a short time by using a simple device configuration and a simple procedure as compared with the conventional case, so that the silage can be manufactured and distributed.
Landscapes
- Chemical & Material Sciences (AREA)
- Life Sciences & Earth Sciences (AREA)
- Engineering & Computer Science (AREA)
- Health & Medical Sciences (AREA)
- Food Science & Technology (AREA)
- Polymers & Plastics (AREA)
- General Health & Medical Sciences (AREA)
- Pathology (AREA)
- Analytical Chemistry (AREA)
- Biochemistry (AREA)
- Medicinal Chemistry (AREA)
- General Physics & Mathematics (AREA)
- Immunology (AREA)
- Physics & Mathematics (AREA)
- Combustion & Propulsion (AREA)
- Zoology (AREA)
- Animal Husbandry (AREA)
- Birds (AREA)
- Chemical Kinetics & Catalysis (AREA)
- General Chemical & Material Sciences (AREA)
- Microbiology (AREA)
- Measuring Or Testing Involving Enzymes Or Micro-Organisms (AREA)
Abstract
本発明は、サイレージの発酵品質を現場等で簡単に評価できるようにすることをその課題とする。本発明の一実施形態では、サイレージから発生するガスを表面応力センサに与えて、その中に含まれる有機酸及び窒素含有化合物の一方の量を求める。表面応力センサは簡単な装置構成と手順によりガス中の微量成分の検出を実現できる。そのため、これら成分の含有量と発酵品質との関係が既知であることを利用して、上記測定により発酵品質の評価を簡単に実現できる。
Description
本発明は主に牛の飼料として使用されるサイレージに関し、特にサイレージの製造過程あるいは保管中のサイレージの発酵品質の評価に関する。
牛などの飼育されている反芻動物そのほかの草食動物に与える飼料として、牧草、禾本科、マメ科等の植物、食品加工工程からの廃棄物等を発酵させたサイレージが大量に使用されている。サイレージを製造する際の発酵は主に乳酸発酵であるが、発酵条件やその後の保存条件により乳酸発酵以外の発酵も進行し、また場合によっては腐敗が起こることもある。発酵品質の劣化、すなわち乳酸発酵以外の発酵や腐敗等により、サイレージ中に酪酸、吉草酸などの炭素数の多いカルボン酸やアンモニア等の揮発性塩基態窒素の増加が起こった場合、反芻動物が好まないサイレージとなってしまう。また、反芻動物がそのような低品質のサイレージを摂取した場合、健康を害することがある。従って、サイレージの製造・保管・流通・使用の過程において、サイレージの発酵品質を検査・管理することは、畜産業にとって重要である。
サイレージの発酵品質評価法には現在化学分析を使用した方法及び人間の感覚を使用した方法がある。
化学分析を使用した評価の指標のうちで現在広く使用されているものとしてVスコアがある(非特許文献1)。Vスコアは発酵品質を100点満点で評価するが、アンモニア態窒素含有量(VBN)/全窒素量(TN)の値が小さい方がよいとして、50点を配分し、残りの50点を有機酸(VFA)に配分している。有機酸に関する配点は、炭素数が酪酸またはそれ以上(つまりC4以上)の有機酸が少ないほど高い点数を与えるとともに(40点満点)、酢酸+プロピオン酸含有量が少ないほど高い点を与える(10点満点)。そして、これらの評価点の合計としてVスコアを算出する。
しかし、Vスコアを求めるには、サイレージを数時間水に浸漬してその成分を抽出した水を分析するという手順を使用するので、結果を得るまでに長い時間を要することに加えて、専門的な分析機器も必要となるので、現場で簡便な手順・装置を使用してVスコアを求めるのは困難である。
また、Vスコア以外の評価の指標として、一定条件下でサイレージの水蒸気蒸留を行い、流出する有機酸を滴定し、換算式により乳酸、酢酸、酪酸の含量を推定値として求め、その重量による比率を基に算出するフリーク評点がある。この評点は、乳酸、VFAを他の分析方法により定量した値を基に算出しても、フリーク蒸留法で求めた値とよく一致することが確かめられている。フリーク評点は日本国外で使用されることが多いが、国内ではこれと同様に塩基性窒素を考慮しないV2スコアと呼ばれる指標も使用されている。しかし、フリーク評点等の場合もVスコアについて上で説明した問題点があり、現場などで簡単に評価することは困難である。
これとは別に、特許文献1には、合成樹脂製フィルムで被覆したサイレージの発酵品質評価のため、被覆外部に漏れだしたガス中のアンモニア濃度の経時変化を観察し、その増加/減少からその品質の高低を評価する方法が記載されている。
しかし、この評価方法では、経時変化から品質評価を行うため、評価結果が得られるまで長期間を要する。その実施例を見ると、刈り取り直後の草を直ちにフィルムで被覆した後、おそらくは1日ごとにアンモニア濃度を測定し、初日から33日間のアンモニアの漏出濃度の変化を観察している。このような測定法では、サイレージの発酵品質をすぐに評価したいという用途には当然使用できない。また、これも当然のことであるが、特許文献1の評価方法はサイレージの原料段階からどれだけアンモニア濃度が変化したかを測定するものなので、原料の状態あるいは少なくとも貯蔵開始時点における濃度からの変化情報を必要とする。従って、アンモニア濃度の初期状態を測定していなかったサイレージや、外部から購入等したサイレージであってアンモニア初期濃度情報の提供がない場合などには適用できない。
一方、人間の感覚を利用した発酵品質評価として、例えばサイレージの色、触感、ニオイ、味から総合的に評価することも行われている。人間の嗅覚はかなり鋭敏であり、特に有機酸等にはかなりの高い感度を示すため、評価者が十分に訓練を受けている場合には、発酵品質の評価にあたって中心的な役割を演じることが原理的には可能なはずである。実際、非常に高い発酵品質のサイレージの場合にはにおいがかなり薄いため、嗅覚はこのような領域での評価には十分適合する。一方、発酵品質が少々劣化してくると有機酸が増加し、場合によっては腐敗臭なども加わるため、人間の嗅覚にとっては刺激が強すぎて、少々の成分の違いではニオイの違いとして識別することができなくなってしまう。
このように、感覚を利用した評価方法において重要な役割を担っている嗅覚が強いにおいを発するサイレージに不適合であることは、人間の感覚を発酵品質の評価に利用することに当たって大きな障害となる。
本発明は、表面応力センサによりサイレージからの揮発成分(ニオイ)を検出することにより、サイレージのその時点における発酵品質を、複雑な操作を伴うことなく評価すること、またこの評価のための装置を提供することをその課題とする。
本発明の一側面によれば、サイレージから発生したガスを表面応力センサに与え、前記サイレージから発生したガスに応答して前記表面応力センサから出力されるシグナルを使用して、前記サイレージから発生したガスの組成に基づく前記サイレージの発酵品質の評価を行う、サイレージ発酵品質評価方法が与えられる。
ここで、前記サイレージから発生したガスの組成に基づく前記サイレージの発酵品質の評価は、少なくとも前記ガス中の有機酸及び窒素含有化合物の一方の量に基づく評価であってよい。
また、前記発酵品質の評価は、前記シグナルの時間変化のパターンに基づいて行ってよい。
また、前記サイレージから発生したガス中の酪酸の量による時間変化のパターンへの影響の評価に基づいて前記発酵品質の評価を行ってよい。
また、前記サイレージから発生したガス中の酢酸の量による時間変化のパターンへの影響の評価に基づいて前記発酵品質の評価を行ってよい。
また、評価対象のサイレージを収容した容器に、発酵品質の評価に影響を与える成分を実質的に含有していないガスを通すことにより得られたガスを前記サイレージから発生したガスとして前記表面応力センサに供給してよい。
また、前記表面応力センサに前記サイレージから発生したガスの供給を開始した以降の前記シグナルを使用して前記サイレージの発酵品質の評価を行ってよい。
また、前記表面応力センサは膜型表面応力センサであってよい。
また、前記表面応力センサの感応膜の材料としてPoly(methyl vinyl ether-alt-maleic anhydride)、Poly(2,6-diphenyl-p-phenylene oxide)及びPoly(4-methylstyrene)からなる群から選択された少なくとも一を使用してよい。
また、前記表面応力センサの感応膜の材料としてPolymethyl methacrylate、Poly(4-methylstyrene)、フェニル基修飾シリカ/チタニア複合ナノ粒子、オクタデシル基修飾シリカ/チタニア複合ナノ粒子、Poly(2,6-diphenyl-p-phenylene oxide)、Polyvinyl fluoride、Polystyrene、Polycaprolactone、Cellulose acetate butyrate、Polyethyleneimine、及びテトラエトキシシラン修飾シリカ/チタニア複合ナノ粒子からなる群から選択された少なくとも一を使用してよい。
また、前記表面応力センサとして、前記群から選択された一の材料を感応膜に使用した第1の表面応力センサと、前記群から選択された他の材料を感応膜として使用した第2の表面応力センサとを少なくとも使用してよい。
また、前記サイレージから発生したガスとパージガスとを前記表面応力センサに交互に与え、前記サイレージから発生したガスに対応する前記シグナルと前記パージガスに対応する前記シグナルとを使用して前記サイレージの発酵品質の評価を行ってよい。
また、前記サイレージから発生したガスを前記表面応力センサに供給する時間区間と前記パージガスを前記表面応力センサに与える時間区間とに加えて、所定の標準ガスを前記表面応力センサに与える時間区間を設け、前記サイレージの発酵品質の評価にあたって前記標準ガスに対応する前記シグナルを更に使用してよい。
また、前記標準ガスは液体または固体から発生するガスであってよい。
また、前記サイレージから発生したガスを追加のガスセンサに供給し、前記表面応力センサからのシグナルと前記追加のガスセンサからのシグナルとに基づいて前記サイレージの発酵品質の評価を行ってよい。
本発明の他の側面によれば、少なくとも一つの表面応力センサと、測定対象のサイレージから発生した試料ガスを供給する第1のガス流路と、測定すべきガス成分を含有しないパージガスを供給する第2のガス流路とを設け、前記第1のガス流路から供給される試料ガスと前記第2のガス流路から供給されるパージガスとを交互に切り替えて前記少なくとも一つの表面応力センサに供給して前記少なくとも一つの表面応力センサからシグナルを発生させることにより、上記何れかのサイレージ発酵品質評価方法を行う、サイレージ発酵品質評価装置が与えられる。
ここで、追加のガスセンサと前記試料ガスを前記追加のガスセンサに供給する追加のガス流路とを設け、前記少なくとも一つの表面応力センサからの前記シグナルと前記追加のガスセンサからのシグナルとに基づいて前記サイレージの発酵品質の評価を行ってよい。
本発明のさらに他の側面によれば、少なくとも一つの表面応力センサと、測定対象のサイレージから発生した試料ガスを供給する第1のガス流路と、測定すべきガス成分を含有しないパージガスを供給する第2のガス流路と、所定の成分組成を有する標準ガスを供給する第3のガス流路とを設け、前記第1のガス流路から供給される試料ガスと前記第2のガス流路から供給されるパージガスと前記第3のガス流路から供給される標準ガスとを所定の順序で切り替えて前記少なくとも一つの表面応力センサに供給して前記少なくとも一つの表面応力センサからシグナルを発生させることにより、上記何れかのサイレージ発酵品質評価方法を行う、サイレージ発酵品質評価装置が与えられる。
ここで、追加のガスセンサと前記試料ガスを前記追加のガスセンサに供給する追加のガス流路とを設け、前記少なくとも一つの表面応力センサからの前記シグナルと前記追加のガスセンサからのシグナルとに基づいて前記サイレージの発酵品質の評価を行ってよい。
本発明では、サイレージの発酵品質についての重要な評価項目の一つである有機酸の組成、例えばサイレージから揮発するガス中の酪酸と酢酸との比率を簡単に評価することができる。これにより、サイレージの発酵により発生している有機酸中のC2及びC3成分とC4以上の成分との比率やC2及びC3成分の量を簡単に求めることができる。また、窒素を含有する揮発性成分の検出も可能であり、更には有機酸や窒素含有揮発成分以外で発酵品質と相関する物質があればそのような物質も検出できる。本発明においては有機酸、揮発性塩基態窒素等を高い感度で検出できる感応膜を塗布した複数の表面応力センサからの出力信号から、サイレージの発酵品質を総合的に評価することができる。表面応力センサは適切な感応膜材料を選択することで、一つの感応膜で複数の対象物質を検出できるが、それぞれの対象物質に対するセンサの応答はその振幅や応答波形が互いに異なるようにすることができるから、複数の表面応力センサ出力を組み合わせることにより、複数の対象物質に対応するパラメータを適宜組み合わせた発酵品質評価値を求めることが可能となる。
サイレージの発酵に伴って発生した各種の成分がサイレージから揮発するので、これらの多様な成分を検出することでその発酵品質を評価することが可能である。サイレージの発酵品質を評価する重要な項目の一部として、サイレージに含まれる個々の有機酸の量やその間の比率がある。具体的には、
〇基準1. 分子中の炭素個数が4個以上の有機酸(以下、C4と称する)の量と炭素個数2個または3個の有機酸(以下、それぞれC2、C3と称する)の量との比の値が大きいサイレージは品質が悪い(この観点での評価をC4評価ともいう)。また
〇基準2. 炭素個数が2個または3個の有機酸の量が大きいサイレージも品質が悪い(この観点での評価をC2+C3評価ともいう)
とされる。本願発明者はこのようなサイレージ中の各種の有機酸の量を表面応力センサで検出することでサイレージ品質を評価するという着想を得て、研究を進めた結果、本発明を完成させるに至った。
〇基準1. 分子中の炭素個数が4個以上の有機酸(以下、C4と称する)の量と炭素個数2個または3個の有機酸(以下、それぞれC2、C3と称する)の量との比の値が大きいサイレージは品質が悪い(この観点での評価をC4評価ともいう)。また
〇基準2. 炭素個数が2個または3個の有機酸の量が大きいサイレージも品質が悪い(この観点での評価をC2+C3評価ともいう)
とされる。本願発明者はこのようなサイレージ中の各種の有機酸の量を表面応力センサで検出することでサイレージ品質を評価するという着想を得て、研究を進めた結果、本発明を完成させるに至った。
本発明の一実施形態によれば、C2及びまたはC3に属する有機酸の少なくとも一つに対する応答特性とC4に属する有機酸の少なくとも一つに対する応答特性とが相違する少なくとも一つの表面応力センサを設け、このような表面応力センサの出力に基づいて、サイレージの評価を行う。より具体的には上記基準1及び2の少なくとも一つについて表面応力センサの出力を評価し、その結果からサイレージの評価を行う。
ここで、個々の有機酸に対応して個別の表面応力センサを設けてもよい。あるいは、表面応力センサが多くの場合複数の化学種に対して異なる信号波形で応答することを利用して、検出すべき有機酸の種類よりも少ない個数の表面応力センサを使用することもできる。後者の場合、有機酸の種類毎に応答波形が明確に異なり、また複数種類の有機酸が混在している場合でも表面応力センサの出力全体が個々の有機酸による応答の線形の重ね合わせから大きく外れない場合の方が、個々の有機酸の同定やその量の判定を、情報処理装置を用いた単純なパターンマッチングなどの簡便な方法を使用して容易に実現可能となる。しかし、そうでない場合でも、また検出される可能性のある有機酸の種類がかなり多いなど出力信号に影響を与えるパラメータが多い複雑な状況では、出力成分と個々の成分の量や複数の成分の量の間の比率(あるいは評価スコアや評価結果カテゴリー)との関係についての周知の手法を用いた機械学習を行うことで、より高精度の結果を得ることができる。このような機械学習について本願では具体的には説明しないが、機械学習自体、広範な技術分野に適用可能な手法であることはよく知られており、また表面応力センサ応用に適用可能なことは、例えば特許文献2で詳述されている。
ここで、サイレージの評価結果に寄与するすべての有機酸個々の量や、有機酸間の比率を評価するのではなく、より少数の代表的な有機酸の量や相互の比率を求めるようにしてもよい。これはこれら有機酸を生成する反応や原材料の成分組成はそれほど自由度が大きくないため、ある成分の量は他の類似成分の量から完全に独立に決まるわけではないからである。これを利用して、例えばC2+C3として酢酸を代表成分とし、C4として酪酸を代表成分としてもよい。このように代表成分を選択すれば、有機酸の各グループ内でそれぞれ酢酸及び酪酸が一番揮発性が高いのでガスとして検出しやすいために、測定に当たって有利である。
また、上ではもっぱらサイレージから揮発する種々の有機酸の量や比率を測定することでサイレージの発酵品質を評価することについて説明したが、測定の対象とすべき成分はこれに限定されるものではない。例えば、すでに説明したように、サイレージの発酵品質評価に当たっては有機酸の量や比率だけでなく、揮発性の窒素含有化合物の量や比率を測定することでサイレージの発酵品質の評価を行うこともできる。また、有機酸と窒素含有化合物の両カテゴリーの成分についてその量や成分間の比率を求めることにより、より精密なサイレージ発酵品質評価が実現できる。さらには、有機酸量と窒素含有化合物の両方を測定する代わりに、その一方だけを知ることでサイレージの発酵品質をかなり実用的な程度まで評価することができる。例えば、非特許文献2で説明されているフリーク評点では乳酸、酢酸、酪酸などの有機酸組成に基づいた評価を行うが、そこで説明されているように、サイレージの製造条件や発酵条件にもよるが(例えば、非特許文献2によれば、製造工程において酸を添加する加酸法、あるいは低水分サイレージ調製法を採用した場合にVスコアとの相違が大きくなる等)、多くの場合に窒素含有化合物まで測定するVスコアとよく相関が取れた良好な品質評価が可能となる。また、摂取量が多い(45g/日以上)と病気のリスクが高くなると報告されている酪酸濃度を簡易判定できるだけでも、現場ニーズには合致すると考えられる。あるいはC2+C3有機酸から選択された有機酸、例えば実施例に示されるように酢酸の量も測定することで、より正確で安定した品質評価を行うことも可能である。さらには、有機酸や窒素含有化合物以外の成分がサイレージ発酵品質評価に有用である場合には、有機酸及び/または窒素含有化合物の測定に加えて、あるいはこれらの測定に代えて、当該有機酸や窒素含有化合物以外の成分を測定することでサイレージ品質評価を行うこともできる。
表面応力センサは適切な感応膜材料を選択することで、一つの感応膜から複数の対象物質に対する応答信号(シグナルとも呼ぶ)を、それらが重畳した形で得ることができる。つまり、多くの対象物質について、感応膜材料を適切に選択することで、それぞれの対象物質に対する表面応力センサの応答においてその振幅や応答波形が互いに異なるようにすることができる。従って、複数の表面応力センサ出力を組み合わせることにより、複数の対象物質に対応するパラメータを適宜組み合わせた発酵品質評価値を求めることが可能となる。この際、上述したように、表面応力センサの出力のパターンマッチングや機械学習を行うことで、これらの出力から適切に特徴を抽出して、比較的少数の表面応力センサを使用するだけで表面応力センサの個数よりも多数のパラメータに基づくサイレージ発酵品質評価を実現できる。もちろん、これに限るものではないが、測定対象から発生するガス中に存在している成分であってサイレージ品質評価に有用である特定の成分の検出に特に好都合な他の種類のガスセンサが使用可能である等の場合には、必要に応じて表面応力センサに加えてそのようなガスセンサを併用することもできる。
本発明では表面応力センサを使用して測定対象の試料から発生するガスを測定する。この目的で使用できる測定システム構成の概略を図1に示す。図1に示す概略構成では表面応力センサとして膜型表面応力センサ(MSS)を使用するが、もちろんこれにより一般性を失うものではない。図1に示される概略構成では、2本のガス流路へそれぞれ図の左側から白抜き矢印で示すように測定すべきガス成分ではなく、またそのようなガス成分の測定に影響をできるだけ与えない不活性のガス(パージガス、基準ガスとも呼ばれる)を供給する。パージガスとしては例えば窒素ガスや大気を使用できるが、ここでは窒素ガスを使用した。なお、パージガスとして大気などを使用して簡便な測定を行う場合、測定現場の大気にサイレージから発生した有機酸やアンモニアなどの発酵品質評価に影響を与えるガスがわずかに混入している可能性がある。このような場合、このようなガスの混入濃度が品質評価結果に与える影響が意図した測定精度の実現に悪影響を与えない程度のものであれば(このような場合を、「発酵品質評価に影響を与える成分を実質的に含まない」と称する)、そのようなガスの混入は無視することができる。このような2系統のガス流はガス流路ごとに設けられているマスフローコントローラ(MFC)によりその流量を制御される。具体的には2本のガス流路中のガス流を所望の時間間隔で交互に切り替えるとともに、ガス流量を時間軸上で一定になるように制御している。なお当然のことであるが、ガス流の制御は、MFCに限らず、様々なポンプなどを使用しても良い。
図1において、上側に示すガス流路は測定すべきガス成分を含有しないパージガスをMSSに与えることで、MSSの表面に塗布されている感応膜中に拡散している各種のガスを脱着させてMSSを初期化するパージ処理を行う。一方、図1の下側にあるガス流路を通るガス流はMFCの直後に設置されたバイアル瓶中の試料から揮発したガス成分を含んだ状態でMSSに供給される。もちろん、試料が最初からガス状である場合や液体または固体状態の試料から揮発・蒸発したガスが測定系に対して与えられる場合には、バイアル瓶を使用しない構成を採用することができる。2本のガス流路からのガス流は別のバイアル瓶において合流した後MSSに供給される。また、MSS表面の感応膜によるガスの吸着・脱着の速度は温度の影響を受けるため、図1に示した測定系を恒温槽、インキュベータ等に収容することによってその温度を所望の値に維持するのが好ましい。なお、以下で説明する実施例では、測定システム全体をインキュベータ内に収容して測定を行った。また、MFCなどのシステム内の各種の機器の動作を制御し、また表面応力センサからのシグナルを取り込んで記録し解析する等の各種の処理を行うことによって以下で説明する評価方法を実現する情報処理装置、更に外部の機器等との間で情報や指令等の交換を行うためのインターフェースや通信機器も本システムに含まれるが、図示は省略した。
MSSの光学顕微鏡写真の例を図2に示す。図2に示されるMSSはシリコン単結晶から切り出される、半導体素子技術分野で使用されるシリコンウエハから形成されたものであり、その中央の円形部分(正方形等の他の形状でもよい)がその周囲の枠状部に当該円形部分の上下左右4か所で接続され固定されている。MSSに与えられたガス成分が円形部分の表面に塗布された感応膜に吸着・脱着することでMSSに印加された表面応力がこれら4か所の固定領域に集中し、これら固定領域に設けられているピエゾ抵抗素子の電気抵抗変化がもたらされる。これらのピエゾ抵抗素子は枠状部に設けられた導電領域(図2では砂目状の領域として示される)によって相互接続されてホイートストンブリッジが形成される。このホイートストンブリッジの対向する2つの節点間に電圧を印加し、残りの2つの節点間に現れる電圧をMSSから出力されるシグナルとしてMSSの外部に取り出して所要の解析を行う。このようなMSSの構造や動作については例えば特許文献3に詳述されている。なお図2では、感応膜は、MSSの円形部分だけで無く、枠状部も含めMSSチップ表面に広く塗布されている。これは感応膜をスプレーコーティングによって塗布した場合に見られる状態であるが、枠状部などに塗布された感応膜は実質的にセンサ出力信号に寄与しないため、このように塗布した場合でも問題なくセンサとして使用することが可能である。もちろん、インクジェットやディスペンサーなどによって、円形部分だけに感応膜が塗布されたMSSを使用する事も可能である。
図3に、MSSなどの表面応力センサに試料ガスを与えたときのシグナル強度の時間変化の概念図を示す。図3(a)にはMSSに与えるガスが試料ガスであるのかそれともパージガスであるのかを時間軸上で示す。具体的には、MSSに与えられるガス中の測定対象ガスの濃度が試料ガスを与えている試料ガスインジェクション期間中は0よりも大きな濃度Cgであり、パージガスを与えることで下流側のガス流路中の試料ガスを流し去るとともにMSSの感応膜(及び、ガス流路の管壁等)に吸着されている試料ガス成分を脱着するパージ動作を行うパージ期間中は試料ガス濃度が0となっている。図3(b)は図3(a)に示すガスの種類の切り替えを行った際のMSSからのシグナルの強度を、図3(a)と時間軸を揃えて示す。シグナル強度は多くの要因に支配されるが、基本的にはMSS上の感応膜近傍のガス中の成分濃度と感応膜表面の同じ成分の濃度との差により引き起こされるガスと感応膜との間の当該成分の吸着・脱着の速度が主要な要因となる。そのため、シグナル強度は図3(a)に示されるガスの切り替え直後から始まり、上下の飽和値へ向かって指数関数的に漸近する曲線に近いものとなる。図3(b)は理想的な場合の当該曲線を示す。実際の当該曲線の形状や曲線の最大値等は、感応膜への吸着・脱着速度や感応膜に吸着・脱着される成分の種類によりかなり変化し、またシグナルの変化範囲も大きく相違することが多い。さらに、感応膜の粘弾性特性や、測定対象ガスの感応膜への拡散、あるいは感応膜材料と測定対象ガスとの物理化学的な相互作用などによって、シグナルはより複雑な経時変化を示す事もある。このように、MSSからのシグナルの経時変化や振幅等に基づいて試料中の各主成分の量・濃度や複数成分間の比率等を求めることが可能となる。具体的に言えば、C4評価に適したシグナルを与える感応膜材料が存在し、またC2+C3評価に適したシグナルを与える感応膜材料も存在する。従って、これらの材料から適宜選択されたものを塗布した表面応力センサを単独で使用してサイレージから得られるガスを測定し、あるいは異なる材料をそれぞれ塗布した複数種類の表面応力センサを使用して同様な測定を行うことによって、サイレージの所望の特徴に基づいた評価を行うことができる。
ここで感応膜を形成する材料の吸着・脱着特性は多様であって、上述の単純化したモデルから逸脱した応答を示す感応膜材料も存在する。しかしながら、表面応力センサの応答を解析等する場合、上記モデルを用いて最初の検討を行うのは多くの場合に有益であるということができる。
なお、図3ではMSSに試料ガスを1回だけ与えるように図示されているが、MSSなどの表面応力センサを使用した測定においては、試料ガスとパージガスとを交互に切り替えて供給することにより、図3に示したような測定を複数回繰り返すのがふつうである。以下では、試料ガスインジェクションとそれに引き続くパージとの組を測定サイクルと呼ぶ。また、試料ガス中のある成分の吸着速度と脱着速度とが大きく異なるなどの事情がない限り、試料ガスインジェクション期間とパージ期間とは同じ時間長とする場合が多い。ただし、試料ガス中から感応膜に吸着された成分の脱着を充分に行った方が良好な結果が得られる場合にはパージ期間を試料ガスインジェクション期間よりも長くしてもよい。具体的には、実施例中でも説明したように、試料ガスインジェクション期間とパージ期間との長さの比率を1:1とした場合にはパージ期間での脱着が不十分であるためにシグナルのベースラインの変動が大きくなり、判別精度に悪影響を及ぼす恐れがある場合には、上記比率を1:2とするなど、パージ期間の方を長くすることもできる。
なお、上の説明では試料ガスとパージガスとを切り替える測定シーケンスに基づく測定を行ったが、本発明はそれに限られるものではない。例えば、試料ガスに含有されてその濃度がサイレージの発酵品質評価に影響を与える可能性のある成分を含む別のガス(標準ガス)についての測定を測定シーケンスに挿入して、3種類のガスの切り替え測定からのシグナルに基づいて発酵品質評価を行うことができる。このような標準ガスとしては例えば標準的なサイレージを想定し、それから発生する試料ガス成分と同じ成分組成を有するガスを標準ガスとしてよい。あるいはそのように想定される試料ガスの一部の成分(例えば、成分量のわずかな違いを特に高精度で測定したい成分等)についての組成を同じにしたガスを標準ガスとするなど、必要に応じて各種の組成に設定することができる。そして、測定上の各種の要請や制約条件なども勘案してこれら3種類のガスの供給シーケンスを適宜設定する。例えば、以下のようなガス供給時間区間の繰り返しを含む測定シーケンスが考えられる:
A.パージガスを供給する→[試料ガスと標準ガスの一方を供給する→パージガスを供給する→試料ガスと標準ガスの他方を供給する→パージガスを供給する](あるいは[]内を繰り返す)
B.パージガスを供給する→[試料ガスと標準ガスを交互に供給する→パージガスを供給する](あるいは[]内を繰り返す)
C.パージガスを供給する→[試料ガスと標準ガスの一方とパージガスとの交互供給を繰り返す→パージガスを供給する→試料ガスと標準ガスの他方とパージガスとの交互供給を繰り返す](あるいは[]内を繰り返す)
これ以外にもガス供給時間区間の各種のガス供給シーケンスが考えられる。何れのガス供給シーケンスでも、一連の測定シーケンス中は温度、ガス圧力・流量、センサ特性の経時変化などの測定条件はシーケンス内で大きく変化しないと考えられるので、試料ガスと標準ガスとの比較により、両ガス間の微量な組成の違いを精密に測定でき、また測定結果への外乱の影響が低減できるなど、測定の安定性の向上を図ることもできる。
なお、標準ガスまで使用する場合には測定装置のガス供給系に標準ガス用のガス流路を追加することになるが、これはガス供給系についての各種の既存技術を利用して容易に実現できる。たとえば、標準ガスは最初から気体の状態で準備しておくこともできるし、あるいは試料ガスと同様に液体や固体から蒸発させることでガス供給系に導入してもよい。また、標準ガスを提供する際に、当初準備しておいた気体や液体・固体から発生する気体にパージガスなどの別の気体を混合させてもよい。また、これら3系統のガス流路は最終的には合流させる必要があるが、3つの流路を一か所で合流させてもよいし、あるいは試料ガス流路の上流側を一部分流させて標準ガス流路を構成し、そこに標準ガスが導入された後、両ガス流路をパージガスとの合流点の手前で合流させるなどの構成も考えられる。
感応膜材料としては、これに限定することを意図するものではないが、例示的な一実施形態では、Poly(methyl vinyl ether-alt-maleic anhydride)、Poly(2,6-diphenyl-p-phenylene oxide)及びPoly(4-methylstyrene)からなる群から選択された少なくとも一を使用することができる。また、別の実施形態では、Polymethyl methacrylate、Poly(4-methylstyrene)、フェニル基修飾シリカ/チタニア複合ナノ粒子、オクタデシル基修飾シリカ/チタニア複合ナノ粒子、Poly(2,6-diphenyl-p-phenylene oxide)、Polyvinyl fluoride、Polystyrene、Polycaprolactone、Cellulose acetate butyrate、Polyethyleneimine、及びテトラエトキシシラン修飾シリカ/チタニア複合ナノ粒子からなる群から選択された少なくとも一を使用することができる。これらの群から選択された材料は、一の材料を単独で使用してもよく、あるいは、当該選択された一の材料を感応膜に使用した第1のMSSと、前記群から選択された他の材料を感応膜として使用した第2のMSSとを使用することで、複数種類の材料を併用してもよい。もちろん、複数種類の材料を併用する場合に使用するMSSは2つに限定されず、第3、第4もしくはそれ以上のMSSを使用し、各MSSの感応膜に、前記群から選択された互いに異なる材料を使用することも可能である。
以下、実施例により本発明をより詳細に説明する。なお、以下の実施例は本発明を限定するものではなく、その理解を助けるためのものであることに注意されたい。
[実施例1]
本実施例では図1に概略の構成を示した測定システムをインキュベータ内に収容したものを使用し、測定対象の試料として、サイレージ中に多く含まれる有機酸の水溶液、及び各種の品質のサイレージをバイアル瓶に収容して測定を行った。インキュベータの温度は20℃、30℃及び45℃の三通りに設定して測定を行ったが、30℃の場合が最も判別性(試料の相違がMSS応答信号波形の相違として現れる程度)が良好だったので、以下ではこの温度設定で測定を行った結果を示す。また、試料ガス及びパージガスの流量は10sccm及び30sccmの二通りで測定を行ったが、10sccmの方が判別性が良好であった。ただし、ここで注意しておくが、判別性は、試料ガスの発散速度、感応膜の吸着速度、流量のいずれにも大きく影響を受けるものと考えられる。したがって、上記判別性への言及は、あくまでも現在の測定系において、10sccmは30sccmより判別性が高かったという結論であり、例えば感応膜の厚さや採取する試料の量が変われば、最適流量は変化する可能性がある。また、ガス温度に影響するガス流路温度の経時的な変化を回避する上で、ポンプからの発熱を抑制できる10sccmには大きなメリットがある。本実施例で使用した測定系では冷却ファンの取り付け等、ガス流路に対する熱対策を行っていないが、上記流量はそのような測定構成に好適な測定条件であるということができる。また、サンプリング時間(各測定サイクルにおいて試料ガスインジェクションを行う時間)として30秒及び120秒の二通りで測定を行ったが、判別性には差がなかった。以下ではサンプリング時間を120秒とした場合のデータを示す。ここで、サンプリング時間とパージ時間(各測定サイクルにおいてパージガスをMSSに与えてそのパージを行う時間)との比を1:2として測定を行った。本願発明者の実験では、サンプリング時間とパージ時間との比を1:1とするなどパージ時間を短くすると、パージ、すなわち試料ガスインジェクション中にMSS上の感応膜に吸着された成分の脱着が不十分となってベースラインの変動が大きくなることが確認された。このことから、短時間のパージしか行わない場合には判別精度に悪影響が出る可能性がある。現実の測定では測定時間が長くなることは、それ自体測定のスループットを低下させるなどの不都合があるだけではなく、測定系内外の環境の各種のパラメータ(流速、ガス圧力、温度等)を長時間安定させることがしばしば困難であったり、測定系の大型化、高価格化を招くという問題がある。さらに、測定系は通常はポンプ等の能動部品を含むことからこれからの発熱による長時間にわたる温度変化も精度に悪影響を与える恐れがある。従って、本発明においては、測定サイクル時間の配分を、サンプリング時間には有効なシグナル値を得ることが可能な範囲内で極力短く配分し、パージ時間をできるだけ長くすることが望ましい。あるいは、ベースライン変動が問題となる場合の対策として、品質に影響を与える成分の量があらかじめ規定された値である標準サイレージを準備しておき、測定毎に標準サイレージを測定してキャリブレーションを行う等により、短時間のパージによる悪影響を除去あるいは軽減することもできる。
本実施例では図1に概略の構成を示した測定システムをインキュベータ内に収容したものを使用し、測定対象の試料として、サイレージ中に多く含まれる有機酸の水溶液、及び各種の品質のサイレージをバイアル瓶に収容して測定を行った。インキュベータの温度は20℃、30℃及び45℃の三通りに設定して測定を行ったが、30℃の場合が最も判別性(試料の相違がMSS応答信号波形の相違として現れる程度)が良好だったので、以下ではこの温度設定で測定を行った結果を示す。また、試料ガス及びパージガスの流量は10sccm及び30sccmの二通りで測定を行ったが、10sccmの方が判別性が良好であった。ただし、ここで注意しておくが、判別性は、試料ガスの発散速度、感応膜の吸着速度、流量のいずれにも大きく影響を受けるものと考えられる。したがって、上記判別性への言及は、あくまでも現在の測定系において、10sccmは30sccmより判別性が高かったという結論であり、例えば感応膜の厚さや採取する試料の量が変われば、最適流量は変化する可能性がある。また、ガス温度に影響するガス流路温度の経時的な変化を回避する上で、ポンプからの発熱を抑制できる10sccmには大きなメリットがある。本実施例で使用した測定系では冷却ファンの取り付け等、ガス流路に対する熱対策を行っていないが、上記流量はそのような測定構成に好適な測定条件であるということができる。また、サンプリング時間(各測定サイクルにおいて試料ガスインジェクションを行う時間)として30秒及び120秒の二通りで測定を行ったが、判別性には差がなかった。以下ではサンプリング時間を120秒とした場合のデータを示す。ここで、サンプリング時間とパージ時間(各測定サイクルにおいてパージガスをMSSに与えてそのパージを行う時間)との比を1:2として測定を行った。本願発明者の実験では、サンプリング時間とパージ時間との比を1:1とするなどパージ時間を短くすると、パージ、すなわち試料ガスインジェクション中にMSS上の感応膜に吸着された成分の脱着が不十分となってベースラインの変動が大きくなることが確認された。このことから、短時間のパージしか行わない場合には判別精度に悪影響が出る可能性がある。現実の測定では測定時間が長くなることは、それ自体測定のスループットを低下させるなどの不都合があるだけではなく、測定系内外の環境の各種のパラメータ(流速、ガス圧力、温度等)を長時間安定させることがしばしば困難であったり、測定系の大型化、高価格化を招くという問題がある。さらに、測定系は通常はポンプ等の能動部品を含むことからこれからの発熱による長時間にわたる温度変化も精度に悪影響を与える恐れがある。従って、本発明においては、測定サイクル時間の配分を、サンプリング時間には有効なシグナル値を得ることが可能な範囲内で極力短く配分し、パージ時間をできるだけ長くすることが望ましい。あるいは、ベースライン変動が問題となる場合の対策として、品質に影響を与える成分の量があらかじめ規定された値である標準サイレージを準備しておき、測定毎に標準サイレージを測定してキャリブレーションを行う等により、短時間のパージによる悪影響を除去あるいは軽減することもできる。
有機酸の水溶液としては、それぞれ単一の有機酸の1%水溶液を調製して、これら水溶液を個別に測定した。また、サイレージは特に水等を添加することなく、所定重量のサイレージをそのままバイアル瓶に収容して測定を行った。
なお、測定対象とした各種のサイレージについては、別途Vスコアの測定方法に従ってそれぞれに含まれる有機酸の測定を行った。なお、Vスコアの算出には使用されないリンゴ酸、コハク酸等の有機酸についても併せて測定した。その結果を下表に示す。

さらに、これらのサイレージの窒素含有化合物量の測定を行い、上記有機酸測定の結果と合わせてVスコアを下表に示す通り算出した。

使用したMSSは実際にはそれぞれ異なる感応膜材料を塗布した複数個のMSSからなる集合体であったが、それらのうち、感応膜材料としてPoly(methyl vinyl ether-alt-maleic anhydride)を使用したMSS(番号ChA)が最も良好な判別性を示した。以下では主にChAから出力されたシグナルに基づいて説明を行う。なお、残りのMSSのうちの2つのシグナルも判別に有効であったので、これらをChB(感応膜材料:Poly(2,6-diphenyl-p-phenylene oxide))及びChC(感応膜材料:Poly(4-methylstyrene))として適宜参照して説明する。
図4に個々の有機酸の1%水溶液をバイアル瓶に収容して図1に示す測定装置で測定を行った際のChAのMSSからのシグナル(単位はmV)の時間変化(単位は秒)を示す。ここで、有機酸として、酢酸、酪酸、乳酸、プロピオン酸及び吉草酸を測定した。さらに、比較対象として有機酸を溶解する前の水も測定した。測定シーケンスは、先ずパージガスを240秒間流し、次に試料ガスを120秒間流し、その後、再度パージガスを240秒間流すという測定を行った。また、パージガス及び試料ガスの流量は10sccmとした。また、図4からもわかるように、各試料について測定を2回行い、両方の結果をここにプロットした。なお、図5及び図6に示す測定でも同じ測定シーケンス及び流量による測定を行った。図4からわかるように、個々の有機酸の水溶液からの蒸気を試料ガスとして測定を行った場合には、酢酸に対するシグナルは短時間のうちに飽和し、試料ガスインジェクション開始後60秒程度経過した後はシグナルが大きく減少するという特異なシグナル変化(経時変化)を示す。これに対して酪酸等の他の有機酸に対するシグナルは、飽和後にほぼ一定からわずかに減少するという傾向を示すか、あるいはシグナルが緩慢に増大するため、試料ガスインジェクション期間の終了時点(試料ガスインジェクション開始後120秒経過時点)でもシグナルの増大が継続している。なお、ここで測定した有機酸中の乳酸は揮発性ではないため、そのシグナルは水とほとんど同じものとなった。
次に、実際のサイレージから発生する試料ガスのように、複数の有機酸が混合したガスを測定した場合に、個々の成分の応答が比較的線形性を維持して重畳した形のシグナルがMSSから得られるのか、それともこれらの応答が互いに影響を与え合うために、MSSからのシグナルを見ても個々の成分の寄与を簡単には分離できないかを検証するため、上掲の表に示したところのサイレージ試料1~6の抽出液中の有機酸の組成を有する混合有機酸水溶液(疑似サイレージ水溶液)について図4の場合と同じ手順で測定を行った結果を図5に示す。ここでは、それぞれの疑似サイレージを対応するサイレージの試料番号の後ろに文字列「-VFA」を付加することで表示している。
図5を図4と比較することにより、ChAのMSSで使用している感応膜についてはサイレージの有機酸組成の試料から発生するガスの測定に関する限り、シグナルは個々の有機酸のガスに対するシグナルを線形に重畳したものとほぼ同じ経時変化を示すことが確認された。すなわち、酪酸の濃度が高い試料1に対応する1-VFAに対するシグナルは純粋な酪酸水溶液からのガスとよく似た緩慢な上昇を示すのに対して、酪酸の濃度は低い一方で酢酸の濃度は高い試料2に対応する2-VFAに対するシグナルの立ち上がりは純粋な酢酸水溶液からのガスと同じように急峻なものとなった。また、シグナルがピークに到達した後は、純粋な酢酸からのガスに対するシグナルにみられる比較的大きなシグナル値の低下が、試料ガスインジェクション期間の途中からはあまり変化しなくなるという他のガスに対するシグナルの重畳によってやや緩和された形で表れている。さらに、酪酸濃度がゼロであるとともに酢酸濃度も低い試料である3、4及び5にそれぞれ対応する3-VFA、4-VFA及び5-VFAに対するシグナルは、いずれも比較的短時間で立ち上がった後、ほぼ一定値を維持することが確認された。これはシグナルの増加が一番緩慢である酪酸の影響がなく、また比較的短時間で急激な低下に転じる酢酸の影響も非常に小さいことであるためと考えられる。また、試料3、4及び5に比べて酢酸の濃度がやや高く酪酸も微量含む試料6に対応する試料6-VFAに対するシグナルは立ち上がり及びそれ以降の変化の両者が試料1-VFAと2-VFAとの中間的なものとなることも確認された。
さらに、サイレージ1~6を個別にバイアル瓶に収容して、それぞれから発生する試料ガスについて同じ測定を行った。その結果を図6に示す。ただし、図4及び図5に示す測定では個々の有機酸あるいは複数種の有機酸の水溶液を測定したが、図6に示すサイレージの測定ではサイレージだけをあらかじめ定めた重量だけバイアル瓶に収容し、水などの液体その他の物質の混入は行わなかった。
実際のサイレージからのシグナルを示す図6をこれらのサイレージと同じ有機酸組成を有する疑似サイレージからのシグナルを示す図5と比較すれば、シグナルの最大値で比較した場合の実際のサイレージ間の順序関係と疑似サイレージ間の順序関係とは異なるものの、シグナルの時間変化について上で説明した特徴は実際のサイレージと疑似サイレージとの間でほぼ一致することがわかる。従って、サイレージ自体から発生するガスのインジェクション期間中のMSS等の表面応力センサのシグナルの時間変化のパターンの特徴により、サイレージ中の各種の有機酸の量やその組成を測定することが可能となる。特に、ChAを使用した測定は上述したC4評価に特に有用であることが判る。これにより、酪酸などのC4以上の有機酸の量を評価し、また必要に応じて酢酸などのC2、C3有機酸の量も更に評価することで、サイレージの発酵品質を簡単な手順で評価することができる。また、上掲の2番目の表との比較により、本実施例では窒素含有化合物の測定は行っていないものの、上で説明したところの各種サイレージに対するシグナルと酪酸及び酢酸の量の評価結果がVスコアの値と高い相関性を有することもわかる。さらには、図5と図6との比較結果からもわかるように、有機酸混合水溶液から発生するガスをMSS等の表面応力センサで測定した結果と本発明において測定されるサイレージ自体から発生するガスを同じく表面応力センサで測定した結果との一致の程度が高いため、本発明の測定に当たっての測定系の校正、また既存のサイレージ抽出液を測定対象とするサイレージ評価法による評価結果との対比・照合が容易であるという利点もある。なお、本実施例で評価対象としたサイレージはデントコーン及び牧草を使用して一般的な方法で製造されたものであって、牛等の動物の飼料として広く使用されるタイプのものである。しかし、原料や発酵方法等が異なる他のサイレージ、あるいはそれを二次加工した発酵TMR(Total Mixed Rations、完全混合飼料)等の広範なサイレージ類に対して本発明の方法を有利に適用することが可能である。
以上説明したところのChAを使用した測定に加えて、ChB及びChCのMSSを使用してこれらからのシグナルを得る測定を行った。ChBを使用した測定結果を図7~図9に、またChCを使用した測定結果を図10~図12に示す。ChB及びChCを使用した場合は、ChAを使用した場合に比べて、個々の有機酸についての測定結果及び疑似サイレージを使用した測定結果と実際のサイレージについての測定結果の相関は低い。しかしながら、サイレージから発生する有機酸組成の違いが図9(ChBを使用)及び図12(ChCを使用)に示すところのシグナルの時間変化に明確に表れる。以下で説明するように、ChB、ChCを使用した測定はいずれもC2+C3評価に有用である。
すなわち、図9にChBを使用して実際のサイレージ(試料1~試料6)を測定した際のシグナルの時間変化を示すが、酪酸の多い試料1、酢酸の多い試料2及びC2+C3の多い試料6(上掲の最初の表を参照)についてはシグナルの立ち上がり及び立ち下りの飽和の速度(試料ガスとパージガスとの切り替え後、シグナルがほぼ一定値に収束するまでの時間)は互いに大きく異なっている。また、試料番号1,2及び6のサイレージは、他の試料番号3~5の他のサイレージについてのシグナルがガス切り替え後急速に飽和するのに対して飽和速度が相対的に小さい(飽和が緩慢である)。上掲の2番目の表からわかるように、試料1、2及び6のサイレージは他のサイレージに比べてC2+C3評価が明らかに小さい。従って、ChBのシグナルの立ち上がり及び立ち下りの飽和の速度はC2+C3評価と強く相関しているということができる。したがって、ChBとChCのMSSの両方あるいはいずれか一方を使用することによって、測定対象のサイレージのC2+C3評価を行うことが可能となる。
なお、ChB及びChCからのシグナルは、サイレージ中に多く含まれる可能性のあるVFAによるシグナルの時間変化パターンが比較的類似しているため、図9及び図12からわかるようにシグナルの時間変化パターンが互いに異なるというよりは、この時間変化がシグナルの強度方向にほぼ相似である(ある試料からのシグナルの強度の時間変化にある定数を乗算してから強度方向に平行移動すると、他の試料からのシグナルの強度の時間変化にほぼ重なる)ことが多くなる。従って、測定に使用する試料の量をできるだけ一定にするなどによる試料ガス供給の安定化、その他シグナルの正規化や標準化などを行えば、サイレージの評価制度をより高くすることができる。
[実施例2]
本実施例では図1に概略の構成を示した測定システムをインキュベータ内に収容したものを使用し、測定対象の試料として、実施例1で用いたものとは別の、3種類のサイレージをバイアル瓶に収容して測定を行った。各サイレージは特に水等を添加することなく、所定重量のサイレージをそのままバイアル瓶に収容して測定を行った。インキュベータの温度は30℃とし、試料ガス及びパージガスの流量は10sccmとした。また、サンプリング時間は120秒とし、サンプリング時間とパージ時間との比は1:2とした。
本実施例では図1に概略の構成を示した測定システムをインキュベータ内に収容したものを使用し、測定対象の試料として、実施例1で用いたものとは別の、3種類のサイレージをバイアル瓶に収容して測定を行った。各サイレージは特に水等を添加することなく、所定重量のサイレージをそのままバイアル瓶に収容して測定を行った。インキュベータの温度は30℃とし、試料ガス及びパージガスの流量は10sccmとした。また、サンプリング時間は120秒とし、サンプリング時間とパージ時間との比は1:2とした。
なお、実際の測定では、不可避的にインキュベータ内の温度及び相対湿度に多少の変化が生じ得るが、本実施例では、測定時のインキュベータ内(測定システムのモジュール内)の温度及び相対湿度の変化は、測定結果に大きな影響がないと見なせる範囲に抑えた。
また、本実施例では、測定データの取得前に、予備的な動作として、測定対象の試料ガス及びパージガスを、実際の測定と同じ流量で、かつ両ガスの切り替えサイクルを実際の測定と同じに設定して、測定系に流す操作を行った。この予備的な動作を行うことにより、測定データをより安定させること(すなわち、測定データの精度をより高めること)ができる。このような予備的な動作は、任意のガスを測定対象の試料とする測定ではしばしば行われるものであり、そのサイクル数(時間)は特に制限されないが、本実施例では200サイクル(計20時間)行った。なお、上記の実施例1について示した測定データも、同様の予備的な動作を行った後に取得されたものである。
本実施例で測定対象としたサイレージは、「高品質サイレージ試料」、「低品質サイレージ試料」及び「揮発成分が減少した高品質サイレージ試料」である。「高品質サイレージ試料」及び「低品質サイレージ試料」は、それぞれ、下表に示す有機酸含有量を含めた化学分析の結果に基づいてサイレージ試料の品質の優劣を評価した結果、高品質であると評価されたサイレージ試料及び低品質であると評価されたサイレージ試料である。「揮発成分が減少した高品質サイレージ試料」は、上記「高品質サイレージ試料」の一定量をバイアル瓶に収容し、一定時間パージガスに曝すことによって揮発成分が減少した状態となったサイレージ試料である。以下では、「高品質サイレージ試料」、「低品質サイレージ試料」及び「揮発成分が減少した高品質サイレージ試料」を、それぞれ試料7、試料8及び試料9とも称する。下表には試料7~9に含まれる有機酸の測定結果を示す。

使用したMSSは実際にはそれぞれ異なる感応膜材料を塗布した複数個のMSSからなる集合体であった。以下では、例として、主にChDから出力されたシグナルに基づいて説明を行うが、残りのMSSから出力されたシグナルについても適宜参照して説明する。なお、各MSSの番号と、塗布された感応膜材料は以下の通りである。
ChD:Polymethyl methacrylate
ChE:Poly(4-methylstyrene)
ChF:フェニル基修飾シリカ/チタニア複合ナノ粒子(以下、「Phenyl-STNPs」とも称する。)
ChG:オクタデシル基修飾シリカ/チタニア複合ナノ粒子(以下、「C18-STNPs」とも称する。)
ChH:Poly(2,6-diphenyl-p-phenylene oxide)(Tenax TA(Mesh:60/80))
ChI:Polyvinyl fluoride
ChJ:Polystyrene
ChK:Polycaprolactone
ChL:Cellulose acetate butyrate
ChM:Polyethyleneimine
ChN:テトラエトキシシラン修飾シリカ/チタニア複合ナノ粒子(以下、「TEOS-STNPs」とも称する。)
図13に、測定対象の3種類のサイレージ試料を個別にバイアル瓶に収容して、それらから発生する試料ガスについて図1に示す測定装置で測定を行った際のChDのMSSからのシグナル(単位はmV)の時間変化(単位は秒)を示す。測定シーケンスは、先ずパージガスを240秒間流し、次に試料ガスを120秒間流し、その後、再度パージガスを240秒間流すという測定を行った。なお、実際の測定では各試料について複数回測定を行っているが、図13にはそれらの測定結果のうち代表的なデータを示している。
図13からわかるように、ChD(感応膜材料:Polymethyl methacrylate)を使用した測定では、試料ガスインジェクション期間(120秒間)のシグナル変化(シグナル波形)が3種類のサイレージ試料間で明らかに異なっている。より具体的には、ChDを使用した測定では、化学分析により品質の優劣が識別された試料7及び試料8の違いが識別可能であったことに加えて、化学分析により同程度の品質(高品質)と評価されたサイレージ試料(試料7及び試料9)における、揮発成分の含有量の違いも識別可能であることが確認された。別途プロトン移動反応飛行時間型質量分析計で測定したところ、代表的な揮発性成分である酢酸と酪酸の濃度は、それぞれ試料7では酢酸57ppm、酪酸21ppm、試料8では酢酸32ppm、酪酸23ppm、試料9では酢酸16ppm、酪酸6ppmとなっており、MSSのシグナルは、これらの濃度の違いを反映したものと考えられる。また、ChDを使用した測定では、試料ガスインジェクション期間終了後のパージ期間におけるシグナルの立ち下りの飽和の速度も、試料7、試料8及び試料9の間で有意に異なっている。
図14~図23には、それぞれ、図13の測定と同一である測定対象の3種類のサイレージ試料について、図13の場合と同じ手順で測定を行った際のChE~ChNのMSSからのシグナル(単位はmV)の時間変化(単位は秒)を示す。
各MSSから得られたシグナル変化(経時変化)の特徴は、使用した感応膜材料の違いに起因して異なっているが、図14~図23より、ChE~ChNを使用した測定でも、試料ガスインジェクション期間(120秒間)のシグナル変化(シグナル波形)が3種類のサイレージ試料間で異なっていることがわかる。特に、ChE(感応膜材料:Poly(4-methylstyrene)、実施例1のChCと同じ材料。)、ChH(感応膜材料:Poly(2,6-diphenyl-p-phenylene oxide)、実施例1のChBと同じ材料。)、ChI(感応膜材料:Polyvinyl fluoride)、ChJ(感応膜材料:Polystyrene)、ChL(感応膜材料:Cellulose acetate butyrate)、ChM(感応膜材料:Polyethyleneimine)を使用した測定では、図13に示したChDを使用した測定と同様に、試料ガスインジェクション期間(120秒間)のシグナル変化(シグナル波形)が3種類のサイレージ試料間で明らかに異なっている(図14、17、18、19、21、22)。一方、これらのMSSでは、試料ガスインジェクション期間終了後のパージ期間におけるシグナルの立ち下りの飽和の速度について異なる傾向が見られた。例えば、ChE及びChIを使用した測定では、ChDの場合と同様に、試料7、試料8及び試料9の間で、シグナルの立ち下りの飽和の速度の差が見られたが、ChH、ChJ、ChL及びChMを使用した測定では、いずれも、試料7及び試料8のシグナルの立ち下りの飽和の速度はほぼ同じかわずかな差であったのに対して、試料9のシグナルの立ち下りの飽和の速度は、試料7及び試料8のそれよりも速い傾向が見られた。
ChF(感応膜材料:Phenyl-STNPs)を用いた測定では、試料ガスインジェクション期間、及び、試料ガスインジェクション期間終了後のパージ期間のいずれにおいても、試料7、試料8及び試料9の間で有意に異なるシグナル変化が見られた(図15)。
ChG(感応膜材料:C18-STNPs)を用いた測定では、試料ガスインジェクション期間において、試料7と試料8の間のシグナル変化の違いよりも、試料7、8と試料9の間のシグナル変化の違いが大きい傾向が見られた。また、試料ガスインジェクション期間終了後のパージ期間においては、試料8と試料7、9の間のシグナルの立ち下りの飽和の速度に違いが見られ、化学分析により品質の優劣が識別された試料間の差が識別可能であることが示唆された(図16)。
ChK(感応膜材料:Polycaprolactone)を用いた測定では、本実施例の測定で用いたそのほかのMSSとの比較では顕著な差ではないものの、試料ガスインジェクション期間において、試料7、試料8及び試料9の間でシグナル変化に違いが見られた。一方、試料ガスインジェクション期間終了後のパージ期間においては、試料7、試料8及び試料9の間でシグナルの立ち下りの飽和の速度にほとんど違いは見られなかった(図20)。
ChN(感応膜材料:TEOS-STNPs)を用いた測定では、ChKの場合と同様に、本実施例の測定で用いたそのほかのMSSとの比較では顕著な差ではないものの、試料ガスインジェクション期間において、試料7、試料8及び試料9の間でシグナル変化に違いが見られた。また、試料ガスインジェクション期間終了後のパージ期間においては、ChGの場合と同様に、試料8と試料7、9の間のシグナルの立ち下りの飽和の速度に違いが見られ、化学分析により品質の優劣が識別された試料間の差が識別可能であることが示唆された(図23)。
なお、本実施例で評価対象としたサイレージは、実施例1で用いたものと同様に、デントコーン及び牧草を使用して一般的な方法で製造されたものであって、牛等の動物の飼料として広く使用されるタイプのものである。従って、本実施例の結果からも、原料や発酵方法等が異なる他のサイレージ、あるいはそれを二次加工した発酵TMR(Total Mixed Rations、完全混合飼料)等の広範なサイレージ類に対して本発明の方法を有利に適用することが可能であることがわかる。
なお、本発明において、測定系から与えられるシグナルを評価するにあたっては、大まかな評価でよければシグナルの時間変化を目視するだけでよいが、より精密な評価のためには、例えば各種のサイレージ品質に対応するシグナルの時間変化パターンを参照パターンとして準備しておき、測定技術分野一般で一般的なパターンマッチングを行うことにより、測定対象のサイレージから得られたシグナルの時間変化パターンと参照パターンとを照合してもよい。あるいは、近年測定技術分野でしばしば使用されるようになった機械学習手法を用いることにより、サイレージから得られたシグナルの時間変化パターンからサイレージ品質を評価することもできる。このようなパターンマッチングや機械学習等は、測定システム内に設けられている情報処理装置、あるいは測定システムからインターフェースあるいは通信回線で接続されている先にある情報処理装置などの任意の情報処理装置により実行することができる。なお、パターンマッチングや機械学習の原理及び各種の測定結果にこれらを適用する手法自体は周知の事項であるので、これ以上の説明は省略する。
以上説明したように、本発明によれば、サイレージの発酵品質を従来に比較して簡易な装置構成を使用してしかも簡単な手順により短時間で評価することができるので、サイレージの製造、流通、またその使用の現場でサイレージ発酵品質評価を手軽に実施できるようになる。
自給飼料品質評価研究会編「改訂 粗飼料の品質評価ガイドブック」、社団法人 日本草地畜産種子協会(2001年)
南根室地区営農改善協議会著、根室農業改良普及センター 平成9年度営農改善資料第26集「特集 THE サイレージ」7.サイレージの発酵品質のチェック方法は?(http://www.nemuro.pref.hokkaido.lg.jp/ss/nkc/kannkoubutsu/no26/26-02-3.pdf)
Claims (19)
- サイレージから発生したガスを表面応力センサに与え、
前記サイレージから発生したガスに応答して前記表面応力センサから出力されるシグナルを使用して、前記サイレージから発生したガスの組成に基づく前記サイレージの発酵品質の評価を行う、
サイレージ発酵品質評価方法。 - 前記サイレージから発生したガスの組成に基づく前記サイレージの発酵品質の評価は、少なくとも前記ガス中の有機酸及び窒素含有化合物の一方の量に基づく評価である、請求項1に記載のサイレージ発酵品質評価方法。
- 前記発酵品質の評価は、前記シグナルの時間変化のパターンに基づいて行う、請求項1または2に記載のサイレージ発酵品質評価方法。
- 前記サイレージから発生したガス中の酪酸の量による時間変化のパターンへの影響の評価に基づいて前記発酵品質の評価を行う、請求項3に記載のサイレージ発酵品質評価方法。
- 前記サイレージから発生したガス中の酢酸の量による時間変化のパターンへの影響の評価に基づいて前記発酵品質の評価を行う、請求項3または4に記載のサイレージ発酵品質評価方法。
- 評価対象のサイレージを収容した容器に、発酵品質の評価に影響を与える成分を実質的に含有していないガスを通すことにより得られたガスを前記サイレージから発生したガスとして前記表面応力センサに供給する、請求項1から5の何れかに記載のサイレージ発酵品質評価方法。
- 前記表面応力センサに前記サイレージから発生したガスの供給を開始した以降の前記シグナルを使用して前記サイレージの発酵品質の評価を行う、請求項1から6の何れかに記載のサイレージ発酵品質評価方法。
- 前記表面応力センサは膜型表面応力センサである、請求項1から7の何れかに記載のサイレージ発酵品質評価方法。
- 前記表面応力センサの感応膜の材料としてPoly(methyl vinyl ether-alt-maleic anhydride)、Poly(2,6-diphenyl-p-phenylene oxide)及びPoly(4-methylstyrene)からなる群から選択された少なくとも一を使用する、請求項1から8の何れかに記載のサイレージ発酵品質評価方法。
- 前記表面応力センサの感応膜の材料としてPolymethyl methacrylate、Poly(4-methylstyrene)、フェニル基修飾シリカ/チタニア複合ナノ粒子、オクタデシル基修飾シリカ/チタニア複合ナノ粒子、Poly(2,6-diphenyl-p-phenylene oxide)、Polyvinyl fluoride、Polystyrene、Polycaprolactone、Cellulose acetate butyrate、Polyethyleneimine、及びテトラエトキシシラン修飾シリカ/チタニア複合ナノ粒子からなる群から選択された少なくとも一を使用する、請求項1から8の何れかに記載のサイレージ発酵品質評価方法。
- 前記表面応力センサとして、前記群から選択された一の材料を感応膜に使用した第1の表面応力センサと、前記群から選択された他の材料を感応膜として使用した第2の表面応力センサとを少なくとも使用する、請求項9または10に記載のサイレージ発酵品質評価方法。
- 前記サイレージから発生したガスとパージガスとを前記表面応力センサに交互に与え、前記サイレージから発生したガスに対応する前記シグナルと前記パージガスに対応する前記シグナルとを使用して前記サイレージの発酵品質の評価を行う、請求項1から11の何れかに記載のサイレージ発酵品質評価方法。
- 前記サイレージから発生したガスを前記表面応力センサに供給する時間区間と前記パージガスを前記表面応力センサに与える時間区間とに加えて、所定の標準ガスを前記表面応力センサに与える時間区間を設け、前記サイレージの発酵品質の評価にあたって前記標準ガスに対応する前記シグナルを更に使用する、請求項12に記載のサイレージ発酵品質評価方法。
- 前記標準ガスは液体または固体から発生するガスである、請求項13に記載のサイレージ発酵品質評価方法。
- 前記サイレージから発生したガスを追加のガスセンサに供給し、前記表面応力センサからのシグナルと前記追加のガスセンサからのシグナルとに基づいて前記サイレージの発酵品質の評価を行う、請求項1から14の何れかに記載のサイレージ発酵品質評価方法。
- 少なくとも一つの表面応力センサと、
測定対象のサイレージから発生した試料ガスを供給する第1のガス流路と、
測定すべきガス成分を含有しないパージガスを供給する第2のガス流路と
を設け、
前記第1のガス流路から供給される試料ガスと前記第2のガス流路から供給されるパージガスとを交互に切り替えて前記少なくとも一つの表面応力センサに供給して前記少なくとも一つの表面応力センサからシグナルを発生させることにより、請求項1から12の何れかに記載のサイレージ発酵品質評価方法を行う、サイレージ発酵品質評価装置。 - 追加のガスセンサと前記試料ガスを前記追加のガスセンサに供給する追加のガス流路とを設け、
前記少なくとも一つの表面応力センサからの前記シグナルと前記追加のガスセンサからのシグナルとに基づいて前記サイレージの発酵品質の評価を行う、請求項16に記載のサイレージ発酵品質評価装置。 - 少なくとも一つの表面応力センサと、
測定対象のサイレージから発生した試料ガスを供給する第1のガス流路と、
測定すべきガス成分を含有しないパージガスを供給する第2のガス流路と、
所定の成分組成を有する標準ガスを供給する第3のガス流路と
を設け、
前記第1のガス流路から供給される試料ガスと前記第2のガス流路から供給されるパージガスと前記第3のガス流路から供給される標準ガスとを所定の順序で切り替えて前記少なくとも一つの表面応力センサに供給して前記少なくとも一つの表面応力センサからシグナルを発生させることにより、請求項13または14に記載のサイレージ発酵品質評価方法を行う、サイレージ発酵品質評価装置。 - 追加のガスセンサと前記試料ガスを前記追加のガスセンサに供給する追加のガス流路とを設け、
前記少なくとも一つの表面応力センサからの前記シグナルと前記追加のガスセンサからのシグナルとに基づいて前記サイレージの発酵品質の評価を行う、請求項18に記載のサイレージ発酵品質評価装置。
Priority Applications (4)
| Application Number | Priority Date | Filing Date | Title |
|---|---|---|---|
| CN202180026952.9A CN115398227A (zh) | 2020-03-30 | 2021-03-19 | 青贮饲料发酵品质评价方法和装置 |
| US17/914,956 US20230147626A1 (en) | 2020-03-30 | 2021-03-19 | Evaluation method and evaluation device for silage fermentation quality |
| JP2022511916A JP7320803B2 (ja) | 2020-03-30 | 2021-03-19 | サイレージ発酵品質評価方法及び装置 |
| EP21779992.3A EP4130709A1 (en) | 2020-03-30 | 2021-03-19 | Silage fermentation quality evaluation method and device |
Applications Claiming Priority (2)
| Application Number | Priority Date | Filing Date | Title |
|---|---|---|---|
| JP2020059344 | 2020-03-30 | ||
| JP2020-059344 | 2020-03-30 |
Publications (1)
| Publication Number | Publication Date |
|---|---|
| WO2021200262A1 true WO2021200262A1 (ja) | 2021-10-07 |
Family
ID=77927074
Family Applications (1)
| Application Number | Title | Priority Date | Filing Date |
|---|---|---|---|
| PCT/JP2021/011325 WO2021200262A1 (ja) | 2020-03-30 | 2021-03-19 | サイレージ発酵品質評価方法及び装置 |
Country Status (5)
| Country | Link |
|---|---|
| US (1) | US20230147626A1 (ja) |
| EP (1) | EP4130709A1 (ja) |
| JP (1) | JP7320803B2 (ja) |
| CN (1) | CN115398227A (ja) |
| WO (1) | WO2021200262A1 (ja) |
Citations (7)
| Publication number | Priority date | Publication date | Assignee | Title |
|---|---|---|---|---|
| WO2011148774A1 (ja) | 2010-05-24 | 2011-12-01 | 独立行政法人物質・材料研究機構 | 表面応力センサ |
| US20170184556A1 (en) * | 2015-12-23 | 2017-06-29 | Commissariat A L`Energie Atomique Et Aux Energies Al Ternatives | Compact gas sensor with enhanced selectivity |
| CN108088962A (zh) * | 2018-02-05 | 2018-05-29 | 中国农业科学院麻类研究所 | 一种鉴别青贮发酵饲料品质的方法 |
| WO2018101128A1 (ja) * | 2016-11-29 | 2018-06-07 | 国立研究開発法人物質・材料研究機構 | 試料に対応付けられた推定対象値を推定する方法及び装置 |
| JP2018132325A (ja) | 2017-02-13 | 2018-08-23 | 国立研究開発法人物質・材料研究機構 | ニオイ測定による西洋梨の熟成度の非破壊検査方法および装置 |
| JP2019128312A (ja) | 2018-01-26 | 2019-08-01 | 株式会社ガステック | 放散ガスを利用したサイレージの品質評価方法とそのための装置 |
| WO2019244613A1 (ja) * | 2018-06-19 | 2019-12-26 | 国立研究開発法人物質・材料研究機構 | 受容体応答変調方法及び受容体応答の変調を利用した測定装置 |
-
2021
- 2021-03-19 US US17/914,956 patent/US20230147626A1/en active Pending
- 2021-03-19 EP EP21779992.3A patent/EP4130709A1/en active Pending
- 2021-03-19 WO PCT/JP2021/011325 patent/WO2021200262A1/ja unknown
- 2021-03-19 CN CN202180026952.9A patent/CN115398227A/zh active Pending
- 2021-03-19 JP JP2022511916A patent/JP7320803B2/ja active Active
Patent Citations (7)
| Publication number | Priority date | Publication date | Assignee | Title |
|---|---|---|---|---|
| WO2011148774A1 (ja) | 2010-05-24 | 2011-12-01 | 独立行政法人物質・材料研究機構 | 表面応力センサ |
| US20170184556A1 (en) * | 2015-12-23 | 2017-06-29 | Commissariat A L`Energie Atomique Et Aux Energies Al Ternatives | Compact gas sensor with enhanced selectivity |
| WO2018101128A1 (ja) * | 2016-11-29 | 2018-06-07 | 国立研究開発法人物質・材料研究機構 | 試料に対応付けられた推定対象値を推定する方法及び装置 |
| JP2018132325A (ja) | 2017-02-13 | 2018-08-23 | 国立研究開発法人物質・材料研究機構 | ニオイ測定による西洋梨の熟成度の非破壊検査方法および装置 |
| JP2019128312A (ja) | 2018-01-26 | 2019-08-01 | 株式会社ガステック | 放散ガスを利用したサイレージの品質評価方法とそのための装置 |
| CN108088962A (zh) * | 2018-02-05 | 2018-05-29 | 中国农业科学院麻类研究所 | 一种鉴别青贮发酵饲料品质的方法 |
| WO2019244613A1 (ja) * | 2018-06-19 | 2019-12-26 | 国立研究開発法人物質・材料研究機構 | 受容体応答変調方法及び受容体応答の変調を利用した測定装置 |
Non-Patent Citations (7)
| Title |
|---|
| "Quality Assessment Guidebook for Crude Feed (Revised", 2001, JAPAN GRASSLAND AGRICULTURE AND FORAGE SEED ASSOCIATION |
| "The Nemuro Center for Improving and Popularizing Agriculture", DOCUMENTS FOR FARMING IMPROVEMENT, vol. 26, 1997, Retrieved from the Internet <URL:http://www.nemuro.pref.hokkaido.lg.jp/ss/nkc/kannkoubutsu/n026/26-02-3.pdf> |
| "THE SILAGE", vol. 7, article "Minami-Nemuro District Farming Improvement Council" |
| FRÉDÉRIC LOIZEAU; TERUNOBU AKIYAMA; SEBASTIAN GAUTSCH; PETER VETTIGER; GENKI YOSHIKAWA; NICO DE ROOIJ: "Membrane-Type Surface Stress Sensor with Piezoresistive Readout", PROCEDIA ENGINEERING, vol. 47, no. 2, 1 January 2012 (2012-01-01), NL , pages 1085 - 1088, XP055645374, ISSN: 1877-7058, DOI: 10.1016/j.proeng.2012.09.339 * |
| KIDA, TAMAKI: "Discussion of Silage Smell Measurement Method.", GRASSLAND SCIENCE, vol. 48, 21 September 2002 (2002-09-21), JP , pages 204 - 205, XP009536193, ISSN: 0447-5933, DOI: 10.14941/grass.48.204 * |
| NO, EIJI: "Silage Quality Evaluation Methods", DAIRY JOURNAL, vol. 66, no. 3, 1 March 2013 (2013-03-01), pages 64 - 65, XP009539364, ISSN: 0916-3360 * |
| See also references of EP4130709A1 |
Also Published As
| Publication number | Publication date |
|---|---|
| CN115398227A (zh) | 2022-11-25 |
| JP7320803B2 (ja) | 2023-08-04 |
| JPWO2021200262A1 (ja) | 2021-10-07 |
| US20230147626A1 (en) | 2023-05-11 |
| EP4130709A1 (en) | 2023-02-08 |
Similar Documents
| Publication | Publication Date | Title |
|---|---|---|
| Pasquini et al. | Flow-injection determination of ammonia in Kjeldahl digests by gas diffusion and conductometry | |
| Schütz et al. | Detection of volatiles released by diseased potato tubers using a biosensor on the basis of intact insect antennae | |
| CN102778541A (zh) | 一种气体传感器标定装置与方法 | |
| Chakraborty et al. | Detection of biomarker in breath: A step towards noninvasive diabetes monitoring | |
| Ito et al. | Bitterness evaluation of H (1)-receptor antagonists using a taste sensor | |
| Ganjali et al. | Cu (II)-all solid state sensor ion selective electrode (ASS-ISE) with a nano-molar detection limit and its use for the analysis of waste water samples | |
| CN106841066A (zh) | 一种用于光谱法cod检测中的局部校准方法 | |
| CN104215629A (zh) | 一种醛类消毒剂浓度快速测试试纸的研制及生产 | |
| CN103344696A (zh) | 一种利用faims检测猪肉新鲜度的方法 | |
| Liu et al. | Repeatability and sensitivity of quartz crystal microbalance (QCM) sensor array modified with four sensitive materials | |
| WO2021200262A1 (ja) | サイレージ発酵品質評価方法及び装置 | |
| AU2001247614B2 (en) | Lithium ion-selective electrode for clinical applications | |
| Calvo et al. | Use of sequential injection analysis to construct an electronic-tongue: Application to multidetermination employing the transient response of a potentiometric sensor array | |
| Junsomboon et al. | Flow injection conductometric system with gas diffusion separation for the determination of Kjeldahl nitrogen in milk and chicken meat | |
| US9970894B2 (en) | Method and device for measuring concentration of substance in fluid | |
| CN114624303A (zh) | 一种用于快速定量测定电子烟中尼古丁的电化学方法 | |
| Yu et al. | An optical fiber sensor probe using a PMMA/CPR coated bent optical fiber as a transducer for monitoring trace ammonia | |
| Kang et al. | Determination of glutaraldehyde in water samples by headspace solid-phase microextraction and gas chromatography–mass spectrometry after derivatization with 2, 2, 2-trifluoroethylhydrazine | |
| JP4125955B2 (ja) | 液体試料に関連するヘッドスペース内に存在する脂肪酸の検出による液体試料の感染検出方法 | |
| Jiao et al. | In-planta nitrate detection using insertable plant microsensor | |
| WO2022014512A1 (ja) | ケトーシス罹患判定方法及び装置 | |
| JP2007278774A (ja) | におい評価装置 | |
| CN103969319A (zh) | 一种水生生物金属硫蛋白的检测方法 | |
| CN110411999B (zh) | 基于八元瓜环检测l-苯丙氨酸的荧光探针及其检测方法 | |
| von Jasmund et al. | Assessment of ammonia sensors and photoacoustic measurement systems using a gas calibration unit |
Legal Events
| Date | Code | Title | Description |
|---|---|---|---|
| 121 | Ep: the epo has been informed by wipo that ep was designated in this application |
Ref document number: 21779992 Country of ref document: EP Kind code of ref document: A1 |
|
| ENP | Entry into the national phase |
Ref document number: 2022511916 Country of ref document: JP Kind code of ref document: A |
|
| NENP | Non-entry into the national phase |
Ref country code: DE |
|
| ENP | Entry into the national phase |
Ref document number: 2021779992 Country of ref document: EP Effective date: 20221031 |