WO2021200262A1 - Procédé et dispositif d'évaluation de qualité de fermentation d'un ensilage - Google Patents
Procédé et dispositif d'évaluation de qualité de fermentation d'un ensilage Download PDFInfo
- Publication number
- WO2021200262A1 WO2021200262A1 PCT/JP2021/011325 JP2021011325W WO2021200262A1 WO 2021200262 A1 WO2021200262 A1 WO 2021200262A1 JP 2021011325 W JP2021011325 W JP 2021011325W WO 2021200262 A1 WO2021200262 A1 WO 2021200262A1
- Authority
- WO
- WIPO (PCT)
- Prior art keywords
- silage
- gas
- fermentation quality
- surface stress
- stress sensor
- Prior art date
Links
- 239000004460 silage Substances 0.000 title claims abstract description 216
- 238000000855 fermentation Methods 0.000 title claims abstract description 101
- 230000004151 fermentation Effects 0.000 title claims abstract description 101
- 238000000034 method Methods 0.000 title claims abstract description 59
- 238000013441 quality evaluation Methods 0.000 title claims description 45
- 239000007789 gas Substances 0.000 claims abstract description 303
- 150000007524 organic acids Chemical class 0.000 claims abstract description 79
- 238000011156 evaluation Methods 0.000 claims abstract description 46
- QTBSBXVTEAMEQO-UHFFFAOYSA-N Acetic acid Chemical compound CC(O)=O QTBSBXVTEAMEQO-UHFFFAOYSA-N 0.000 claims description 72
- 238000010926 purge Methods 0.000 claims description 68
- 230000008859 change Effects 0.000 claims description 56
- FERIUCNNQQJTOY-UHFFFAOYSA-N Butyric acid Chemical compound CCCC(O)=O FERIUCNNQQJTOY-UHFFFAOYSA-N 0.000 claims description 50
- 239000000463 material Substances 0.000 claims description 47
- GWEVSGVZZGPLCZ-UHFFFAOYSA-N Titan oxide Chemical compound O=[Ti]=O GWEVSGVZZGPLCZ-UHFFFAOYSA-N 0.000 claims description 24
- 239000000203 mixture Substances 0.000 claims description 21
- -1 nitrogen-containing compound Chemical class 0.000 claims description 21
- 230000004044 response Effects 0.000 claims description 15
- 239000002131 composite material Substances 0.000 claims description 12
- 239000002105 nanoparticle Substances 0.000 claims description 12
- 229920000314 poly p-methyl styrene Polymers 0.000 claims description 8
- LBCHYKTUUMRFHG-UHFFFAOYSA-N 3,5-diphenyl-7-oxabicyclo[2.2.1]hepta-1(6),2,4-triene Chemical compound C=1C(C=2C=CC=CC=2)=C2OC=1C=C2C1=CC=CC=C1 LBCHYKTUUMRFHG-UHFFFAOYSA-N 0.000 claims description 6
- 239000007788 liquid Substances 0.000 claims description 6
- 229920002873 Polyethylenimine Polymers 0.000 claims description 5
- 239000004793 Polystyrene Substances 0.000 claims description 5
- 229920006217 cellulose acetate butyrate Polymers 0.000 claims description 5
- 229920001610 polycaprolactone Polymers 0.000 claims description 5
- 239000004632 polycaprolactone Substances 0.000 claims description 5
- 229920002223 polystyrene Polymers 0.000 claims description 5
- 239000007787 solid Substances 0.000 claims description 5
- 229920002620 polyvinyl fluoride Polymers 0.000 claims description 4
- 229920003229 poly(methyl methacrylate) Polymers 0.000 claims description 3
- 239000004926 polymethyl methacrylate Substances 0.000 claims description 3
- OMIHGPLIXGGMJB-UHFFFAOYSA-N 7-oxabicyclo[4.1.0]hepta-1,3,5-triene Chemical compound C1=CC=C2OC2=C1 OMIHGPLIXGGMJB-UHFFFAOYSA-N 0.000 claims 1
- 238000005259 measurement Methods 0.000 abstract description 139
- QJGQUHMNIGDVPM-UHFFFAOYSA-N nitrogen group Chemical group [N] QJGQUHMNIGDVPM-UHFFFAOYSA-N 0.000 abstract description 4
- 235000005985 organic acids Nutrition 0.000 description 34
- 238000002347 injection Methods 0.000 description 25
- 239000007924 injection Substances 0.000 description 25
- IJGRMHOSHXDMSA-UHFFFAOYSA-N Atomic nitrogen Chemical compound N#N IJGRMHOSHXDMSA-UHFFFAOYSA-N 0.000 description 20
- 239000007864 aqueous solution Substances 0.000 description 20
- QGZKDVFQNNGYKY-UHFFFAOYSA-N Ammonia Chemical compound N QGZKDVFQNNGYKY-UHFFFAOYSA-N 0.000 description 16
- JVTAAEKCZFNVCJ-UHFFFAOYSA-N lactic acid Chemical compound CC(O)C(O)=O JVTAAEKCZFNVCJ-UHFFFAOYSA-N 0.000 description 16
- 230000000875 corresponding effect Effects 0.000 description 12
- 239000012528 membrane Substances 0.000 description 10
- 239000000126 substance Substances 0.000 description 10
- 238000004458 analytical method Methods 0.000 description 9
- 229910052757 nitrogen Inorganic materials 0.000 description 9
- 229910021529 ammonia Inorganic materials 0.000 description 8
- 239000004310 lactic acid Substances 0.000 description 8
- 235000014655 lactic acid Nutrition 0.000 description 8
- 238000010801 machine learning Methods 0.000 description 7
- 238000005070 sampling Methods 0.000 description 7
- 239000013076 target substance Substances 0.000 description 7
- XLYOFNOQVPJJNP-UHFFFAOYSA-N water Substances O XLYOFNOQVPJJNP-UHFFFAOYSA-N 0.000 description 7
- 235000019645 odor Nutrition 0.000 description 6
- 230000002411 adverse Effects 0.000 description 5
- XBDQKXXYIPTUBI-UHFFFAOYSA-N dimethylselenoniopropionate Natural products CCC(O)=O XBDQKXXYIPTUBI-UHFFFAOYSA-N 0.000 description 5
- 239000000284 extract Substances 0.000 description 5
- 238000004519 manufacturing process Methods 0.000 description 5
- 239000002994 raw material Substances 0.000 description 5
- 241000283690 Bos taurus Species 0.000 description 4
- 238000003795 desorption Methods 0.000 description 4
- 230000000694 effects Effects 0.000 description 4
- 230000010365 information processing Effects 0.000 description 4
- 230000008569 process Effects 0.000 description 4
- 238000012545 processing Methods 0.000 description 4
- 230000008786 sensory perception of smell Effects 0.000 description 4
- 241001465754 Metazoa Species 0.000 description 3
- XUIMIQQOPSSXEZ-UHFFFAOYSA-N Silicon Chemical compound [Si] XUIMIQQOPSSXEZ-UHFFFAOYSA-N 0.000 description 3
- 239000002253 acid Substances 0.000 description 3
- 125000004432 carbon atom Chemical group C* 0.000 description 3
- 238000010586 diagram Methods 0.000 description 3
- 238000005516 engineering process Methods 0.000 description 3
- 230000006872 improvement Effects 0.000 description 3
- 229920006395 saturated elastomer Polymers 0.000 description 3
- 229910052710 silicon Inorganic materials 0.000 description 3
- 239000010703 silicon Substances 0.000 description 3
- 238000001179 sorption measurement Methods 0.000 description 3
- 238000002336 sorption--desorption measurement Methods 0.000 description 3
- 238000003860 storage Methods 0.000 description 3
- NQPDZGIKBAWPEJ-UHFFFAOYSA-N valeric acid Chemical compound CCCCC(O)=O NQPDZGIKBAWPEJ-UHFFFAOYSA-N 0.000 description 3
- 241000209504 Poaceae Species 0.000 description 2
- 241000282849 Ruminantia Species 0.000 description 2
- VYPSYNLAJGMNEJ-UHFFFAOYSA-N Silicium dioxide Chemical class O=[Si]=O VYPSYNLAJGMNEJ-UHFFFAOYSA-N 0.000 description 2
- 235000002017 Zea mays subsp mays Nutrition 0.000 description 2
- 241000482268 Zea mays subsp. mays Species 0.000 description 2
- 230000008901 benefit Effects 0.000 description 2
- 238000006243 chemical reaction Methods 0.000 description 2
- 238000004891 communication Methods 0.000 description 2
- 150000001875 compounds Chemical class 0.000 description 2
- 230000002596 correlated effect Effects 0.000 description 2
- 229910001873 dinitrogen Inorganic materials 0.000 description 2
- 238000007429 general method Methods 0.000 description 2
- 230000020169 heat generation Effects 0.000 description 2
- 244000144972 livestock Species 0.000 description 2
- 238000000691 measurement method Methods 0.000 description 2
- 238000000879 optical micrograph Methods 0.000 description 2
- 235000019260 propionic acid Nutrition 0.000 description 2
- IUVKMZGDUIUOCP-BTNSXGMBSA-N quinbolone Chemical compound O([C@H]1CC[C@H]2[C@H]3[C@@H]([C@]4(C=CC(=O)C=C4CC3)C)CC[C@@]21C)C1=CCCC1 IUVKMZGDUIUOCP-BTNSXGMBSA-N 0.000 description 2
- 230000002123 temporal effect Effects 0.000 description 2
- BJEPYKJPYRNKOW-REOHCLBHSA-N (S)-malic acid Chemical compound OC(=O)[C@@H](O)CC(O)=O BJEPYKJPYRNKOW-REOHCLBHSA-N 0.000 description 1
- JLBJTVDPSNHSKJ-UHFFFAOYSA-N 4-Methylstyrene Chemical compound CC1=CC=C(C=C)C=C1 JLBJTVDPSNHSKJ-UHFFFAOYSA-N 0.000 description 1
- DUGLMATUSUVYMV-UHFFFAOYSA-N 7-oxabicyclo[2.2.1]hepta-1,3,5-triene Chemical compound C1=C(O2)C=CC2=C1 DUGLMATUSUVYMV-UHFFFAOYSA-N 0.000 description 1
- 244000025254 Cannabis sativa Species 0.000 description 1
- OKTJSMMVPCPJKN-UHFFFAOYSA-N Carbon Chemical compound [C] OKTJSMMVPCPJKN-UHFFFAOYSA-N 0.000 description 1
- KDYFGRWQOYBRFD-UHFFFAOYSA-N Succinic acid Natural products OC(=O)CCC(O)=O KDYFGRWQOYBRFD-UHFFFAOYSA-N 0.000 description 1
- BJEPYKJPYRNKOW-UHFFFAOYSA-N alpha-hydroxysuccinic acid Natural products OC(=O)C(O)CC(O)=O BJEPYKJPYRNKOW-UHFFFAOYSA-N 0.000 description 1
- XKMRRTOUMJRJIA-UHFFFAOYSA-N ammonia nh3 Chemical compound N.N XKMRRTOUMJRJIA-UHFFFAOYSA-N 0.000 description 1
- 238000013459 approach Methods 0.000 description 1
- KDYFGRWQOYBRFD-NUQCWPJISA-N butanedioic acid Chemical compound O[14C](=O)CC[14C](O)=O KDYFGRWQOYBRFD-NUQCWPJISA-N 0.000 description 1
- 238000004364 calculation method Methods 0.000 description 1
- 229910052799 carbon Inorganic materials 0.000 description 1
- 239000013626 chemical specie Substances 0.000 description 1
- 239000011248 coating agent Substances 0.000 description 1
- 238000000576 coating method Methods 0.000 description 1
- 238000009833 condensation Methods 0.000 description 1
- 230000005494 condensation Effects 0.000 description 1
- 230000001276 controlling effect Effects 0.000 description 1
- 238000001816 cooling Methods 0.000 description 1
- 239000013078 crystal Substances 0.000 description 1
- 238000005520 cutting process Methods 0.000 description 1
- 238000011982 device technology Methods 0.000 description 1
- 235000013325 dietary fiber Nutrition 0.000 description 1
- 238000009792 diffusion process Methods 0.000 description 1
- 238000004821 distillation Methods 0.000 description 1
- 238000001704 evaporation Methods 0.000 description 1
- 230000003203 everyday effect Effects 0.000 description 1
- 238000002474 experimental method Methods 0.000 description 1
- 235000013305 food Nutrition 0.000 description 1
- 230000036541 health Effects 0.000 description 1
- 244000038280 herbivores Species 0.000 description 1
- 239000011261 inert gas Substances 0.000 description 1
- 230000003993 interaction Effects 0.000 description 1
- 230000007774 longterm Effects 0.000 description 1
- 239000001630 malic acid Substances 0.000 description 1
- 235000011090 malic acid Nutrition 0.000 description 1
- 238000002360 preparation method Methods 0.000 description 1
- 238000011160 research Methods 0.000 description 1
- 230000000630 rising effect Effects 0.000 description 1
- 239000004065 semiconductor Substances 0.000 description 1
- 230000035945 sensitivity Effects 0.000 description 1
- 238000005507 spraying Methods 0.000 description 1
- 230000000087 stabilizing effect Effects 0.000 description 1
- 238000001256 steam distillation Methods 0.000 description 1
- 229920003002 synthetic resin Polymers 0.000 description 1
- 239000000057 synthetic resin Substances 0.000 description 1
- 230000036962 time dependent Effects 0.000 description 1
- 238000006276 transfer reaction Methods 0.000 description 1
- 238000011144 upstream manufacturing Methods 0.000 description 1
- 229940070710 valerate Drugs 0.000 description 1
- 229940005605 valeric acid Drugs 0.000 description 1
- 229920002554 vinyl polymer Polymers 0.000 description 1
- 239000002699 waste material Substances 0.000 description 1
Images


Classifications
-
- G—PHYSICS
- G01—MEASURING; TESTING
- G01N—INVESTIGATING OR ANALYSING MATERIALS BY DETERMINING THEIR CHEMICAL OR PHYSICAL PROPERTIES
- G01N33/00—Investigating or analysing materials by specific methods not covered by groups G01N1/00 - G01N31/00
- G01N33/0004—Gaseous mixtures, e.g. polluted air
- G01N33/0009—General constructional details of gas analysers, e.g. portable test equipment
- G01N33/0027—General constructional details of gas analysers, e.g. portable test equipment concerning the detector
- G01N33/0036—Specially adapted to detect a particular component
- G01N33/0047—Specially adapted to detect a particular component for organic compounds
-
- A—HUMAN NECESSITIES
- A23—FOODS OR FOODSTUFFS; TREATMENT THEREOF, NOT COVERED BY OTHER CLASSES
- A23K—FODDER
- A23K30/00—Processes specially adapted for preservation of materials in order to produce animal feeding-stuffs
- A23K30/10—Processes specially adapted for preservation of materials in order to produce animal feeding-stuffs of green fodder
- A23K30/15—Processes specially adapted for preservation of materials in order to produce animal feeding-stuffs of green fodder using chemicals or microorganisms for ensilaging
-
- A—HUMAN NECESSITIES
- A23—FOODS OR FOODSTUFFS; TREATMENT THEREOF, NOT COVERED BY OTHER CLASSES
- A23K—FODDER
- A23K50/00—Feeding-stuffs specially adapted for particular animals
- A23K50/10—Feeding-stuffs specially adapted for particular animals for ruminants
-
- G—PHYSICS
- G01—MEASURING; TESTING
- G01N—INVESTIGATING OR ANALYSING MATERIALS BY DETERMINING THEIR CHEMICAL OR PHYSICAL PROPERTIES
- G01N33/00—Investigating or analysing materials by specific methods not covered by groups G01N1/00 - G01N31/00
- G01N33/0004—Gaseous mixtures, e.g. polluted air
- G01N33/0009—General constructional details of gas analysers, e.g. portable test equipment
- G01N33/0027—General constructional details of gas analysers, e.g. portable test equipment concerning the detector
- G01N33/0036—Specially adapted to detect a particular component
- G01N33/0037—Specially adapted to detect a particular component for NOx
-
- Y—GENERAL TAGGING OF NEW TECHNOLOGICAL DEVELOPMENTS; GENERAL TAGGING OF CROSS-SECTIONAL TECHNOLOGIES SPANNING OVER SEVERAL SECTIONS OF THE IPC; TECHNICAL SUBJECTS COVERED BY FORMER USPC CROSS-REFERENCE ART COLLECTIONS [XRACs] AND DIGESTS
- Y02—TECHNOLOGIES OR APPLICATIONS FOR MITIGATION OR ADAPTATION AGAINST CLIMATE CHANGE
- Y02P—CLIMATE CHANGE MITIGATION TECHNOLOGIES IN THE PRODUCTION OR PROCESSING OF GOODS
- Y02P60/00—Technologies relating to agriculture, livestock or agroalimentary industries
- Y02P60/80—Food processing, e.g. use of renewable energies or variable speed drives in handling, conveying or stacking
- Y02P60/87—Re-use of by-products of food processing for fodder production
Definitions
- the present invention relates mainly to silage used as feed for cattle, and particularly to evaluation of fermentation quality of silage during the manufacturing process or storage of silage.
- a large amount of silage fermented from pasture, grasses, grasses, and waste from the food processing process is used as feed for domestic ruminants such as cattle and other herbivores. Fermentation during the production of silage is mainly lactic acid fermentation, but fermentation other than lactic acid fermentation also proceeds depending on the fermentation conditions and subsequent storage conditions, and in some cases, rot may occur.
- the fermentation quality deteriorates, that is, fermentation or decay other than lactic acid fermentation causes an increase in volatile basic nitrogen such as butyric acid and valerate, which has a large number of carbon atoms, and ammonia
- the silage animal causes an increase in silage. It becomes a silage that I don't like. Also, if ruminants ingest such low quality silage, it can be harmful to their health. Therefore, it is important for the livestock industry to inspect and control the fermentation quality of silage in the process of manufacturing, storing, distributing and using silage.
- Non-Patent Document 1 The V score evaluates fermentation quality on a scale of 100 points, but 50 points are allocated and the remaining 50 points are organic, assuming that the value of ammonia nitrogen content (VBN) / total nitrogen content (TN) should be small. It is distributed to acid (VFA). As for the score for organic acids, the smaller the organic acid having butyric acid or higher carbon number (that is, C4 or higher), the higher the score (out of 40 points), and the lower the acetic acid + propionic acid content, the higher the score (10). Perfect score). Then, the V score is calculated as the total of these evaluation points.
- Patent Document 1 in order to evaluate the fermentation quality of silage coated with a synthetic resin film, the change over time in the ammonia concentration in the gas leaked to the outside of the coating was observed, and the increase / decrease was observed. It describes how to evaluate the quality.
- the present invention evaluates the fermentation quality of silage at that time by detecting volatile components (odor) from silage with a surface stress sensor, and also provides an apparatus for this evaluation.
- the challenge is to provide it.
- the gas generated from the silage is given to the surface stress sensor, and the signal output from the surface stress sensor in response to the gas generated from the silage is used to generate the gas from the silage.
- a silage fermentation quality evaluation method for evaluating the fermentation quality of the silage based on the composition of the gas is provided.
- the evaluation of the fermentation quality of the silage based on the composition of the gas generated from the silage may be based on at least the amount of one of the organic acid and the nitrogen-containing compound in the gas.
- the evaluation of the fermentation quality may be performed based on the time-varying pattern of the signal.
- the fermentation quality may be evaluated based on the evaluation of the influence of the amount of butyric acid in the gas generated from the silage on the pattern of time change. Further, the fermentation quality may be evaluated based on the evaluation of the influence of the amount of acetic acid in the gas generated from the silage on the pattern of time change.
- the surface stress sensor uses the gas obtained by passing a gas containing substantially no component affecting the evaluation of fermentation quality through the container containing the silage to be evaluated as the gas generated from the silage. May be supplied to. Further, the fermentation quality of the silage may be evaluated by using the signal after the gas generated from the silage is started to be supplied to the surface stress sensor. Further, the surface stress sensor may be a film type surface stress sensor.
- the material of the sensitive film of the surface stress sensor is selected from the group consisting of Poly (methyl vinyl ether-alt-maleic anhydride), Poly (2,6-diphenyl-p-phenylene oxide) and Poly (4-methylstyrene). You may use at least one. Further, as the material of the sensitive film of the surface stress sensor, Polymethylryl, Poly (4-methylstyrene), phenyl group-modified silica / titania composite nanoparticles, octadecyl group-modified silica / titania composite nanoparticles, Poly (2,6-diphenyl-).
- At least one selected from the group consisting of p-phenylene oxide), Polyvinyl condensation, Polystyrene, Polycaprolactone, Cellulose acetate butyrate, Polyethyleneimine, and tetraethoxysilane modified silica / titania composite nanoparticles may be used.
- a first surface stress sensor using one material selected from the above group for the sensitive film and a second surface using another material selected from the above group as the sensitive film. At least a stress sensor may be used as the surface stress sensor.
- the gas generated from the silage and the purge gas are alternately applied to the surface stress sensor, and the signal corresponding to the gas generated from the silage and the signal corresponding to the purge gas are used to obtain the fermentation quality of the silage. May be evaluated. Further, in addition to the time interval for supplying the gas generated from the silage to the surface stress sensor and the time interval for applying the purge gas to the surface stress sensor, a time interval for applying a predetermined standard gas to the surface stress sensor is provided. , The signal corresponding to the standard gas may be further used in assessing the fermentation quality of the silage. Further, the standard gas may be a gas generated from a liquid or a solid.
- the gas generated from the silage may be supplied to an additional gas sensor, and the fermentation quality of the silage may be evaluated based on the signal from the surface stress sensor and the signal from the additional gas sensor.
- at least one surface stress sensor, a first gas flow path for supplying the sample gas generated from the silage to be measured, and a purge gas containing no gas component to be measured are supplied.
- a second gas flow path is provided, and the sample gas supplied from the first gas flow path and the purge gas supplied from the second gas flow path are alternately switched to the at least one surface stress sensor.
- an additional gas sensor and an additional gas flow path for supplying the sample gas to the additional gas sensor are provided, based on the signal from the at least one surface stress sensor and the signal from the additional gas sensor.
- the fermentation quality of the silage may be evaluated.
- at least one surface stress sensor, a first gas flow path for supplying the sample gas generated from the silage to be measured, and a purge gas containing no gas component to be measured are supplied.
- a second gas flow path and a third gas flow path for supplying a standard gas having a predetermined component composition are provided, and a sample gas supplied from the first gas flow path and the second gas flow path are provided.
- the purge gas supplied from the path and the standard gas supplied from the third gas flow path are switched in a predetermined order and supplied to the at least one surface stress sensor to generate a signal from the at least one surface stress sensor.
- This provides a silage fermentation quality evaluation device that performs any of the above silage fermentation quality evaluation methods.
- an additional gas sensor and an additional gas flow path for supplying the sample gas to the additional gas sensor are provided, based on the signal from the at least one surface stress sensor and the signal from the additional gas sensor.
- the fermentation quality of the silage may be evaluated.
- the composition of organic acid which is one of the important evaluation items for the fermentation quality of silage, for example, the ratio of butyric acid and acetic acid in the gas volatilized from silage can be easily evaluated.
- the ratio of the C2 and C3 components in the organic acid generated by the fermentation of silage to the components of C4 and above and the amount of the C2 and C3 components can be easily determined.
- the fermentation quality of silage can be comprehensively evaluated from the output signals from a plurality of surface stress sensors coated with a sensitive film capable of detecting organic acids, volatile basic nitrogen and the like with high sensitivity.
- the surface stress sensor can detect multiple target substances with one sensitive film by selecting an appropriate sensitive film material, but the sensor's response to each target substance should have different amplitudes and response waveforms. Therefore, by combining a plurality of surface stress sensor outputs, it is possible to obtain a fermentation quality evaluation value in which parameters corresponding to a plurality of target substances are appropriately combined.
- Example 1 the time change (unit: mV) of the signal (unit: mV) from the MSS of ChA when a 1% aqueous solution of each organic acid was contained in a vial and measured by the measuring device shown in FIG.
- FIG. 5 by the same procedure as the case of FIG.
- the figure which shows the result of having individually contained the silage to be measured which is the same as the measurement of FIG.
- It is a figure which shows the result of having measured the mixed organic acid aqueous solution (pseudo silage aqueous solution) which has the same organic acid composition as the extract of silage to be measured which is the same as the measurement of FIG. 5 by the same procedure as the case of FIG.
- FIG. 1 The figure which shows the result of having individually contained the silage to be measured which is the same as the measurement of FIG.
- the three types of silage samples to be measured which are the same as the measurement in FIG.
- the three types of silage samples to be measured which are the same as the measurement in FIG. 13
- ⁇ Criteria 1 The value of the ratio of the amount of an organic acid having 4 or more carbon atoms (hereinafter referred to as C4) in the molecule to the amount of an organic acid having 2 or 3 carbon atoms (hereinafter referred to as C2 and C3, respectively) is Large silage is of poor quality (evaluation from this point of view is also called C4 evaluation).
- C4 evaluation The value of the ratio of the amount of an organic acid having 4 or more carbon atoms (hereinafter referred to as C4) in the molecule to the amount of an organic acid having 2 or 3 carbon atoms (hereinafter referred to as C2 and C3, respectively) is Large silage is of poor quality (evaluation from this point of view is also called C4 evaluation).
- C4 evaluation the amount of an organic acid having 4 or more carbon atoms
- Silage with a large amount of organic acids with 2 or 3 carbons is also of poor quality (evaluation from this point of view is also called C2 + C3 evaluation). Is said to be.
- the inventor of the present application was inspired by the idea of evaluating silage quality by detecting the amount of various organic acids in such silage with a surface stress sensor, and as a result of proceeding with research, the present invention was completed. ..
- At least one surface stress sensor is provided in which the response characteristics to at least one of the organic acids belonging to C2 and / or C3 and the response characteristics to at least one of the organic acids belonging to C4 are different.
- the silage is evaluated based on the output of such a surface stress sensor. More specifically, the output of the surface stress sensor is evaluated for at least one of the above criteria 1 and 2, and the silage is evaluated from the result.
- individual surface stress sensors may be provided corresponding to individual organic acids.
- the amount of a smaller number of representative organic acids and the mutual ratio are obtained. May be good. This is because the reaction to produce these organic acids and the composition of the raw materials are not so flexible, so the amount of one component is not completely independent of the amount of other similar components.
- acetic acid may be used as a representative component as C2 + C3
- butyric acid may be used as a representative component as C4. If the representative component is selected in this way, acetic acid and butyric acid have the highest volatility in each group of organic acids and are easily detected as gas, which is advantageous in measurement.
- the fermentation quality of silage is evaluated solely by measuring the amount and ratio of various organic acids volatilized from silage
- the components to be measured are not limited to this. No.
- silage fermentation quality evaluation can be realized by obtaining the amount and the ratio between the components of both the organic acid and nitrogen-containing compounds categories.
- knowing only one of them can evaluate the fermentation quality of silage to a fairly practical degree.
- the bark score described in Non-Patent Document 2 evaluates based on the composition of organic acids such as lactic acid, acetic acid, and butyric acid, but as explained there, it also depends on the silage production conditions and fermentation conditions.
- organic acids such as lactic acid, acetic acid, and butyric acid
- the difference from the V score becomes large, etc.
- nitrogen in many cases nitrogen.
- Good quality evaluation that is well correlated with the V score that measures up to the contained compound becomes possible.
- butyric acid concentration which is reported to increase the risk of illness when the intake is high (45 g / day or more)
- more accurate and stable quality evaluation can be performed by measuring the amount of an organic acid selected from C2 + C3 organic acids, for example, acetic acid as shown in Examples.
- the organic acid is added to or in place of the measurement of the organic acid and / or the nitrogen-containing compound. It is also possible to evaluate the silage quality by measuring components other than the compounds containing nitrogen and nitrogen.
- the surface stress sensor can obtain response signals (also called signals) for a plurality of target substances from one sensitive film in a form in which they are superimposed. That is, by appropriately selecting the sensitive film material for many target substances, the amplitude and response waveform of the surface stress sensor can be made different from each other in the response of the surface stress sensor to each target substance. Therefore, by combining a plurality of surface stress sensor outputs, it is possible to obtain a fermentation quality evaluation value in which parameters corresponding to a plurality of target substances are appropriately combined. At this time, as described above, by performing pattern matching and machine learning of the output of the surface stress sensor, features can be appropriately extracted from these outputs, and the surface stress can be obtained by using a relatively small number of surface stress sensors.
- silage fermentation quality evaluation based on more parameters than the number of sensors.
- other types of gas sensors that are particularly convenient for detecting specific components that are present in the gas generated from the measurement target and are useful for silage quality evaluation can be used.
- such a gas sensor can be used in combination with the surface stress sensor, if necessary.
- FIG. 1 shows an outline of a measurement system configuration that can be used for this purpose.
- a film-type surface stress sensor MMS
- the two gas flow paths are not the gas components to be measured as shown by the white arrows from the left side of the figure, respectively, and the measurement of such gas components is not affected as much as possible.
- an inert gas also called purge gas or reference gas.
- purge gas for example, nitrogen gas or air can be used, but here, nitrogen gas was used.
- the gas flow path shown on the upper side gives the MSS a purge gas that does not contain a gas component to be measured, thereby desorbing various gases diffused in the sensitive film coated on the surface of the MSS. Perform a purge process to initialize the MSS.
- the gas flow passing through the gas flow path on the lower side of FIG. 1 is supplied to the MSS in a state of containing the gas component volatilized from the sample in the vial placed immediately after the MFC.
- a configuration that does not use a vial can be adopted.
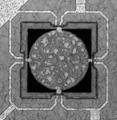
- FIG. 2 An example of an optical micrograph of MSS is shown in FIG.
- the MSS shown in FIG. 2 is formed from a silicon wafer used in the field of semiconductor device technology, which is cut out from a silicon single crystal, and a circular portion in the center (may be another shape such as a square) is around the silicon wafer. It is connected and fixed to the frame-shaped portion of the circular portion at four places on the top, bottom, left and right of the circular portion.
- the gas component given to the MSS is adsorbed and desorbed on the sensitive film applied to the surface of the circular portion, so that the surface stress applied to the MSS is concentrated in these four fixed regions and is provided in these fixed regions.
- a change in the electrical resistance of the piezoresistive element is brought about.
- piezoresistive elements are interconnected by a conductive region (shown as a grain-like region in FIG. 2) provided in the frame-shaped portion to form a Wheatstone bridge.
- a voltage is applied between the two opposing nodes of the Wheatstone bridge, and the voltage appearing between the remaining two nodes is taken out of the MSS as a signal output from the MSS to perform the required analysis.
- the structure and operation of such an MSS are described in detail in Patent Document 3, for example.
- the sensitive film is widely applied not only to the circular portion of the MSS but also to the surface of the MSS chip including the frame-shaped portion. This is a state seen when the sensitive film is applied by spray coating, but since the sensitive film applied to the frame-shaped part etc.
- FIG. 3 shows a conceptual diagram of the time change of the signal intensity when the sample gas is applied to a surface stress sensor such as MSS.
- FIG. 3A shows on the time axis whether the gas given to the MSS is a sample gas or a purge gas.
- the concentration of the gas to be measured in the gas given to the MSS is a concentration Cg larger than 0 during the sample gas injection period in which the sample gas is given, and the gas flow path on the downstream side is given by giving the purge gas.
- the sample gas concentration becomes 0 during the purging period in which the sample gas inside is flushed away and the sample gas component adsorbed on the sensitive film of the MSS (and the tube wall of the gas flow path, etc.) is desorbed.
- FIG. 3 (b) shows the intensity of the signal from the MSS when the type of gas shown in FIG. 3 (a) is switched, with the time axis aligned with that of FIG. 3 (a).
- the signal intensity is governed by many factors, but basically between the gas and the sensitive film caused by the difference between the concentration of the component in the gas near the sensitive film on the MSS and the concentration of the same component on the surface of the sensitive film.
- the speed of adsorption and desorption of the relevant component is a major factor. Therefore, the signal intensity starts immediately after the gas is switched as shown in FIG. 3A, and becomes close to a curve that exponentially asymptotically approaches the upper and lower saturation values.
- FIG. 3B shows the curve in an ideal case.
- the actual shape of the curve, the maximum value of the curve, etc. may vary considerably depending on the rate of adsorption / desorption to the sensitive film and the type of component adsorbed / desorbed to the sensitive film, and the range of signal change may also differ significantly. many. Furthermore, the signal may show more complicated changes over time due to the viscoelastic properties of the sensitive membrane, the diffusion of the gas to be measured into the sensitive membrane, or the physicochemical interaction between the sensitive membrane material and the gas to be measured. be. In this way, it is possible to obtain the amount / concentration of each principal component in the sample, the ratio between the plurality of components, and the like based on the time-dependent change and amplitude of the signal from the MSS.
- a surface stress sensor coated with an appropriately selected material from these materials can be used alone to measure the gas obtained from silage, or a plurality of types of surface stress sensors coated with different materials can be used in the same manner. By making various measurements, it is possible to make an evaluation based on the desired characteristics of silage.
- the adsorption / desorption characteristics of the material forming the sensitive film are various, and there are also sensitive film materials that show a response that deviates from the above-mentioned simplified model.
- it can be said that it is often useful to make the first examination using the above model.
- the sample gas injection period and the purge period are often set to the same time length.
- the purge period may be longer than the sample gas injection period if better results can be obtained by sufficiently desorbing the components adsorbed on the sensitive membrane from the sample gas.
- the purge period can be lengthened by setting the above ratio to 1: 2.
- the measurement is performed based on the measurement sequence of switching between the sample gas and the purge gas, but the present invention is not limited thereto.
- a measurement of another gas (standard gas) containing a component contained in the sample gas whose concentration may affect the fermentation quality evaluation of the silage is inserted into the measurement sequence to form three types of gases. Fermentation quality evaluation can be performed based on the signal from the switching measurement.
- a standard gas for example, a standard silage may be assumed, and a gas having the same component composition as the sample gas component generated from the standard silage may be used as the standard gas.
- a gas having the same composition for some components of the sample gas assumed as such for example, a component for which a slight difference in the amount of components is desired to be measured with particularly high accuracy
- Various compositions can be set accordingly.
- these three types of gas supply sequences are appropriately set in consideration of various measurement requirements and constraint conditions. For example, a measurement sequence involving repetition of gas supply time intervals such as: A. Supply purge gas ⁇ [Supply one of sample gas and standard gas ⁇ Supply purge gas ⁇ Supply the other of sample gas and standard gas ⁇ Supply purge gas] (or repeat in []) B.
- Supply purge gas ⁇ [Supply sample gas and standard gas alternately ⁇ Supply purge gas] (or repeat in [])
- Supply purge gas ⁇ [Repeat alternating supply of sample gas and standard gas and purge gas ⁇
- Supply purge gas ⁇ Repeat alternating supply of sample gas and standard gas and purge gas] (or repeat in [] )
- various gas supply sequences in the gas supply time section can be considered. In any gas supply sequence, it is considered that the measurement conditions such as temperature, gas pressure / flow rate, and change in sensor characteristics over time do not change significantly within the sequence during the series of measurement sequences. , The minute difference in composition between the two gases can be measured accurately, and the influence of disturbance on the measurement result can be reduced, so that the stability of measurement can be improved.
- the standard gas may be prepared in a gaseous state from the beginning, or may be introduced into the gas supply system by evaporating from a liquid or a solid like the sample gas.
- another gas such as a purge gas may be mixed with the gas generated from the initially prepared gas or liquid / solid.
- the three flow paths may be merged at one place, or a part of the upstream side of the sample gas flow path may be merged.
- a configuration is also conceivable in which a standard gas flow path is configured, and after the standard gas is introduced into the standard gas flow path, both gas flow paths are merged before the confluence point with the purge gas.
- the sensitive film material is not intended to be limited to this, but in one exemplary embodiment, Poly (methyl vinyl ether-alt-maleic anhydride), Poly (2,6-diphenyl-p-phenylene) At least one selected from the group consisting of oxide) and Poly (4-methylstyrene) can be used. In another embodiment, Polymethylmethacrylate, Poly (4-methylstyrene), phenyl group-modified silica / titania composite nanoparticles, octadecyl group-modified silica / titania composite nanoparticles, Poly (2,6-diphenyl-p-phenylene oxide).
- Polyvinylfluoride, Polystyrene, Polycaprolactone, Cellulose acetate butyrate, Polyethyleneimine, and at least one selected from the group consisting of tetraethoxysilane-modified silica / titania composite nanoparticles can be used.
- one material may be used alone, or the first MSS using the selected one material for the sensitive membrane and the other selected from the above group.
- a second MSS that uses the same material as the sensitive film, a plurality of types of materials may be used in combination.
- the MSS used when a plurality of types of materials are used in combination is not limited to two, and a third, fourth or higher MSS is used, and the sensitive membranes of each MSS are selected from each other from the above group. It is also possible to use different materials.
- Example 1 In this embodiment, a measurement system whose schematic configuration is shown in FIG. 1 is housed in an incubator, and as a sample to be measured, an aqueous solution of an organic acid contained in a large amount in the silage and silage of various qualities are used. The measurement was carried out in a vial. The incubator temperature was set to 20 ° C, 30 ° C, and 45 ° C for measurement, but the best discriminability (the degree to which the difference in the sample appears as the difference in the MSS response signal waveform) is the best at 30 ° C. Therefore, the results of measurement with this temperature setting are shown below.
- the flow rates of the sample gas and the purge gas were measured in two ways, 10 sccm and 30 sccm, but the discriminating property was better at 10 sccm.
- the discriminability is considered to be greatly affected by the divergence rate of the sample gas, the adsorption rate of the sensitive film, and the flow rate. Therefore, the above reference to the discriminability is the conclusion that 10 sccm was higher than 30 sccm in the current measurement system. For example, if the thickness of the sensitive membrane or the amount of the sample to be collected changes, the optimum flow rate changes. there's a possibility that.
- 10 sccm which can suppress heat generation from the pump has a great merit.
- the measurement system used in this embodiment does not take measures against heat for the gas flow path such as mounting a cooling fan, it can be said that the above flow rate is a measurement condition suitable for such a measurement configuration.
- the measurement was performed in two ways of sampling time (time for performing sample gas injection in each measurement cycle) of 30 seconds and 120 seconds, but there was no difference in discriminability. The data below shows the data when the sampling time is 120 seconds.
- the measurement was performed with the ratio of the sampling time to the purge time (the time when the purge gas is given to the MSS in each measurement cycle and the purge is performed) at 1: 2.
- the purge time is shortened by setting the ratio of the sampling time to the purge time to 1: 1
- the purging that is, the desorption of the components adsorbed on the sensitive film on the MSS during the sample gas injection is not possible. It was confirmed that it became sufficient and the fluctuation of the baseline became large. For this reason, if only a short purge is performed, the discrimination accuracy may be adversely affected.
- the long measurement time not only has the inconvenience of reducing the measurement throughput itself, but also causes various parameters (flow velocity, gas pressure, temperature, etc.) of the environment inside and outside the measurement system to be measured for a long time.
- various parameters flow velocity, gas pressure, temperature, etc.
- the measurement system usually includes active parts such as a pump, a long-term temperature change due to heat generation in the future may adversely affect the accuracy. Therefore, in the present invention, it is desirable to allocate the measurement cycle time as short as possible within the range in which an effective signal value can be obtained for the sampling time, and to make the purge time as long as possible.
- aqueous solution of the organic acid As the aqueous solution of the organic acid, a single 1% aqueous solution of the organic acid was prepared, and these aqueous solutions were measured individually. Further, the silage was measured by containing the silage of a predetermined weight as it is in a vial without adding water or the like.
- the MSS used was actually an aggregate consisting of a plurality of MSS coated with different sensitive film materials, but among them, Poly (methyl vinyl ether-alt-maleic anhydride) was used as the sensitive film material.
- MSS No. ChA
- ChB sensitive film material: Poly (2,6-diphenyl-p-phenylene oxide)
- ChC sensitive film material: Poly
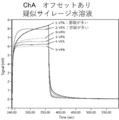
- the time change (unit: seconds) of the signal (unit: mV) from the MSS of ChA when a 1% aqueous solution of each organic acid is contained in a vial and measured by the measuring device shown in FIG. 1 is shown in FIG. Is shown.
- organic acids acetic acid, butyric acid, lactic acid, propionic acid and valeric acid were measured. Furthermore, for comparison, water before dissolving the organic acid was also measured.
- the purge gas was first flowed for 240 seconds, then the sample gas was flowed for 120 seconds, and then the purge gas was flown again for 240 seconds.
- the flow rate of the purge gas and the sample gas was 10 sccm. Also, as can be seen from FIG.
- each sample was measured twice and both results were plotted here.
- the same measurement sequence and flow rate were used.
- the signal for acetic acid was saturated in a short time, and about 60 seconds had passed after the start of the sample gas injection. After that, it shows a peculiar signal change (change with time) that the signal is greatly reduced.
- the signal to other organic acids such as butyric acid tends to decrease slightly from almost constant after saturation, or the signal increases slowly, so that at the end of the sample gas injection period (sample gas injection). The signal continues to increase even after 120 seconds have passed since the start. Since the lactic acid in the organic acid measured here is not volatile, its signal was almost the same as that of water.
- the MSS is a signal in which the responses of the individual components are superimposed while maintaining relatively linearity. It is shown in the table above to verify whether the contributions of the individual components cannot be easily separated by looking at the signals from the MSS because they influence each other.
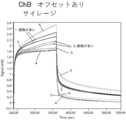
- FIG. 5 shows the results of measurement of a mixed organic acid aqueous solution (pseudo-silage aqueous solution) having an organic acid composition in the extracts of the silage samples 1 to 6 in the same procedure as in FIG.
- each pseudo silage is displayed by adding the character string "-VFA" after the sample number of the corresponding silage.
- the signal is the signal for each organic acid gas. It was confirmed that the change with time was almost the same as that of the linearly superimposed one. That is, the signal for 1-VFA corresponding to sample 1 with a high butyric acid concentration shows a slow rise similar to that of gas from a pure butyric acid aqueous solution, whereas the butyric acid concentration is low while the acetic acid concentration is low. The rise of the signal for 2-VFA corresponding to the higher sample 2 was as steep as the gas from pure aqueous acetic acid.
- the relatively large decrease in signal value seen in the signal for gas from pure acetic acid does not change much during the sample gas injection period, which is the signal for other gases. It appears in a slightly relaxed form due to superposition. Furthermore, the signals for 3-VFA, 4-VFA, and 5-VFA corresponding to the samples 3, 4 and 5, which have zero butyric acid concentration and low acetic acid concentration, are all raised in a relatively short time. , It was confirmed that the value was maintained at an almost constant value. It is considered that this is because the effect of butyric acid, which has the slowest increase in signal, is not present, and the effect of acetic acid, which turns into a rapid decrease in a relatively short time, is also very small.
- silages 1 to 6 were individually housed in vials, and the same measurement was performed for the sample gas generated from each. The result is shown in FIG. However, in the measurements shown in FIGS. 4 and 5, individual organic acids or aqueous solutions of a plurality of kinds of organic acids were measured, but in the measurement of silage shown in FIG. 6, only the silage was contained in a vial by a predetermined weight. No liquids such as water or other substances were mixed.
- FIG. 6 which shows the signals from the actual silages
- FIG. 5 which shows the signals from the pseudo silages having the same organic acid composition as these silages
- the order between the actual silages when compared at the maximum value of the signals It can be seen that the characteristics described above for the temporal variation of the signal are almost the same between the actual silage and the pseudo silage, although the relationship and the order relationship between the pseudo silage are different. Therefore, it is possible to measure the amount and composition of various organic acids in silage by the characteristic of the time change pattern of the signal of the surface stress sensor such as MSS during the injection period of the gas generated from the silage itself. .. In particular, it can be seen that the measurement using ChA is particularly useful for the above-mentioned C4 evaluation.
- the amount of organic acid of C4 or higher such as butyric acid is evaluated, and if necessary, the amount of C2 and C3 organic acid such as acetic acid is further evaluated to evaluate the fermentation quality of silage by a simple procedure. be able to.
- the evaluation results of the signals for various silages and the amounts of butyric acid and acetic acid as explained above are V. It can also be seen that it has a high correlation with the score value. Further, as can be seen from the comparison result between FIGS.
- the result of measuring the gas generated from the organic acid mixed aqueous solution with a surface stress sensor such as MSS and the gas generated from the silage itself measured in the present invention Since the degree of agreement with the result measured by the surface stress sensor is also high, the calibration of the measurement system in the measurement of the present invention and the comparison with the evaluation result by the silage evaluation method using the existing silage extract as the measurement target. It also has the advantage of being easy to match.
- the silage evaluated in this example was produced by a general method using dent corn and pasture, and is a type widely used as feed for animals such as cattle. However, the method of the present invention is advantageously applied to other silages having different raw materials, fermentation methods, etc., or a wide range of silages such as fermented TMR (Total Mixed Ratios) obtained by secondary processing thereof. Is possible.
- FIG. 9 shows the time change of the signal when the actual silage (Samples 1 to 6) is measured using ChB, and the sample 1 containing a large amount of butyric acid, the sample 2 containing a large amount of acetic acid, and the sample 6 containing a large amount of C2 + C3 are shown.
- the rate of saturation of signal rise and fall is significantly different from each other. ..
- the silage of sample numbers 1, 2 and 6 has a relatively low saturation rate (saturation is slow) while the signals for other silages of sample numbers 3 to 5 are rapidly saturated after gas switching. Is).
- the silages of Samples 1, 2 and 6 clearly have a lower C2 + C3 rating than the other silages. Therefore, it can be said that the rate of saturation of the rising and falling ends of the ChB signal is strongly correlated with the C2 + C3 evaluation. Therefore, by using either or both of ChB and ChC MSS, it is possible to perform C2 + C3 evaluation of the silage to be measured.
- the time change pattern of the signal can be seen from FIGS. 9 and 12. Rather than being different from each other, this time variation is similar in the intensity direction of the signal (multiplying the temporal variation of the intensity of the signal from one sample by a constant and then translating in the intensity direction from another sample. It almost overlaps with the time change of the signal intensity of. Therefore, the silage evaluation system can be further enhanced by stabilizing the sample gas supply by making the amount of the sample used for the measurement as constant as possible, and by normalizing and standardizing the signal.
- Example 2 In this example, a measurement system whose schematic configuration is shown in FIG. 1 is housed in an incubator, and three types of silage different from those used in Example 1 are used as samples to be measured. The measurement was carried out in a bottle. Each silage was measured by containing the silage of a predetermined weight as it was in a vial without adding water or the like. The temperature of the incubator was 30 ° C., and the flow rates of the sample gas and the purge gas were 10 sccm. The sampling time was 120 seconds, and the ratio of the sampling time to the purge time was 1: 2.
- the temperature and relative humidity in the incubator may inevitably change slightly, but in this embodiment, the temperature and relative humidity in the incubator (in the module of the measurement system) at the time of measurement change. was limited to a range that could not be considered to have a significant effect on the measurement results.
- the sample gas and the purge gas to be measured are set to the same flow rate as the actual measurement, and the switching cycle of both gases is the same as the actual measurement.
- the operation was performed by setting and flowing to the measurement system.
- the measurement data can be made more stable (that is, the accuracy of the measurement data can be further improved).
- Such a preliminary operation is often performed in a measurement using an arbitrary gas as a sample to be measured, and the number of cycles (time) thereof is not particularly limited, but in this embodiment, 200 cycles (20 hours in total) are performed. )went.
- the measurement data shown in the first embodiment is also acquired after performing the same preliminary operation.
- the silages to be measured in this example are "high quality silage sample”, “low quality silage sample” and “high quality silage sample with reduced volatile components”.
- the "high quality silage sample” and the “low quality silage sample” are high quality as a result of evaluating the superiority or inferiority of the quality of the silage sample based on the result of the chemical analysis including the organic acid content shown in the table below, respectively.
- the "high quality silage sample with reduced volatile components” is a silage sample in which a certain amount of the above "high quality silage sample” is contained in a vial and exposed to purge gas for a certain period of time to reduce the volatile components. ..
- “high quality silage sample”, “low quality silage sample” and “high quality silage sample with reduced volatile components” are also referred to as sample 7, sample 8 and sample 9, respectively.
- the table below shows the measurement results of organic acids contained in samples 7-9.
- the MSS used was actually an aggregate consisting of a plurality of MSS coated with different sensitive film materials.
- the description will be made mainly based on the signals output from ChD, but the signals output from the remaining MSS will also be described with reference to them as appropriate.
- the number of each MSS and the applied sensitive film material are as follows.
- ChD Polymethylcrylic ChE: Poly (4-methylstyrene)
- ChF Phenyl group-modified silica / titania composite nanoparticles (hereinafter, also referred to as "Phenyl-STNPs”)
- ChG Octadecyl group-modified silica / titania composite nanoparticles (hereinafter, also referred to as "C18-STNPs”)
- ChH Poly (2,6-diphenyl-p-phenylene oxide) (Tenax TA (Mesh: 60/80))
- ChI Polyvinyl fluoride
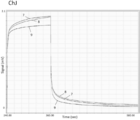
- ChJ Polystyrene
- ChK Polycaprolactone
- ChL Cellulose acetate butyrate
- ChM Polyethyleneimine
- ChN Tetraethoxysilane-modified silica / titania composite nanoparticles (hereinafter, also referred to as "TEOS-STNPs”)
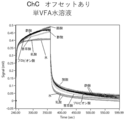
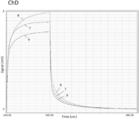
- FIG. 13 shows a signal (unit) from the MSS of ChD when three types of silage samples to be measured are individually contained in a vial and the sample gas generated from them is measured by the measuring device shown in FIG. Indicates the time change (unit: seconds) of mV).
- the purge gas was first flowed for 240 seconds, then the sample gas was flowed for 120 seconds, and then the purge gas was flowed again for 240 seconds.
- each sample is measured a plurality of times, and FIG. 13 shows representative data among the measurement results.
- the signal change (signal waveform) of the sample gas injection period 120 seconds is clearly different among the three types of silage samples. .. More specifically, in the measurement using ChD, in addition to being able to distinguish the difference between sample 7 and sample 8 in which the superiority or inferiority of the quality was identified by the chemical analysis, the same level of quality (high) was obtained by the chemical analysis. It was confirmed that the difference in the content of volatile components in the silage samples (Sample 7 and Sample 9) evaluated as (quality) can also be identified.
- the concentrations of acetic acid and butyric acid which are typical volatile components, were 57 ppm acetic acid and 21 ppm butyric acid in sample 7, 32 ppm acetic acid and 23 ppm butyric acid in sample 8, respectively.
- acetic acid was 16 ppm and butyric acid was 6 ppm, and the MSS signal is considered to reflect the difference in these concentrations.
- the rate of saturation of the signal fall during the purge period after the end of the sample gas injection period is also significantly different between the samples 7, the sample 8 and the sample 9.
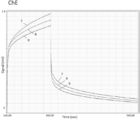
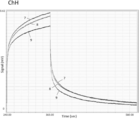
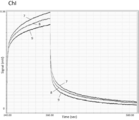
- the characteristics of the signal change (change with time) obtained from each MSS are different due to the difference in the sensitive film material used, but from FIGS. 14 to 23, even in the measurement using ChE to ChN, the sample gas It can be seen that the signal change (signal waveform) during the injection period (120 seconds) differs among the three types of silage samples.
- ChE sensitive film material: Poly (4-methylstyrene), the same material as ChC of Example 1
- ChH sensitive film material: Poly (2,6-diphenyl-p-phenylene oxide
- Example 1 In the measurement using ChB (same material as ChB), ChI (sensitive film material: Polyvinylfluoride), ChJ (sensitive film material: Polystyrene), ChL (sensitive film material: Cellulose acetate butyrate), ChM (sensitive film material: Polyethyleneimine) Similar to the measurement using ChD shown in FIG. 13, the signal change (signal waveform) of the sample gas injection period (120 seconds) is clearly different among the three types of silage samples (FIGS. 14, 17, 18). , 19, 21, 22).
- MSSs tended to differ in the rate of signal fall saturation during the purge period after the end of the sample gas injection period.
- ChE and ChI as in the case of ChD, a difference in the saturation rate of the signal fall was observed between Sample 7, Sample 8 and Sample 9, but ChH, ChJ,
- the rate of signal fall saturation of sample 7 and sample 8 was about the same or slightly different, whereas the signal fall saturation of sample 9 was saturated.
- the speed of sample 7 and sample 8 tended to be faster than that of sample 8.
- the sample gas injection period and the purge period after the end of the sample gas injection period were both significantly between the sample 7, the sample 8 and the sample 9. Different signal changes were seen (Fig. 15).
- ChG sensitive membrane material: C18-STNPs
- the signal change between the samples 7 and 8 and the sample 9 was more important than the difference in the signal change between the sample 7 and the sample 8 during the sample gas injection period. There was a tendency for the difference to be large.
- the purge period after the end of the sample gas injection period there was a difference in the rate of saturation of the signal fall between the sample 8 and the samples 7 and 9, and the superiority or inferiority of the quality was identified between the samples by chemical analysis.
- Sample 7, Sample 8 and Sample 9 showed a difference in signal change. Further, in the purge period after the end of the sample gas injection period, as in the case of ChG, a difference in the saturation rate of the signal fall between the sample 8 and the samples 7 and 9 was observed, and the quality was determined by chemical analysis. It was suggested that the differences between the samples whose superiority and inferiority were identified are distinguishable (Fig. 23).
- the silage evaluated in this example was produced by a general method using dent corn and pasture, as in the case of Example 1, and was used as feed for animals such as cattle. It is a type widely used as. Therefore, from the results of this example, the present invention is also applied to other silages having different raw materials, fermentation methods, etc., or a wide range of silages such as fermented TMR (Total Mixed Ratios) obtained by secondary processing thereof. It can be seen that it is possible to apply the method of.
- the time change pattern of the signal corresponding to the above as a reference pattern and performing pattern matching that is common in the measurement technology field in general, the time change pattern and the reference pattern of the signal obtained from the silence to be measured can be obtained. It may be collated.
- the silage quality can be evaluated from the time-varying pattern of the signal obtained from the silage by using a machine learning method that has become frequently used in the field of measurement technology in recent years. Such pattern matching, machine learning, etc.
- an information processing device provided in the measurement system, or an arbitrary information processing device such as an information processing device connected to the measurement system by an interface or a communication line. Can be executed. Since the principles of pattern matching and machine learning and the method of applying these to various measurement results are well-known matters, further description thereof will be omitted.
- the fermentation quality of silage can be evaluated in a short time by using a simple device configuration and a simple procedure as compared with the conventional case, so that the silage can be manufactured and distributed.
Abstract
La présente invention vise à permettre une évaluation simple sur site et autre de la qualité de fermentation d'un ensilage. Dans un mode de réalisation de la présente invention, du gaz produit par ensilage est appliqué à un capteur de contrainte de surface, et la quantité de l'un parmi les composés d'acide organique et contenant de l'azote inclus dans le gaz est déterminée. Le capteur de contrainte de surface permet de détecter des constituants à l'état de trace dans le gaz à l'aide d'une procédure et d'une configuration de dispositif simples. Ainsi, les connaissances actuelles de la relation entre la teneur de ces composants et la qualité de fermentation peut être utilisée pour évaluer simplement la qualité de fermentation par la mesure décrite ci-dessus.
Priority Applications (4)
| Application Number | Priority Date | Filing Date | Title |
|---|---|---|---|
| CN202180026952.9A CN115398227A (zh) | 2020-03-30 | 2021-03-19 | 青贮饲料发酵品质评价方法和装置 |
| US17/914,956 US20230147626A1 (en) | 2020-03-30 | 2021-03-19 | Evaluation method and evaluation device for silage fermentation quality |
| EP21779992.3A EP4130709A4 (fr) | 2020-03-30 | 2021-03-19 | Procédé et dispositif d'évaluation de qualité de fermentation d'un ensilage |
| JP2022511916A JP7320803B2 (ja) | 2020-03-30 | 2021-03-19 | サイレージ発酵品質評価方法及び装置 |
Applications Claiming Priority (2)
| Application Number | Priority Date | Filing Date | Title |
|---|---|---|---|
| JP2020059344 | 2020-03-30 | ||
| JP2020-059344 | 2020-03-30 |
Publications (1)
| Publication Number | Publication Date |
|---|---|
| WO2021200262A1 true WO2021200262A1 (fr) | 2021-10-07 |
Family
ID=77927074
Family Applications (1)
| Application Number | Title | Priority Date | Filing Date |
|---|---|---|---|
| PCT/JP2021/011325 WO2021200262A1 (fr) | 2020-03-30 | 2021-03-19 | Procédé et dispositif d'évaluation de qualité de fermentation d'un ensilage |
Country Status (5)
| Country | Link |
|---|---|
| US (1) | US20230147626A1 (fr) |
| EP (1) | EP4130709A4 (fr) |
| JP (1) | JP7320803B2 (fr) |
| CN (1) | CN115398227A (fr) |
| WO (1) | WO2021200262A1 (fr) |
Citations (7)
| Publication number | Priority date | Publication date | Assignee | Title |
|---|---|---|---|---|
| WO2011148774A1 (fr) | 2010-05-24 | 2011-12-01 | 独立行政法人物質・材料研究機構 | Capteur de contrainte superficielle |
| US20170184556A1 (en) * | 2015-12-23 | 2017-06-29 | Commissariat A L`Energie Atomique Et Aux Energies Al Ternatives | Compact gas sensor with enhanced selectivity |
| CN108088962A (zh) * | 2018-02-05 | 2018-05-29 | 中国农业科学院麻类研究所 | 一种鉴别青贮发酵饲料品质的方法 |
| WO2018101128A1 (fr) * | 2016-11-29 | 2018-06-07 | 国立研究開発法人物質・材料研究機構 | Procédé et dispositif pour l'estimation de valeur à estimer associée à un échantillon |
| JP2018132325A (ja) | 2017-02-13 | 2018-08-23 | 国立研究開発法人物質・材料研究機構 | ニオイ測定による西洋梨の熟成度の非破壊検査方法および装置 |
| JP2019128312A (ja) | 2018-01-26 | 2019-08-01 | 株式会社ガステック | 放散ガスを利用したサイレージの品質評価方法とそのための装置 |
| WO2019244613A1 (fr) * | 2018-06-19 | 2019-12-26 | 国立研究開発法人物質・材料研究機構 | Procédé de modulation de réponse de récepteur et dispositif de mesure utilisant une modulation de réponse de récepteur |
-
2021
- 2021-03-19 US US17/914,956 patent/US20230147626A1/en active Pending
- 2021-03-19 WO PCT/JP2021/011325 patent/WO2021200262A1/fr unknown
- 2021-03-19 JP JP2022511916A patent/JP7320803B2/ja active Active
- 2021-03-19 CN CN202180026952.9A patent/CN115398227A/zh active Pending
- 2021-03-19 EP EP21779992.3A patent/EP4130709A4/fr active Pending
Patent Citations (7)
| Publication number | Priority date | Publication date | Assignee | Title |
|---|---|---|---|---|
| WO2011148774A1 (fr) | 2010-05-24 | 2011-12-01 | 独立行政法人物質・材料研究機構 | Capteur de contrainte superficielle |
| US20170184556A1 (en) * | 2015-12-23 | 2017-06-29 | Commissariat A L`Energie Atomique Et Aux Energies Al Ternatives | Compact gas sensor with enhanced selectivity |
| WO2018101128A1 (fr) * | 2016-11-29 | 2018-06-07 | 国立研究開発法人物質・材料研究機構 | Procédé et dispositif pour l'estimation de valeur à estimer associée à un échantillon |
| JP2018132325A (ja) | 2017-02-13 | 2018-08-23 | 国立研究開発法人物質・材料研究機構 | ニオイ測定による西洋梨の熟成度の非破壊検査方法および装置 |
| JP2019128312A (ja) | 2018-01-26 | 2019-08-01 | 株式会社ガステック | 放散ガスを利用したサイレージの品質評価方法とそのための装置 |
| CN108088962A (zh) * | 2018-02-05 | 2018-05-29 | 中国农业科学院麻类研究所 | 一种鉴别青贮发酵饲料品质的方法 |
| WO2019244613A1 (fr) * | 2018-06-19 | 2019-12-26 | 国立研究開発法人物質・材料研究機構 | Procédé de modulation de réponse de récepteur et dispositif de mesure utilisant une modulation de réponse de récepteur |
Non-Patent Citations (7)
| Title |
|---|
| "Quality Assessment Guidebook for Crude Feed (Revised", 2001, JAPAN GRASSLAND AGRICULTURE AND FORAGE SEED ASSOCIATION |
| "The Nemuro Center for Improving and Popularizing Agriculture", DOCUMENTS FOR FARMING IMPROVEMENT, vol. 26, 1997, Retrieved from the Internet <URL:http://www.nemuro.pref.hokkaido.lg.jp/ss/nkc/kannkoubutsu/n026/26-02-3.pdf> |
| "THE SILAGE", vol. 7, article "Minami-Nemuro District Farming Improvement Council" |
| FRÉDÉRIC LOIZEAU; TERUNOBU AKIYAMA; SEBASTIAN GAUTSCH; PETER VETTIGER; GENKI YOSHIKAWA; NICO DE ROOIJ: "Membrane-Type Surface Stress Sensor with Piezoresistive Readout", PROCEDIA ENGINEERING, vol. 47, no. 2, 1 January 2012 (2012-01-01), NL , pages 1085 - 1088, XP055645374, ISSN: 1877-7058, DOI: 10.1016/j.proeng.2012.09.339 * |
| KIDA, TAMAKI: "Discussion of Silage Smell Measurement Method.", GRASSLAND SCIENCE, vol. 48, 21 September 2002 (2002-09-21), JP , pages 204 - 205, XP009536193, ISSN: 0447-5933, DOI: 10.14941/grass.48.204 * |
| NO, EIJI: "Silage Quality Evaluation Methods", DAIRY JOURNAL, vol. 66, no. 3, 1 March 2013 (2013-03-01), pages 64 - 65, XP009539364, ISSN: 0916-3360 * |
| See also references of EP4130709A1 |
Also Published As
| Publication number | Publication date |
|---|---|
| EP4130709A1 (fr) | 2023-02-08 |
| EP4130709A4 (fr) | 2024-05-15 |
| JP7320803B2 (ja) | 2023-08-04 |
| JPWO2021200262A1 (fr) | 2021-10-07 |
| US20230147626A1 (en) | 2023-05-11 |
| CN115398227A (zh) | 2022-11-25 |
Similar Documents
| Publication | Publication Date | Title |
|---|---|---|
| Kawamura et al. | Development of a novel hand-held formaldehyde gas sensor for the rapid detection of sick building syndrome | |
| Pasquini et al. | Flow-injection determination of ammonia in Kjeldahl digests by gas diffusion and conductometry | |
| Schütz et al. | Detection of volatiles released by diseased potato tubers using a biosensor on the basis of intact insect antennae | |
| CN102778541A (zh) | 一种气体传感器标定装置与方法 | |
| Chakraborty et al. | Detection of biomarker in breath: A step towards noninvasive diabetes monitoring | |
| Ito et al. | Bitterness evaluation of H (1)-receptor antagonists using a taste sensor | |
| Ganjali et al. | Cu (II)-all solid state sensor ion selective electrode (ASS-ISE) with a nano-molar detection limit and its use for the analysis of waste water samples | |
| CN106841066A (zh) | 一种用于光谱法cod检测中的局部校准方法 | |
| CN103344696A (zh) | 一种利用faims检测猪肉新鲜度的方法 | |
| Liu et al. | Repeatability and sensitivity of quartz crystal microbalance (QCM) sensor array modified with four sensitive materials | |
| WO2021200262A1 (fr) | Procédé et dispositif d'évaluation de qualité de fermentation d'un ensilage | |
| AU2001247614B2 (en) | Lithium ion-selective electrode for clinical applications | |
| Calvo et al. | Use of sequential injection analysis to construct an electronic-tongue: Application to multidetermination employing the transient response of a potentiometric sensor array | |
| Hrebien et al. | Quantification of isoprene in coastal ecosystems by gas chromatography–mass spectrometry using cumulative headspace injections | |
| Junsomboon et al. | Flow injection conductometric system with gas diffusion separation for the determination of Kjeldahl nitrogen in milk and chicken meat | |
| CN109001364B (zh) | 一种双通道采样大气hono测定系统及方法 | |
| CN114624303A (zh) | 一种用于快速定量测定电子烟中尼古丁的电化学方法 | |
| US20150185177A1 (en) | Method and device for measuring concentration of substance in fluid | |
| Kang et al. | Determination of glutaraldehyde in water samples by headspace solid-phase microextraction and gas chromatography–mass spectrometry after derivatization with 2, 2, 2-trifluoroethylhydrazine | |
| JP4125955B2 (ja) | 液体試料に関連するヘッドスペース内に存在する脂肪酸の検出による液体試料の感染検出方法 | |
| Knobloch et al. | Methodological variation in headspace analysis of liquid samples using electronic nose | |
| WO2022014512A1 (fr) | Procédé et dispositif destinés à déterminer la morbidité liée à la cétose | |
| JP2007278774A (ja) | におい評価装置 | |
| CN103969319A (zh) | 一种水生生物金属硫蛋白的检测方法 | |
| von Jasmund et al. | Assessment of ammonia sensors and photoacoustic measurement systems using a gas calibration unit |
Legal Events
| Date | Code | Title | Description |
|---|---|---|---|
| 121 | Ep: the epo has been informed by wipo that ep was designated in this application |
Ref document number: 21779992 Country of ref document: EP Kind code of ref document: A1 |
|
| ENP | Entry into the national phase |
Ref document number: 2022511916 Country of ref document: JP Kind code of ref document: A |
|
| NENP | Non-entry into the national phase |
Ref country code: DE |
|
| ENP | Entry into the national phase |
Ref document number: 2021779992 Country of ref document: EP Effective date: 20221031 |