WO2017199544A1 - 構造物評価システム、構造物評価装置及び構造物評価方法 - Google Patents
構造物評価システム、構造物評価装置及び構造物評価方法 Download PDFInfo
- Publication number
- WO2017199544A1 WO2017199544A1 PCT/JP2017/008850 JP2017008850W WO2017199544A1 WO 2017199544 A1 WO2017199544 A1 WO 2017199544A1 JP 2017008850 W JP2017008850 W JP 2017008850W WO 2017199544 A1 WO2017199544 A1 WO 2017199544A1
- Authority
- WO
- WIPO (PCT)
- Prior art keywords
- evaluation
- elastic wave
- region
- distribution
- unit
- Prior art date
Links
- 238000000034 method Methods 0.000 title description 9
- 238000009826 distribution Methods 0.000 claims abstract description 136
- 238000004364 calculation method Methods 0.000 claims abstract description 23
- 238000011156 evaluation Methods 0.000 claims description 226
- 230000006866 deterioration Effects 0.000 claims description 60
- 230000005540 biological transmission Effects 0.000 claims description 34
- 238000004458 analytical method Methods 0.000 claims description 5
- 238000012545 processing Methods 0.000 description 32
- 238000010586 diagram Methods 0.000 description 14
- 230000015556 catabolic process Effects 0.000 description 7
- 230000007423 decrease Effects 0.000 description 7
- 238000006731 degradation reaction Methods 0.000 description 7
- 238000004891 communication Methods 0.000 description 4
- 238000001514 detection method Methods 0.000 description 4
- 238000007639 printing Methods 0.000 description 4
- 230000011218 segmentation Effects 0.000 description 4
- 238000012795 verification Methods 0.000 description 4
- 238000010276 construction Methods 0.000 description 3
- 239000000463 material Substances 0.000 description 3
- 230000008569 process Effects 0.000 description 3
- 238000003325 tomography Methods 0.000 description 3
- 230000001133 acceleration Effects 0.000 description 2
- 230000003321 amplification Effects 0.000 description 2
- 230000008859 change Effects 0.000 description 2
- 238000005401 electroluminescence Methods 0.000 description 2
- 238000000605 extraction Methods 0.000 description 2
- 230000006870 function Effects 0.000 description 2
- 238000009434 installation Methods 0.000 description 2
- 238000004519 manufacturing process Methods 0.000 description 2
- 238000003199 nucleic acid amplification method Methods 0.000 description 2
- 230000008439 repair process Effects 0.000 description 2
- 238000003860 storage Methods 0.000 description 2
- 230000032683 aging Effects 0.000 description 1
- 238000013459 approach Methods 0.000 description 1
- 238000011161 development Methods 0.000 description 1
- 230000018109 developmental process Effects 0.000 description 1
- 238000003745 diagnosis Methods 0.000 description 1
- 230000000694 effects Effects 0.000 description 1
- 238000005516 engineering process Methods 0.000 description 1
- 239000000284 extract Substances 0.000 description 1
- 230000036541 health Effects 0.000 description 1
- 230000010354 integration Effects 0.000 description 1
- 239000004973 liquid crystal related substance Substances 0.000 description 1
- 238000012986 modification Methods 0.000 description 1
- 230000004048 modification Effects 0.000 description 1
- 238000012544 monitoring process Methods 0.000 description 1
- 230000002250 progressing effect Effects 0.000 description 1
- 230000000644 propagated effect Effects 0.000 description 1
- 238000011160 research Methods 0.000 description 1
- 230000004044 response Effects 0.000 description 1
- 230000035945 sensitivity Effects 0.000 description 1
- 230000007704 transition Effects 0.000 description 1
Images


Classifications
-
- G—PHYSICS
- G01—MEASURING; TESTING
- G01N—INVESTIGATING OR ANALYSING MATERIALS BY DETERMINING THEIR CHEMICAL OR PHYSICAL PROPERTIES
- G01N29/00—Investigating or analysing materials by the use of ultrasonic, sonic or infrasonic waves; Visualisation of the interior of objects by transmitting ultrasonic or sonic waves through the object
- G01N29/14—Investigating or analysing materials by the use of ultrasonic, sonic or infrasonic waves; Visualisation of the interior of objects by transmitting ultrasonic or sonic waves through the object using acoustic emission techniques
-
- G—PHYSICS
- G01—MEASURING; TESTING
- G01M—TESTING STATIC OR DYNAMIC BALANCE OF MACHINES OR STRUCTURES; TESTING OF STRUCTURES OR APPARATUS, NOT OTHERWISE PROVIDED FOR
- G01M5/00—Investigating the elasticity of structures, e.g. deflection of bridges or air-craft wings
- G01M5/0008—Investigating the elasticity of structures, e.g. deflection of bridges or air-craft wings of bridges
-
- G—PHYSICS
- G01—MEASURING; TESTING
- G01M—TESTING STATIC OR DYNAMIC BALANCE OF MACHINES OR STRUCTURES; TESTING OF STRUCTURES OR APPARATUS, NOT OTHERWISE PROVIDED FOR
- G01M5/00—Investigating the elasticity of structures, e.g. deflection of bridges or air-craft wings
- G01M5/0033—Investigating the elasticity of structures, e.g. deflection of bridges or air-craft wings by determining damage, crack or wear
-
- G—PHYSICS
- G01—MEASURING; TESTING
- G01M—TESTING STATIC OR DYNAMIC BALANCE OF MACHINES OR STRUCTURES; TESTING OF STRUCTURES OR APPARATUS, NOT OTHERWISE PROVIDED FOR
- G01M5/00—Investigating the elasticity of structures, e.g. deflection of bridges or air-craft wings
- G01M5/0066—Investigating the elasticity of structures, e.g. deflection of bridges or air-craft wings by exciting or detecting vibration or acceleration
-
- G—PHYSICS
- G01—MEASURING; TESTING
- G01N—INVESTIGATING OR ANALYSING MATERIALS BY DETERMINING THEIR CHEMICAL OR PHYSICAL PROPERTIES
- G01N29/00—Investigating or analysing materials by the use of ultrasonic, sonic or infrasonic waves; Visualisation of the interior of objects by transmitting ultrasonic or sonic waves through the object
- G01N29/04—Analysing solids
- G01N29/043—Analysing solids in the interior, e.g. by shear waves
-
- G—PHYSICS
- G01—MEASURING; TESTING
- G01N—INVESTIGATING OR ANALYSING MATERIALS BY DETERMINING THEIR CHEMICAL OR PHYSICAL PROPERTIES
- G01N29/00—Investigating or analysing materials by the use of ultrasonic, sonic or infrasonic waves; Visualisation of the interior of objects by transmitting ultrasonic or sonic waves through the object
- G01N29/04—Analysing solids
- G01N29/07—Analysing solids by measuring propagation velocity or propagation time of acoustic waves
-
- G—PHYSICS
- G01—MEASURING; TESTING
- G01N—INVESTIGATING OR ANALYSING MATERIALS BY DETERMINING THEIR CHEMICAL OR PHYSICAL PROPERTIES
- G01N29/00—Investigating or analysing materials by the use of ultrasonic, sonic or infrasonic waves; Visualisation of the interior of objects by transmitting ultrasonic or sonic waves through the object
- G01N29/22—Details, e.g. general constructional or apparatus details
- G01N29/24—Probes
- G01N29/2437—Piezoelectric probes
-
- G—PHYSICS
- G01—MEASURING; TESTING
- G01N—INVESTIGATING OR ANALYSING MATERIALS BY DETERMINING THEIR CHEMICAL OR PHYSICAL PROPERTIES
- G01N29/00—Investigating or analysing materials by the use of ultrasonic, sonic or infrasonic waves; Visualisation of the interior of objects by transmitting ultrasonic or sonic waves through the object
- G01N29/44—Processing the detected response signal, e.g. electronic circuits specially adapted therefor
- G01N29/4409—Processing the detected response signal, e.g. electronic circuits specially adapted therefor by comparison
- G01N29/4436—Processing the detected response signal, e.g. electronic circuits specially adapted therefor by comparison with a reference signal
-
- G—PHYSICS
- G01—MEASURING; TESTING
- G01N—INVESTIGATING OR ANALYSING MATERIALS BY DETERMINING THEIR CHEMICAL OR PHYSICAL PROPERTIES
- G01N29/00—Investigating or analysing materials by the use of ultrasonic, sonic or infrasonic waves; Visualisation of the interior of objects by transmitting ultrasonic or sonic waves through the object
- G01N29/44—Processing the detected response signal, e.g. electronic circuits specially adapted therefor
- G01N29/4445—Classification of defects
-
- G—PHYSICS
- G01—MEASURING; TESTING
- G01N—INVESTIGATING OR ANALYSING MATERIALS BY DETERMINING THEIR CHEMICAL OR PHYSICAL PROPERTIES
- G01N29/00—Investigating or analysing materials by the use of ultrasonic, sonic or infrasonic waves; Visualisation of the interior of objects by transmitting ultrasonic or sonic waves through the object
- G01N29/44—Processing the detected response signal, e.g. electronic circuits specially adapted therefor
- G01N29/4463—Signal correction, e.g. distance amplitude correction [DAC], distance gain size [DGS], noise filtering
-
- G—PHYSICS
- G01—MEASURING; TESTING
- G01N—INVESTIGATING OR ANALYSING MATERIALS BY DETERMINING THEIR CHEMICAL OR PHYSICAL PROPERTIES
- G01N2291/00—Indexing codes associated with group G01N29/00
- G01N2291/02—Indexing codes associated with the analysed material
- G01N2291/023—Solids
- G01N2291/0232—Glass, ceramics, concrete or stone
-
- G—PHYSICS
- G01—MEASURING; TESTING
- G01N—INVESTIGATING OR ANALYSING MATERIALS BY DETERMINING THEIR CHEMICAL OR PHYSICAL PROPERTIES
- G01N2291/00—Indexing codes associated with group G01N29/00
- G01N2291/02—Indexing codes associated with the analysed material
- G01N2291/025—Change of phase or condition
- G01N2291/0258—Structural degradation, e.g. fatigue of composites, ageing of oils
-
- G—PHYSICS
- G01—MEASURING; TESTING
- G01N—INVESTIGATING OR ANALYSING MATERIALS BY DETERMINING THEIR CHEMICAL OR PHYSICAL PROPERTIES
- G01N2291/00—Indexing codes associated with group G01N29/00
- G01N2291/02—Indexing codes associated with the analysed material
- G01N2291/028—Material parameters
- G01N2291/0289—Internal structure, e.g. defects, grain size, texture
Definitions
- Embodiments of the present invention relate to a structure evaluation system, a structure evaluation apparatus, and a structure evaluation method.
- AE Acoustic Emission
- AE is an elastic wave generated with the progress of fatigue cracks in the material.
- AE electrostic Emission
- an elastic wave is detected as an AE signal (voltage signal) by an AE sensor using a piezoelectric element.
- the AE signal is detected as an indication before material breakage occurs. Therefore, the occurrence frequency and signal intensity of the AE signal are useful as an index representing the soundness of the material. For this reason, research is being conducted on techniques for detecting signs of deterioration of structures by the AE method.
- the problem to be solved by the present invention is to provide a structure evaluation system, a structure evaluation apparatus, and a structure evaluation method capable of evaluating the soundness of a structure that generates elastic waves.
- the structure evaluation system includes a plurality of sensors, a position locating unit, a speed calculation unit, and an evaluation unit.
- the sensor detects elastic waves generated from the structure.
- the position locator derives a source distribution of the elastic wave based on the elastic wave.
- the velocity calculation unit derives a propagation velocity of the elastic wave generated in the structure based on the elastic wave.
- An evaluation part evaluates the soundness of the said structure based on the said transmission source distribution and the propagation velocity of the said elastic wave.
- the figure for demonstrating the evaluation method in case a predetermined condition is conditions where the generation frequency (the number of detections of an elastic wave) of an elastic wave exceeds the preset 1st threshold value.
- the figure for demonstrating the evaluation method in case a predetermined condition is the conditions where a propagation speed falls rapidly.
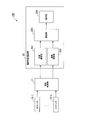
- FIG. 1 is a diagram illustrating a system configuration of a structure evaluation system 100 according to an embodiment.
- the structure evaluation system 100 is used for evaluating the soundness of a structure.
- evaluation means determining the degree of soundness of a structure, that is, the deterioration state of the structure, based on a certain standard.
- a bridge is described as an example of a structure, but the structure need not be limited to a bridge.
- the structure may be any structure as long as an elastic wave is generated due to the occurrence or development of a crack or an external impact (for example, rain, artificial rain, etc.).
- Bridges are not limited to structures laid on rivers and valleys, but also include various structures (for example, highway viaducts) provided above the ground.
- the structure evaluation system 100 includes a plurality of AE sensors 10-1 to 10-n (n is an integer of 2 or more), a signal processing unit 11, and a structure evaluation apparatus 20.
- the signal processing unit 11 and the structure evaluation apparatus 20 are connected to be communicable by wire or wirelessly.
- the AE sensors 10-1 to 10-n are referred to as AE sensors 10 when not distinguished from each other.
- the AE sensor 10 is installed in a structure.
- the AE sensor 10 is installed on a concrete floor slab of a bridge.
- the AE sensor 10 includes a piezoelectric element, detects an elastic wave (AE wave) generated by a structure, and converts the detected elastic wave into a voltage signal (AE source signal).
- the AE sensor 10 performs processing such as amplification and frequency limitation on the AE source signal and outputs the signal to the signal processing unit 11.
- An acceleration sensor may be used instead of the AE sensor 10. In this case, the acceleration sensor outputs the signal after signal processing to the signal processing unit 11 by performing the same processing as the AE sensor 10.
- the thickness of the concrete slab is, for example, 15 cm or more.
- the signal processing unit 11 receives an AE source signal processed by the AE sensor 10 as an input.
- the signal processing unit 11 extracts an AE feature amount including information on an elastic wave by performing signal processing such as noise removal and parameter extraction required on the input AE source signal.
- the information on the elastic wave is information such as the amplitude, energy, rise time, duration, frequency, zero cross count number, etc. of the AE source signal.
- the signal processing unit 11 outputs information based on the extracted AE feature amount to the structure evaluation apparatus 20 as an AE signal.
- the AE signal output from the signal processing unit 11 includes information such as sensor ID, AE detection time, AE source signal amplitude, energy, rise time, and frequency.
- the amplitude of the AE source signal is, for example, the value of the maximum amplitude among the elastic waves.
- the energy is, for example, a value obtained by time integration of the square of the amplitude at each time point.
- the definition of energy is not limited to the above example, and may be approximated using, for example, a waveform envelope.
- the rise time is, for example, a time T1 until the elastic wave rises from a zero value exceeding a predetermined value set in advance.
- the duration is, for example, the time from when the rise of the elastic wave starts until the amplitude becomes smaller than a preset value.
- the frequency is the frequency of the elastic wave.
- the zero cross count number is, for example, the number of times the elastic wave crosses a reference line passing through a zero value.
- the structure evaluation apparatus 20 includes a CPU (Central Processing Unit), a memory, an auxiliary storage device, and the like connected by a bus, and executes an evaluation program. By executing the evaluation program, the structure evaluation device 20 functions as a device including a position locating unit 201, a speed calculation unit 202, an evaluation unit 203, and a display unit 204. Note that all or a part of each function of the structure evaluation apparatus 20 may be realized by using hardware such as ASIC (Application Specific Integrated Circuit), PLD (Programmable Logic Device), and FPGA (Field Programmable Gate Array). .
- the evaluation program may be recorded on a computer-readable recording medium.
- the computer-readable recording medium is, for example, a portable medium such as a flexible disk, a magneto-optical disk, a ROM, a CD-ROM, or a storage device such as a hard disk built in the computer system.
- the evaluation program may be transmitted / received via a telecommunication line.
- the position locating unit 201 receives the AE signal output from the signal processing unit 11 as an input. In addition, the position locating unit 201 stores in advance information related to the installation position of the AE sensor 10 in the structure (hereinafter referred to as “sensor position information”) in association with the sensor ID.
- the information regarding the installation position is, for example, latitude and longitude, or distances in the horizontal and vertical directions from a specific position of the structure.
- the position locating unit 201 locates the AE generation source based on information such as sensor ID and AE detection time included in the input AE signal and sensor position information held in advance.
- the position location unit 201 derives the AE seismic source density distribution (source distribution) using the position location results for a certain period.
- the AE hypocenter density distribution represents a distribution in which the source of elastic waves generated in the structure is shown.
- the position location unit 201 outputs the derived AE seismic source density distribution to the evaluation unit 203.
- the speed calculation unit 202 receives the AE signal output from the signal processing unit 11 as an input.
- the speed calculation unit 202 holds the sensor position information in advance in association with the sensor ID.
- the velocity calculation unit 202 derives the elastic wave propagation velocity distribution of the structure based on information such as sensor ID and AE detection time included in the input AE signal and sensor position information held in advance.
- the elastic wave propagation velocity distribution represents a distribution in which the propagation velocity of the elastic wave generated in the structure is shown.
- the velocity calculation unit 202 derives the elastic wave propagation velocity distribution of the structure using the AE tomography analysis method.
- the velocity calculation unit 202 outputs the derived elastic wave propagation velocity distribution to the evaluation unit 203.
- the AE tomography analysis method detects the elastic wave generated from the structure with multiple AE sensors, locates the AE source, and measures the theoretical scanning time from the source to each sensor.
- the propagation speed of the analysis model of the structure is corrected so that the scanning time error converges within an allowable value, and the elastic wave propagation speed distribution in the structure is obtained. Since the speed of AE which advances inside is reduced as the structure is deteriorated, the degree of deterioration inside the structure can be evaluated from the speed distribution of AE by using the AE tomography analysis method.
- the evaluation unit 203 receives the AE seismic source density distribution output from the position location unit 201 and the elastic wave propagation velocity distribution output from the velocity calculation unit 202 as inputs.
- the evaluation unit 203 evaluates the soundness of the structure based on the input AE seismic source density distribution and elastic wave propagation velocity distribution.
- the evaluation unit 203 causes the display unit 204 to display the evaluation result.
- the display unit 204 is an image display device such as a liquid crystal display or an organic EL (Electro Luminescence) display.
- the display unit 204 displays the evaluation result according to the control of the evaluation unit 203.
- the display unit 204 may be an interface for connecting the image display device to the structure evaluation device 20. In this case, the display unit 204 generates a video signal for displaying the evaluation result, and outputs the video signal to an image display device connected to itself.
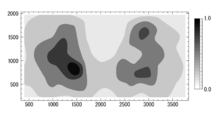
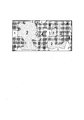
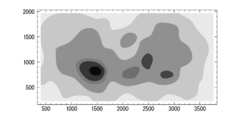
- FIG. 2A represents the AE source density distribution
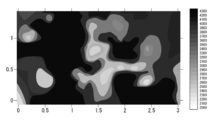
- FIG. 2B represents the elastic wave propagation velocity distribution.
- the AE hypocenter density distribution and the elastic wave propagation velocity distribution are distributions obtained based on the same region of the same structure.
- 2A and 2B show the results of using 15 AE sensors 10 for a floor slab of a certain road structure.
- the horizontal axis and the vertical axis represent the horizontal length (mm) and the vertical length (mm) from a specific position of the structure to be evaluated.
- FIG. 2B the horizontal axis and the vertical axis represent the horizontal length (m) and the vertical length (m) from a specific position of the structure to be evaluated.
- FIG. 2A the richer the source (the denser the source), the darker the color, and the fewer the source (the sparser the source), the thinner.
- a region 30 in FIG. 2A represents a region where the number of transmission sources is larger than other regions.
- FIG. 2B the higher the propagation speed is, the darker it is, and the slower the propagation speed is, the thinner it is.
- the AE source density distribution and elastic wave propagation velocity distribution shown in FIGS. 2A and 2B are input to the evaluation unit 203.
- the evaluation unit 203 uses the input AE seismic source density distribution based on a reference value related to the density of the transmission source (hereinafter referred to as “density reference value”) and a region where the transmission source is sparse and a region where the transmission source is dense. It is divided into two areas. Specifically, the evaluation unit 203 classifies the region by binarizing the AE hypocenter density distribution based on the density reference value. In this embodiment, the density reference value is set to 0.5.
- the evaluation unit 203 binarizes an area that is equal to or higher than the density reference value as an area where the transmission source is dense, and an area where the density is lower than the density reference value as an area where the transmission source is sparse. Divide the area.
- the density reference value is not necessarily limited to the above value, and may be changed as appropriate.
- the evaluation unit 203 uses the input elastic wave propagation velocity distribution based on a reference value related to the propagation velocity of the elastic wave (hereinafter referred to as “propagation velocity reference value”), a region having a high propagation velocity, and a propagation velocity. It is divided into two areas of low area. Specifically, the evaluation unit 203 classifies the region by binarizing the elastic wave propagation velocity distribution based on the propagation velocity reference value.
- the propagation speed reference value is 3800 m / s.
- the evaluation unit 203 binarizes a region having a propagation velocity higher than the propagation velocity reference value as a region having a higher propagation velocity and a region having a propagation velocity lower than the propagation velocity reference value as a region having a lower propagation velocity. To divide the area.
- the propagation speed reference value is not necessarily limited to the above value, and may be changed as appropriate.
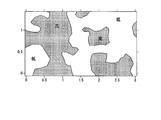
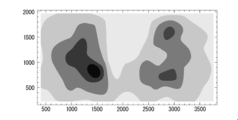
- FIG. 3A shows the segmentation result of the AE source density distribution region
- FIG. 3B shows the segmentation result of the elastic wave propagation velocity distribution region.
- the diagram shown in FIG. 3A is described as a binarized AE source density distribution
- the diagram shown in FIG. 3B is described as a binarized elastic wave propagation velocity distribution.
- the evaluation unit 203 evaluates the soundness of the structure using the binarized AE seismic source density distribution and the binarized elastic wave propagation velocity distribution. Specifically, the evaluation unit 203 superimposes the binarized AE seismic source density distribution and the binarized elastic wave propagation velocity distribution on the soundness of the structure in accordance with the segmented result of the overlapped region. Assess in 4 stages.
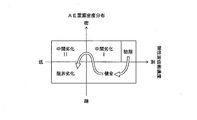
- specific examples of the four-stage evaluation include soundness, intermediate deterioration I, intermediate deterioration II, and limit deterioration. It shows that the deterioration of the structure progresses in the order of soundness, intermediate deterioration I, intermediate deterioration II, and limit deterioration.
- the evaluation unit 203 evaluates whether each region (each overlapped region) of the structure corresponds to sound, intermediate deterioration I, intermediate deterioration II, or limit deterioration based on the following evaluation conditions.
- the evaluation unit 203 evaluates the region as a healthy region. In addition, when the overlapping region is a region where the transmission sources are dense and the propagation speed is high, the evaluation unit 203 evaluates the region as a region of intermediate degradation I. Further, when the overlapping region is a region where the transmission sources are dense and the propagation speed is low, the evaluation unit 203 evaluates the region as a region of intermediate degradation II. In addition, when the overlapped area is an area where the transmission source is sparse and the propagation speed is low, the evaluation unit 203 evaluates the area as a marginal deterioration area.
- the evaluation unit 203 evaluates whether each of the overlapped regions corresponds to sound, intermediate deterioration I, intermediate deterioration II, and limit deterioration, and the evaluation result of each region is indicated.
- the evaluation result distribution is derived.
- the evaluation unit 203 represents a healthy region by “1”, an intermediate degradation I region by “2”, an intermediate degradation II region by “3”, and a marginal degradation region. May be represented by “4”.
- the evaluation unit 203 causes the display unit 204 to display the derived evaluation result distribution.
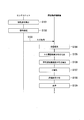
- FIG. 4 is a diagram showing an example of the evaluation result distribution. As shown in FIG. 4, by displaying the evaluation result distribution, the worker or the administrator can easily grasp which region of the structure is being deteriorated.
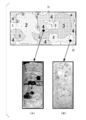
- FIG. 5 is a diagram showing a verification result of the validity of the evaluation result.
- FIG. 5 shows the result of collecting and confirming the inside of the floor slab of the structure shown in FIG.
- a core sample taken from the portion indicated by a circle 31 in the region “4” indicating the limit deterioration is shown in FIG.
- FIG. 5A the progress of deterioration inside the core sample can be seen to the extent that the core is separated by horizontal cracks.
- the core sample taken from the portion of the circle 32 in the region “1” representing the sound is FIG. 5B.
- no cracks are visually confirmed inside the core sample.
- the length of the core sample shown in FIG. 5 is about 23.5 cm, and the structure evaluation apparatus 20 in this embodiment can evaluate the deterioration state of the structure up to a depth of at least 15 cm.
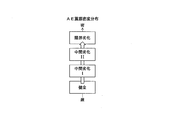
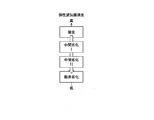
- FIG. 6 is a sequence diagram illustrating a processing flow of the structure evaluation system 100.
- each AE sensor 10 and the signal processing unit 11 are sensor units.
- Each AE sensor 10 detects an elastic wave (AE wave) generated by the structure (step S101).
- the AE sensor 10 converts the detected elastic wave into a voltage signal (AE source signal), performs processing such as amplification and frequency limitation on the AE source signal, and outputs the signal to the signal processing unit 11.
- the signal processing unit 11 performs signal processing such as necessary noise removal and parameter extraction on the input AE source signal (step S102).
- the signal processing unit 11 outputs information based on the AE feature amount extracted by performing signal processing to the structure evaluation apparatus 20 as an AE signal (step S103). Steps S101 to S103 are executed for a predetermined period.
- the position location unit 201 locates the AE generation source based on the AE signal output from the signal processing unit 11 and sensor position information held in advance (step S104). The position location unit 201 performs the process of step S104 for a predetermined period. And the position location part 201 derives
- the velocity calculation unit 202 derives the elastic wave propagation velocity distribution of the structure based on the AE signal output from the signal processing unit 11 (step S106). For example, the velocity calculation unit 202 may derive an elastic wave propagation velocity distribution using an AE signal for a predetermined period, or an elastic wave propagation velocity distribution using an AE signal for a period shorter than the predetermined period. May be derived. The velocity calculation unit 202 outputs the derived elastic wave propagation velocity distribution to the evaluation unit 203. Note that step S105 and step S106 are in no particular order.
- the evaluation unit 203 binarizes the AE source density distribution output from the position location unit 201 and the elastic wave propagation velocity distribution output from the velocity calculation unit 202, thereby binarizing the AE source density distribution. And a binarized elastic wave propagation velocity distribution are derived (step S107).
- the evaluation unit 203 derives the evaluation result distribution by evaluating each region of the structure based on the evaluation condition using the derived binarized AE seismic source density distribution and the binarized elastic wave propagation velocity distribution. (Step S108).
- the evaluation unit 203 causes the display unit 204 to display the derived evaluation result distribution.
- the display unit 204 displays the evaluation result distribution according to the control of the evaluation unit 203 (step S109).
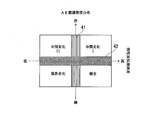
- FIG. 7 is a diagram showing a basic concept of soundness evaluation by the structure evaluation apparatus 20 in the present embodiment.
- the level of elastic wave propagation speed and the density of AE seismic source density are each divided into four quadrants using a two-dimensional evaluation axis.
- the structure evaluation apparatus 20 classify
- the conventional evaluation method and the evaluation method in this embodiment are compared.
- Fig. 8A shows the evaluation based only on the AE hypocenter location
- Fig. 8B shows the evaluation based only on the propagation velocity.
- the evaluation based only on the AE seismic source location indicates that the possibility that the structure is deteriorated is higher as the AE seismic source is sparser and denser.
- the evaluation based only on the propagation speed indicates that the possibility that the structure is deteriorated is higher as the propagation speed is lower.
- FIG. 9 is a diagram illustrating an example of an evaluation result when it is assumed that the conventional two evaluation methods illustrated in FIGS. 8A and 8B are combined.
- the region where the elastic wave propagation velocity is higher than a certain standard and the AE source density distribution is sparse becomes healthy.
- the elastic wave propagation velocity is lower than a certain standard and the AE seismic source density distribution is denser (the source is denser)
- the deterioration of the structure progresses and becomes a linear change that leads to marginal deterioration.
- the structure evaluation apparatus 20 evaluates the soundness of the structure based on the evaluation conditions using the AE hypocenter density distribution obtained from the elastic waves detected by each of the plurality of AE sensors 10 and the elastic wave propagation velocity distribution. To do. As described above, the structure evaluation apparatus 20 in this embodiment can evaluate the deterioration level of the structure for each region by combining the AE seismic source density distribution and the elastic wave propagation velocity distribution. Therefore, it is possible to evaluate the soundness of a structure that generates elastic waves. Moreover, the structure evaluation apparatus 20 can perform more accurate evaluation by using a plurality of pieces of information instead of one piece of information obtained from elastic waves.
- the structure evaluation apparatus 20 may include only the evaluation unit 203, and the position location unit 201, the speed calculation unit 202, and the display unit 204 may be provided in another casing.
- the evaluation part 203 acquires AE seismic source density distribution and elastic wave propagation velocity distribution from another housing, and uses the acquired AE seismic source density distribution and elastic wave propagation velocity distribution for a structure. Assess the health of And the evaluation part 203 outputs an evaluation result to the display part 204 with which another housing is provided.
- the manufacturing cost of the structure evaluation apparatus 20 can be suppressed by using an existing apparatus for deriving the AE seismic source density distribution and the elastic wave propagation velocity distribution.
- the signal processing unit 11 may be provided in the structure evaluation apparatus 20. When configured in this manner, the signal processing unit 11 acquires the AE source signal that has been processed by the AE sensor 10 directly from the AE sensor 10 or via a relay device (not shown). In FIG. 1, one signal processing unit 11 is connected to a plurality of AE sensors 10-1 to 10-n. However, the structure evaluation system 100 includes a plurality of signal processing units 11, and each AE sensor 10 The signal processing unit 11 may be connected to each of the plurality of sensor units, and a plurality of sensor units may be provided.
- the velocity calculation unit 202 may be configured to derive a velocity in a region having a density equal to or higher than a predetermined threshold in the AE source density distribution illustrated in FIG. 2A or a velocity in a region having a density lower than the predetermined threshold.
- the evaluation part 203 evaluates the soundness of a structure using the AE hypocenter density distribution derived
- the evaluation unit 203 may operate as an output control unit.
- the output control unit controls the output unit and outputs an evaluation result.
- the output unit includes a display unit 204, a communication unit, and a printing unit.
- the output control unit controls the communication unit and transmits the evaluation result to another device.
- the output unit is a printing unit
- the output control unit controls the printing unit to print the evaluation result.
- the structure evaluation apparatus 20 may include the display unit 204, the communication unit, and a part or all of the printing unit as an output unit, and execute the above operation.
- the position locating unit 201 may derive the AE seismic source density distribution using only the information on the AE generated from the transmission source in which the amplitude of the first arrival wave of the AE is equal to or greater than a predetermined threshold.
- the position location unit 201 may derive the AE seismic source density distribution using only information on the AE generated from a transmission source having an amplitude of the first arrival wave of AE of 60 dB or more. This will be specifically described with reference to FIGS. 10A and 10B.
- FIG. 10A is an AE source density distribution derived using AE information generated from a source with an AE first arrival wave having an amplitude of 53 dB or more
- FIG. 10A is an AE source density distribution derived using AE information generated from a source with an AE first arrival wave having an amplitude of 53 dB or more
- FIG. 10A is an AE source density distribution derived using AE information generated from a source with an AE first arrival wave having an amplitude of 53 dB or
- the 10B is an AE first arrival wave having an amplitude of 60 dB or more. This is the AE seismic source density distribution derived using information on AE generated from the source. In view of the validity verification result of FIG. 5, it becomes possible to perform more accurate evaluation by using only information on AE generated from a transmission source having a certain amplitude or more as shown in FIG. 10B. Therefore, with this configuration, it is possible to contribute to effective deterioration diagnosis.
- the first arrival wave means an elastic wave that first reaches the AE sensor when a plurality of AE sensors detect an elastic wave generation event (event) that has occurred in the structure.
- FIG. 11 is a diagram showing another example of the basic concept shown in FIG.
- an “initial” phase corresponding to an initial stage immediately after construction and repair of a structure is added.
- This represents a situation where a large amount of transmission sources are observed when a load is applied for the first time in the initial state after construction and manufacture of the structure. This does not immediately indicate the progress of deterioration of the structure, but shows the response of the structure to the first load experienced by the structure. Thereafter, the occurrence of AE is reduced with respect to the existing load. Therefore, it is positioned as a pre-stage of the healthy phase in FIG. 7, and after the initial phase, represents a transition to the healthy phase as the number of transmission sources decreases.
- the example shown in FIG. 11 is a phase that should be taken into consideration when the soundness is evaluated immediately after the construction and repair of the structure.
- the evaluation unit 203 may be configured to derive an evaluation result distribution indicating only the marginal degradation region and display the derived evaluation result distribution on the display unit 204. Specifically, the evaluation unit 203 first superimposes the binarized AE source density distribution and the binarized elastic wave propagation velocity distribution as described above. Next, the evaluation unit 203 searches the overlapped region for a region of marginal deterioration and a region that satisfies the evaluation condition under the above evaluation conditions. Then, the evaluation unit 203 assigns a predetermined pattern (for example, a number “4” and a color fill as shown in FIG. 4) to an area that satisfies the evaluation condition of the limit deterioration area, and evaluates the limit deterioration area. Without assigning a predetermined pattern to a region that does not satisfy the condition, an evaluation result distribution showing only the marginal deterioration region is derived. Thereafter, the evaluation unit 203 causes the display unit 204 to display the derived evaluation result distribution.
- a predetermined pattern for example, a
- the evaluation unit 203 derives the evaluation result distribution of the two-dimensional data using the binarized AE source density distribution of the two-dimensional data and the binarized elastic wave propagation velocity distribution of the two-dimensional data.
- the derived evaluation result distribution is displayed.
- the evaluation unit 203 may be configured to display a three-dimensional evaluation result distribution.
- the three-dimensional AE seismic source density distribution and elastic wave propagation velocity distribution can be obtained by expanding the two-dimensional space to the three-dimensional space in the process of deriving by the position locating unit 201 and the velocity calculating unit 202.
- the evaluation unit 203 divides an area in the AE seismic source density distribution into two areas, a sparse source area and a dense source area, based on the density reference value, and generates elastic waves. Based on the propagation velocity reference value, a configuration is shown in which the region in the velocity distribution is divided into two regions, a region having a high propagation velocity (fast) and a region having a low propagation velocity (slow).
- the evaluation unit uses the first region having a predetermined range width including the density reference value and the second region having a predetermined range width including the propagation velocity reference value as threshold values.
- the 203 divides the region in the AE seismic source density distribution into three regions, a region where the transmission source is sparse, a region where the transmission source is dense, and a region which does not belong to any of the sparse and dense regions.
- the region may be divided into three regions: a region where the propagation speed is high (fast), a region where the propagation speed is low (slow), and a region which does not belong to any region of high or low.
- the width of the first region is in the range of 0.4 to 0.6
- the width of the second region is in the range of 3600 m / s to 4000 m / s. Note that the first area and the second area may be set in advance or may be set by the user.
- the evaluation unit 203 sets a region having a density equal to or higher than the maximum value of the first region in the region within the AE source density distribution as a dense source region, and is less than the minimum value of the first region.
- a region having a density of 1 is a region where the transmission source is sparse, and a region having a density which is greater than or equal to the minimum value of the first region and less than the maximum value is defined as another region.
- the evaluation unit 203 sets a region having a propagation velocity higher than the maximum value of the second region in the region in the elastic wave propagation velocity distribution as a region having a high propagation velocity, and a region having a propagation velocity less than the minimum value of the second region. Are divided into regions where the propagation velocity is low and the region of propagation velocity which is greater than or equal to the minimum value of the second region and less than the maximum value is the other region.
- FIG. 12 shows a basic conceptual diagram of evaluation in such a configuration.
- FIG. 12 is a diagram showing a basic concept of soundness evaluation by the structure evaluation apparatus 20 when a region having a predetermined range width including a reference value is used as a threshold value.
- the first region 41 having a predetermined range including the reference value and the second region 42 are evaluated as not belonging to any of the four evaluations by using as threshold values. May end up.
- an area having a predetermined range of width is not used as a threshold value, as shown in FIG. 7, there is a possibility that a healthy area is evaluated as marginal deterioration with a slight deviation in value.
- the evaluation unit 203 may evaluate the deterioration state using either the first region 41 or the second region 42 as a threshold value.
- the configuration in which the evaluation unit 203 performs the evaluation using the evaluation method illustrated in FIG. 7 is described.
- the present invention is not limited to this, and the evaluation unit 203 performs the evaluation using the following evaluation method. May be configured. Specifically, the evaluation unit 203 performs evaluation using the evaluation method illustrated in FIG. 9 until a predetermined condition is satisfied, and performs evaluation using the evaluation method illustrated in FIG. 7 after the predetermined condition is satisfied. I do.
- the predetermined condition is that the frequency of occurrence of elastic waves (the number of detected elastic waves) exceeds a preset first threshold value, or the propagation speed is rapidly reduced.
- the case where the propagation speed rapidly decreases is, for example, a case where the difference between the propagation speed calculated by the speed calculation unit 202 at time t-1 and the propagation speed calculated at time t decreases by a second threshold or more. . Evaluation based on a predetermined condition will be described with reference to FIGS. 13A and 13B.
- FIG. 13A is a diagram for describing an evaluation method in a case where the predetermined condition is a condition in which the occurrence frequency of elastic waves (the number of detected elastic waves) exceeds a preset first threshold value.
- the horizontal axis represents time T
- the vertical axis represents the occurrence frequency of elastic waves.
- the time when the time t1 exceeds a preset first threshold is shown.
- the frequency of generation of elastic waves increases as the deterioration state of the structure deteriorates, and the frequency of generation of elastic waves peaks after the frequency of generation of elastic waves exceeds the first threshold. After that, it will decline later.
- the evaluation unit 203 performs evaluation using the evaluation method shown in FIG. 9 until the generation frequency of the elastic wave exceeds the first threshold, and the generation of the elastic wave After the frequency exceeds the first threshold, evaluation is performed by the evaluation method shown in FIG. Specifically, in FIG. 13A, the evaluation unit 203 performs evaluation by the evaluation method illustrated in FIG. 9 until time t1, and performs evaluation by the evaluation method illustrated in FIG. 7 after time t1.
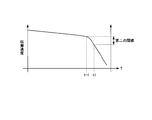
- FIG. 13B is a diagram for describing an evaluation method in a case where the predetermined condition is a condition in which the propagation speed rapidly decreases.
- the horizontal axis represents time T
- the left vertical axis represents elastic wave propagation velocity.
- the propagation speed of the elastic wave generally decreases as the deterioration state of the structure deteriorates. Since the structure has such characteristics, the evaluation unit 203 performs evaluation using the evaluation method shown in FIG. 9 until the propagation speed of the elastic wave decreases by the second threshold or more, and the elastic wave After the propagation speed is lowered by the second threshold or more, evaluation is performed by the evaluation method shown in FIG. Specifically, in FIG. 13B, the evaluation unit 203 performs evaluation using the evaluation method illustrated in FIG. 9 until time t1, and performs evaluation using the evaluation method illustrated in FIG. 7 after time t1.
- the evaluation unit 203 evaluates that the deterioration is marginal as the elastic wave propagation velocity is lower than a certain reference and the AE source density distribution is dense (the transmission source is dense). It is evaluated that the elastic wave propagation velocity is higher than a certain standard and the AE seismic source density distribution is a sparse region (region where the transmission source is sparse), which is sounder.
- the limit deterioration shown in FIG. 9 and FIG. 7 shows a state in which the degree of deterioration is relatively large in each figure, and when the limit deterioration of FIG. 9 and FIG.
- the degree of deterioration is larger in the case of limit deterioration in FIG.
- by changing the evaluation method under the predetermined condition it is possible to evaluate the change in the deterioration state of the structure that has not greatly deteriorated with high sensitivity.
- a plurality of AE sensors 10 that detect elastic waves generated from a structure, a position locating unit 201 that derives a source distribution based on elastic waves, and an elastic wave
- the structure of the structure that generates elastic waves is obtained by including the speed calculation section 202 that derives the propagation speed and the evaluation section 203 that evaluates the soundness of the structure based on the source distribution and the propagation speed. Sexuality can be evaluated.
Landscapes
- Physics & Mathematics (AREA)
- General Physics & Mathematics (AREA)
- Immunology (AREA)
- Pathology (AREA)
- Analytical Chemistry (AREA)
- Biochemistry (AREA)
- General Health & Medical Sciences (AREA)
- Life Sciences & Earth Sciences (AREA)
- Health & Medical Sciences (AREA)
- Chemical & Material Sciences (AREA)
- Engineering & Computer Science (AREA)
- Acoustics & Sound (AREA)
- Signal Processing (AREA)
- Aviation & Aerospace Engineering (AREA)
- Investigating Or Analyzing Materials By The Use Of Ultrasonic Waves (AREA)
- Bridges Or Land Bridges (AREA)
- Testing Of Devices, Machine Parts, Or Other Structures Thereof (AREA)
Abstract
Description
AE信号は、材料の破断が生じる前の兆候として検出される。したがって、AE信号の発生頻度および信号強度は、材料の健全性を表す指標として有用である。そのため、AE方式によって構造物の劣化の予兆を検出する技術の研究が行われている。
図1は、実施形態の構造物評価システム100のシステム構成を示す図である。構造物評価システム100は、構造物の健全性の評価に用いられる。本実施形態において、評価とはある基準に基づいて、構造物の健全性の度合い、すなわち構造物の劣化状態を決定することを意味する。なお、本実施形態では、構造物の一例として橋梁を例に説明するが、構造物は橋梁に限定される必要はない。例えば、構造物は、亀裂の発生または進展、あるいは外的衝撃(例えば雨、人工雨など)に伴い弾性波が発生する構造物であればどのようなものであってもよい。なお、橋梁は、河川や渓谷などの上に架設される構造物に限らず、地面よりも上方に設けられる種々の構造物(例えば高速道路の高架橋)なども含む。
評価部203は、入力されたAE震源密度分布を、発信源の密度に関する基準値(以下、「密度基準値」という。)に基づいて、発信源が疎な領域と、発信源が密な領域の二つの領域に区分けする。具体的には、評価部203は、AE震源密度分布を密度基準値に基づいて、二値化することによって領域を区分けする。本実施形態では、密度基準値を0.5としている。評価部203は、AE震源密度分布において、密度基準値以上の領域を発信源が密な領域とし、密度基準値よりも密度が少ない領域を発信源が疎な領域として、二値化することによって領域を区分けする。なお、密度基準値は、上記の値に限定される必要はなく、適宜変更されてもよい。
・健全:二値化AE震源密度分布で“疎”の領域、かつ、二値化弾性波伝搬速度分布で“高”の領域
・中間劣化I:二値化AE震源密度分布で“密”の領域、かつ、二値化弾性波伝搬速度分布で“高”の領域
・中間劣化II:二値化AE震源密度分布で“密”の領域、かつ、二値化弾性波伝搬速度分布で“低”の領域
・限界劣化:二値化AE震源密度分布で“疎”の領域、かつ、二値化弾性波伝搬速度分布で“低”の領域
各AEセンサ10は、構造物が発生する弾性波(AE波)を検出する(ステップS101)。AEセンサ10は、検出した弾性波を電圧信号(AE源信号)に変換し、AE源信号に対して増幅、周波数制限などの処理を施して信号処理部11に出力する。信号処理部11は、入力したAE源信号に対して、必要とされるノイズ除去、パラメータ抽出などの信号処理を行う(ステップS102)。信号処理部11は、信号処理を行うことによって抽出されるAE特徴量に基づく情報をAE信号として構造物評価装置20に出力する(ステップS103)。ステップS101~ステップS103の処理は、所定の期間実行される。
構造物評価装置20は、複数のAEセンサ10それぞれによって検出された弾性波から得られるAE震源密度分布と、弾性波伝搬速度分布とを用いて、評価条件に基づいて構造物の健全性を評価する。このように、本実施形態における構造物評価装置20は、AE震源密度分布と、弾性波伝搬速度分布を組み合わせることによって構造物を領域毎に劣化レベルを評価することができる。そのため、弾性波を発生する構造物の健全性の評価を行うことが可能になる。また、構造物評価装置20は、弾性波から得られる1つの情報ではなく、複数の情報を用いることによってより精度の高い評価を行うことができる。
構造物評価装置20が備える各機能部は、一部又は全てが別の筺体に備えられていてもよい。例えば、構造物評価装置20が評価部203のみを備えて、位置標定部201、速度演算部202および表示部204が別の筺体に備えられてもよい。このように構成される場合、評価部203は、AE震源密度分布と弾性波伝搬速度分布とを別の筺体から取得し、取得したAE震源密度分布と弾性波伝搬速度分布とを用いて構造物の健全性を評価する。そして、評価部203は、評価結果を別の筺体が備える表示部204に出力する。
このように構成されることによって、AE震源密度分布および弾性波伝搬速度分布の導出に既存の装置を用いることによって、構造物評価装置20の製造コストを抑えることができる。
図1では、複数のAEセンサ10-1~10-nに1台の信号処理部11が接続されているが、構造物評価システム100は複数台の信号処理部11を備え、各AEセンサ10にそれぞれ信号処理部11が接続されて複数台のセンサユニットを備えるように構成されてもよい。
評価部203は、第1の領域41又は第2の領域42のいずれかを閾値として用いて劣化状態を評価してもよい。
Claims (11)
- 構造物より発生した弾性波を検出する複数のセンサと、
前記弾性波に基づいて、前記弾性波の発信源分布を導出する位置標定部と、
前記弾性波に基づいて、前記弾性波の伝搬速度を導出する速度演算部と、
前記発信源分布と、前記弾性波の伝搬速度とに基づいて、前記構造物の健全性を評価する評価部と、
を備える構造物評価システム。 - 前記評価部は、前記弾性波の発信源の密度に関する基準値に基づいて前記発信源分布を前記発信源が疎な領域と前記発信源が密な領域との二つの領域に区分けし、前記発信源が疎な領域であり、かつ、前記弾性波の伝搬速度に関する基準値より前記弾性波の伝搬速度が低い領域を最も構造物の劣化が進行している領域と評価する、請求項1に記載の構造物評価システム。
- 前記速度演算部は、前記弾性波に基づいてトモグラフィ解析を行うことによって前記弾性波の伝搬速度の分布を表す伝搬速度分布を導出し、
前記評価部は、前記弾性波の伝搬速度に関する基準値に基づいて前記伝搬速度分布を前記伝搬速度が高い領域と前記伝搬速度が低い領域との二つの領域に区分けし、前記発信源分布と、前記伝搬速度分布とを用いて、前記発信源が疎な領域であり、かつ、前記伝搬速度が低い領域を最も劣化が進行している領域と評価する、請求項1又は2に記載の構造物評価システム。 - 前記評価部は、前記構造物の各領域において、最も劣化が進行していることを表す限界劣化と評価する条件を満たす領域を探索し、前記条件を満たす領域が示された評価結果分布を導出し、導出した前記評価結果分布を出力する、請求項1~3のいずれか一項に記載の構造物評価システム。
- 前記評価部は、前記構造物の各領域を、健全、中間劣化I、中間劣化II及び限界劣化の4つで評価することによって、前記構造物の各領域がそれぞれ健全、中間劣化I、中間劣化II及び限界劣化のいずれに相当するのかが示された評価結果分布を導出し、導出した前記評価結果分布を出力する、請求項1~4のいずれか一項に記載の構造物評価システム。
- 前記評価部は、前記発信源が疎な領域であり、かつ、前記弾性波の伝搬速度に関する基準値より前記弾性波の伝搬速度が高い領域を、構造物の劣化が最も進行していない健全な領域と評価する、請求項2~5のいずれか一項に記載の構造物評価システム。
- 前記位置標定部は、前記センサによって検出された前記弾性波の振幅情報に基づいて、既定の振幅以上の発信源の分布が表された前記発信源分布を導出する、請求項1~6のいずれか一項に記載の構造物評価システム。
- 前記弾性波の振幅情報は、前記センサによって検出された各イベントにおける前記弾性波の第一到達波の振幅の情報である、請求項7に記載の構造物評価システム。
- 前記弾性波は、前記構造物に応力が印加された結果として構造物表面あるいは内部の損傷より発生したものである、請求項1~8のいずれ一項に記載の構造物評価システム。
- 構造物より発生した弾性波に基づいて、前記弾性波の発信源分布を導出する位置標定部と、
前記弾性波に基づいて、前記弾性波の伝搬速度を導出する速度演算部と、
前記発信源分布と、前記弾性波の伝搬速度とに基づいて、前記構造物の健全性を評価する評価部と、
を備える構造物評価装置。 - 構造物より発生した弾性波に基づいて、前記弾性波の発信源分布を導出する位置標定ステップと、
前記弾性波に基づいて、前記弾性波の伝搬速度を導出する速度演算ステップと、
前記発信源分布と、前記弾性波の伝搬速度とに基づいて、前記構造物の健全性を評価する評価ステップと、
を有する構造物評価方法。
Priority Applications (6)
| Application Number | Priority Date | Filing Date | Title |
|---|---|---|---|
| EP17707746.8A EP3428635A4 (en) | 2016-05-17 | 2017-03-06 | STRUCTURING ASSESSMENT SYSTEM, STRUCTURING ASSESSMENT DEVICE AND STRUCTURING ASSESSMENT PROCEDURE |
| CN201780000111.4A CN107624160B (zh) | 2016-05-17 | 2017-03-06 | 构造物评价系统、构造物评价装置以及构造物评价方法 |
| CN202110503511.5A CN113092592B (zh) | 2016-05-17 | 2017-03-06 | 构造物评价系统、构造物评价装置以及构造物评价方法 |
| JP2017514934A JP6368040B2 (ja) | 2016-05-17 | 2017-03-06 | 構造物評価システム、構造物評価装置及び構造物評価方法 |
| US15/456,075 US10371666B2 (en) | 2016-05-17 | 2017-03-10 | Structure evaluation system, structure evaluation apparatus, and structure evaluation method |
| US16/455,433 US10648949B2 (en) | 2016-05-17 | 2019-06-27 | Structure evaluation system, structure evaluation apparatus, and structure evaluation method |
Applications Claiming Priority (2)
| Application Number | Priority Date | Filing Date | Title |
|---|---|---|---|
| JP2016098951 | 2016-05-17 | ||
| JP2016-098951 | 2016-05-17 |
Related Child Applications (1)
| Application Number | Title | Priority Date | Filing Date |
|---|---|---|---|
| US15/456,075 Continuation US10371666B2 (en) | 2016-05-17 | 2017-03-10 | Structure evaluation system, structure evaluation apparatus, and structure evaluation method |
Publications (1)
| Publication Number | Publication Date |
|---|---|
| WO2017199544A1 true WO2017199544A1 (ja) | 2017-11-23 |
Family
ID=60325922
Family Applications (2)
| Application Number | Title | Priority Date | Filing Date |
|---|---|---|---|
| PCT/JP2017/008850 WO2017199544A1 (ja) | 2016-05-17 | 2017-03-06 | 構造物評価システム、構造物評価装置及び構造物評価方法 |
| PCT/JP2017/008818 WO2017199542A1 (ja) | 2016-05-17 | 2017-03-06 | 構造物評価システム、構造物評価装置及び構造物評価方法 |
Family Applications After (1)
| Application Number | Title | Priority Date | Filing Date |
|---|---|---|---|
| PCT/JP2017/008818 WO2017199542A1 (ja) | 2016-05-17 | 2017-03-06 | 構造物評価システム、構造物評価装置及び構造物評価方法 |
Country Status (5)
| Country | Link |
|---|---|
| US (3) | US10330646B2 (ja) |
| EP (2) | EP3428635A4 (ja) |
| JP (3) | JP6366826B2 (ja) |
| CN (3) | CN113092592B (ja) |
| WO (2) | WO2017199544A1 (ja) |
Cited By (2)
| Publication number | Priority date | Publication date | Assignee | Title |
|---|---|---|---|---|
| WO2019167137A1 (ja) * | 2018-02-27 | 2019-09-06 | 株式会社東芝 | 構造物評価システム及び構造物評価方法 |
| JP7480086B2 (ja) | 2021-03-22 | 2024-05-09 | 株式会社東芝 | 構造物評価システム、構造物評価装置及び構造物評価方法 |
Families Citing this family (12)
| Publication number | Priority date | Publication date | Assignee | Title |
|---|---|---|---|---|
| JP6486739B2 (ja) * | 2015-03-23 | 2019-03-20 | 株式会社東芝 | 検知システム、検知方法及び信号処理装置 |
| EP3428635A4 (en) * | 2016-05-17 | 2020-03-04 | Kabushiki Kaisha Toshiba | STRUCTURING ASSESSMENT SYSTEM, STRUCTURING ASSESSMENT DEVICE AND STRUCTURING ASSESSMENT PROCEDURE |
| US10345275B2 (en) | 2016-06-15 | 2019-07-09 | Kabushiki Kaisha Toshiba | Structure evaluation system, structure evaluation apparatus, and structure evaluation method |
| US10613060B2 (en) | 2016-06-15 | 2020-04-07 | Kabushiki Kaisha Toshiba | Structure evaluation system, structure evaluation apparatus, and structure evaluation method |
| CN111183358B (zh) * | 2018-09-13 | 2023-06-02 | 株式会社东芝 | 构造物评价系统、构造物评价装置以及构造物评价方法 |
| JP7160695B2 (ja) * | 2019-01-09 | 2022-10-25 | 株式会社東芝 | 検出システム、検出方法、および情報処理装置 |
| CN110297040A (zh) * | 2019-06-10 | 2019-10-01 | 华北水利水电大学 | 一种基于声发射上升波段采集参数的声发射类型判断方法 |
| JP7183452B2 (ja) * | 2020-05-29 | 2022-12-05 | 株式会社東芝 | 非接触非破壊検査システム、信号処理装置及び非接触非破壊検査方法 |
| JP7362580B2 (ja) * | 2020-09-16 | 2023-10-17 | 株式会社東芝 | 構造物評価方法、及び構造物評価システム |
| CN112098524B (zh) * | 2020-09-22 | 2021-08-20 | 北京航空航天大学 | 基于声发射识别沥青混凝土断裂过程及量化微裂纹的方法 |
| JP7447045B2 (ja) * | 2021-03-22 | 2024-03-11 | 株式会社東芝 | 検査システム、検査装置及び検査方法 |
| CN115406385B (zh) * | 2022-09-30 | 2023-08-11 | 武汉路通市政工程质量检测中心有限公司 | 斜拉桥索塔锚固区预应力钢筋断裂监测方法 |
Citations (4)
| Publication number | Priority date | Publication date | Assignee | Title |
|---|---|---|---|---|
| US4531411A (en) * | 1983-10-25 | 1985-07-30 | The United States Of America As Represented By The United States Department Of Energy | Acoustic emission linear pulse holography |
| JPH09218182A (ja) * | 1996-02-09 | 1997-08-19 | Tobishima Corp | 構造物支持杭の損傷調査方法 |
| JP2004125721A (ja) | 2002-10-07 | 2004-04-22 | Railway Technical Res Inst | 2次起因のae音による構造物損傷度判定方法および装置 |
| JP2014095555A (ja) * | 2012-11-07 | 2014-05-22 | Tobishima Corp | トモグラフィを利用した構造物の非破壊検査システム |
Family Cites Families (27)
| Publication number | Priority date | Publication date | Assignee | Title |
|---|---|---|---|---|
| JPH0755617B2 (ja) * | 1984-09-17 | 1995-06-14 | 株式会社ゼクセル | 車両用空気調和装置 |
| JP2891767B2 (ja) * | 1989-10-25 | 1999-05-17 | 日本たばこ産業株式会社 | Ae発生位置標定装置 |
| US5293555A (en) * | 1991-05-24 | 1994-03-08 | Hughes Aircraft Company | System and method for locating material fatigue using multiple sensors |
| JPH08313309A (ja) | 1995-05-23 | 1996-11-29 | Nippon Koei Co Ltd | 盛土崩壊検知信号を識別する方法および装置 |
| JP3621503B2 (ja) * | 1996-03-14 | 2005-02-16 | 株式会社米倉製作所 | プレス加工用金型の劣化度評価方法及び評価装置 |
| JP3448593B2 (ja) * | 2000-01-19 | 2003-09-22 | 農工大ティー・エル・オー株式会社 | 土木構造物の傷検出方法 |
| JP4260523B2 (ja) * | 2002-04-25 | 2009-04-30 | 親良 炭 | 変位計測装置、歪計測装置、弾性率・粘弾性率計測装置、及び、治療装置 |
| JP4366467B2 (ja) | 2002-10-28 | 2009-11-18 | 国土交通省国土技術政策総合研究所長 | Aeセンサ及びaeセンサを用いた構造物の異常検出方法並びに安全性評価方法 |
| US6957583B2 (en) * | 2002-10-31 | 2005-10-25 | Hitachi, Ltd. | Ultrasonic array sensor, ultrasonic inspection instrument and ultrasonic inspection method |
| JP2006058278A (ja) * | 2004-07-23 | 2006-03-02 | Tokyo Institute Of Technology | 弾性波発生位置算出装置及び方法 |
| EP1855107A4 (en) * | 2005-03-03 | 2009-03-25 | Tokyo Electron Ltd | MICRO-STRUCTURE INSPECTION DEVICE, METHOD, AND PROGRAM |
| JP2007047094A (ja) * | 2005-08-12 | 2007-02-22 | Railway Technical Res Inst | 一次元標定のae源を利用した構造物の損傷判定方法および装置 |
| JP5030081B2 (ja) * | 2006-08-18 | 2012-09-19 | 独立行政法人産業技術総合研究所 | Ae・超音波検出システム、及びそれを備えた材料監視装置並びに非破壊検査装置 |
| JP5482119B2 (ja) * | 2009-11-10 | 2014-04-23 | 株式会社Ihi | 疲労損傷評価方法及びその装置 |
| GB2482124B (en) * | 2010-07-19 | 2016-08-17 | Ultra Electronics Ltd | Acoustic structural integrity monitoring system and method |
| KR101157811B1 (ko) * | 2010-08-17 | 2012-06-22 | 한국표준과학연구원 | 대형 복합재 구조물에서의 손상위치 표정 방법 |
| CN102269736B (zh) * | 2011-07-08 | 2012-12-19 | 天津大学 | 罐底腐蚀声发射检测中声源分布区域的自动识别方法 |
| JP5840084B2 (ja) * | 2012-07-04 | 2016-01-06 | 株式会社Ihi検査計測 | Ae位置標定装置及び方法 |
| KR20140042458A (ko) * | 2012-09-28 | 2014-04-07 | 삼성전자주식회사 | 스토리지 시스템의 파일 관리 장치, 파일 관리 방법 |
| JP6159926B2 (ja) * | 2013-03-11 | 2017-07-12 | 飛島建設株式会社 | 不均質物性の測定対象物につき行われる弾性波トモグラフィにおける発信点・物性状況(劣化状況)同時特定方法 |
| CN103744129B (zh) * | 2014-01-07 | 2014-12-10 | 山东大学 | 一种隧道施工大型综合地球物理超前探测模型试验装置 |
| US20150338380A1 (en) | 2014-05-21 | 2015-11-26 | University Of South Carolina | Assessing Corrosion Damage in Post-Tensioned Concrete Structures Using Acoustic Emission |
| JP6423219B2 (ja) * | 2014-09-24 | 2018-11-14 | 前田建設工業株式会社 | 構造物の安全性診断システム |
| EP3428635A4 (en) * | 2016-05-17 | 2020-03-04 | Kabushiki Kaisha Toshiba | STRUCTURING ASSESSMENT SYSTEM, STRUCTURING ASSESSMENT DEVICE AND STRUCTURING ASSESSMENT PROCEDURE |
| US10613060B2 (en) | 2016-06-15 | 2020-04-07 | Kabushiki Kaisha Toshiba | Structure evaluation system, structure evaluation apparatus, and structure evaluation method |
| US10345275B2 (en) | 2016-06-15 | 2019-07-09 | Kabushiki Kaisha Toshiba | Structure evaluation system, structure evaluation apparatus, and structure evaluation method |
| US10352912B2 (en) * | 2016-09-15 | 2019-07-16 | Kabushiki Kaisha Toshiba | Structure evaluation system, structure evaluation apparatus, and structure evaluation method |
-
2017
- 2017-03-06 EP EP17707746.8A patent/EP3428635A4/en active Pending
- 2017-03-06 JP JP2017514721A patent/JP6366826B2/ja active Active
- 2017-03-06 WO PCT/JP2017/008850 patent/WO2017199544A1/ja active Application Filing
- 2017-03-06 JP JP2017514934A patent/JP6368040B2/ja active Active
- 2017-03-06 EP EP17707456.4A patent/EP3264076A4/en active Pending
- 2017-03-06 CN CN202110503511.5A patent/CN113092592B/zh active Active
- 2017-03-06 WO PCT/JP2017/008818 patent/WO2017199542A1/ja active Application Filing
- 2017-03-06 CN CN201780000107.8A patent/CN107850579B/zh active Active
- 2017-03-06 CN CN201780000111.4A patent/CN107624160B/zh active Active
- 2017-03-09 US US15/454,101 patent/US10330646B2/en active Active
- 2017-03-10 US US15/456,075 patent/US10371666B2/en active Active
-
2018
- 2018-07-04 JP JP2018127894A patent/JP6917344B2/ja active Active
-
2019
- 2019-06-27 US US16/455,433 patent/US10648949B2/en active Active
Patent Citations (4)
| Publication number | Priority date | Publication date | Assignee | Title |
|---|---|---|---|---|
| US4531411A (en) * | 1983-10-25 | 1985-07-30 | The United States Of America As Represented By The United States Department Of Energy | Acoustic emission linear pulse holography |
| JPH09218182A (ja) * | 1996-02-09 | 1997-08-19 | Tobishima Corp | 構造物支持杭の損傷調査方法 |
| JP2004125721A (ja) | 2002-10-07 | 2004-04-22 | Railway Technical Res Inst | 2次起因のae音による構造物損傷度判定方法および装置 |
| JP2014095555A (ja) * | 2012-11-07 | 2014-05-22 | Tobishima Corp | トモグラフィを利用した構造物の非破壊検査システム |
Non-Patent Citations (1)
| Title |
|---|
| See also references of EP3428635A4 |
Cited By (5)
| Publication number | Priority date | Publication date | Assignee | Title |
|---|---|---|---|---|
| WO2019167137A1 (ja) * | 2018-02-27 | 2019-09-06 | 株式会社東芝 | 構造物評価システム及び構造物評価方法 |
| JPWO2019167137A1 (ja) * | 2018-02-27 | 2020-04-09 | 株式会社東芝 | 構造物評価システム及び構造物評価方法 |
| US11181439B2 (en) | 2018-02-27 | 2021-11-23 | Kabushiki Kaisha Toshiba | Structure evaluation system and structure evaluation method |
| US11639880B2 (en) | 2018-02-27 | 2023-05-02 | Kabushiki Kaisha Toshiba | Structure evaluation system and structure evaluation method |
| JP7480086B2 (ja) | 2021-03-22 | 2024-05-09 | 株式会社東芝 | 構造物評価システム、構造物評価装置及び構造物評価方法 |
Also Published As
| Publication number | Publication date |
|---|---|
| US10371666B2 (en) | 2019-08-06 |
| JP2018194553A (ja) | 2018-12-06 |
| JPWO2017199544A1 (ja) | 2018-05-31 |
| JP6368040B2 (ja) | 2018-08-01 |
| WO2017199542A1 (ja) | 2017-11-23 |
| JP6917344B2 (ja) | 2021-08-11 |
| US20170336364A1 (en) | 2017-11-23 |
| US20190317051A1 (en) | 2019-10-17 |
| US20170336365A1 (en) | 2017-11-23 |
| CN107624160B (zh) | 2021-05-28 |
| EP3428635A4 (en) | 2020-03-04 |
| CN113092592B (zh) | 2024-04-16 |
| US10330646B2 (en) | 2019-06-25 |
| US10648949B2 (en) | 2020-05-12 |
| JP6366826B2 (ja) | 2018-08-01 |
| CN107850579A (zh) | 2018-03-27 |
| CN113092592A (zh) | 2021-07-09 |
| EP3428635A1 (en) | 2019-01-16 |
| EP3264076A1 (en) | 2018-01-03 |
| EP3264076A4 (en) | 2018-06-27 |
| CN107624160A (zh) | 2018-01-23 |
| JPWO2017199542A1 (ja) | 2018-06-07 |
| CN107850579B (zh) | 2021-02-05 |
Similar Documents
| Publication | Publication Date | Title |
|---|---|---|
| JP6368040B2 (ja) | 構造物評価システム、構造物評価装置及び構造物評価方法 | |
| JP6368039B2 (ja) | 構造物評価システム、構造物評価装置及び構造物評価方法 | |
| US10352912B2 (en) | Structure evaluation system, structure evaluation apparatus, and structure evaluation method | |
| JP7222014B2 (ja) | 構造物評価システム、構造物評価装置及び構造物評価方法 | |
| WO2019167137A1 (ja) | 構造物評価システム及び構造物評価方法 | |
| US10345275B2 (en) | Structure evaluation system, structure evaluation apparatus, and structure evaluation method | |
| JP6833770B2 (ja) | 構造物評価システム、構造物評価装置及び構造物評価方法 | |
| JPWO2018235195A1 (ja) | 構造物評価システム、構造物評価方法及び衝撃付与装置 | |
| US10458954B2 (en) | Structure evaluation system, structure evaluation apparatus, and structure evaluation method | |
| JP2018155661A (ja) | センサ接着状態判定システム、センサ接着状態判定装置及びセンサ接着状態判定方法 | |
| JP7155277B2 (ja) | 構造物評価システム、構造物評価装置及び構造物評価方法 | |
| JP2024043068A (ja) | 構造物評価システム、構造物評価装置、構造物評価方法及びコンピュータプログラム |
Legal Events
| Date | Code | Title | Description |
|---|---|---|---|
| REEP | Request for entry into the european phase |
Ref document number: 2017707746 Country of ref document: EP |
|
| WWE | Wipo information: entry into national phase |
Ref document number: 2017707746 Country of ref document: EP |
|
| ENP | Entry into the national phase |
Ref document number: 2017514934 Country of ref document: JP Kind code of ref document: A |
|
| NENP | Non-entry into the national phase |
Ref country code: DE |
|
| 121 | Ep: the epo has been informed by wipo that ep was designated in this application |
Ref document number: 17707746 Country of ref document: EP Kind code of ref document: A1 |