WO2016043170A1 - PROCÉDÉ ET DISPOSITIF POUR L'ANALYSE COMPARATIVE DU NIVEAU D'EXPRESSION DE miARN - Google Patents
PROCÉDÉ ET DISPOSITIF POUR L'ANALYSE COMPARATIVE DU NIVEAU D'EXPRESSION DE miARN Download PDFInfo
- Publication number
- WO2016043170A1 WO2016043170A1 PCT/JP2015/076085 JP2015076085W WO2016043170A1 WO 2016043170 A1 WO2016043170 A1 WO 2016043170A1 JP 2015076085 W JP2015076085 W JP 2015076085W WO 2016043170 A1 WO2016043170 A1 WO 2016043170A1
- Authority
- WO
- WIPO (PCT)
- Prior art keywords
- correction
- expression level
- value
- mirna
- correction coefficient
- Prior art date
Links
Images


Classifications
-
- G—PHYSICS
- G16—INFORMATION AND COMMUNICATION TECHNOLOGY [ICT] SPECIALLY ADAPTED FOR SPECIFIC APPLICATION FIELDS
- G16B—BIOINFORMATICS, i.e. INFORMATION AND COMMUNICATION TECHNOLOGY [ICT] SPECIALLY ADAPTED FOR GENETIC OR PROTEIN-RELATED DATA PROCESSING IN COMPUTATIONAL MOLECULAR BIOLOGY
- G16B40/00—ICT specially adapted for biostatistics; ICT specially adapted for bioinformatics-related machine learning or data mining, e.g. knowledge discovery or pattern finding
- G16B40/10—Signal processing, e.g. from mass spectrometry [MS] or from PCR
-
- C—CHEMISTRY; METALLURGY
- C12—BIOCHEMISTRY; BEER; SPIRITS; WINE; VINEGAR; MICROBIOLOGY; ENZYMOLOGY; MUTATION OR GENETIC ENGINEERING
- C12Q—MEASURING OR TESTING PROCESSES INVOLVING ENZYMES, NUCLEIC ACIDS OR MICROORGANISMS; COMPOSITIONS OR TEST PAPERS THEREFOR; PROCESSES OF PREPARING SUCH COMPOSITIONS; CONDITION-RESPONSIVE CONTROL IN MICROBIOLOGICAL OR ENZYMOLOGICAL PROCESSES
- C12Q1/00—Measuring or testing processes involving enzymes, nucleic acids or microorganisms; Compositions therefor; Processes of preparing such compositions
- C12Q1/68—Measuring or testing processes involving enzymes, nucleic acids or microorganisms; Compositions therefor; Processes of preparing such compositions involving nucleic acids
- C12Q1/6813—Hybridisation assays
- C12Q1/6816—Hybridisation assays characterised by the detection means
-
- C—CHEMISTRY; METALLURGY
- C12—BIOCHEMISTRY; BEER; SPIRITS; WINE; VINEGAR; MICROBIOLOGY; ENZYMOLOGY; MUTATION OR GENETIC ENGINEERING
- C12M—APPARATUS FOR ENZYMOLOGY OR MICROBIOLOGY; APPARATUS FOR CULTURING MICROORGANISMS FOR PRODUCING BIOMASS, FOR GROWING CELLS OR FOR OBTAINING FERMENTATION OR METABOLIC PRODUCTS, i.e. BIOREACTORS OR FERMENTERS
- C12M1/00—Apparatus for enzymology or microbiology
- C12M1/34—Measuring or testing with condition measuring or sensing means, e.g. colony counters
-
- C—CHEMISTRY; METALLURGY
- C12—BIOCHEMISTRY; BEER; SPIRITS; WINE; VINEGAR; MICROBIOLOGY; ENZYMOLOGY; MUTATION OR GENETIC ENGINEERING
- C12N—MICROORGANISMS OR ENZYMES; COMPOSITIONS THEREOF; PROPAGATING, PRESERVING, OR MAINTAINING MICROORGANISMS; MUTATION OR GENETIC ENGINEERING; CULTURE MEDIA
- C12N15/00—Mutation or genetic engineering; DNA or RNA concerning genetic engineering, vectors, e.g. plasmids, or their isolation, preparation or purification; Use of hosts therefor
- C12N15/09—Recombinant DNA-technology
-
- C—CHEMISTRY; METALLURGY
- C12—BIOCHEMISTRY; BEER; SPIRITS; WINE; VINEGAR; MICROBIOLOGY; ENZYMOLOGY; MUTATION OR GENETIC ENGINEERING
- C12Q—MEASURING OR TESTING PROCESSES INVOLVING ENZYMES, NUCLEIC ACIDS OR MICROORGANISMS; COMPOSITIONS OR TEST PAPERS THEREFOR; PROCESSES OF PREPARING SUCH COMPOSITIONS; CONDITION-RESPONSIVE CONTROL IN MICROBIOLOGICAL OR ENZYMOLOGICAL PROCESSES
- C12Q1/00—Measuring or testing processes involving enzymes, nucleic acids or microorganisms; Compositions therefor; Processes of preparing such compositions
- C12Q1/68—Measuring or testing processes involving enzymes, nucleic acids or microorganisms; Compositions therefor; Processes of preparing such compositions involving nucleic acids
- C12Q1/6876—Nucleic acid products used in the analysis of nucleic acids, e.g. primers or probes
-
- G—PHYSICS
- G01—MEASURING; TESTING
- G01N—INVESTIGATING OR ANALYSING MATERIALS BY DETERMINING THEIR CHEMICAL OR PHYSICAL PROPERTIES
- G01N33/00—Investigating or analysing materials by specific methods not covered by groups G01N1/00 - G01N31/00
- G01N33/48—Biological material, e.g. blood, urine; Haemocytometers
- G01N33/50—Chemical analysis of biological material, e.g. blood, urine; Testing involving biospecific ligand binding methods; Immunological testing
- G01N33/53—Immunoassay; Biospecific binding assay; Materials therefor
-
- G—PHYSICS
- G01—MEASURING; TESTING
- G01N—INVESTIGATING OR ANALYSING MATERIALS BY DETERMINING THEIR CHEMICAL OR PHYSICAL PROPERTIES
- G01N37/00—Details not covered by any other group of this subclass
-
- G—PHYSICS
- G16—INFORMATION AND COMMUNICATION TECHNOLOGY [ICT] SPECIALLY ADAPTED FOR SPECIFIC APPLICATION FIELDS
- G16B—BIOINFORMATICS, i.e. INFORMATION AND COMMUNICATION TECHNOLOGY [ICT] SPECIALLY ADAPTED FOR GENETIC OR PROTEIN-RELATED DATA PROCESSING IN COMPUTATIONAL MOLECULAR BIOLOGY
- G16B25/00—ICT specially adapted for hybridisation; ICT specially adapted for gene or protein expression
- G16B25/10—Gene or protein expression profiling; Expression-ratio estimation or normalisation
-
- G—PHYSICS
- G16—INFORMATION AND COMMUNICATION TECHNOLOGY [ICT] SPECIALLY ADAPTED FOR SPECIFIC APPLICATION FIELDS
- G16B—BIOINFORMATICS, i.e. INFORMATION AND COMMUNICATION TECHNOLOGY [ICT] SPECIALLY ADAPTED FOR GENETIC OR PROTEIN-RELATED DATA PROCESSING IN COMPUTATIONAL MOLECULAR BIOLOGY
- G16B40/00—ICT specially adapted for biostatistics; ICT specially adapted for bioinformatics-related machine learning or data mining, e.g. knowledge discovery or pattern finding
- G16B40/20—Supervised data analysis
-
- C—CHEMISTRY; METALLURGY
- C12—BIOCHEMISTRY; BEER; SPIRITS; WINE; VINEGAR; MICROBIOLOGY; ENZYMOLOGY; MUTATION OR GENETIC ENGINEERING
- C12Q—MEASURING OR TESTING PROCESSES INVOLVING ENZYMES, NUCLEIC ACIDS OR MICROORGANISMS; COMPOSITIONS OR TEST PAPERS THEREFOR; PROCESSES OF PREPARING SUCH COMPOSITIONS; CONDITION-RESPONSIVE CONTROL IN MICROBIOLOGICAL OR ENZYMOLOGICAL PROCESSES
- C12Q2600/00—Oligonucleotides characterized by their use
- C12Q2600/158—Expression markers
-
- C—CHEMISTRY; METALLURGY
- C12—BIOCHEMISTRY; BEER; SPIRITS; WINE; VINEGAR; MICROBIOLOGY; ENZYMOLOGY; MUTATION OR GENETIC ENGINEERING
- C12Q—MEASURING OR TESTING PROCESSES INVOLVING ENZYMES, NUCLEIC ACIDS OR MICROORGANISMS; COMPOSITIONS OR TEST PAPERS THEREFOR; PROCESSES OF PREPARING SUCH COMPOSITIONS; CONDITION-RESPONSIVE CONTROL IN MICROBIOLOGICAL OR ENZYMOLOGICAL PROCESSES
- C12Q2600/00—Oligonucleotides characterized by their use
- C12Q2600/178—Oligonucleotides characterized by their use miRNA, siRNA or ncRNA
Definitions
- the present invention relates to a method and apparatus for comparative analysis of miRNA expression levels contained in a plurality of body fluid samples.
- MiRNA is transcribed from genomic DNA as hairpin-like RNA (precursor). This precursor is cleaved by a dsRNA cleaving enzyme (Drosha, Dicer) having a specific enzyme RNase III cleavage activity, then changed into a double-stranded form, and then becomes a single strand.
- a dsRNA cleaving enzyme Rosha, Dicer
- RNase III RNase III cleavage activity
- One of the antisense strands is incorporated into a protein complex called RISC and is considered to be involved in mRNA translational suppression.
- miRNA has different aspects at each stage after transcription, so usually when miRNA is targeted (detection target), such as a hairpin structure, a double-stranded structure, a single-stranded structure, etc.
- RISC protein complex
- miRNA has different aspects at each stage after transcription, so usually when miRNA is targeted (detection target), such as a hairpin structure, a double-strand
- miRNAs are present not only in cells but also in bodily fluids such as serum, plasma, urine, spinal fluid, which are specimens that do not contain cells, and their expression levels are the biologics of various diseases including cancer.
- bodily fluids such as serum, plasma, urine, spinal fluid, which are specimens that do not contain cells
- their expression levels are the biologics of various diseases including cancer.
- the possibility of becoming a marker is suggested.
- more than 2500 miRNAs exist in humans miRBase release 20
- a highly sensitive measurement system such as a DNA microarray
- more than 1000 miRNAs are expressed in serum and plasma. Can be detected simultaneously. Therefore, biomarker search research for body fluids such as serum / plasma, urine, spinal fluid and the like has been carried out using the DNA microarray method.
- This method includes the global normalization method, the quantile method, the lowess method, and the 75% percentile method.
- DNA microarrays measure a large number of miRNAs at the same time, so correction using only a limited number of types of housekeeping RNAs is considered to be inaccurate, and the expression level of multiple mRNAs is measured simultaneously with miRNAs. And the method of correcting miRNA using the expression level of these some mRNA is proposed (patent document 3).
- the miRNA detection result is corrected by performing an operation such that the detection values of a plurality of mRNAs detected simultaneously when miRNA is detected are constant in all samples.
- Non-Patent Document 1 in measuring the miRNA expression level in mouse serum, endogenous miRNA is used to correct the expression level, and its effectiveness is evaluated.
- Endogenous miRNA refers to miRNA that is naturally present in the target specimen (in the case of non-patent document 1, mouse serum) and is derived from the organism that provided the specimen. That is, in Non-Patent Document 1, miR-16, miR-31, and miR-223 are used as examples of endogenous miRNAs for correction to try to correct miRNA expression levels in mouse serum. Since the expression level was not constant among individuals, the method of correcting the entire data based on the expression level of endogenous miRNA was not adopted, and the externally added RNA was used as a reference substance for data correction. is suggesting. In short, we conclude that it is not appropriate to correct the miRNA expression level using these endogenous miRNAs.
- Non-Patent Document 2 proposes that let-7d, let-7g, and let-7i be used in combination as endogenous miRNA for correction when detecting miRNA in human serum by quantitative RT-PCR or sequencing. Yes. That is, the expression level of miRNA to be measured is corrected by performing an operation of making the expression level of let-7d, let-7g, and let-7i constant between samples.
- a method of correcting the expression level of a gene to be detected by using the expression level of a “housekeeping gene” in which the level of expression varies little between samples is generally used.
- housekeeping genes include ACTB and GAPDH.
- these genes are greatly different from miRNA in the length of nucleic acid and the absolute value of the expression level, and it is not preferable to use them for the purpose of correcting the expression level of miRNA.
- housekeeping RNAs such as U1 snoRNA, U2 snoRNA, U3 snoRNA, U4 snoRNA, U5 snoRNA, U6 snoRNA, 5S rRNA and 5.8S rRNA are mainly used for correction. Has been.
- body fluid such as serum, plasma, urine, spinal fluid, which is a sample that does not contain cells
- the expression level can hardly be detected, and miRNA expression in the body fluid It cannot be used as an index for detecting and correcting the quantity.
- Non-Patent Document 2 proposes that let-7d, let-7g, and let-7i be used in combination when detecting miRNA in human serum by quantitative RT-PCR or sequencing.
- let-7d, let-7g, and let-7i be used in combination when detecting miRNA in human serum by quantitative RT-PCR or sequencing.
- correction is generally performed using the total expression level (signal value) of a large number (hundreds to tens of thousands) of genes that can be measured with the DNA microarray. It has been broken. For example, a global normalization method, a quantile normalization method, and the like can be mentioned.
- the present invention is intended to solve the above-described problems, and in particular, to solve a problem that is extremely important for the practical use of a relatively small number of miRNA measurement DNA microarrays for testing and diagnosis. .
- a method for comparatively analyzing the expression level of a target miRNA among a plurality of body fluid samples A measurement step of simultaneously measuring the expression level of a target miRNA and the expression level of one or more correction endogenous miRNAs selected from the correction endogenous miRNAs shown in SEQ ID NOs: 1 to 10 for a plurality of body fluid samples ;
- the difference or ratio between the reference value arbitrarily set for the expression level of the endogenous miRNA for correction and the representative value of each bodily fluid sample acquired in the representative value acquisition step is calculated as the target miRNA expression level for each bodily fluid sample.
- a correction coefficient acquisition step each of which is acquired as a correction coefficient; and a correction step of correcting the expression level of the target miRNA measured in each body fluid sample using the correction coefficient acquired for each body fluid sample, Said method.
- (2) In the correction step (a) In the correction coefficient acquisition step, when acquiring a value obtained by subtracting the reference value from the representative value as a correction coefficient, subtracting the correction coefficient from the measured value of the expression level of the target miRNA, (b) In the correction coefficient acquisition step, when acquiring a value obtained by subtracting the representative value from the reference value as a correction coefficient, adding a correction coefficient to the measured value of the expression level of the target miRNA, (c) in the correction coefficient acquisition step, when acquiring a value obtained by dividing the representative value by the reference value as a correction coefficient, dividing the measured value of the expression level of the target miRNA by the correction coefficient, or (d) in the correction coefficient acquisition step, when acquiring a value obtained by dividing the reference value by the representative value as a correction coefficient, multiplying the measured
- the measurement step includes one or a plurality of corrections selected from a nucleic acid probe for capturing a plurality of target miRNAs immobilized on a support and a correction endogenous miRNA shown in SEQ ID NOs: 1 to 10.
- a probe for capturing endogenous miRNA and a nucleic acid sample derived from a body fluid sample labeled with a labeling substance are brought into contact with each other for hybridization, and the expression levels of the target miRNA and the one or more correction endogenous miRNAs are determined.
- the method according to any one of (1) to (3), comprising obtaining each as a signal intensity measurement value.
- the method according to any one of (1) to (4), wherein the body fluid specimen is blood, serum, or plasma.
- a miRNA expression analyzer for comparing and analyzing the expression level of a target miRNA in a plurality of body fluid samples, A measured value of the expression level of the target miRNA and a measured value of the expression level of one or more correction endogenous miRNAs selected from the correction endogenous miRNAs shown in SEQ ID NOs: 1 to 10 measured for a plurality of body fluid samples
- Storage means for storing;
- Representative value acquisition means for acquiring a representative value from the measured value of the expression level of one or more correction endogenous miRNAs selected from the correction endogenous miRNAs shown in SEQ ID NOS: 1 to 10 for each body fluid sample;
- the target miRNA expression level for each bodily fluid sample is determined by comparing the difference or ratio between the reference value arbitrarily set for the expression level of the endogenous miRNA for correction and the representative value of each bodily fluid sample acquired by the representative value acquisition means.
- Correction coefficient acquisition means for acquiring the correction coefficient respectively
- Correction means for correcting the expression level of the target miRNA measured in each body fluid sample using the correction coefficient acquired for each body fluid sample; and at least two body fluid samples according to the corrected target miRNA expression level
- Output means for outputting a result of comparing the target miRNA expression level between the two.
- the correction means includes (a) In the correction coefficient acquisition means, when acquiring a value obtained by subtracting the reference value from the representative value as a correction coefficient, subtracting the correction coefficient from the measured value of the expression level of the target miRNA, (b) In the correction coefficient acquisition means, when acquiring a value obtained by subtracting the representative value from the reference value as a correction coefficient, adding a correction coefficient to the measurement value of the expression level of the target miRNA, (c) In the correction coefficient acquisition means, when the value obtained by dividing the representative value by the reference value is acquired as a correction coefficient, the measured value of the expression level of the target miRNA is divided by the correction coefficient, or (d) In the correction coefficient acquisition means, when acquiring a value obtained by dividing the reference value by the representative value as a correction coefficient, multiplying the measured value of the expression level of the target miRNA by the correction coefficient,
- the apparatus wherein the correction is performed by: (9) One or a plurality of correction values selected from the measured value of the expression level of the target miRNA contained
- Hybridization is performed by contacting a nucleic acid sample derived from a body fluid specimen labeled with a target miRNA and the expression levels of the one or more correction endogenous miRNAs as signal intensity measurements, respectively.
- a correction coefficient acquisition step that is acquired as a correction coefficient; and a correction step that corrects the expression level of the target miRNA measured in each body fluid sample using the correction coefficient acquired for each body fluid sample.
- Program for. (11) In order to compare and analyze the expression level of the target miRNA among a plurality of body fluid samples, Stores the measured value of the expression level of the target miRNA contained in each of the plurality of body fluid samples and the measured value of the expression level of one or more correction endogenous miRNAs selected from the correction endogenous miRNAs shown in SEQ ID NOs: 1 to 10 Memory means to do; Representative value acquisition means for acquiring a representative value from the measured value of the expression level of one or more correction endogenous miRNAs selected from the correction endogenous miRNAs shown in SEQ ID NOS: 1 to 10 for each body fluid sample;
- the target miRNA expression level for each bodily fluid sample is determined by comparing the difference or ratio between the reference value arbitrarily set for the expression level of the endogenous miRNA for correction and the representative value of
- Correction coefficient acquisition means for acquiring the correction coefficient respectively
- Correction means for correcting the expression level of the target miRNA measured in each body fluid sample using the correction coefficient acquired for each body fluid sample; and at least two body fluid samples according to the corrected target miRNA expression level
- a program for functioning as an output means for outputting the result of comparing the expression level of the target miRNA between the two.
- (12) A computer-readable recording medium on which the program according to (10) or (11) is recorded.
- a probe for capturing a plurality of target miRNAs and a probe for capturing one or more correction endogenous miRNAs selected from the correction endogenous miRNAs shown in SEQ ID NOs: 1 to 10 are immobilized A chip for miRNA expression analysis including a support.
- the miRNA expression level when comparing and analyzing the expression level of a target miRNA contained in a plurality of body fluid samples, particularly when measuring the expression level of a large number of miRNAs using a microarray or the like, and comparing the miRNA expression levels between samples
- the miRNA expression level can be corrected more accurately than before.
- comparative analysis of target miRNA between samples can be performed more accurately.
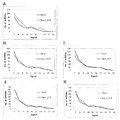
- B Correction by hsa-miR-6085
- C Correction by hsa-miR-1227-5p
- D Correction by hsa-miR-2861
- E Correction by hsa-miR-149-3p
- F Correction by hsa-miR-4463
- G Correction by hsa-miR-4508
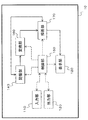
- the histogram of the miRNA signal value by the DNA microarray detection measured and corrected by the method shown in Example 2 is shown.
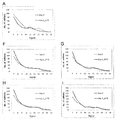
- H Correction by hsa-miR-6090
- I Correction by hsa-miR-6775-5p
- J Correction by hsa-miR-6803-5p
- K Correction by hsa-miR-5787
- the histogram of the miRNA signal value by the DNA microarray detection measured and corrected by the method shown in Example 2 is shown.
- the histogram of the miRNA signal value by the DNA microarray detection measured and corrected by the method shown in Comparative Example 1 is shown.
- the histogram of the miRNA signal value by the DNA microarray detection measured and corrected by the method shown in Comparative Example 2 is shown.
- the histogram of the miRNA signal value by the DNA microarray detection measured and corrected by the method shown in Example 4 is shown.
- D correction by combination of hsa-miR-149-3p, hsa-miR-1227-5p, hsa-miR-4463,
- the histogram of the miRNA signal value by the DNA microarray detection measured and corrected by the method shown in Example 4 is shown.
- F Correction by combination of hsa-miR-149-3p, hsa-miR-2861, hsa-miR-4463, G: hsa-miR-1227-5p, hsa-miR-2861, hsa-miR -4508 combination correction, H: hsa-miR-1227-5p, hsa-miR-2861, hsa-miR-4463 correction, I: hsa-miR-1227-5p, hsa-miR-4508, hsa Correction by combination of -miR-4463
- RNA in a body fluid sample is labeled and selected from probes for capturing a plurality of types of target miRNAs (hereinafter also referred to as “target miRNA capture probes”) and miRNAs shown in SEQ ID NOs: 1 to 10.
- targets miRNA capture probes probes for capturing a plurality of types of target miRNAs
- miRNA capture probes miRNAs shown in SEQ ID NOs: 1 to 10.
- results of detection with a microarray on which probes for capturing one or more miRNAs hereinafter also referred to as “correction endogenous miRNA”) (hereinafter also referred to as “correction endogenous miRNA capture probe”) are immobilized Is schematically shown by a histogram of signal values that are measured values of the expression level of each miRNA.
- a probe for capturing a target miRNA or a probe for capturing a correction endogenous miRNA is also collectively referred to as “miRNA capture probe” or simply “probe”.
- FIG. 1A the results of analyzing the target miRNAs of the specimens extracted from the body fluid specimen A and the body fluid specimen B using a DNA microarray are shown as histograms.
- amendment of this invention is each shown.
- the miRNA histograms are greatly shifted. From this, it can be interpreted that there is a large difference in the expression level of miRNA between samples. On the other hand, it can be interpreted that a difference is caused by an experimental error. Which is correct cannot be judged from the miRNA histogram alone.
- the signal value of the endogenous miRNA for correction should match between samples.
- the histogram of signal values obtained from the correcting endogenous miRNA capture probe shown in FIG. 1A shows almost the same distribution in the body fluid sample A and the body fluid sample B. That is, it can be determined that the body fluid sample A and the body fluid sample B are correctly subjected to the experiment and there is no experimental error. In this case, there is a large difference in the expression level of miRNA between the body fluid samples AB, and it is not necessary to correct the miRNA signal value when comparing between the body fluid samples.
- FIG. 1B schematically shows the results of analyzing body fluid specimen C and body fluid specimen D using a DNA microarray. The signal value obtained from the target miRNA capture probe and the signal value obtained from the correcting endogenous miRNA capture probe are shown.
- miRNA histograms show similar distributions.
- the histogram of the signal value obtained from the correction endogenous miRNA capture probe is largely shifted between the body fluid sample C and the body fluid sample D. From this, it can be understood that an experimental error has occurred in the detection results of the body fluid sample C and the body fluid sample D for some reason. In such a case, it is necessary to appropriately correct the miRNA signal value when comparing between body fluid samples CD.
- the histogram after correcting the signal value of the target miRNA according to the present invention is shown in FIG. 1C.
- a specific method of correction is as described later.
- the data of the body fluid sample C was corrected so that the histograms of the signal values obtained from the endogenous miRNA capturing probes for correction of the body fluid sample C and the body fluid sample D were matched.
- the histogram of the signal value obtained from the correction endogenous miRNA capture probe is matched between the body fluid sample C and the body fluid sample D, and the signal value of the target miRNA capture probe corrected using the same correction coefficient.
- the histogram of is greatly shifted. That is, there is a great difference in the expression level of the target miRNA between the specimen CDs.
- the method of correcting the miRNA signal value between two body fluid samples is shown, but the number of body fluid samples to be compared is not limited to two, and infinite comparison can be made.
- the signal value obtained from the correction endogenous miRNA capture probe is assumed to be a constant value (constant) in advance, and each body fluid specimen with respect to this constant is assumed.
- Calculate the difference or ratio of signal values obtained from the corrective endogenous miRNA capture probe and add or subtract the difference to the signal value of the target miRNA in the body fluid sample, or the inverse of the ratio in the body fluid sample By multiplying or dividing the signal value of the target miRNA, correction between a large number of samples can be easily performed.
- the expression level of miRNA is comparatively analyzed among a plurality of specimens.
- the number of specimens may be two, or three or more.
- RNA is a kind of non-coding RNA (ncRNA) that means a short RNA of about 15 to 25 bases produced in vivo, and is considered to have a function of regulating the expression of mRNA.
- miRNA is transcribed from genomic DNA as RNA (precursor) with a hairpin-like structure. This precursor is cleaved by a dsRNA cleaving enzyme (Drosha, Dicer) having a specific enzyme RNase III cleavage activity, then changed to a double-stranded form, and then becomes a single strand.
- RISC protein complex
- miRNA has different aspects at each stage after transcription, so usually when miRNA is targeted (detection target), such as a hairpin structure, a double-stranded structure, a single-stranded structure, etc. Various forms need to be considered. The presence of miRNA has been confirmed in various organisms.
- Samples to which the present invention can be applied are body fluid samples separated from a living body, and examples thereof include body fluids such as blood, serum, plasma, urine, spinal fluid, saliva, wipes, and various tissue fluids. It is not limited.
- the plurality of specimens to be compared and analyzed may be a plurality of specimens derived from different body fluids, or a plurality of body fluid specimens derived from the same type of body fluid separated from different living bodies.
- RNA is extracted from these specimens, and the expression level of miRNA is measured using this RNA.
- RNA extraction methods are known (for example, the method of Favaloro et al. (Favaloro et.al., Methods Enzymol.65: 718-749 (1980)), etc.) and various kits therefor are commercially available ( (For example, miRNeasy from Qiagen, "3D-Gene” RNA extraction, reagent, from liquid sample from Toray).
- endogenous means not naturally added to the specimen but naturally present in the specimen.
- endogenous miRNA refers to miRNA that is naturally present in the specimen and is derived from the organism that provided the specimen.
- the expression level of one or more correction endogenous miRNAs is measured simultaneously with the measurement of the expression levels of a plurality of types of target miRNAs in a specimen.
- the expression level of the endogenous miRNA for correction is used to calculate a correction coefficient for correcting the expression level of the target miRNA, as will be described later.
- Simultaneous measurement of the expression levels of a plurality of miRNAs can be performed, for example, by a hybridization assay using an array chip such as a microarray in which a probe that specifically binds to a target miRNA is immobilized on a support.
- an array chip including a support on which a plurality of target miRNA capture probes and one or a plurality of correction endogenous miRNA capture probes are immobilized may be used.
- Capture probe or “probe for capturing” means a substance capable of binding directly or indirectly, preferably directly and selectively to the miRNA to be captured. , Nucleic acids, proteins, saccharides and other antigenic compounds. In the present invention, a nucleic acid probe can be preferably used. In addition to DNA and RNA, nucleic acid derivatives such as PNA (peptide nucleic acid) and LNA (Locked Nucleic Acid) can be used as the nucleic acid.
- PNA peptide nucleic acid
- LNA Locked Nucleic Acid
- a derivative means a labeled derivative with a fluorophore, a modified nucleotide (for example, a nucleotide containing a group such as halogen, alkyl such as methyl, alkoxy such as methoxy, thio, carboxymethyl, etc.)
- a chemically modified derivative such as a derivative comprising a nucleotide having undergone a constitution, saturation of a double bond, deamination, substitution of an oxygen molecule with a sulfur molecule, and the like.
- the chain length of the nucleic acid probe is preferably not less than the length of the miRNA to be detected from the viewpoint of ensuring the stability and specificity of hybridization. Usually, when the chain length is about 17 to 25 bases, the probe can sufficiently exhibit selective binding to the target miRNA. Such an oligonucleic acid probe having a short chain length can be easily prepared by a known chemical synthesis method or the like.
- the nucleic acid probe has a base sequence that is completely complementary to the target miRNA. However, even if there are some differences, the base is highly homologous enough to hybridize with the target miRNA under stringent conditions. Any array can be used as a capture probe.
- the stringency during hybridization is a function of temperature, salt concentration, probe chain length, GC content of the nucleotide sequence of the probe, and the concentration of the chaotropic agent in the hybridization buffer.
- the conditions described in Sambrook, J. et al. (1998) Molecular Cloning: A Laboratory Manual (2nd ed.), Cold Spring Harbor Laboratory Press, New York can be used. .
- Stringent temperature conditions are about 30 ° C. or higher.
- Other conditions include the hybridization time, the concentration of the detergent (eg, SDS), the presence or absence of carrier DNA, and various stringencies can be set by combining these conditions.
- Those skilled in the art can appropriately determine conditions for obtaining a function as a capture probe prepared for detection of a desired sample RNA.
- MiRNA sequence information can be obtained from databases such as GenBank (http://www.ncbi.nlm.nih.gov/genbank/).
- the miRNA sequence information can be obtained from, for example, the miRBase website (http://www.mirbase.org/).
- the correcting endogenous miRNA capture probe and the target miRNA capture probe can be designed based on the sequence information available from these sites.
- the number of miRNA capture probes immobilized on the support is not particularly limited.
- the miRNA expression level may be measured using a number of miRNA capture probes covering all known miRNAs whose sequences have been identified, immobilized on a support, or a desired number of miRNAs may be measured.
- a miRNA capture probe immobilized on a support may be used.
- the same support as that used in known microarrays and macroarrays can be used, and for example, a slide glass, a membrane, beads, etc. can be used. .
- a support having a shape having a plurality of convex portions on the surface described in Japanese Patent No. 4244788 can also be used.
- the material of the support is not particularly limited, and examples thereof include inorganic materials such as glass, ceramic, and silicon; polymers such as polyethylene terephthalate, cellulose acetate, polycarbonate, polystyrene, polymethyl methacrylate, and silicone rubber.
- a method for immobilizing a capture probe on a support there are known a method of synthesizing oligo DNA on the surface of the support and a method of dropping oligo DNA synthesized in advance on the surface of the support and immobilizing it.
- the former method examples include the method of Ronald et al. (US Pat. No. 5,705,610), the method of Michel et al. (US Pat. No. 6,142,266), and the method of Francesco et al. (US Pat. No. 7,037,659).
- the support since an organic solvent is used during the DNA synthesis reaction, the support is preferably made of a material resistant to the organic solvent.
- DNA synthesis is controlled by irradiating light from the back surface of the support, and therefore the support is preferably made of a light-transmitting material.
- Examples of the latter method include the method of Hirota et al. (Japanese Patent No. 3922454) and the method using a spotter.
- Examples of the spot method include a pin method based on mechanical contact of a pin tip with a solid phase, an ink jet method utilizing the principle of an ink jet printer, and a capillary method using a capillary tube.
- post-treatment such as cross linking by UV irradiation and surface blocking is performed as necessary.
- a functional group such as an amino group or SH group is introduced at the end of the oligo DNA.
- the surface modification of the support is usually performed by treatment with a silane coupling agent having an amino group or the like.
- a nucleic acid sample labeled with a labeling substance is prepared from RNA extracted from the body fluid sample, and this labeled nucleic acid sample Is carried out by contacting the probe with the probe.
- the “nucleic acid sample derived from a body fluid specimen” includes not only RNA extracted from the body fluid specimen but also cDNA and cRNA prepared from the RNA by a reverse transcription reaction.
- the labeled nucleic acid sample derived from a body fluid sample may be one obtained by directly or indirectly labeling a sample RNA with a labeling substance, or directly or indirectly labeling a cDNA or cRNA prepared from the sample RNA. It may be labeled with.
- a method of binding a labeling substance to a nucleic acid sample derived from a body fluid specimen a method of binding a labeling substance to the 3 ′ end of the nucleic acid sample, a method of binding a labeling substance to the 3 ′ end, a nucleotide bound to the labeling substance to the nucleic acid
- An enzyme reaction can be used in a method of binding a labeling substance to the 3 'end and a method of binding a labeling substance to the 5' end.
- T4-RNA Ligase, Terminal Deoxitidil Transferase, Poly A-polymerase, etc. can be used.
- any labeling method can be referred to the method described in “Shao-YaoYYing, edited by miRNA experiment protocol, Yodosha, 2008”.
- kits for binding a labeling substance directly or indirectly to the end of RNA are commercially available.
- “3D-Gene” miRNA labeling kit Toray Industries, Inc.
- miRCURY miRNA HyPower labeling kit Exicon
- NCode miRNA Labeling system Life Technologies
- Co. Ltd.
- FlashTag Biotin RNA Labeling Kit Genesphere
- cDNA or cRNA incorporating a labeled substance is prepared by synthesizing cDNA or cRNA from sample RNA in the presence of labeled deoxyribonucleotides or labeled ribonucleotides, and this is arrayed.
- a method of hybridizing with the above probe is also possible.
- examples of labeling substances that can be used include various labeling substances that are also used in known microarray analysis. Specific examples include fluorescent dyes, phosphorescent dyes, enzymes, and radioisotopes, but are not limited thereto. Preferred are fluorescent dyes that can be easily measured and signals can be easily detected. Specifically, cyanine (cyanine 2), aminomethylcoumarin, fluorescein, indocarbocyanine (cyanine 3), cyanine 3.5, tetramethylrhodamine, rhodamine red, Texas red, indocarbocyanine (cyanine 5), cyanine Examples include, but are not limited to, 5.5, cyanine 7, and known fluorescent dyes such as oyster.
- semiconductor fine particles having a light emitting property may be used as the labeling substance.
- semiconductor fine particles include cadmium selenium (CdSe), cadmium tellurium (CdTe), indium gallium phosphide (InGaP), silver indium zinc sulfide (AgInZnS), and the like.
- the nucleic acid sample derived from the fluid sample labeled as described above is brought into contact with the miRNA capture probe on the support, and the nucleic acid sample and the probe are hybridized.
- This hybridization step can be performed in the same manner as in the past.
- the reaction temperature and time are appropriately selected according to the chain length of the nucleic acid to be hybridized, but in the case of nucleic acid hybridization, it is usually about 30 ° C. to 70 ° C. for 1 minute to several tens of hours.
- Hybridization is performed, and after washing, the signal intensity from the labeling substance in each probe-immobilized region on the support is detected.
- the signal intensity is detected using an appropriate signal reader according to the type of labeling substance.
- a fluorescent dye is used as a labeling substance
- a fluorescence microscope or a fluorescence scanner may be used.
- Detected signal value is compared with ambient noise. Specifically, the signal value obtained from the probe-immobilized region is compared with the signal value obtained from other positions, and the case where the former numerical value exceeds is detected (effective determination positive) .
- the background noise may be subtracted.
- the ambient noise can be subtracted from the detected signal value as background noise.
- the measured value of the expression level of the endogenous miRNA for correction and the target miRNA is obtained as the measured value of the signal intensity.
- a representative value preferably a representative value represented by a logarithmic value
- the “logarithmic value” in the present invention means a value converted to a logarithm with a base of 2.
- the representative value is the average or median calculated from the measured values of the expression levels of the multiple corrective endogenous miRNAs, preferably the average expressed as a logarithmic value.
- the value or median is adopted.
- a measured value of the expression level of the endogenous miRNA for correction preferably a logarithmic value of the measured value
- signal measurement values from the plurality of spots are used.
- the average value or median value preferably the average value or median value expressed in logarithmic values, can be obtained and used as the representative value.
- Average value expressed as a logarithmic value refers to the measurement of the expression level of multiple endogenous miRNAs for correction (for example, the measurement value of signal intensity obtained using a microarray) converted to a logarithm with a base of 2. Mean value obtained by logarithmic value.
- the median value expressed in logarithmic values means a measured value of the expression level of a plurality of endogenous miRNAs for correction (for example, a measured value of signal intensity obtained using a microarray) Means the logarithmic value obtained by converting the median of the logarithm values converted into the logarithm of base 2 or the median value of the measured endogenous miRNA expression level for correction to the logarithm of base 2. In the case of the median value, the same value can be obtained whether the logarithmic conversion of the measured value is performed first or later.
- the average value and the median value may be obtained by using all measured values of a plurality of correction endogenous miRNAs actually measured, or extracted from the plurality of correction endogenous miRNAs. It may be obtained using a part of the measured values. For example, it may be obtained using the measurement values of all the endogenous miRNAs for correction obtained by the endogenous miRNA capture probes for correction mounted on the microarray, or one of all the endogenous miRNA capture probes for correction. (For example, assuming that there are 10 types of endogenous miRNA capture probes for correction mounted on the microarray, 3 types thereof) may be extracted and obtained.
- it may be a measurement value obtained from a correction endogenous miRNA capture probe that is spotted multiple times for one type of correction endogenous miRNA. For example, it is possible to extract only a correction endogenous miRNA capture probe immobilization region that is positive for an effective determination in common for all the samples to be compared and obtain a representative value of the correction endogenous miRNA.
- correction coefficient acquisition step using the representative value of the endogenous miRNA for correction of each specimen obtained in the representative value acquisition step and the reference value arbitrarily set for the expression level of the endogenous miRNA for correction, the expression level of the target miRNA A correction coefficient used for correction is acquired (correction coefficient acquisition step).
- correction coefficient acquisition process-1 or correction coefficient acquisition process-2 can be applied to this correction coefficient acquisition process.
- the correction coefficient acquisition step-1 is a method that utilizes the difference between the representative value of the endogenous miRNA for correction and the reference value. In this step, the following 1-1. Reference specimen acquisition method, or 1-2. A fixed numerical correction method may be applied.
- Reference Specimen Acquisition Method One specimen is arbitrarily selected from a plurality of body fluid specimens to be detected by miRNA, and this is used as a “reference specimen”. The remaining one or more samples (second and subsequent samples) are “corrected samples”.
- the term “second and subsequent samples” includes the second sample. For example, if there are two samples to be compared, only the second sample is corrected, and if there are three samples to be compared, the sample to be corrected is the second sample. And a third specimen.
- the representative value of the endogenous miRNA for correction of the reference specimen is set as the “reference value”.
- the difference between the reference value and the representative value of the endogenous miRNA for correction of each of the second and subsequent samples (sample to be corrected) is used as a correction coefficient for each of the second and subsequent samples. As many correction coefficients as the number of specimens to be corrected are acquired.
- the correction coefficient is obtained by Expression 1 or Expression 1 '.
- c 1-1 (Representative value of reference miRNA for reference sample correction (reference value)) -(Representative value of the endogenous miRNA for correction of the sample to be corrected)
- Formula 1 c 1-1 ' (representative value of endogenous miRNA for correction of the sample to be corrected) -(Representative value of reference miRNA for correction of reference sample (reference value)) ... Equation 1 '
- the correction coefficient for the corrected sample can be obtained by Formula 2 or Formula 2 ′. it can.
- n is the total number of probe immobilization regions for capturing the corrective endogenous miRNA on the support
- Aj is a signal measurement value from the probe immobilization region for capturing the jth (1 ⁇ j ⁇ n) correction endogenous miRNA in the reference sample
- Xj is a signal measurement value from the probe immobilization region for capturing the j-th (1 ⁇ j ⁇ n) correction endogenous miRNA in the second specimen
- n is equal to the number of correction endogenous miRNAs targeted by the probe for capturing the correction endogenous miRNA on the support.
- the correction coefficient is obtained by Expression 3 or 3 '.
- r 1-2 (Fixed value (reference value)) -(Representative value of endogenous miRNA for correction of the sample to be corrected)
- Formula 3 r 1-2 ' (representative value of endogenous miRNA for correction of the sample to be corrected) -(Fixed value (reference value)) ... Equation 3 '
- the correction coefficient for the sample to be corrected can be obtained by Equation 4 or Equation 4 ′.
- ⁇ is the reference value
- n is the total number of probe immobilization regions for capturing the corrective endogenous miRNA on the support
- Yj is a signal measurement value from the probe immobilization region for capturing the j-th (1 ⁇ j ⁇ n) correction endogenous miRNA in the specimen, It is.
- n is equal to the number of correction endogenous miRNAs targeted by the probe for capturing the correction endogenous miRNA on the support.
- the fixed numerical value used as the reference value in the fixed numerical value correction method may be any numerical value (except 0) as long as the same numerical value is used consistently for all samples in at least one comparative analysis. . If the same expression measurement system is used and the same numerical value is always used as a fixed numerical value, comparative analysis is possible even between body fluid samples whose expression levels were measured on different days.
- the fixed numerical value may be a numerical value of an expression level that can be generally taken by one or a plurality of correction endogenous miRNAs used for obtaining a correction coefficient. Since such generally possible numerical values may vary depending on the system used to measure the expression level, a fixed numerical value can be freely selected depending on the system used.
- an average value of the expression levels of the correction endogenous miRNAs in a plurality of body fluid samples to be compared may be obtained and used as a fixed value.
- an average value of the expression levels of all three types of miRNAs in a plurality of body fluid samples may be obtained and used as a fixed value.
- a fixed numerical value may be determined in advance using a large number of body fluid samples, and the fixed numerical value may be repeatedly used for subsequent analysis.
- the correction coefficient acquisition step-2 is a method that uses a ratio between the representative value of the correction endogenous miRNA and the reference value. In this step, the following 2-1. Reference specimen acquisition method, or 2-2. A fixed numerical correction method may be applied.
- Reference sample acquisition method One sample (first sample) is arbitrarily selected from a plurality of samples to be detected by miRNA, and this is set as a “reference sample”. The remaining second and subsequent samples are “corrected samples”.
- the representative value of the endogenous miRNA for correction of the reference sample is set as a “reference value”, and the reference value and each representative value of the endogenous miRNA for correction of each of the second and subsequent samples (samples to be corrected) Is used as a correction coefficient for each of the second and subsequent samples. As many correction coefficients as the number of specimens to be corrected are acquired.
- the correction coefficient is obtained by Expression 5 or Expression 5 '.
- the correction coefficient for the second specimen can be obtained by Equation 6 or Equation 6 ′. it can.
- n is the total number of probe immobilization regions for capturing the corrective endogenous miRNA on the support
- Aj is a signal measurement value from the probe immobilization region for capturing the jth (1 ⁇ j ⁇ n) correction endogenous miRNA in the reference sample
- Xj is a signal measurement value from the probe immobilization region for capturing the j-th (1 ⁇ j ⁇ n) correction endogenous miRNA in the second specimen
- n is equal to the number of correction endogenous miRNAs targeted by the probe for capturing the correction endogenous miRNA on the support.
- the correction coefficient is obtained by Expression 7 or 7 '.
- the correction coefficient for the sample to be corrected can be obtained by Expression 8 or 8 '.
- ⁇ is a fixed value
- n is the total number of probe immobilization regions for capturing the corrective endogenous miRNA on the support
- Yj is a signal measurement value from the probe immobilization region for capturing the j-th (1 ⁇ j ⁇ n) correction endogenous miRNA in the specimen, It is.
- n is equal to the number of correction endogenous miRNAs targeted by the probe for capturing the correction endogenous miRNA on the support.
- the correction step-1 is a method of correcting the expression level of the target miRNA using the correction coefficient obtained in the correction factor acquisition step-1, and the correction factor is added to the expression level of the target miRNA or corrected from the expression level. Correction is performed by subtracting the coefficient.
- this step there are two correction methods respectively corresponding to the reference specimen acquisition method and the fixed numerical value correction method in the correction coefficient acquisition step-1.
- Reference Specimen Acquisition Method The correction of the expression level of the target miRNA in the second and subsequent samples is performed using correction coefficients for the second and subsequent samples, respectively. That is, when correcting the expression level of the target miRNA for the second sample, the correction coefficient (c2 1-1 or c2 1-1 ′) for the second sample is used, and the target for the third sample is used. When correcting the miRNA expression level, the correction coefficient (c3 1-1 or c3 1-1 ′) for the third specimen is used.
- the correction coefficient that is, in the case of the above formula 1
- the second and subsequent values are used.
- correction coefficient By adding a correction coefficient to the logarithmic value of the measured value of each target miRNA expression level in each sample, correction of the expression level of the target miRNA for each of the second and subsequent samples is performed.
- the corrected expression level Ei of the i-th miRNA in a certain “sample to be corrected” can be obtained by the following equation 9.
- Wi is a signal measurement value from the probe immobilization region for capturing the i-th miRNA.
- the correction coefficient that is, the above equation 1 ′
- the correction of the expression level of the target miRNA for each of the second and subsequent samples is performed by subtracting the correction coefficient from the logarithmic value of the measurement value of each target miRNA expression level of the second and subsequent samples.
- the corrected expression level Ei of the i-th target miRNA in a certain “corrected specimen” can be obtained by the following equation 9 ′.
- Wi Wi
- c2 is added to the logarithmic value of the measurement value of each target miRNA expression level in the second sample, or c2 ′ is subtracted. Good.
- the difference between the representative value of the first sample as the reference sample and the reference value is naturally 0, but the calculation of adding or subtracting 0 to the target miRNA expression level of the first sample is made due to the program configuration. It can be done.
- the target miRNA expression level is corrected using a correction coefficient obtained by the difference between the representative value and a fixed numerical value (reference value). That is, when the target miRNA expression level is corrected for a certain sample, the correction coefficient (r 1-2 or r 1-2 ′) for that sample is used.
- the correction coefficient that is, in the case of Equation 3
- the correction is made to the logarithmic value of the measured value of the expression level of each target miRNA in the specimen.
- the expression level of the target miRNA for each specimen is corrected.
- the corrected expression level Ei of the i-th target miRNA in a certain “corrected specimen” can be obtained by the following expression 10.
- Wi is a signal measurement value from the probe immobilization region for capturing the i-th miRNA.
- the correction coefficient that is, in the case of the above formula 3 ′, measurement of the expression level of each target miRNA in the sample
- the correction coefficient is expressed by an equation
- the corrected expression level Ei of the i-th target miRNA in a certain “corrected specimen” can be obtained by the following equation 10 ′.
- Wi Wi is the same as that in Equation 10 above.
- the correction step-2 is a method of correcting the expression level of the target miRNA using the correction coefficient obtained in the correction coefficient acquisition step-2, and the expression level of the target miRNA is divided by the correction coefficient or is divided into the expression level. Correction is performed by multiplying the correction coefficient.
- the correction of the expression level of the target miRNA in the second and subsequent samples is performed using correction coefficients for the second and subsequent samples, respectively. That is, when correcting the expression level of the target miRNA for the second sample, the correction coefficient (c2 2-1 or c2 2-1 ′) for the second sample is used, and the target for the third sample is used. When correcting the miRNA expression level, the correction coefficient (c3 2-1 or c3 2-1 ′) for the third specimen is used.
- the target miRNA expression level for each of the second and subsequent samples is corrected by multiplying the logarithmic value of the measurement value of each target miRNA expression level for the second and subsequent samples by a correction coefficient.
- the corrected expression level Ei of the i-th target miRNA in a certain “corrected specimen” can be obtained by the following equation 11.
- Wi is a signal measurement value from the probe immobilization region for capturing the i-th miRNA.
- the target miRNA expression level for each of the second and subsequent samples is corrected by dividing the logarithm of the measured value of each target miRNA expression level in the second and subsequent samples by the correction coefficient.
- the corrected expression level Ei of the i-th miRNA in a certain “sample to be corrected” can be obtained by the following equation 11 ′.
- Wi Wi
- c2 2-1 is divided by the logarithmic value of the measurement value of each target miRNA expression level in the second sample, or c2 2- Multiply 1 '.
- the value of the expression level Ei of the corrected target miRNA finally obtained is the same in the procedures of Formula 5 and Formula 11 and in the procedures of Formula 5 ′ and Formula 11 ′.
- the ratio between the representative value of the first sample as the reference sample and the fixed value (reference value) in this method is naturally 1, but the target miRNA expression level of the first sample is set to 1 because of the program configuration. Calculations such as multiplication or division of the target miRNA expression level by 1 may be performed.
- the target miRNA expression level is corrected using a correction coefficient obtained by a ratio with a fixed numerical value (reference value). That is, when the target miRNA expression level is corrected for a certain sample, the correction coefficient (r 2-2 or r 2-2 ′) for that sample is used.
- the corrected expression level Ei of the i-th target miRNA in a certain “sample to be corrected” can be obtained by the following equation 12.
- Wi is a signal measurement value from the probe immobilization region for capturing the i-th miRNA.
- each target miRNA in the sample is used.
- the target miRNA expression level for each specimen is corrected by dividing the logarithmic value of the expression level measurement value by the correction coefficient.
- the corrected expression level Ei of the i-th target miRNA in a certain “corrected specimen” can be obtained by the following equation 12 ′.
- Wi Wi
- the target miRNA expression level is compared among a plurality of body fluid samples based on the corrected target miRNA expression level.
- the target miRNA expression level of the first sample as the reference sample has not been corrected, and thus, for example, a comparison between the first sample and the second sample Is a comparison between the uncorrected first sample target miRNA expression level and the corrected second sample target miRNA expression level, but at least one of the compared samples must be A corrected sample is obtained. Therefore, the phrase “compare target miRNA expression levels among multiple body fluid samples based on corrected target miRNA expression levels” is compared between uncorrected reference samples and other corrected samples. Embodiments are also encompassed.
- the comparative analysis process itself can be performed in the same manner as the conventional method.
- the comparison analysis result can be expressed as a scatter diagram of expression level data called a scatter plot.
- two scatter plots for example, between the first specimen and the second specimen
- a scatter plot between the first specimen and the third specimen and if necessary, between the remaining two specimens (in the case of the above example, further the first scatter plot).
- a scatter plot that is comparatively analyzed between the second specimen and the third specimen may be created.
- a comparative analysis of four or more specimens can be performed in the same manner.
- the difference in target miRNA expression level between any one specimen and the remaining other specimens is calculated, and the logarithmic change rate (fold-change) ) As a comparative analysis result.
- the target miRNA expression level in the reference sample in the case of the reference sample acquisition method
- the corrected target miRNA expression level in the first sample in the case of the fixed numerical value correction method
- the difference from the expression level of the target miRNA may be calculated.
- the present invention is not limited to calculating the difference between the first sample and the other sample, and the difference between any one of the second and subsequent samples and the other sample is calculated. It is good.
- the miRNA expression analysis apparatus of the present invention is an apparatus for performing the comparative analysis method of the present invention, A measured value of the expression level of the target miRNA and a measured value of the expression level of one or more correction endogenous miRNAs selected from the correction endogenous miRNAs shown in SEQ ID NOs: 1 to 10 measured for a plurality of body fluid samples Storage means for storing; Representative value acquisition means for acquiring a representative value, preferably a representative value represented by a logarithmic value, from the measured value of the expression level of one or more correction endogenous miRNAs for each body fluid sample; The target miRNA expression level for each bodily fluid sample is determined by comparing the difference or ratio between the reference value arbitrarily set for the expression level of the endogenous miRNA for correction and the representative value of each bodily fluid sample acquired by the representative value acquisition means.
- Correction coefficient acquisition means for acquiring the correction coefficient respectively
- Correction means for correcting the expression level of the target miRNA measured in each body fluid sample using each correction coefficient acquired by the correction coefficient acquisition means; and at least two body fluids according to the corrected target miRNA expression level
- Output means for outputting the result of comparing the target miRNA expression level between the samples is included.
- the reference value is a representative value of the endogenous miRNA for correction of the arbitrarily selected first specimen (reference specimen), and the expression level of the target miRNA measured in the second and subsequent body fluid specimens Is corrected.
- the miRNA expression analyzer of the present invention comprises: Storage means for storing a plurality of target miRNA expression levels measured simultaneously and a measurement value of one or more correction endogenous miRNA expression levels for each of a plurality of specimens; Representative value acquisition means for acquiring a representative value, preferably a representative value represented by a logarithmic value, from the measured value of the expression level of the endogenous miRNA for correction for each body fluid sample;
- the arbitrarily selected first sample is used as a reference sample, and the representative value of the endogenous miRNA for correction of the reference sample is used as the reference value.
- correction coefficient acquisition means for respectively acquiring the difference or ratio as a correction coefficient for the second and subsequent samples;
- Correction means for correcting the expression level of the target miRNA measured in the second and subsequent specimens using the correction coefficients for the second and subsequent specimens acquired by the correction coefficient acquisition means;
- Output means for outputting a result of comparing the target miRNA expression level between at least two body fluid samples according to the corrected target miRNA expression level.
- the reference value is a fixed value arbitrarily determined with respect to the corrected endogenous miRNA expression level, and the target miRNA expression level is corrected for all the samples including the first sample.
- the miRNA expression analyzer of the present invention comprises: Storage means for storing a plurality of target miRNA expression levels measured simultaneously and a measurement value of one or more correction endogenous miRNA expression levels for each of a plurality of body fluid samples; Representative value acquisition means for acquiring a representative value, preferably a representative value represented by a logarithmic value, from each measured value of the expression level of the endogenous miRNA for correction; Correction coefficient acquisition means for acquiring a difference or ratio between the reference value and a representative value of the endogenous miRNA for correction of each specimen as a correction coefficient for the specimen, using a fixed numerical value as a reference value; Correction means for correcting the expression level of the target miRNA measured in each sample using the correction coefficient for each sample acquired by the correction coefficient acquisition means; Output means for outputting a result of
- FIG. 2 is a block diagram showing an outline of the configuration of an example of the analysis apparatus of the present invention.
- the analysis apparatus 10 of the present invention includes an input unit 110, a display unit 120, an output unit 130, a storage unit 140, a control unit 150, a conversion unit 160, and an analysis unit 170.
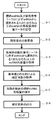
- FIG. 3 shows an example of a flowchart of the correction processing of the expression level of the target miRNA according to the present invention.
- the input unit 110 is a means for inputting information related to the operation of the analysis apparatus 10.
- Conventionally known input means such as a keyboard can be preferably used.
- the expression level data obtained by the hybridization assay using the microarray is read by reading means such as a scanner different from the apparatus of the present invention and converted into numerical data, and then the numerical data is input from the input unit 110. Input to the analyzer 10.
- reading means such as a scanner may be included in the analysis device 10 of the present invention (not shown).
- the expression level data input from the input unit 110 or the expression level data read and digitized by the reading means incorporated in the analysis apparatus 10 is stored in the storage unit 140.
- the storage unit 140 functions as a storage unit that stores, for each of the plurality of specimens, the measurement values of the expression levels of the plurality of target miRNAs and the expression levels of one or more correction endogenous miRNAs measured simultaneously.
- the measurement value data of the expression level of the target miRNA and the correction endogenous miRNA of each specimen stored in the storage unit 140 is converted into a logarithm with a base of 2 by the conversion unit 160.
- the analysis unit 170 obtains a representative value of the measured value of the expression level of the corrected endogenous miRNA that has been logarithmically converted for each specimen.
- the representative value is, for example, an average value or a median value of one or a plurality of correction endogenous miRNA expression levels (even when only one type of correction endogenous miRNA is used for correction, If there are multiple probe immobilization regions on the array to measure it, the representative value can be the average value or the median value), or the measurement value of one specific type of endogenous miRNA for correction obtain.
- the analysis unit 170 calculates the difference or ratio between the representative value of the endogenous miRNA for correction of the reference specimen and the representative value of the endogenous miRNA for correction of the second and subsequent specimens. Correction coefficients for the second and subsequent samples are respectively acquired. Details of the correction coefficient acquisition are as described in ⁇ Correction coefficient acquisition step> of the comparative analysis method. Note that the configuration of the program may be such that the correction coefficient 0 (when the difference is calculated) or the correction coefficient 1 (when the ratio is calculated) is acquired for the first sample as the reference sample.
- the selection of the reference sample may be performed by a person operating the apparatus 10 specifying one arbitrary sample from the input unit 110.
- the apparatus 10 may automatically select one sample as a reference sample.
- a sample in which data is input from the input unit 110 and data is first stored in the storage unit 140 can be selected as a reference sample by the apparatus 10.
- This step of selecting or inputting the reference sample is positioned after the representative value acquisition step (S-3) for convenience in FIG. 3, but is not limited to this, and is an earlier step, for example, when storing data. May be executed.
- the analysis unit 170 corrects the expression data of the target miRNA measured in the second and subsequent samples using the correction coefficients for the second and subsequent samples, respectively.
- the details of the correction operation are as described in ⁇ Correction process> of the comparative analysis method. Note that the correction coefficient 0 (when calculating the difference) or correction coefficient 1 (when calculating the ratio) is also corrected for the target miRNA expression level data of the first sample that is the reference sample due to the program structure. It is possible to perform the operation.
- the analysis unit 170 compares the target miRNA expression level of the reference specimen with the corrected target miRNA expression levels of the second and subsequent specimens.
- the comparison result is output to the display unit 120 by the output unit 130 and displayed.
- the comparison result can be output to an output device such as a printer or a recording medium.
- the output unit 130 can be configured to output the comparison analysis result to an external storage device such as a database existing outside the device via a network.
- the storage unit 140 stores the measurement values of the expression levels of the plurality of target miRNAs and the expression levels of the plurality of endogenous miRNAs for correction, and also appropriately stores the intermediate analysis results generated in each of the above steps.
- control unit 150 The various operations described above of the apparatus 10 are controlled by the control unit 150. Specifically, as indicated by broken line arrows in FIG. 2, for each unit of the input unit 110, the display unit 120, the output unit 130, the storage unit 140, the control unit 150, the conversion unit 160, and the analysis unit 170, Control information is output from the control unit 150, and each unit operates in cooperation with the control information, and the entire apparatus 10 operates.
- the analysis apparatus instead of using the intrinsic miRNA representative value for correction of the reference sample as a reference value, a fixed numerical value designated in advance is registered in the conversion unit 160 or the like in the apparatus 10, and the reference sample It may be used as a reference value instead of the representative value of the expression level of endogenous miRNA for correction. Details of the method in this case are as described in ⁇ Correction coefficient acquisition step> and ⁇ Correction step> of the comparative analysis method.
- the present invention also provides a program for causing a computer to function as the above-described analysis device.
- the program is a program for causing a computer to function as each of the above-described units (that is, storage unit, representative value acquisition unit, correction coefficient acquisition unit, correction unit, and output unit).
- the present invention provides a program for causing a computer to execute each step of the above-described comparative analysis method of the present invention.
- the comparative analysis method includes the measurement step, the representative value acquisition step, the correction coefficient acquisition step, and the correction step described above, and further, the target miRNA expression level between a plurality of body fluid samples is determined by the corrected target miRNA expression level.
- a comparative analysis step can be included.
- These programs are programs for causing the computer to correct the expression level of the target miRNA using data of the expression level of the endogenous miRNA for correction measured simultaneously with the expression level of the target miRNA using a microarray or the like.
- the present invention provides a computer-readable recording medium on which any one of the above programs is recorded.
- the “recording medium” can be any “portable physical medium” (non-transitory recording medium) such as a flexible disk, magneto-optical disk, ROM, EPROM, EEPROM, CD-ROM, MO, DVD, and the like.
- it may be a “communication medium” that holds a program in a short period of time, such as a communication line or a carrier wave when transmitting a program via a network, represented by a LAN, WAN, or the Internet.
- Program is a data processing method described in an arbitrary language or description method, and may be in any form such as source code or binary code.
- the “program” is not necessarily limited to a single configuration, but is distributed in the form of a plurality of modules and libraries, or in cooperation with a separate program represented by an OS (Operating System). Including those that achieve the function. Note that a well-known configuration and procedure can be used for a specific configuration for reading a recording medium, a reading procedure, an installation procedure after reading, and the like in each device described in the embodiment.
- the present invention provides a miRNA expression analysis chip including a support on which probes for capturing a plurality of target miRNAs and probes for capturing a plurality of correction endogenous miRNAs are immobilized. Preferred conditions for the chip are as described in the comparative analysis method of the present invention.
- At least one of the miRNAs shown in SEQ ID NOs: 1 to 10 described below is used as an endogenous miRNA for correction.
- SEQ ID NO: 1 is the base sequence of hsa-miR-6085 registered in miRBase as Accession No. MIMAT0023710.
- the term “miR-6085 gene” or “miR-6085” includes hsa-miR-6085 described in SEQ ID NO: 1, other species homologs or orthologs, and the like.
- the hsa-miR-6085 gene can be obtained by the method described in Voellenkle C et al., 2012, RNA, 18, p.472-484.
- SEQ ID NO: 2 is the base sequence of hsa-miR-1227-5p registered in miRBase as Accession No. MIMAT0022941.
- the term “miR-1227-5p gene” or “miR-1227-5p” includes hsa-miR-1227-5p described in SEQ ID NO: 2 and other species homologs or orthologs.
- the hsa-miR-1227-5p gene can be obtained by the method described in Berezikov E et al., 2007, Molecular Cell, 28, p.328-336.
- SEQ ID NO: 3 is the base sequence of hsa-miR-2861 registered in miRBase as Accession No. MIMAT0013802.
- the term “miR-2861 gene” or “miR-2861” includes hsa-miR-2861 described in SEQ ID NO: 3, and other species homologs or orthologs.
- the hsa-miR-2861 gene can be obtained by the method described in Li H et al., 2009, Journal of Clinical Investigation, 119, p.3666-3677.
- SEQ ID NO: 4 is the base sequence of hsa-miR-149-3p registered with miRBase under Accession No. MIMAT0004609.
- the term “miR-149-3p gene” or “miR-149-3p” includes hsa-miR-149-3p described in SEQ ID NO: 4 and other species homologues or orthologues.
- the hsa-miR-149-3p gene can be obtained by the method described in Lagos-Quintana M et al., 2002, Current Biology, 12, p.735-739.
- SEQ ID NO: 5 is the base sequence of hsa-miR-4463 registered in miRBase under Accession No. MIMAT0018987.
- the term “miR-4463 gene” or “miR-4463” includes hsa-miR-4463 described in SEQ ID NO: 5 and other species homologs or orthologs.
- the hsa-miR-4463 gene can be obtained by the method described in Jima DD et al., 2010, Blood, 116, p.e118-e127.
- SEQ ID NO: 6 is the base sequence of hsa-miR-4508 registered in miRBase with Accession No. MIMAT0019045.
- the term “miR-4508 gene” or “miR-4508” includes hsa-miR-4508 described in SEQ ID NO: 6, homologs or orthologs of other species.
- the hsa-miR-4508 gene can be obtained by the method described in Jima DD et al., 2010, Blood, 116, p.e118-e127.
- SEQ ID NO: 7 is the base sequence of hsa-miR-6090 registered in miRBase as Accession No. MIMAT0023715.
- the term “miR-6090 gene” or “miR-6090” includes hsa-miR-6090 described in SEQ ID NO: 7, and other species homologs or orthologs.
- the hsa-miR-6090 gene can be obtained by the method described in Yoo JK et al., 2012, Stem Cells and Development, Vol. 21, p.2049-2057.
- SEQ ID NO: 8 is the base sequence of hsa-miR-6775-5p registered in miRBase under Accession No. MIMAT0027450.
- the term “miR-6775-5p gene” or “miR-6775-5p” includes hsa-miR-6775-5p described in SEQ ID NO: 8, other species homolog or ortholog, and the like.
- the hsa-miR-6775-5p gene can be obtained by the method described in Ladewig E et al., 2012, Genome Research, Vol. 22, p.1634-1645.
- SEQ ID NO: 9 is the base sequence of hsa-miR-6803-5p registered in miRBase as Accession No. MIMAT0027506.
- the term “miR-6803-5p gene” or “miR-6803-5p” includes hsa-miR-6803-5p described in SEQ ID NO: 9, and other species homologs or orthologs.
- the hsa-miR-6803-5p gene can be obtained by the method described in Ladewig E et al., 2012, Genome Research, Vol. 22, p.1634-1645.
- SEQ ID NO: 10 is the base sequence of hsa-miR-5787 registered with miRBase under Accession No. MIMAT0023252.
- the term “miR-5787 gene” or “miR-5787” includes hsa-miR-5787 described in SEQ ID NO: 10, other species homolog or ortholog, and the like.
- the hsa-miR-5787 gene can be obtained by the method described in YooH et al., 2011, Biochem Biophys Res Commun, vol.415, p.567-572.
- sample RNA preparation As sample RNA, RNA extracted from 157 samples of healthy human serum using "3D-Gene” RNA extraction reagent from liquid sample kit was used. The obtained sample RNA was labeled using a “3D-Gene” miRNA labeling kit (Toray Industries, Inc.). The labeled sample RNA was hybridized and washed according to the standard protocol of “3D-Gene” miRNA chip (Toray Industries, Inc.). The reacted DNA microarray detected a fluorescent signal using a microarray scanner (Toray Industries, Inc.). The scanner was set to 100% laser output and the photomultiplier voltage was set to AUTO.
- the miRNA signal value obtained from the DNA microarray was converted into a logarithm with a base of 2, and an experimental error was corrected by an external standard nucleic acid added during RNA extraction and labeling.
- the miRNA signal values of all 157 samples obtained after correcting the experimental error were extracted with the miRNA between samples by the geNorm method.
- the GeNorm method is a search method for endogenous housekeeping genes (reference genes) in the quantitative RT-PCR method proposed by Vandesompele et al. (Genome Biology 2002, 3: research0034-research0034.11). It is used as a method for selecting mRNA, which is an endogenous housekeeping gene unique to the target specimen. Specifically, the ratio of the signal values of the two genes is calculated as a round robin for the signal values of all the detection target genes in the same specimen.
- a and V obtained by the above-described calculation method are smaller values as the signal value is smaller, and seem to be endogenous housekeeping genes that are apparently excellent. Since the DNA microarray used this time comprehensively detects all miRNAs registered in miRBase release 20, miRNAs with small signal values are preferentially selected when the geNorm method is performed using this data. From such a phenomenon, selection of an endogenous housekeeping gene in DNA microarray detection by the geNorm method has been avoided so far.
- Ten kinds of endogenous housekeeping genes having a low M value, that is, usable as correction miRNAs were selected from 281 kinds of miRNAs to which the geNorm method was actually applied.
- Table 10 shows the sequence numbers of these 10 corrective miRNAs for correction, miRNA names, MIMAT numbers registered in miRBase, M values calculated by geNorm, nucleotide sequences, and the percentage of guanine / cytosine in the sequence (GC%) It is shown in 1.
- Detection of miRNA by DNA microarray is performed by hybridization method that forms nucleic acid duplex by target miRNA and probe for capturing the target miRNA, so it contains guanine and cytosine that stabilize nucleic acid duplex It is expected that sequences with high amounts will be detected by DNA microarrays in a particularly stable manner. That is, it is generally assumed that sequences with high guanine and cytosine content are preferentially selected as endogenous housekeeping genes. However, as shown in Table 1, the endogenous housekeeping gene (corrected endogenous miRNA) selected by the geNorm method could not be said to have a high content of guanine and cytosine. On the contrary, the phenomenon that miRNA with a high content of guanine and cytosine preferentially becomes an endogenous housekeeping gene (correcting endogenous miRNA) was not observed.
- Example 2 Using the selected endogenous miRNAs for correction alone, the expression levels of target RNAs in a plurality of body fluid samples were corrected.
- RNA expression level due to RNA material instability When measuring RNA expression level due to RNA material instability, absolute expression level comparison is often required between samples with different qualities, that is, with different degrees of RNA degradation. In particular, when the specimen is a body fluid, it is assumed that any result is obtained by measuring the target miRNA expression level in the specimen placed at room temperature for a long time.
- miRNA expression profile regardless of RNA quality by performing correction according to RNA degradation based on the amount of specific endogenous miRNA for correction contained in serum. It is considered that an absolute comparison between samples can be made with respect to (amount ratio).
- 2 Let stand at 25 ° C. for 24 hours after serum separation to perform RNA extraction. Total RNA was extracted from serum prepared under each condition using “3D-Gene” RNA extraction reagent from liquid sample kit RNA, and used as sample RNA.
- Each of the obtained sample RNAs was labeled using “3D-Gene” “miRNA” labeling kit (Toray Industries, Inc.).
- the labeled sample RNA was subjected to hybridization and washing according to the standard protocol of “3D-Gene” —human miRNA—oligo chip (Toray Industries, Inc.).
- the reacted DNA microarray detected a fluorescent signal using a microarray scanner (Toray Industries, Inc.). The scanner was set to 100% laser output and the photomultiplier voltage was set to AUTO.
- FIG. 4A shows a distribution of signal values obtained by converting miRNA signal values obtained from the DNA microarray into logarithms with a base of 2 (ie, uncorrected expression level signal values).
- FIGS. 4B to 4K show distributions of corrected signal values corrected by the signal values of the endogenous miRNAs for correction shown in SEQ ID NOs: 1 to 10 and reference values that are fixed values set separately in advance.
- Day-0 (broken line) is the sample RNA under condition 1
- Day-1_25 ° C. solid line
- correction by the signal value of the endogenous miRNA for correction shown in SEQ ID NOs: 1 to 10 was performed by the method shown below.
- the signal value of the endogenous miRNA for correction shown in SEQ ID NOs: 1 to 10 is converted into a logarithm with a base of 2, and the ratio of the converted signal value to the reference value is taken as a representative value (reference value) Value / representative value) and correction coefficient.
- the correction coefficient is set for each of the correction endogenous miRNAs of SEQ ID NOs: 1 to 10. These correction factors were corrected by multiplying all miRNA signal values of each specimen for each correction endogenous miRNA.
- Example 3 As shown in Example 2, the endogenous miRNAs for correction of SEQ ID NOs: 1 to 10 each have a sufficient effect of correcting the expression level of the target miRNA alone, but further combining these results in inadequate experimentation, etc. It is envisaged that some of the correction endogenous miRNA data can be compensated for by loss. Therefore, the expression level of the target miRNA was corrected using a combination of a plurality of endogenous miRNAs for correction, and the effect of the correction was confirmed. The same sample as in Example 2 was used.
- the signal value of the endogenous miRNA for correction of SEQ ID NOs: 2, 4 and 5 was converted into a logarithm with a base of 2, and the average value or median value of the signal values after this conversion was obtained as a representative value.
- a fixed value was used as the reference value.
- the average value of all the expression levels (signal values after logarithmic transformation) of the three types of endogenous miRNAs for correction in a plurality of serum RNA samples including the two types of samples prepared in Example 2 is obtained, and this average value is fixed. Used as (reference value).
- the ratio of the representative value of the endogenous miRNA for correction to the reference value was taken (reference value / representative value) and used as a correction coefficient for the specimen.
- the target miRNA signal value was corrected by multiplying all the target miRNA signal values of each corresponding specimen by this correction coefficient.
- FIG. 5 shows the distribution of the corrected signal value of the target miRNA when the average value of the signal value after logarithmic conversion is used as a representative value of the expression level of the endogenous miRNA for correction. Similar to Example 2 in which correction was performed using each of the correction endogenous miRNAs of SEQ ID NOs: 1 to 10, even when correction was performed using a combination of a plurality of correction endogenous miRNAs, It was possible to make miRNA expression profiles identical.
- Example 4 As shown in Example 3, the endogenous miRNAs for correction of SEQ ID NOs: 1 to 10 are useful for correction also by combining them. Regarding this correction effect, it was confirmed that any combination of SEQ ID NOS: 1 to 10 showed the same effect. The same sample as in Example 2 was used.
- the signal value of the endogenous miRNA for correction of SEQ ID NOs: 2, 3, 4, 5 and 6 is converted into a logarithm with a base of 2, and for each specimen, the signal value after conversion of any of the three types of endogenous miRNA for correction is converted. An average value was obtained and used as a representative value for the sample.
- the reference value is a fixed value, and the average value of a plurality of serum RNA specimens including the two specimens prepared in Example 2 of the signal values after logarithmic transformation of the three kinds of endogenous miRNAs for correction used for obtaining the representative values. was used as a fixed value (reference value).
- the ratio between the representative value and the reference value was taken (reference value / representative value) and used as a correction coefficient for the sample.
- the miRNA expression level of each sample was corrected by multiplying all the target miRNA signal values of each corresponding sample by this correction coefficient.
- FIG. 8A shows an uncorrected expression level signal value distribution
- FIGS. 8B to 8I show corrected expression level signal value distributions. Similar to Example 2 in which correction was performed using endogenous correction miRNAs of SEQ ID NOs: 1 to 10 alone, it was possible to make the expression profiles of target miRNAs in each specimen identical.
- Example 1 When the examination of Example 1 was performed, two types of reference substances to be added from the outside in the step of labeling each sample RNA obtained from serum RNA using the “3D-Gene” miRNA labeling kit (Toray Industries, Inc.) Of synthetic RNA sequences (20 mer, spike control 1 and spike control 2 respectively) were added. These synthetic RNA sequences were fluorescently labeled in the same way as serum-derived miRNA, and the signal amount was detected by "3D-Gene” human miRNA oligo chip (Toray Industries, Inc.). Therefore, signal values obtained from a total of 16 spots of 8 points for spike control 1 and spike control 2 were converted into logarithms with a base of 2, and the median value was obtained as a representative value.
- a ratio between this representative value and a fixed value (reference value) set in advance (reference value / representative value of each sample) was obtained to obtain a correction coefficient for each sample.
- This correction factor was corrected by multiplying all miRNA signal values for each specimen.
- the distribution of signal values before correction is shown in FIG. 6A, and the distribution of signal values after correction is shown in FIG. 6B. It was shown that the signal value of the target miRNA in the sample was not sufficiently corrected by correction with spike control added from the outside during labeling.
- FIG. 7 shows a distribution of corrected signal values when corrected with hsa-miR-16-5p. The correction by the expression level of hsa-miR-16-5p showed that the signal value of the target miRNA in the sample was not sufficiently corrected.
Landscapes
- Life Sciences & Earth Sciences (AREA)
- Health & Medical Sciences (AREA)
- Engineering & Computer Science (AREA)
- Chemical & Material Sciences (AREA)
- Bioinformatics & Cheminformatics (AREA)
- Organic Chemistry (AREA)
- Physics & Mathematics (AREA)
- Biotechnology (AREA)
- General Health & Medical Sciences (AREA)
- Wood Science & Technology (AREA)
- Zoology (AREA)
- Genetics & Genomics (AREA)
- Molecular Biology (AREA)
- Biochemistry (AREA)
- Biophysics (AREA)
- Immunology (AREA)
- General Engineering & Computer Science (AREA)
- Microbiology (AREA)
- Analytical Chemistry (AREA)
- Biomedical Technology (AREA)
- Proteomics, Peptides & Aminoacids (AREA)
- Medical Informatics (AREA)
- Spectroscopy & Molecular Physics (AREA)
- Bioinformatics & Computational Biology (AREA)
- Evolutionary Biology (AREA)
- Theoretical Computer Science (AREA)
- Medicinal Chemistry (AREA)
- General Physics & Mathematics (AREA)
- Pathology (AREA)
- Urology & Nephrology (AREA)
- Hematology (AREA)
- Data Mining & Analysis (AREA)
- Sustainable Development (AREA)
- Software Systems (AREA)
- Public Health (AREA)
- Evolutionary Computation (AREA)
- Epidemiology (AREA)
- Databases & Information Systems (AREA)
- Computer Vision & Pattern Recognition (AREA)
- Bioethics (AREA)
Abstract
Priority Applications (7)
| Application Number | Priority Date | Filing Date | Title |
|---|---|---|---|
| US15/511,877 US11348663B2 (en) | 2014-09-16 | 2015-09-15 | Method and device for comparative analysis of miRNA expression level |
| JP2015545966A JP6819848B2 (ja) | 2014-09-16 | 2015-09-15 | miRNA発現量の比較解析方法及び装置 |
| BR112017003608-8A BR112017003608B1 (pt) | 2014-09-16 | 2015-09-15 | MÉTODO PARA A ANÁLISE COMPARATIVA DO NÍVEL DE EXPRESSÃO DE miRNA(S) ALVO(S) E CHIP PARA ANÁLISE DA EXPRESSÃO DE miRNA |
| CA2957267A CA2957267C (fr) | 2014-09-16 | 2015-09-15 | Procede et dispositif pour l'analyse comparative du niveau d'expression de miarn |
| CN201580049304.XA CN107075578B (zh) | 2014-09-16 | 2015-09-15 | miRNA表达量的比较分析方法和装置 |
| EP15841913.5A EP3196316B1 (fr) | 2014-09-16 | 2015-09-15 | PROCÉDÉ ET DISPOSITIF POUR L'ANALYSE COMPARATIVE DU NIVEAU D'EXPRESSION DE miARN |
| KR1020167036349A KR102350747B1 (ko) | 2014-09-16 | 2015-09-15 | miRNA 발현량의 비교 해석 방법 및 장치 |
Applications Claiming Priority (2)
| Application Number | Priority Date | Filing Date | Title |
|---|---|---|---|
| JP2014187685 | 2014-09-16 | ||
| JP2014-187685 | 2014-09-16 |
Publications (1)
| Publication Number | Publication Date |
|---|---|
| WO2016043170A1 true WO2016043170A1 (fr) | 2016-03-24 |
Family
ID=55533207
Family Applications (1)
| Application Number | Title | Priority Date | Filing Date |
|---|---|---|---|
| PCT/JP2015/076085 WO2016043170A1 (fr) | 2014-09-16 | 2015-09-15 | PROCÉDÉ ET DISPOSITIF POUR L'ANALYSE COMPARATIVE DU NIVEAU D'EXPRESSION DE miARN |
Country Status (8)
| Country | Link |
|---|---|
| US (1) | US11348663B2 (fr) |
| EP (1) | EP3196316B1 (fr) |
| JP (1) | JP6819848B2 (fr) |
| KR (1) | KR102350747B1 (fr) |
| CN (1) | CN107075578B (fr) |
| BR (1) | BR112017003608B1 (fr) |
| CA (1) | CA2957267C (fr) |
| WO (1) | WO2016043170A1 (fr) |
Cited By (1)
| Publication number | Priority date | Publication date | Assignee | Title |
|---|---|---|---|---|
| WO2020158260A1 (fr) * | 2019-01-31 | 2020-08-06 | 国立大学法人 東京医科歯科大学 | Procédé et système d'examen des arythmies auriculaires |
Families Citing this family (3)
| Publication number | Priority date | Publication date | Assignee | Title |
|---|---|---|---|---|
| WO2019168933A1 (fr) | 2018-02-27 | 2019-09-06 | Quadrant Biosciences Inc. | Procédé de surveillance du métabolisme avant et après un exercice ou une blessure faisant appel à des micro-arn salivaires |
| CA3108241A1 (fr) * | 2018-07-31 | 2020-02-06 | Toray Industries, Inc. | Procede permettant d'evaluer la qualite d'un echantillon de fluide corporel |
| CN113151413A (zh) * | 2021-04-28 | 2021-07-23 | 杭州觅因生物科技有限公司 | 一种具有校准功能的microRNA检测试剂盒 |
Citations (5)
| Publication number | Priority date | Publication date | Assignee | Title |
|---|---|---|---|---|
| US20090075258A1 (en) * | 2007-09-14 | 2009-03-19 | Latham Gary J | Methods of Normalization in microRNA Detection Assays |
| WO2009133915A1 (fr) * | 2008-04-30 | 2009-11-05 | 日本電気株式会社 | Marqueur de cancer, procédé d’évaluation du cancer utilisant le marqueur de cancer et réactif d’évaluation |
| JP2014007995A (ja) * | 2012-06-29 | 2014-01-20 | Toray Ind Inc | 小型rna発現量の比較解析方法 |
| WO2014034685A1 (fr) * | 2012-08-27 | 2014-03-06 | 国立大学法人京都大学 | Diagnostic de la polyarthrite rhumatoïde au moyen de microarn |
| WO2014048441A1 (fr) * | 2012-09-26 | 2014-04-03 | Mirrx Therapeutics | Oligomères à profil hors cible amélioré |
Family Cites Families (5)
| Publication number | Priority date | Publication date | Assignee | Title |
|---|---|---|---|---|
| JP2007075095A (ja) | 2005-04-11 | 2007-03-29 | Mitsubishi Rayon Co Ltd | miRNA搭載マイクロアレイ |
| JP2007097429A (ja) | 2005-09-30 | 2007-04-19 | Mitsubishi Rayon Co Ltd | non−codingRNAの検出データ補正方法 |
| WO2011076141A1 (fr) | 2009-12-24 | 2011-06-30 | Fudan University | Kits de diagnostic comprenant des biomarqueurs de micro-arn et procédés de diagnostic du cancer hépatocellulaire |
| CN102892898B (zh) | 2009-12-24 | 2016-03-09 | 复旦大学 | 用于肝细胞癌诊断的含微rna生物标记的诊断试剂盒和方法 |
| CN102071253A (zh) | 2010-12-08 | 2011-05-25 | 中国人民解放军第二军医大学 | 检测粪便中microRNA表达水平的方法和内参基因的选择方法 |
-
2015
- 2015-09-15 CA CA2957267A patent/CA2957267C/fr active Active
- 2015-09-15 CN CN201580049304.XA patent/CN107075578B/zh active Active
- 2015-09-15 JP JP2015545966A patent/JP6819848B2/ja active Active
- 2015-09-15 BR BR112017003608-8A patent/BR112017003608B1/pt active IP Right Grant
- 2015-09-15 EP EP15841913.5A patent/EP3196316B1/fr active Active
- 2015-09-15 KR KR1020167036349A patent/KR102350747B1/ko active IP Right Grant
- 2015-09-15 US US15/511,877 patent/US11348663B2/en active Active
- 2015-09-15 WO PCT/JP2015/076085 patent/WO2016043170A1/fr active Application Filing
Patent Citations (5)
| Publication number | Priority date | Publication date | Assignee | Title |
|---|---|---|---|---|
| US20090075258A1 (en) * | 2007-09-14 | 2009-03-19 | Latham Gary J | Methods of Normalization in microRNA Detection Assays |
| WO2009133915A1 (fr) * | 2008-04-30 | 2009-11-05 | 日本電気株式会社 | Marqueur de cancer, procédé d’évaluation du cancer utilisant le marqueur de cancer et réactif d’évaluation |
| JP2014007995A (ja) * | 2012-06-29 | 2014-01-20 | Toray Ind Inc | 小型rna発現量の比較解析方法 |
| WO2014034685A1 (fr) * | 2012-08-27 | 2014-03-06 | 国立大学法人京都大学 | Diagnostic de la polyarthrite rhumatoïde au moyen de microarn |
| WO2014048441A1 (fr) * | 2012-09-26 | 2014-04-03 | Mirrx Therapeutics | Oligomères à profil hors cible amélioré |
Non-Patent Citations (2)
| Title |
|---|
| LADEWIG ERIK ET AL.: "Discovery of hundreds of mirtrons in mouse and human small RNA data", GENOME RESEARCH, vol. 22, no. 9, 2012, pages 1634 - 1645, XP055419072 * |
| See also references of EP3196316A4 * |
Cited By (1)
| Publication number | Priority date | Publication date | Assignee | Title |
|---|---|---|---|---|
| WO2020158260A1 (fr) * | 2019-01-31 | 2020-08-06 | 国立大学法人 東京医科歯科大学 | Procédé et système d'examen des arythmies auriculaires |
Also Published As
| Publication number | Publication date |
|---|---|
| JPWO2016043170A1 (ja) | 2017-06-22 |
| JP6819848B2 (ja) | 2021-01-27 |
| CA2957267C (fr) | 2023-03-14 |
| CN107075578A (zh) | 2017-08-18 |
| CA2957267A1 (fr) | 2016-03-24 |
| KR102350747B1 (ko) | 2022-01-13 |
| CN107075578B (zh) | 2021-06-01 |
| EP3196316A1 (fr) | 2017-07-26 |
| BR112017003608A2 (pt) | 2018-01-30 |
| EP3196316A4 (fr) | 2018-03-28 |
| EP3196316B1 (fr) | 2023-02-22 |
| KR20170052530A (ko) | 2017-05-12 |
| US20170262581A1 (en) | 2017-09-14 |
| US11348663B2 (en) | 2022-05-31 |
| BR112017003608B1 (pt) | 2023-11-07 |
| EP3196316A9 (fr) | 2018-10-24 |
Similar Documents
| Publication | Publication Date | Title |
|---|---|---|
| Tam et al. | Robust global microRNA expression profiling using next-generation sequencing technologies | |
| CN108474033B (zh) | 来源于体液的miRNA的品质的评价方法 | |
| JP6819848B2 (ja) | miRNA発現量の比較解析方法及び装置 | |
| JP7363478B2 (ja) | 体液検体の品質評価方法 | |
| JP6705171B2 (ja) | 小型rnaの発現量の補正方法及び装置 | |
| JP5998674B2 (ja) | 小型rna発現量の比較解析方法 | |
| WO2021132231A1 (fr) | Procédé permettant d'évaluer la qualité d'un échantillon de sérum sanguin | |
| Budhraja et al. | Microarray analysis of trophoblast cells |
Legal Events
| Date | Code | Title | Description |
|---|---|---|---|
| ENP | Entry into the national phase |
Ref document number: 2015545966 Country of ref document: JP Kind code of ref document: A |
|
| 121 | Ep: the epo has been informed by wipo that ep was designated in this application |
Ref document number: 15841913 Country of ref document: EP Kind code of ref document: A1 |
|
| ENP | Entry into the national phase |
Ref document number: 20167036349 Country of ref document: KR Kind code of ref document: A |
|
| ENP | Entry into the national phase |
Ref document number: 2957267 Country of ref document: CA |
|
| REEP | Request for entry into the european phase |
Ref document number: 2015841913 Country of ref document: EP |
|
| WWE | Wipo information: entry into national phase |
Ref document number: 2015841913 Country of ref document: EP |
|
| REG | Reference to national code |
Ref country code: BR Ref legal event code: B01A Ref document number: 112017003608 Country of ref document: BR |
|
| NENP | Non-entry into the national phase |
Ref country code: DE |
|
| WWE | Wipo information: entry into national phase |
Ref document number: 15511877 Country of ref document: US |
|
| REG | Reference to national code |
Ref country code: BR Ref legal event code: B01E Ref document number: 112017003608 Country of ref document: BR |
|
| ENP | Entry into the national phase |
Ref document number: 112017003608 Country of ref document: BR Kind code of ref document: A2 Effective date: 20170222 |