WO2014017403A1 - Dispositif de reconnaissance d'image monté dans un véhicule - Google Patents
Dispositif de reconnaissance d'image monté dans un véhicule Download PDFInfo
- Publication number
- WO2014017403A1 WO2014017403A1 PCT/JP2013/069667 JP2013069667W WO2014017403A1 WO 2014017403 A1 WO2014017403 A1 WO 2014017403A1 JP 2013069667 W JP2013069667 W JP 2013069667W WO 2014017403 A1 WO2014017403 A1 WO 2014017403A1
- Authority
- WO
- WIPO (PCT)
- Prior art keywords
- vehicle
- degree
- image
- lens
- unit
- Prior art date
Links
Images


Classifications
-
- G—PHYSICS
- G02—OPTICS
- G02B—OPTICAL ELEMENTS, SYSTEMS OR APPARATUS
- G02B27/00—Optical systems or apparatus not provided for by any of the groups G02B1/00 - G02B26/00, G02B30/00
- G02B27/0006—Optical systems or apparatus not provided for by any of the groups G02B1/00 - G02B26/00, G02B30/00 with means to keep optical surfaces clean, e.g. by preventing or removing dirt, stains, contamination, condensation
-
- B—PERFORMING OPERATIONS; TRANSPORTING
- B60—VEHICLES IN GENERAL
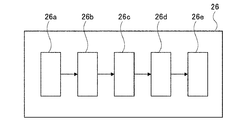
- B60R—VEHICLES, VEHICLE FITTINGS, OR VEHICLE PARTS, NOT OTHERWISE PROVIDED FOR
- B60R1/00—Optical viewing arrangements; Real-time viewing arrangements for drivers or passengers using optical image capturing systems, e.g. cameras or video systems specially adapted for use in or on vehicles
- B60R1/002—Optical viewing arrangements; Real-time viewing arrangements for drivers or passengers using optical image capturing systems, e.g. cameras or video systems specially adapted for use in or on vehicles specially adapted for covering the peripheral part of the vehicle, e.g. for viewing tyres, bumpers or the like
-
- G—PHYSICS
- G06—COMPUTING; CALCULATING OR COUNTING
- G06T—IMAGE DATA PROCESSING OR GENERATION, IN GENERAL
- G06T7/00—Image analysis
- G06T7/20—Analysis of motion
- G06T7/254—Analysis of motion involving subtraction of images
-
- G—PHYSICS
- G06—COMPUTING; CALCULATING OR COUNTING
- G06T—IMAGE DATA PROCESSING OR GENERATION, IN GENERAL
- G06T7/00—Image analysis
- G06T7/70—Determining position or orientation of objects or cameras
- G06T7/73—Determining position or orientation of objects or cameras using feature-based methods
-
- G—PHYSICS
- G06—COMPUTING; CALCULATING OR COUNTING
- G06V—IMAGE OR VIDEO RECOGNITION OR UNDERSTANDING
- G06V20/00—Scenes; Scene-specific elements
- G06V20/50—Context or environment of the image
- G06V20/56—Context or environment of the image exterior to a vehicle by using sensors mounted on the vehicle
- G06V20/58—Recognition of moving objects or obstacles, e.g. vehicles or pedestrians; Recognition of traffic objects, e.g. traffic signs, traffic lights or roads
- G06V20/584—Recognition of moving objects or obstacles, e.g. vehicles or pedestrians; Recognition of traffic objects, e.g. traffic signs, traffic lights or roads of vehicle lights or traffic lights
-
- G—PHYSICS
- G06—COMPUTING; CALCULATING OR COUNTING
- G06V—IMAGE OR VIDEO RECOGNITION OR UNDERSTANDING
- G06V20/00—Scenes; Scene-specific elements
- G06V20/50—Context or environment of the image
- G06V20/56—Context or environment of the image exterior to a vehicle by using sensors mounted on the vehicle
- G06V20/588—Recognition of the road, e.g. of lane markings; Recognition of the vehicle driving pattern in relation to the road
-
- G—PHYSICS
- G08—SIGNALLING
- G08G—TRAFFIC CONTROL SYSTEMS
- G08G1/00—Traffic control systems for road vehicles
- G08G1/16—Anti-collision systems
-
- G—PHYSICS
- G08—SIGNALLING
- G08G—TRAFFIC CONTROL SYSTEMS
- G08G1/00—Traffic control systems for road vehicles
- G08G1/16—Anti-collision systems
- G08G1/166—Anti-collision systems for active traffic, e.g. moving vehicles, pedestrians, bikes
-
- G—PHYSICS
- G08—SIGNALLING
- G08G—TRAFFIC CONTROL SYSTEMS
- G08G1/00—Traffic control systems for road vehicles
- G08G1/16—Anti-collision systems
- G08G1/167—Driving aids for lane monitoring, lane changing, e.g. blind spot detection
-
- H—ELECTRICITY
- H04—ELECTRIC COMMUNICATION TECHNIQUE
- H04N—PICTORIAL COMMUNICATION, e.g. TELEVISION
- H04N23/00—Cameras or camera modules comprising electronic image sensors; Control thereof
-
- H—ELECTRICITY
- H04—ELECTRIC COMMUNICATION TECHNIQUE
- H04N—PICTORIAL COMMUNICATION, e.g. TELEVISION
- H04N23/00—Cameras or camera modules comprising electronic image sensors; Control thereof
- H04N23/80—Camera processing pipelines; Components thereof
- H04N23/81—Camera processing pipelines; Components thereof for suppressing or minimising disturbance in the image signal generation
- H04N23/811—Camera processing pipelines; Components thereof for suppressing or minimising disturbance in the image signal generation by dust removal, e.g. from surfaces of the image sensor or processing of the image signal output by the electronic image sensor
-
- G—PHYSICS
- G06—COMPUTING; CALCULATING OR COUNTING
- G06T—IMAGE DATA PROCESSING OR GENERATION, IN GENERAL
- G06T2207/00—Indexing scheme for image analysis or image enhancement
- G06T2207/10—Image acquisition modality
- G06T2207/10016—Video; Image sequence
-
- G—PHYSICS
- G06—COMPUTING; CALCULATING OR COUNTING
- G06T—IMAGE DATA PROCESSING OR GENERATION, IN GENERAL
- G06T2207/00—Indexing scheme for image analysis or image enhancement
- G06T2207/20—Special algorithmic details
- G06T2207/20212—Image combination
- G06T2207/20224—Image subtraction
-
- G—PHYSICS
- G06—COMPUTING; CALCULATING OR COUNTING
- G06T—IMAGE DATA PROCESSING OR GENERATION, IN GENERAL
- G06T2207/00—Indexing scheme for image analysis or image enhancement
- G06T2207/30—Subject of image; Context of image processing
- G06T2207/30248—Vehicle exterior or interior
- G06T2207/30252—Vehicle exterior; Vicinity of vehicle
- G06T2207/30261—Obstacle
Definitions
- the present invention relates to an in-vehicle image recognition apparatus that detects the position of another vehicle, the position of a lane marker, and the like using an on-vehicle camera.
- the water rolled up by the vehicle may adhere to the lens surface of the camera.
- dust rolled up by the host vehicle may adhere to the lens surface of the camera.
- the snow melting agent rolled up by the host vehicle may adhere to the lens surface of the camera.
- a vehicle obstacle detection device is disclosed (for example, Patent Document 1).
- the area of the foreign matter adhering to the lens becomes wide, the area where the obstacle detection can be performed becomes narrow, and there is a possibility that the obstacle detection performance is deteriorated.
- the present invention has been made in view of the above problems, and can reliably detect the position of another vehicle, the position of a lane marker, and the like even when the lens is clouded or a deposit is attached to the lens.
- An object is to provide an in-vehicle image recognition apparatus.
- the in-vehicle image recognition apparatus is capable of detecting the position of another vehicle or the position of a lane marker even when the lens is clouded or when an adherent such as mud or water droplets is attached to the lens.
- the present invention relates to an in-vehicle image recognition apparatus capable of detecting
- the in-vehicle image recognition apparatus is installed in the own vehicle, observes the surroundings of the own vehicle through a lens, and displays the observed optical signals around the own vehicle as image signals.
- An image recognition application executing unit that detects a moving object existing around the host vehicle from the image captured by the image capturing unit with a predetermined detection sensitivity, and an image signal From the above, the cloudiness degree calculation unit for calculating the degree of cloudiness of the lens, the adhesion degree calculation unit for calculating the degree of adhesion of deposits such as mud and water droplets on the lens, and the detection according to the height of the degree of cloudiness
- a detection sensitivity adjustment unit that adjusts the sensitivity in a direction to improve sensitivity, and the detection sensitivity adjustment unit corrects the detection sensitivity based on the degree of adhesion of deposits such as mud and water droplets on the lens. It is characterized by.
- the surroundings of the subject vehicle are observed through the lens, installed in the subject vehicle, and the optical signals around the observed subject vehicle are observed.
- the detection sensitivity of the image recognition application execution unit that detects a moving object that exists around the host vehicle with a predetermined detection sensitivity from the image captured by the imaging unit that converts the image signal to the image signal is high in the degree of white turbidity.
- the detection sensitivity adjustment unit that adjusts the detection sensitivity according to the direction, the lens is corrected based on the degree of adhesion of deposits such as mud and water droplets calculated on the lens by the adhesion degree calculation unit. Even when a deposit such as mud or water droplets is attached to the vehicle, since an improvement in detection sensitivity more than necessary is suppressed, a moving object present around the host vehicle can be reliably detected.
- the on-vehicle image recognition apparatus can reliably detect the position of another vehicle, the position of a lane marker, etc., regardless of the degree of cloudiness of the lens and the state of adhesion of the deposit.
- Example 1 of this invention shows the result of detecting a light source region that satisfies the condition from the image (c).
- Example 1 of this invention it is a figure explaining the range which performs the light source area
- Example 1 of this invention it is a figure explaining the shape of the area
- Example 1 of this invention it is a figure explaining an example of the predetermined line which calculates a brightness
- Example 1 of this invention it is a figure explaining the state transition showing transition of the certainty degree of a cloudiness degree.
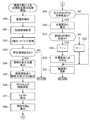
- It is a flowchart which shows the flow of the cloudiness degree calculation process based on the edge strength performed in Example 1 of this invention.
- (A) is a figure which shows the example of the imaged image.
- (B) is a diagram showing an example of edge composing points detected from the image. It is a figure for demonstrating the process of counting a bright surrounding block in Example 1 of this invention. It is a figure explaining the outline
- Example 2 is a figure which shows the example of the produced
- Example 1 of this invention it is a figure which shows the small area
- Example 1 of this invention it is a figure which shows an example of the histogram obtained by a solid-object detection part.
- (a) is a top view which shows positional relationships, such as a detection area.
- (B) is a perspective view showing a positional relationship of a detection region or the like in real space. It is a figure for demonstrating operation
- the gray value stored in the image is referred to as a luminance value.
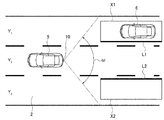
- the in-vehicle image recognition apparatus monitors a rear side of a traveling vehicle and alerts or warns when there is an approaching vehicle in the adjacent lane behind the traveling vehicle (image). This is an example applied to a vehicle on which a recognition application is implemented.
- the imaging unit 10 that monitors the rear of the host vehicle 5 is attached to the rear of the host vehicle 5 in a rearward direction, and includes a range ⁇ (lanes Y 1 , Y 2 , Y of the road 2) including the left and right adjacent lanes behind the host vehicle 5. 3 ). Then, from among the captured images to detect the approaching vehicle is present in the detection region X2 of the detection region X1, and the adjacent lane Y 3 adjacent lane Y 1 by the image processing.
- the BSW system is activated when the host vehicle 5 is traveling at a predetermined vehicle speed or higher, and the other vehicle 6 is in the lanes Y 1 and Y 3 adjacent to the lane Y 2 within a predetermined distance range from the imaging unit 10. When it is detected and it is confirmed that the detected other vehicle 6 is approaching the host vehicle 5, the other vehicle 6 is recognized as an approaching vehicle.
- That the other vehicle 6 is approaching the host vehicle 5 is determined by analyzing the images captured by the imaging unit 10 in time series. Details will be described later.
- the presence of the other vehicle 6 is transmitted to the driver as visual information by turning on, for example, an indicator provided in the own vehicle 5 (primary alarm).
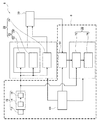
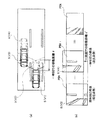
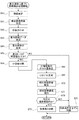
- FIG. 2 shows a configuration diagram when the in-vehicle image recognition apparatus according to the present embodiment is applied to the host vehicle 5 on which the BSW system described above is mounted.
- the in-vehicle image recognition apparatus 8 is installed near the rear license plate of the host vehicle 5 (shown in FIG. 1) and observes the range ⁇ shown in FIG. 1 as shown in FIG.
- Lens dirt detection unit 20 for detecting the degree of white turbidity of the lens 12 mounted in front of the imaging unit 10 and the degree of adhesion of deposits such as mud and water droplets from the images captured by the unit 10 and the imaging unit 10
- a lens contamination degree calculation unit 30 for calculating the contamination degree of the lens 12 based on the detected white turbidity degree of the lens 12 and the adhesion degree of deposits such as mud and water droplets, and others in the vehicle detection unit 70 described later.
- a detection sensitivity adjustment unit 50 that adjusts the detection sensitivity of the vehicle 6, a vehicle information acquisition unit 60 that acquires the vehicle speed of the host vehicle 5, and a vehicle detection unit 70 that detects the other vehicle 6 approaching from behind the host vehicle 5 (image) Recognition application execution part) Eteiru.
- the imaging unit 10, the detection sensitivity adjustment unit 50, the vehicle information acquisition unit 60, and the vehicle detection unit 70 constitute a BSW system 9.
- the imaging unit 10 further includes a lens 12, a photoelectric conversion unit 14 configured by, for example, a CMOS element that photoelectrically converts an optical signal into an electrical signal, and a gain adjustment unit 16 that adjusts the gain of the photoelectrically converted electrical signal. It has.
- the lens contamination detection unit 20 is further imaged by the imaging unit 10 and a first turbidity degree calculation unit 22 that calculates the degree of turbidity of the lens 12 based on the luminance gradient in the image captured by the imaging unit 10.
- a white turbidity degree calculation unit 25 comprising a second white turbidity degree calculation part 24 for calculating the degree of white turbidity of the lens 12 based on the dispersion of luminance values in the image, and adhering substances such as mud and water droplets attached to the lens 12 are detected.
- An adhesion degree calculation unit 26 is provided.
- the vehicle detection unit 70 detects a three-dimensional object behind the host vehicle 5 from the image picked up by the image pickup unit 10, calculates a moving distance and a moving speed of the three-dimensional object, and detects it as an approaching vehicle. And an alarm output unit 74 that alerts with an indicator or buzzer when an approaching vehicle is detected by the approaching vehicle detection unit 72.
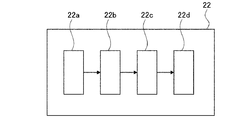
- the first turbidity degree calculation unit 22 constituting the turbidity degree calculation part 25 is detected by an area detection part 22a for detecting an image of a headlight of a following vehicle and an area detection part 22a.
- a luminance gradient calculation unit 22b that calculates a luminance gradient on a predetermined line in the region, and a similarity calculation unit that determines whether or not the regions detected by the region detection unit 22a at different times are images from the same light source 22c and a certainty factor determination unit 22d that determines the certainty factor of the calculated degree of cloudiness.
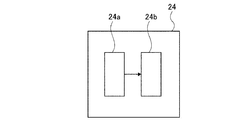
- the second turbidity degree calculation unit 24 constituting the turbidity degree calculation part 25 includes an edge intensity calculation part 24a that calculates edge intensity in an image captured by the imaging part 10, and An edge strength analysis unit 24b that obtains the distribution of edge strength in the image from the edge strength calculated by the edge strength calculation unit 24a and calculates the degree of white turbidity of the lens 12 based on the distribution of edge strength in the screen; It is composed of
- the degree-of-attachment calculation unit 26 sets a processing region in the image captured by the image capturing unit 10 and divides the processing region into a plurality of blocks.
- the presence / absence of attachment of the lens 12 based on the processing results of the luminance change calculation unit 26d that calculates the time series change of the luminance value based on the luminance value, the edge detection unit 26b, the luminance distribution calculation unit 26c, and the luminance change calculation unit 26d It is comprised from the adhering matter determination part 26e which determines.
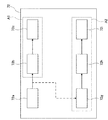
- An approaching vehicle detection unit 72 shown in FIG. 6 is a part that detects an approaching vehicle (another vehicle 6) using differential waveform information, and includes a viewpoint conversion unit 72a, a positioning unit 72b, and a three-dimensional object detection unit 72c. .
- the approaching vehicle detection unit 72 of the first embodiment may be configured to detect an approaching vehicle (another vehicle 6) using edge information.
- a luminance difference calculation unit 72g, an edge line detection unit 72h, and a detection block A1 configured by the alignment unit 72b and the three-dimensional object detection unit 72c are surrounded by a broken line.
- the detection block A2 including the three-dimensional object detection unit 72i can be replaced.
- both the detection block A1 and the detection block A2 can be provided, and the approaching vehicle can be detected using the edge information while detecting the approaching vehicle using the differential waveform information.
- both the detection block A1 and the detection block A2 are provided, for example, either the detection block A1 or the detection block A2 may be operated according to environmental factors such as brightness.
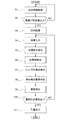
- step S 1 the vehicle information acquisition unit 60 acquires the vehicle speed as the vehicle information of the host vehicle 5.
- step S2 it is determined whether or not the value of the vehicle speed signal acquired by the vehicle information acquisition unit 60 is a predetermined value (for example, 1 km / h) or more.
- a predetermined value for example, 1 km / h
- the process proceeds to step S3 and the BSW system 9 is activated.
- the process returns to step S1.
- step S4 the imaging unit 10 captures an image behind the host vehicle 5. Then, the optical signal transmitted through the lens 12 is converted into an electric signal by the photoelectric conversion unit 14 and further amplified by the gain adjustment unit 16 to generate an image signal I (x, y).
- the image signal I (x, y) thus generated is simply referred to as an image I (x, y).
- the gain adjusting unit 16 gives an appropriate gain so that the level of the electrical signal converted by the photoelectric conversion unit 14 becomes a predetermined level, and amplifies the signal to obtain an image I (x, y). Thereby, even in a dark environment, an image I (x, y) having a high S / N ratio can be obtained by giving an appropriate gain.
- the gain adjustment is executed as needed together with imaging, and the gain adjustment unit 16 is configured to monitor the latest gain value.
- step S5 the first turbidity degree calculator 22 and the second turbidity degree calculator 24 calculate the degree of turbidity of the lens 12.
- the procedure of this processing is shown in FIGS. 8 and 9, and details thereof will be described later.
- step S6 the said adhesion degree calculation part 26 detects deposits, such as mud and a water droplet, which adhered to the lens 12.
- deposits such as mud and a water droplet
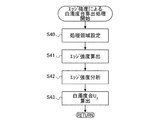
- step S7 the lens contamination degree calculation unit 30 calculates the contamination degree of the lens 12. Details thereof will be described later.
- step S8 the cloudiness degree of the lens 12 calculated by the first cloudiness degree calculation unit 22 and the second cloudiness degree calculation unit 24, and the mud adhering to the lens 12 calculated by the adhesion degree calculation unit 26 are calculated.
- the detection sensitivity adjustment unit 50 is notified of the degree of adhesion of a deposit such as water droplets, and the detection sensitivity adjustment unit 50 corrects the vehicle detection sensitivity based on the notified degree of cloudiness and adhesion of the lens 12. .
- step S9 the approaching vehicle detection unit 72 detects an approaching vehicle from the image captured by the imaging unit 10.
- the procedure of this processing is shown in FIGS. 25 and 31 and will be described later in detail.
- step S ⁇ b> 10 it is determined whether or not there is a need to output an alarm based on the presence or absence of the other vehicle 6 detected by the approaching vehicle detection unit 72 and the relative speed of the other vehicle 6 with respect to the host vehicle 5. .
- the process proceeds to step S11, and when there is no need to output an alarm, the process returns to step S4.
- step S11 the alarm output unit 74 outputs an alarm with an indicator or buzzer, alerts the passenger of the host vehicle 5 of the presence of an approaching vehicle, and alerts the passenger.
- turbidity degree calculation unit 25 a method in which the turbidity degree of the lens 12 is based on a luminance gradient in an image captured by the imaging unit 10 and a method based on an edge intensity distribution in the image captured by the imaging unit 10 Is calculated by
- the degree of white turbidity of the lens 12 calculated based on the luminance gradient is U1
- the degree of white turbidity of the lens 12 calculated based on the edge intensity distribution is U2.
- the first turbidity degree calculation unit 22 detects the image of the headlight of the following vehicle or the image generated by the reflection of sunlight from the image I (x, y) captured by the imaging unit 10, and is thus detected.
- a predetermined line is set in the obtained image, and the degree of turbidity U1 of the lens is calculated based on the luminance gradient on the predetermined line.
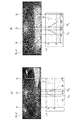
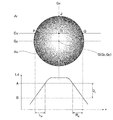
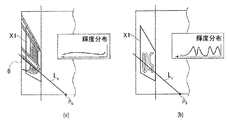
- 8A and 8B are images I including the headlamps of the following vehicle actually observed by the imaging unit 10 of the in-vehicle image recognition device 8 and traveling in the same lane as the host vehicle 5.
- x, y). 8A shows an image when the surface of the lens 12 is not clouded
- FIG. 8B shows an image when the surface of the lens 12 is clouded.
- the graph shown below the image I (x, y) in FIGS. 8A and 8B is a search direction (line) extending leftward from the search start point O in the headlight image.
- the distribution of luminance values on OP hereinafter referred to as luminance distribution Ld
- luminance distribution Ld the luminance distribution Ld on the line OQ extending in the right direction from the search start point O in the headlight image as one graph It is shown in.
- the number of pixels in the left-right direction from when the luminance distribution Ld on the line OP falls below the threshold A to below the threshold B smaller than the threshold A is L W
- the luminance distribution on the line OQ Ld is used from below the threshold a
- the number of horizontal direction pixels to below lower threshold B than the threshold a is taken as R W
- D I / L W luminance gradient on line OP
- ⁇ D I / R W luminance gradient on line OQ
- the first turbidity degree calculation unit 22 calculates the turbidity degree U1 of the lens 12 using the magnitude of the luminance gradient g. That is, the smaller the absolute value of the luminance gradient g, the higher the turbidity degree U1 is calculated.
- luminance gradient g is small continues for a fixed period, it is judged that white turbidity has generate
- step S20 an image I (x, y) (hereinafter simply referred to as an image I) captured by the imaging unit 10 is reduced at a predetermined ratio, and a reduced image I ′ (x, y) (hereinafter referred to as “image I”). Simply referred to as reduced image I ′).
- image I a reduced image I ′ (x, y)
- image I ′ a reduced image I ′
- the reason for reducing the image in this way is to reduce the amount of memory required for image processing by reducing the size of the image and to improve the processing speed.
- the specific reduction ratio is determined in consideration of the computer environment to be used, the resolution of the image, and the like.
- the above-described image reduction is performed by thinning out pixels, this may be performed by averaging the luminance values of neighboring pixels. By this processing, the image shown in FIG. 10A is reduced to the image shown in FIG.
- step S21 a region for detecting a headlight image or reflected sunlight image of the following vehicle is set in the reduced image I ′ reduced in step S20.
- the following vehicle traveling on the same lane Y 2 between the vehicle 5 by setting the area where the headlight image objects appear, from this region, the image of the following vehicle headlamp or the sun, A reflected image of light is detected.
- the computer load can be reduced.
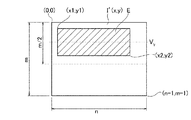
- FIG. 11 An example of the processing area set in this way is shown in FIG. As shown in FIG. 11, a processing area E is set with an upper left (x1, y1) and a lower right (x2, y2) for an image having a horizontal pixel number n and a vertical pixel number m. .
- the vertical position of the processing area E is determined by the mounting position of the imaging unit 10 in the height direction and the mounting angle in the vertical direction with respect to the host vehicle 5, and the vertical coordinate V Y of the vanishing point corresponding to the infinity point (see FIG. 11)) as a reference.
- the horizontal position of the processing area E is set according to the mounting position of the imaging unit 10 in the horizontal direction with respect to the host vehicle 5. That is, if the imaging unit 10 is installed in the center of the host vehicle 5, the processing area E is set symmetrically in the reduced image I '.
- FIG. 11 shows an example in which the attachment position of the imaging unit 10 to the host vehicle 5 is offset to the left and right, and the processing area E is set at a left-right asymmetric position.
- step S22 an area in which the reduced image I ′ is binarized with a predetermined threshold and converted into a binary image with respect to the inside of the processing area E set in step S21, and a binary image is formed.
- a labeling process for assigning a number to each is performed.
- the predetermined threshold is set in advance by experiment or the like, the value of the image can detect the headlights of a following vehicle traveling on the same lane Y 2 between the vehicle 5, and detects a reflected image of the sun Possible values are used.
- This threshold value is stored in the area detection unit 22a.
- the gain value of the image I is read from the gain adjustment unit 16, and when the read gain value is equal to or greater than a predetermined value, the environment in which the image I is captured is nighttime.
- the image I is binarized by applying a threshold value for detecting the headlamp image of the following vehicle.
- the gain value of the image I is less than the predetermined value, it is determined that the environment in which the image I was captured is daytime, and a threshold value for detecting a reflected image of sunlight is applied to apply the binary value of the image I. To do.
- the image shown in FIG. 10C is obtained by this binarization and labeling process.
- step S23 it is determined whether or not there is a headlamp image or a reflected sunlight image in the image labeled in step S22.
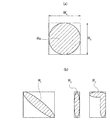
- the process performed here is demonstrated using FIG. 12 (a), (b).
- the image of the headlight of the following vehicle traveling the same lane Y 2 with the vehicle 5 will substantially circular shape as in the region R 0 shown in Figure 12 (a). Therefore, the area of each region subjected to the labeling process is predetermined with respect to the area H 0 W 0 of the rectangular region (vertical pixel number H 0 , horizontal pixel number W 0 ) circumscribing the region.
- To determine whether the image is a headlamp image by determining that the occupancy is equal to or greater than the ratio and that the width and height of the rectangle circumscribing the region do not differ by a predetermined ratio or more. it can.
- the occupancy threshold representing the shape of the image is similar to the image of the headlamp.
- the threshold value of the aspect ratio of the circumscribed rectangle is digitized, and it is determined whether or not the actually detected area satisfies the condition.
- regions having shapes such as regions R 1 , R 2 , and R 3 shown in FIG. 12B are determined not to be images of headlamps or reflected images of sunlight, and are rejected.
- one region that satisfies the condition is selected.
- one region having the largest area is selected.
- fills conditions is not found (when step S23 is NO), it returns to a main routine (FIG. 7).
- step S24 the gravity center position G of the area selected in step S23 is calculated. If the coordinates of the centroid position G of the region are G (Gx, Gy), the horizontal position Gx of the centroid position G is calculated by dividing the sum of the horizontal coordinates of all the pixels constituting the region by the area of the region. The vertical position Gy of the center of gravity position G is calculated by dividing the sum of the vertical coordinates of all the pixels constituting the region by the area of the region.
- a search start point O for calculating the luminance gradient g and a search direction (line) for calculating the luminance gradient are set in the reduced image I '.
- the search start point O and the line are positions that are not easily affected by the splash that the own vehicle 5 rolls up, the road surface reflection of the headlight of the following vehicle, the headlight of the vehicle traveling in the adjacent lane, The direction may be determined and set by experiment or the like.
- FIG. 13 is a diagram for explaining an example of setting the lines OP and OQ for calculating the luminance gradient and an example of the luminance gradient calculated for the lines OP and OQ.
- Oy is obtained by (Equation 1), where Oy is the vertical coordinate of the search start point O, and Jy is the vertical coordinate of the uppermost point J in the region R0 .
- Oy Jy + (Gy ⁇ Jy) / Th y (Formula 1)
- Th y a value larger than 0 is set as the threshold Th y .
- Th y the value of the threshold value Th y is set based on experiments or the like.
- lines that pass through the search start point O and are parallel to the horizontal line that passes through the center of gravity G of the region R0 are set as a line OP and a line OQ.
- step S26 the luminance value stored in the reduced image I ′ is read from the search start point O toward the point P on the line OP to calculate the luminance distribution Ld, and further on the line OQ.
- the luminance value stored in the reduced image I ′ is read to calculate the luminance distribution Ld.
- the luminance distribution Ld calculated in this way is as shown in the graph in FIG.
- the luminance distribution on the line OP and the luminance distribution on the line OQ are shown in one graph.
- step S27 the sizes of the left and right bases of the luminance distribution Ld are obtained.
- a threshold value A of luminance value and a threshold value B of luminance value smaller than A are prepared in advance, and the previously created luminance distribution Ld is searched from the search start point O toward the point P in the left direction. Then, as shown in FIG. 13, the interval between the position where the luminance value falls below the threshold A and the position where the luminance value falls below the threshold B is calculated as the number Lw of pixels in the left-right direction.
- the search is performed in the right direction from the search start point O toward the point Q, and the interval between the position where the luminance value is lower than the threshold value A and the position where the luminance value is lower than the threshold value B is calculated as the left-right direction pixel number Rw. .
- step S29 it is determined whether or not D I / Lw and ⁇ D I / Rw, which are the left and right luminance gradients g in the region R 0 , are symmetrical.
- the gap G I of brightness gradient g calculated by the equation (2) is carried out by confirming whether a predetermined threshold value or less Th G.
- G I (
- step S30 the degree of white turbidity U1 of the lens 12 is calculated.
- the degree of white turbidity U1 is calculated as an average value of absolute values of D I / Lw and ⁇ D I / Rw, which are the left and right luminance gradients g, as shown in (Equation 3).
- U1 ⁇ (Lw / D I ) + (Rw / D I ) ⁇ / 2 (Formula 3)
- the reciprocal of the luminance gradient g is averaged, so that the higher the degree of white turbidity of the lens 12 (the more dirty it is), the greater the value of U1. .
- step S31 a region R 0 of the previously detected, whether the same as the region R 0 detected in the processing of one time before the, i.e., whether considered image is from the same source Determined.
- This determination is performed by comparing the average value Ave (U1) of the white turbidity degree U1 calculated by the past processing with the latest white turbidity degree U1 calculated by (Equation 3). When the difference between the value Ave (U1) and the latest degree of white turbidity U1 is small, it is determined that the region is an image formed by the same light source.
- Th LOW ⁇ U1 / Ave (U1) ⁇ Th HIGH (Formula 4)
- Th LOW is a minimum threshold value for determining an image by the same light source
- Th HIGH is a maximum threshold value for determining an image by the same light source.
- step S32 If it is determined in step S31 that the images are from the same light source, next, in step S32, the total number of times T indicating that images that can be regarded as being from the same light source have been continuously detected is incremented, and the process proceeds to step S34. move on.
- the processing after step S32 is performed in the certainty factor determination unit 22d, and the value of the total number of times T incremented in step S32 is stored in the certainty factor determination unit 22d as needed.
- step S33 the total number of times T is decremented, and the process proceeds to step S35. Note that the value of the total count T decremented in step S33 is stored in the certainty factor determination unit 22d as needed.
- step S34 the degree of turbidity U1 previously calculated in step S30 is stored in the certainty factor determination unit 22d. Then, based on the average value Ave (U1) of the degree of white turbidity calculated by the past process and the degree of white turbidity U1 calculated previously, the average value Ave (U1) of the degree of white turbidity is recalculated and updated. The updated average value Ave (U1) of the degree of white turbidity is stored in the certainty factor determination unit 22d.
- step S35 the certainty factor F of the calculated degree of cloudiness is determined and updated.
- the certainty factor F is represented by the value of the total number of times T described above. Then, as the value of T is larger, that is, the degree of turbidity U1 calculated based on the brightness gradient of the images that are detected continuously and considered to be from the same light source, the certainty factor F is determined to be higher. The value of degree F is updated.
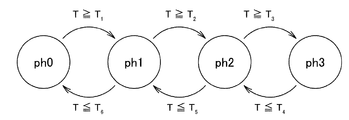
- the certainty factor F is managed by dividing it into four levels, namely, Ph0, Ph1, Ph2, and Ph3.
- Ph3 indicates the state with the highest certainty, that is, the calculated turbidity degree U1 indicates the most reliable state.
- the level of certainty factor F changes according to the value of T.
- the level of certainty factor F is Ph0, and when the value of the total number of times T indicating that images that can be regarded as being from the same light source are continuously detected exceeds a predetermined value T1, The level of certainty factor F shifts to Ph1. Thereafter, when the value of the total number of times T exceeds the predetermined value T2, the level of the certainty factor F shifts to Ph2, and when the value of the total number of times T exceeds the predetermined value T3, the level of the certainty factor F shifts to Ph3.
- the level of certainty factor F is Ph3
- the level of certainty factor F shifts to Ph2
- the value of the total number of times T is a predetermined value.
- the level of certainty factor F shifts to Ph1
- the level of certainty factor F shifts to Ph0.
- the predetermined value Tc 1 is added to the total number of times T when the certainty factor F transitions to a high level.
- the predetermined value Tc 2 may be subtracted from the total number of times T.
- the second turbidity degree calculation unit 24 calculates the turbidity degree U2 of the lens based on the edge intensity distribution from the image I captured by the imaging unit 10.
- the image I becomes unclear.
- the degree of unclearness increases as the degree of white turbidity increases.
- the degree of blur is calculated based on the distribution of the edge intensity in the image I.
- the edge intensity calculation unit 24a sets a region for edge detection in the image I imaged by the imaging unit 10.
- the region where edge detection is performed may be the entire image I or may be limited to a position where an edge is likely to appear.
- an area including the horizon behind the host vehicle 5 may be set, edge detection may be performed on the inside of this area, and the edge strength may be calculated based on the edge formed by the horizon.
- an area including the lanes Y 1 and Y 3 adjacent to the lane Y 2 on which the host vehicle 5 is traveling is set, edge detection is performed within the area, and other vehicles existing in the adjacent lane The edge strength may be calculated based on the six edges.
- the daytime and the nighttime can be identified based on the gain value adjusted by the gain adjusting unit 16 as described above.
- step S41 the edge strength calculation unit 24a operates the edge detection operator in the region set in step S40 to obtain the edge strength for each pixel in the image I.
- the coefficient of the edge detection filter used at this time is not particularly limited.
- step S42 the edge strength analysis unit 24b averages the edge strength values calculated for each pixel of the image I to calculate the average edge strength.
- the average edge strength is normalized by the area of the region where the edge is detected. It is determined that the smaller the average edge strength calculated in this way, the lower the sharpness of the image I, that is, the higher the degree of white turbidity. Further, it is determined that the higher the average edge strength is, the higher the sharpness of the image I, that is, the lower the degree of white turbidity.
- the average edge strength may be calculated not only from one image but also by averaging the average edge strength of a plurality of images taken at different times. As a result, even when sudden noise is mixed in the image I, the sharpness of the image I can be stably evaluated. At this time, the change in the average edge strength is obtained over a predetermined time, and when the change amount of the average edge strength is small, the calculated average edge strength, that is, the reliability of the degree of turbidity is described as high.
- the certainty factor F can be calculated.
- step S43 the degree of white turbidity U2 is calculated based on the average edge strength. Specifically, for example, the reciprocal of the normalized average edge intensity is calculated as the degree of turbidity U2.
- the adhesion degree calculation unit 26 the adhesion degree of deposits such as mud and water droplets attached to the lens 12 is calculated based on the edge strength in the image I and the distribution of luminance values.
- the adhesion degree of the deposit calculated by the adhesion degree calculation unit 26 is M.
- step S50 the processing area setting unit 26a reduces the image I captured by the imaging unit 10 at a predetermined ratio to obtain a reduced image I ′.
- the reason for reducing the image in this way is to reduce the amount of memory required for image processing by reducing the size of the image and to improve the processing speed.
- the specific reduction ratio is determined in consideration of the computer environment to be used, the resolution of the image, and the like. Then, an area for detecting the attached matter is set in the reduced image I ′.
- the reduced image I ′ generated here is described with the same sign as the reduced image I ′ generated in order to calculate the degree of white turbidity described above, but the reduction ratios thereof do not have to be the same value. What is necessary is just to reduce by the ratio according to an image.
- the entire area of the reduced image I ′ may be set as the area where the adhered object is detected, in this embodiment, the area including the vehicle detection area of the BSW system 9 which is the image recognition application to be used is defined as the processing target area. To do. By setting the processing target area in this way, the accuracy of the image recognition application can be improved, and the processing efficiency of the deposit detection process is also improved.
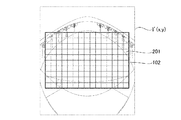
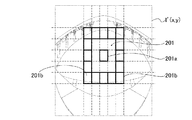
- step S50 the set processing target area is divided into a plurality of blocks 201 as shown in FIG.
- the subsequent processing is performed in units of blocks.
- the size of each block 201 is set to be equal to or smaller than the size of the deposit to be detected. By setting to such a size, only mud dirt can be detected reliably and efficiently.
- Information such as the coordinates of each block 201 divided in this way is stored in the processing area setting unit 26a in association with the block number assigned to each block.
- step S51 the edge detection unit 26b performs edge detection processing and noise removal for the edge detection result.
- the edge detection process is performed on the reduced image I ′ generated in step S50.
- This edge detection may be performed using a conventionally known method.
- threshold processing is performed on the edge strength obtained as a result of edge detection, and only necessary edge constituent points are extracted. That is, an edge image E (x, y) having only edge composing points (weak edge composing points) whose edge strength ⁇ has a value within a predetermined range is generated.
- FIG. 18B shows an example of the edge image E (x, y) generated in this way.
- FIG. 18B is an edge image E (x, y) obtained from the reduced image I ′ shown in FIG. 18A, and the mud dirt portion is detected as a weak edge.
- the density and color of the mud dirt when traveling on roads with poor road conditions, such as off-road, and the mud dirt when traveling on paved roads (on-road) may vary. Differently, the degree of weak edge strength can also be different. Also, the edge strength may vary depending on the type of deposit. Therefore, multiple thresholds for edge strength ⁇ are prepared according to the road surface condition, other traveling conditions, the type and status of the deposit, etc., and it is determined which threshold is used when executing the deposit detection process. May be.
- step S51 noise removal processing for removing noise existing in the generated edge image E (x, y) is further performed.
- an edge composing point that satisfies the following conditions is defined as noise.
- a logical product is taken to remove edge composing points that satisfy the condition (a) as noise. This is because the edge composing point desired to be detected in the adhering matter detection process is the edge of the adhering matter adhering to the lens 12, and the adhering matter adhering to the lens 12 is considered to continue to exist in the same place for a certain period of time. It is.
- edge composing points satisfying the condition (b) are removed as noise. This is because the dirt edge adhering to the lens 12 becomes a lump to some extent, and it is considered that an independent small edge is not dirt. By removing the noise as described above, it is possible to detect the lens deposit with high accuracy.
- step S52 a luminance distribution calculation process is performed in the luminance distribution calculator 26c.
- the average luminance value I ave (u, v) of the pixels in each block 201 is calculated.
- u and v represent the horizontal position and the vertical position of each block, respectively.
- the average luminance value I ave (u, v) the sum of the luminance values of the pixels in the block 201 is obtained for each block 201, and the obtained sum of the luminance values is the area (number of pixels) of the block 201. Calculated by dividing.
- step S53 based on the average luminance value I ave (u, v) of each block, the block of interest and the blocks around the block of interest (hereinafter referred to as surrounding blocks) are set.
- a block indicated by a thick line in FIG. 19 is the target block 201a.
- the target block 201a is selected from blocks having a low average luminance value. That is, the brightness value of the area where mud dirt is attached tends to be lower than the average brightness value of the area where mud dirt is not attached.
- a block located on the outer periphery of the block 201 adjacent to the target block 201a on the outer periphery of the target block 201a is selected. That is, since mud dirt is often attached not only to one block but also to its adjacent block, the average luminance value I ave (u, v) is not the same in the target block 201a and the adjacent block. This is because the difference is considered to be small. Therefore, the block outside the block adjacent to the target block 201a is selected as the surrounding block 201b.
- the setting method of the surrounding block 201b is not limited to this, When the adhesion area of a deposit
- step S54 the number of surrounding blocks 201b (bright surrounding blocks) having an average luminance value I ave (u, v) higher than the average luminance value I ave (u, v) of the target block 201a is counted. Also in this case, counting is performed using the luminance value before binarization. Next, the ratio of the bright surrounding blocks 201b (the number of bright surrounding blocks / the total number of surrounding blocks) is calculated. At this time, the ratio of the number of bright surrounding blocks is high for the block where the mud is present (the target block 201a).
- step S55 the number of pixels constituting a weak edge is counted from the edge image E (x, y) detected by the edge detection process.
- This weak edge count is performed using the binarized image.
- the mud dirt adhering to the lens 12 is not focused and has a blurred outline, and weak edges tend to exist as a lump. Therefore, in the adhering matter detection process of this embodiment, the number of weak edge composing points is counted for each block, and the count number is stored.
- step S56 it is determined whether or not a fixed time has passed. If the fixed time has passed, the process proceeds to step S57. If the fixed time has not passed, the process returns to step S50.
- Steps S50 to S55 by repeating Steps S50 to S55 a plurality of times within a predetermined time, information such as the average luminance value, the ratio of bright surrounding blocks, and the count number of weak edges is stored in time series.
- this predetermined time can be arbitrarily set according to the type of deposit, vehicle information such as the vehicle speed, and the like. For example, mud dirt frequently adheres during rainy weather or during off-road driving, so it is necessary to detect the mud dirt in a short time and to promptly warn. Therefore, it is preferable to set the predetermined time short.
- step S57 the luminance change calculation unit 26d performs luminance change extraction processing.
- the mud dirt adhering to the lens 12 is difficult to move over time and has low permeability, so that the luminance value in the time direction within the region has less fluctuation.
- the average value and variance in the time direction of the average luminance value I ave (u, v) of the same block are calculated.
- step S57 first, an average luminance value I ave (u, v) of the same block is averaged in the time direction, thereby calculating a time average luminance value E 0 for each block.
- the variance V of the average luminance value I ave (u, v) in the time direction is calculated for each block based on the calculated time average luminance value E 0 for each block.
- step S58 the adhering matter determination unit 26e performs mud stain determination.
- the mud dirt determination is performed by calculating a score representing mudiness for each block 201 based on the information described below.
- the adhesion rate of mud is low, and the score indicating mudiness is considered to be low.
- the score representing the mudiness of the block 201 is considered high.
- the variance of the average luminance value of the block 201 having a high score representing mudiness is equal to or less than a predetermined threshold value, it is considered that mud is likely to adhere to the block 201.
- mud likeness score of block 201 is at the threshold or more, yet, when the variance V of the temporal average brightness value E 0 of block 201 is below a predetermined threshold, block It is determined that 201 is muddy. And the adhesion degree M according to the score showing mudiness is calculated.
- step S58 the process returns to the main routine (FIG. 7). *
- the degree of contamination of the lens 12 is quantified based on the first degree of turbidity U1, the second degree of turbidity U2, and the degree of adhesion M calculated previously.
- the cloudiness degree U of the lens 12 is calculated based on the value of the first cloudiness degree U1 or the second cloudiness degree U2.
- the cloudiness degree U may be calculated based only on the first cloudiness degree U1
- the cloudiness degree U may be calculated based only on the second cloudiness degree U2
- the first cloudiness degree U1 The white turbidity degree U may be calculated using both the second turbidity degree U2.
- first turbidity degree U1 or the second turbidity degree U2 may be determined based on the environment in which those values are calculated or the certainty factor of the first and second turbidity degree U1 or U2. .
- the value of the gain adjusted by the gain adjusting unit 16 is monitored, and when the magnitude of the gain is equal to or greater than a predetermined value, that is, at night, the headlamp of the vehicle following the host vehicle 5 is Since the image is clearly formed, the value of the degree of white turbidity U may be calculated using the value of the first degree of turbidity U1 calculated therefrom.
- the first white turbidity degree U1 cannot be calculated based on the headlight image. Therefore, when the headlight image is not detected, the second white turbidity degree is not calculated. What is necessary is just to calculate the value of the degree of white turbidity U using the value of U2.
- the white turbidity degree is calculated using the value of the first white turbidity degree U1 calculated therefrom. What is necessary is just to calculate the value of U.
- the first cloudiness degree U1 cannot be calculated based on the reflected image of sunlight. Therefore, when the reflected image of sunlight is not detected, The value of the degree of white turbidity U may be calculated using the value of the degree of white turbidity U2.
- step S8 of FIG. 7 the vehicle detection sensitivity when the vehicle detection unit 70 detects the other vehicle 6 is corrected. This process is performed by the detection sensitivity adjustment unit 50.
- the detection sensitivity adjustment unit 50 corrects various threshold values used in vehicle detection performed by the vehicle detection unit 70 according to the value of the cloudiness degree U and the value of the adhesion degree M. Specific contents of the threshold will be described later.
- the threshold value is corrected in this way when the value of the degree of white turbidity U is large, that is, when the surface of the lens 12 is clouded, the sharpness of the image I picked up by the image pickup unit 10 decreases. For this reason, for example, when performing edge detection, the vehicle cannot be detected unless the threshold value for edge detection is corrected to a smaller value than when it is not clouded.
- the detection sensitivity adjustment unit 50 takes into account not only the value of the degree of white turbidity U but also the value of the degree of adhesion M, and even when the value of the degree of white turbidity U is large (the degree of white turbidity is high), When the value of is large, the correction amounts of various threshold values are suppressed. A specific method for correcting the threshold will be described later.
- step S ⁇ b> 60 various threshold values corrected based on the degree of contamination of the lens 12 (white turbidity degree U and adhesion degree M) in the detection sensitivity adjustment unit 50 are set in the approaching vehicle detection unit 72. Details of this processing will be described later.
- step S61 the viewpoint conversion unit 72a converts the image I captured by the imaging unit 10 into a virtual image looking down vertically from the sky.
- this conversion is referred to as viewpoint conversion
- a virtual image generated by viewpoint conversion is referred to as a viewpoint conversion image.
- This viewpoint conversion assumes that the road surface is reflected on the entire image I with respect to the image I including the road surface, which is captured by a camera installed at a position where the relative relationship with the road surface is known. This is done by transforming the coordinates so that they look down from directly above.
- the captured image I is converted into a viewpoint conversion image by using the principle that a vertical edge peculiar to a three-dimensional object is converted into a group of straight lines passing through a specific fixed point by the viewpoint conversion. It is for identifying. Note that the viewpoint-converted image converted by the viewpoint conversion is also used in detection of a three-dimensional object by edge information described later.
- step S62 the viewpoint conversion images obtained in the viewpoint conversion unit 72a are sequentially input to the alignment unit 72b, and the input viewpoint conversion images at different times are aligned.
- FIG. 20 is a diagram for explaining the outline of the processing performed by the alignment unit 72b.
- FIG. 20 (a) is a plan view showing the moving state of the host vehicle 5, and
- FIG. 20 (b) shows the outline of the alignment. ing.
- the host vehicle 5 is at the position V1 at the current time and that the host vehicle 5 is at the position V2 one hour ago. Further, the other vehicle 6 is located behind the lane adjacent to the lane in which the host vehicle 5 is traveling, the other vehicle 6 is at the position V3 at the current time, and one hour before the other vehicle 6 is at the position V4. Suppose that Furthermore, it is assumed that the host vehicle 5 has moved by a moving distance d at one time. Note that “one hour before” may be a past time for a predetermined time (for example, one control cycle) from the current time, or may be a past time for an arbitrary time.
- the viewpoint-converted image PB t at the current time is as shown in FIG.
- the white line drawn on the road surface is a rectangular shape, in the region of the other vehicle 6 tilting occurs at a position V3.
- the white line drawn on the road surface has a rectangular shape, but falls in the area of the other vehicle 6 at the position V4.
- the alignment unit 72b aligns the viewpoint converted image PB t and the viewpoint converted image PB t ⁇ 1 generated as described above. At this time, the alignment unit 72b offsets the viewpoint-converted image PB t-1 of the previous time by an amount corresponding to the distance traveled by the host vehicle 5 during the time of the current time, so that the viewpoint-converted image PB t at the current time is offset. The position is matched with t .
- the viewpoint-converted image PB t on the left side and the viewpoint-converted image PB t-1 at the center in FIG. 20B show a state where they are shifted by the offset amount d ′.
- This offset amount d ′ is a movement amount on the viewpoint conversion image corresponding to the actual movement distance d of the host vehicle 5 shown in FIG. 20A, and the vehicle speed of the host vehicle 5 obtained from the vehicle information acquisition unit 60. And based on the time from one hour before to the current time.
- step S63 after the alignment of the viewpoint conversion images PB t and PB t ⁇ 1 is performed, a difference is taken to generate a difference image PD t .
- the luminance value stored in the difference image PD t may be an absolute value of the difference between the luminance values of the corresponding pixels of the viewpoint conversion images PB t and PB t ⁇ 1 , or in order to cope with a change in the illuminance environment. It may be “1” when the absolute value exceeds the first threshold value p, and may be “0” when the absolute value does not exceed the first threshold value p.
- the image on the right side of FIG. 20B is the difference image PD t .
- the first threshold p is a value set in the approaching vehicle detection unit 72 in step S60 after being corrected in advance by the detection sensitivity adjustment unit 50. The correction method will be described later.
- the three-dimensional object detection unit 72c it detects a three-dimensional object on the basis of the difference image PD t shown in FIG. 20 (b). At this time, the three-dimensional object detection unit 72c also calculates the movement distance of the three-dimensional object.
- step S64 the three-dimensional object detection unit 72c generates a differential waveform DW t calculated based on the differential image PD t .
- the three-dimensional object detection unit 72c In generating the difference waveform DW t , the three-dimensional object detection unit 72c first sets a detection area of the three-dimensional object in the difference image PD t .
- the approaching vehicle detection unit 72 detects another vehicle 6 that travels in a lane adjacent to the lane in which the host vehicle 5 travels, which may be contacted when the host vehicle 5 changes lanes.
- two detection areas are set on the right side and the left side of the host vehicle 5 in the image I obtained by the imaging unit 10.
- rectangular detection areas X1 and X2 are set on the right side and the left side of the rear side of the host vehicle 5, respectively.
- region X1, X2 is detected as an approaching vehicle.
- detection areas X1 and X2 may be set from a relative position with respect to the host vehicle 5, or may be set based on the position of a white line on the road. When setting the position of the white line on the road as a reference, the position of the white line detected using, for example, an existing white line recognition technique is used as a reference.
- the three-dimensional object detection unit 72c recognizes the sides of the detection areas X1 and X2 on the own vehicle 5 side (sides along the traveling direction of the own vehicle 5) as the ground lines L1 and L2 illustrated in FIG.
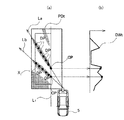
- FIG. 21 is a schematic diagram illustrating how the three-dimensional object detection unit 72c generates a differential waveform.
- the three-dimensional object detection unit 72c includes, from a portion corresponding to the inside of the detection regions X1 and X2 in the difference image PD t (right diagram in FIG. 20B) calculated by the alignment unit 72b.
- a differential waveform DW t is generated.
- the differential waveform DW t is generated along the direction in which the three-dimensional object falls due to the viewpoint conversion.
- description will be made using only the detection region X1, but the differential waveform DW t is also generated for the detection region X2 in the same procedure.
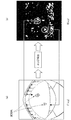
- Three-dimensional object detection unit 72c first, in the difference image PD t, shown in FIG. 21 (a), sets the line La along the direction in which the three-dimensional object collapses. Then, the number of pixels DP having a difference value greater than or equal to a predetermined value on the set line La is counted.
- a pixel DP having a difference value greater than or equal to a predetermined value hereinafter simply referred to as a pixel DP
- the luminance value (pixel value) of the difference image PD t is the luminance value of the viewpoint converted images PB t and PB t ⁇ 1 . Is a pixel exceeding the first threshold value p, and if the luminance value of the difference image PD t is expressed by “0”, “1”, “1” is set. It is a pixel to show.
- the three-dimensional object detection unit 72c calculates the intersection CP between the line La and the ground line L1 after counting the number of pixels DP having a difference value equal to or greater than the first threshold value p. Then, the intersection point CP is associated with the count number of the pixel DP, and the horizontal axis position, that is, the position on the vertical axis in FIG. 21B is determined based on the position of the intersection point CP, and the count number of the pixel DP. To the vertical axis position, that is, the position on the horizontal axis in FIG. 21B, and plotting is performed at the intersection of the horizontal axis position and the vertical axis position thus determined.
- the three-dimensional object detection unit 72c sets lines Lb, Lc,... Along the direction in which the three-dimensional object falls, counts the number of pixels DP, and based on the position of each intersection CP, FIG. The corresponding horizontal axis position is determined, the vertical axis position is determined from the count number of the pixel DP, and plotting is performed at that position. In this way, the differential waveform DW t shown in FIG. 21B is generated.
- the line La and the line Lb along the direction in which the three-dimensional object collapses have different distances across the detection region X1. For this reason, if the detection region X1 is filled with the pixels DP, the count number of the pixels DP is greater on the line La than on the line Lb. Therefore, when the three-dimensional object detection unit 72c determines the vertical axis position from the count number of the pixel DP, the distance that the lines La and Lb along the direction in which the three-dimensional object collapses crosses the detection region X1 is determined. Normalize based on.
- the three-dimensional object detection unit 72c performs normalization by dividing the count number by the crossing distance.
- step S65 the three-dimensional object detection unit 72c determines whether or not the peak of the differential waveform DW t generated in step S64 is equal to or greater than the second threshold value ⁇ .
- the second threshold value ⁇ is a value set in advance in the approaching vehicle detection unit 72 in step S60 after being corrected by the detection sensitivity adjustment unit 50 in advance. The correction method will be described later.
- step S65 when it is determined that the peak of the differential waveform DW t is not equal to or greater than the second threshold value ⁇ (when step S65 is NO), the process proceeds to step S74, and in step S74, there is no solid object, that is, no other vehicle 6 exists. 25, the vehicle detection process of FIG. 25 is terminated, and then the process returns to the main routine (FIG. 7).
- the three-dimensional object detection unit 72c determines that a three-dimensional object exists, and performing comparison between the differential waveform DW t-1 of the previous differential waveform DW t and a time instant, calculating a moving distance of the three-dimensional object.
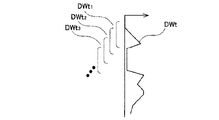
- step S66 the three-dimensional object detection unit 72c divides the differential waveform DW t into a plurality of small areas DW t1 to DW tn (n is an arbitrary integer equal to or greater than 2) as shown in FIG. .
- the small areas DW t1 to DW tn are divided so as to overlap each other as shown in FIG. That is, in FIG. 22, the small area DW t1 and the small area DW t2 overlap, and the small area DW t2 and the small area DW t3 overlap.
- step S68 the three-dimensional object detection unit 72c calculates an offset amount (amount of movement of the differential waveform in the horizontal axis direction (vertical direction in FIG. 21B)) for each of the divided small regions DW t1 to DW tn .
- the offset amount is determined from the difference between the one preceding time differential waveform DW t-1 and the current time difference waveform DW t (distance in the horizontal axis direction).
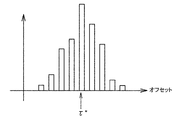
- step S69 the three-dimensional object detection unit 72c generates a histogram by counting the offset amount obtained for each of the small areas DW t1 to DW tn .
- the plurality of small areas DW t1 to DW tn may be weighted in advance, and the offset amount obtained for each of the small areas DW t1 to DW tn may be counted in accordance with the weight to form a histogram. .
- the weighting is reduced. This is because the flat small area DW ti has no features, and thus there is a high possibility that an error will increase in calculating the offset amount.
- the small area DW ti is rich in undulations, that is, when the difference between the maximum value and the minimum value of the count number of the pixel DP is large, the weighting is increased. This is because the small area DW ti rich in undulations has a characteristic, and therefore there is a high possibility that the offset amount can be accurately calculated. By weighting in this way, the calculation accuracy of the movement distance can be improved.
- FIG. 23 is a diagram illustrating an example of the histogram generated in step S69. As shown in FIG. 23, the offset amount at which the error between each of the small regions DW t1 to DW tn and the difference waveform DW t ⁇ 1 one time before is slightly varied.
- step S70 the three-dimensional object detection unit 72c calculates a relative movement distance ⁇ * , which is the movement distance of the three-dimensional object, based on the position where the maximum value of the histogram is given.
- the offset amount indicating the maximum value of the histogram is calculated as the relative movement distance ⁇ * .
- This relative movement distance ⁇ * is a relative movement distance of the other vehicle 6 with respect to the host vehicle 5.
- step S71 the three-dimensional object detection unit 72c calculates the absolute movement speed of the three-dimensional object from the relative movement distance.
- the relative movement distance is calculated by differentiating the relative movement distance with respect to time, and the own vehicle speed acquired by the vehicle information acquisition unit 60 is added to calculate the absolute movement speed.
- the differential waveform DW t is divided into a plurality of small areas DW t1 to DW tn as described above, but if the calculation accuracy of the movement distance is not so required, the small area DW There is no need to divide into t1 to DW tn .
- the three-dimensional object detection unit 72c calculates the movement distance from the offset amount of the difference waveform DW t when the error between the difference waveform DW t and the difference waveform DW t ⁇ 1 is minimized. That is, the method for obtaining the offset amount of the difference waveform DW t one time before the differential waveform DW t-1 and the current time is not limited to the above disclosure.
- step S72 the three-dimensional object detection unit 72c determines whether or not the absolute movement speed of the three-dimensional object is within a predetermined speed range.
- a predetermined value is used for the predetermined speed range.
- step S72 when the absolute moving speed of the three-dimensional object is not within the predetermined speed range (when step S72 is NO), the process proceeds to step S74, and in step S74, it is determined that the three-dimensional object, that is, the other vehicle 6 does not exist. Then, the vehicle detection process of FIG. 25 is terminated, and then the process returns to the main routine (FIG. 7).
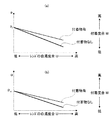
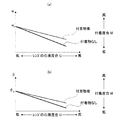
- FIG. 24A is a diagram for describing a correction method for the first threshold value p corresponding to the degree of contamination of the lens 12
- FIG. 24B is a correction of the second threshold value ⁇ corresponding to the degree of contamination of the lens 12. It is a figure explaining a method.
- the first threshold value p is set to a predetermined value p 0 in the detection sensitivity adjustment unit 50.
- the horizontal axis of FIG. 24A indicates the cloudiness degree U of the lens 12 calculated by the cloudiness degree calculation unit 25, and indicates that the cloudiness degree U increases as it goes to the right.
- the first threshold value p is corrected so as to decrease as the degree of white turbidity U increases. By correcting the first threshold value p to be small, the vehicle detection sensitivity is improved. At this time, the first threshold value p is further controlled so as to be reduced in accordance with the adhesion degree M of the deposit such as mud and water droplets on the lens 12 calculated by the adhesion degree calculation unit 26. It is corrected.
- the value of the first threshold value p corrected in this way is set in the approaching vehicle detection unit 72 and used for the vehicle detection process. Then, the vehicle detection process, when turbidity degree U of the lens 12 is high, by increasing the detection sensitivity, the smaller the difference value in the difference image PD t is detected, detects the point as a candidate for a three-dimensional object (another vehicle) Suruga, when the lens 12 has deposits, by suppressing the increase of the detection sensitivity, in the difference image PD t, a large difference value is not detected than before, to not be detected as a candidate of the three-dimensional object .
- the second threshold value ⁇ is also corrected by the same concept as the first threshold value p. That is, the second threshold value alpha, which is set to a predetermined value alpha 0 when no contamination of the lens 12 is, FIG as shown in 24 (b), mud and water droplets to the lens 12, which is calculated by the adhesion degree calculation unit 26 When the lens 12 has a high degree of white turbidity U, the detection sensitivity is increased and a small peak is detected in the differential waveform DW t .
- first threshold value p and the second threshold value ⁇ are linearly corrected in accordance with the height of the degree of white turbidity U.
- the method of correcting the two threshold value ⁇ is not limited to this. That is, for example, the first threshold value p and the second threshold value ⁇ may be corrected in a stepped manner (step shape) according to the height of the degree of white turbidity U.
- a vehicle detection sensitivity (first threshold value p and second threshold value ⁇ ) correction method may be set at night and daytime. That is, the amount of suppression of the vehicle detection sensitivity (the first threshold value p and the second threshold value ⁇ ) corresponding to the degree of white turbidity U of the lens 12 is reduced compared to the daytime at night, and the approaching vehicle is detected more reliably. You can also.
- the determination of nighttime and daytime is based on the gain value adjusted by the gain adjusting unit 16, and when the gain value is equal to or greater than a predetermined value, it is determined that it is nighttime, otherwise it is daytime. Can be determined.
- the relative speed of the approaching vehicle is calculated based on the detected absolute movement speed of the three-dimensional object (approaching vehicle) and the vehicle speed of the host vehicle 5, and the vehicle detection sensitivity (first speed) is determined according to the magnitude of the relative speed thus calculated.
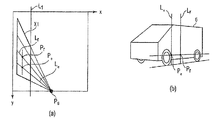
- FIG. 26 is a diagram illustrating an imaging range of the imaging unit 10, FIG. 26A is a plan view, and FIG. 26B is a perspective view in real space on the rear side of the host vehicle 5. . As illustrated in FIG. 26A, the imaging unit 10 captures a predetermined range ⁇ on the rear side of the host vehicle 5.
- the detection areas X1 and X2 of the present embodiment are trapezoidal in the viewpoint conversion image, and the positions, sizes, and shapes of these detection areas X1 and X2 are determined based on the distances d1 to d4.
- the detection regions X1 and X2 are not limited to the trapezoidal shape, and may be other shapes such as a rectangle in the viewpoint conversion image.
- the distance d1 is a distance from the own vehicle 5 to the ground lines L1 and L2.
- the ground lines L1 and L2 mean lines on which a three-dimensional object existing in the lane adjacent to the lane in which the host vehicle 5 travels contacts the ground.
- the purpose is to detect the other vehicle 6 traveling in the lane adjacent to the lane of the host vehicle 5 on the rear side of the host vehicle 5. Therefore, a distance d1 that is a position that becomes the ground lines L1, L2 of the other vehicle 6 from a distance d11 from the own vehicle 5 to the white line W and a distance d12 from the white line W to a position where the other vehicle 6 is predicted to travel. Can be determined in a substantially fixed manner.
- the distance d2 is a distance extending from the rear end of the host vehicle 5 in the vehicle traveling direction.
- the distance d2 is determined so that the detection areas X1 and X2 are at least within the shooting range of the imaging unit 10.
- the distance d3 is a distance indicating the length of the detection regions X1, X2 in the vehicle traveling direction. This distance d3 is determined based on the size of the three-dimensional object to be detected. In the present embodiment, since the detection target is the other vehicle 6, the distance d ⁇ b> 3 is set to a length including the other vehicle 6.
- the distance d4 is a distance indicating a height set so as to include tires of the other vehicle 6 or the like in the real space, as shown in FIG. 26 (b).
- the distance d4 is the length of the part shown in FIG.
- the distance d4 may be a length that does not include a lane that is further adjacent to the left and right adjacent lanes (that is, a lane that is adjacent to two lanes) in the viewpoint conversion image.
- the distances d1 to d4 are determined, and thereby the positions, sizes, and shapes of the detection areas X1 and X2 are determined. More specifically, the position of the upper side b1 of the trapezoidal detection areas X1, X2 is determined by the distance d1. The starting point position C1 of the upper side b1 is determined by the distance d2. The end point position C2 of the upper side b1 is determined by the distance d3. A side b2 on the side of the detection areas X1 and X2 forming a trapezoid is determined by a straight line L3 extending from the imaging unit 10 toward the start point position C1.
- a side b3 on the side of the detection areas X1 and X2 forming a trapezoid is determined by a straight line L4 extending from the imaging unit 10 toward the end point position C2.
- the position of the side b4 below the trapezoidal detection areas X1 and X2 is determined by the distance d4.
- the detection area X1 is a square (rectangular) in real space on the rear side of the host vehicle 5.
- the luminance difference calculation unit 72g shown in FIG. 6 calculates a luminance difference with respect to the viewpoint conversion image subjected to viewpoint conversion by the viewpoint conversion unit 72a in order to detect the edge of the three-dimensional object included in the viewpoint conversion image.
- the luminance difference calculation unit 72g calculates a luminance difference between two pixels in the vicinity of each position for each of a plurality of positions along the vertical imaginary line extending in the vertical direction in the real space.
- the luminance difference calculation unit 72g can calculate the luminance difference by either a method of setting only one vertical virtual line extending in the vertical direction in the real space or a method of setting two vertical virtual lines.
- the luminance difference calculation unit 72g generates a first vertical imaginary line corresponding to a line segment extending in the vertical direction in the real space and a line segment extending in the vertical direction in the real space unlike the first vertical imaginary line.
- the corresponding second vertical imaginary line is set.
- the luminance difference calculation unit 72g continuously obtains the luminance difference between the point on the first vertical imaginary line and the point on the second vertical imaginary line along the first vertical imaginary line and the second vertical imaginary line.
- the operation of the luminance difference calculation unit 72g will be described in detail.
- the luminance difference calculation unit 72g corresponds to a line segment extending in the vertical direction in the real space, and passes through the detection region X1 (hereinafter, the attention line Le). Set).
- the luminance difference calculation unit 72g corresponds to a line segment extending in the vertical direction in the real space and passes the second vertical virtual line Lr (hereinafter referred to as a reference line Lr) passing through the detection region X1.
- the reference line Lr is set at a position separated from the attention line Le by a predetermined distance in the real space.
- the line corresponding to the line segment extending in the vertical direction in the real space is a line that spreads radially from the position Ps of the imaging unit 10 in the viewpoint conversion image.
- the luminance difference calculation unit 72g sets a point of interest Pe (a point on the first vertical imaginary line) on the line of interest Le.
- the luminance difference calculation unit 72g sets a reference point Pr (a point on the second vertical plate line) on the reference line Lr.
- the attention line Le, the attention point Pe, the reference line Lr, and the reference point Pr have the relationship shown in FIG. 27B in the real space. That is, the attention line Le and the reference line Lr are lines extending in the vertical direction on the real space, and the attention point Pe and the reference point Pr are points at substantially the same height on the real space.
- the luminance difference calculation unit 72g calculates a luminance difference between the attention point Pe and the reference point Pr. If the luminance difference between the attention point Pe and the reference point Pr is large, it is considered that an edge exists between the attention point Pe and the reference point Pr. Therefore, the edge line detection unit 72h in FIG. 6 detects the edge line based on the luminance difference between the attention point Pe and the reference point Pr.
- FIG. 28 is a diagram illustrating detailed operations of the luminance difference calculation unit 72g.
- FIG. 28 (a) shows a viewpoint converted image
- FIG. 28 (b) shows a part B1 of the viewpoint converted image of FIG. 28 (a).
- the luminance difference calculation unit 72g first sets the reference line Lr.
- the reference line Lr is set along the vertical direction at a position away from the attention line Le by a predetermined distance in the real space.
- the reference line Lr is set at a position separated from the attention line Le by, for example, 10 cm in real space.
- the reference line Lr is set on the wheel of the tire of the other vehicle 6 that is separated from the rubber of the tire of the other vehicle 6 by 10 cm, for example, on the viewpoint conversion image.
- the luminance difference calculation unit 72g sets a plurality of attention points Pe1 to PeN on the attention line Le.
- attention point Pei when an arbitrary point is indicated
- the number of attention points Pe set on the attention line Le may be arbitrary.
- the luminance difference calculation unit 72g sets the reference points Pr1 to PrN so as to be the same height as the attention points Pe1 to PeN in the real space. Then, the luminance difference calculation unit 72g calculates the luminance difference between the attention point Pe and the reference point Pr having the same height. Thereby, the luminance difference calculation unit 72g calculates the luminance difference between the two pixels for each of a plurality of positions along the vertical imaginary line extending in the vertical direction in the real space.
- the luminance difference calculation unit 72g calculates, for example, a luminance difference between the first attention point Pe1 and the first reference point Pr1, and calculates a luminance difference between the second attention point Pe2 and the second reference point Pr2. Will be. Thereby, the brightness difference calculating unit 72g continuously obtains the brightness difference along the attention line Le and the reference line Lr.
- the luminance difference calculation unit 72g repeatedly executes the setting of the reference line Lr, the setting of the attention point Pe and the reference point Pr, and the calculation of the luminance difference while shifting the attention line Le in the detection region X1. That is, the luminance difference calculation unit 72g repeatedly executes the above processing while changing the positions of the attention line Le and the reference line Lr by the same distance in the extending direction of the ground line L1 in the real space. Then, for example, the luminance difference calculation unit 72g sets the line that has been the reference line Lr in the previous process as the attention line Le, sets the reference line Lr for the attention line Le, and sequentially obtains the luminance difference. It will follow.
- the edge line detection unit 72h detects an edge line from the continuous luminance difference calculated by the luminance difference calculation unit 72g.
- the luminance difference is small.
- the second to sixth attention points Pe2 to Pe6 are located in the rubber part of the tire, and the second to sixth reference points Pr2 to Pr6 are located in the wheel part of the tire. Therefore, the luminance difference between the second to sixth attention points Pe2 to Pe6 and the second to sixth reference points Pr2 to Pr6 increases. Therefore, the edge line detection unit 72h may detect that an edge line exists between the second to sixth attention points Pe2 to Pe6 and the second to sixth reference points Pr2 to Pr6 having a large luminance difference. it can.
- the edge line detection unit 72h when detecting the edge line, the edge line detection unit 72h first follows the three rules shown in (Expression 5) and the i-th attention point Pei (coordinates (xi, yi)) and the i-th reference. The attribute s is given to the i-th attention point Pei from the luminance difference with the point Pri (coordinates (xi ′, yi ′)).
- w represents the third threshold
- I (xi, yi) represents the luminance value of the i-th attention point Pei
- I (xi ′, yi ′) represents the luminance of the i-th reference point Pri.
- the attribute s (xi, yi) of the attention point Pei is “1”.
- the attribute s (xi, yi) of the attention point Pei is “ ⁇ 1”.
- the attribute s (xi, yi) of the point of interest Pei is “0”.
- the third threshold value w is a value set in the approaching vehicle detection unit 72 after being corrected by the detection sensitivity adjustment unit 50 in advance. The correction method will be described later.
- the edge line detection unit 72h calculates the continuity c (xi, yi) of the attribute s along the attention line Le based on the two rules shown in (Expression 6).
- s (xi, yi) s (xi + 1, yi + 1)
- c (xi, yi) 1
- c (xi, yi) 0 (Formula 6)
- the continuity c (xi, yi) is “1”.
- the attribute s (xi, yi) of the attention point Pei is not the same as the attribute s (xi + 1, yi + 1) of the adjacent attention point Pei + 1, the continuity c (xi, yi) is “0”.
- the edge line detection unit 72h obtains the sum of continuity c of all attention points Pe on the attention line Le.
- the edge line detection unit 72h normalizes the continuity c by dividing the total sum of the obtained continuity c by the total number N of the attention points Pe.
- the edge line detection unit 72h determines that the attention line Le is an edge line when the normalized continuity c exceeds the fourth threshold value ⁇ .
- the fourth threshold value ⁇ is a value set in the approaching vehicle detection unit 72 after being corrected by the detection sensitivity adjustment unit 50 in advance. The correction method will be described later.
- the edge line detection unit 72h determines whether or not the attention line Le is an edge line based on (Expression 7). Then, the edge line detection unit 72h determines whether or not all the attention lines Le drawn on the detection area X1 are edge lines. ⁇ c (xi, yi) / N> ⁇ (Formula 7)
- the three-dimensional object detection unit 72i detects a three-dimensional object based on the amount of edge lines detected by the edge line detection unit 72h.
- the approaching vehicle detection unit 72 detects an edge line extending in the vertical direction in the real space.
- the fact that many edge lines extending in the vertical direction are detected means that there is a high possibility that a three-dimensional object exists in the detection regions X1 and X2.
- the three-dimensional object detection unit 72i detects a three-dimensional object based on the amount of edges detected by the edge line detection unit 72h.
- the three-dimensional object detection unit 72i determines whether or not the edge line detected by the edge line detection unit 72h is correct.
- the three-dimensional object detection unit 72i determines whether or not the luminance change along the edge line of the viewpoint conversion image on the edge line is larger than a predetermined threshold value.
- a predetermined threshold value is a value set in advance by experiments or the like.
- FIG. 29 is a diagram showing the luminance distribution of the edge line
- FIG. 29A shows the edge line and luminance distribution when another vehicle 6 is present as a three-dimensional object in the detection area X1
- FIG. ) Shows an edge line and a luminance distribution when there is no solid object in the detection region X1.
- the attention line Le set in the tire rubber portion of the other vehicle 6 is determined to be an edge line in the viewpoint conversion image.
- the change in luminance of the viewpoint conversion image on the attention line Le is gentle. This is because the tire of the other vehicle 6 is extended in the viewpoint conversion image by the viewpoint conversion of the image I captured by the imaging unit 10.
- the attention line Le set in the white character portion “50” drawn on the road surface in the viewpoint conversion image is erroneously determined to be an edge line.
- the luminance change of the viewpoint conversion image on the attention line Le has a large undulation. This is because a portion with high brightness in white characters and a portion with low brightness such as a road surface are mixed on the edge line.
- the three-dimensional object detection unit 72i determines whether or not the edge line is detected by erroneous determination. When the change in luminance along the edge line is larger than a predetermined threshold, the three-dimensional object detection unit 72i determines that the edge line has been detected by erroneous determination. And the said edge line is not used for the detection of a solid object. This suppresses a decrease in the detection accuracy of the three-dimensional object due to white characters such as “50” on the road surface, weeds on the road shoulder, and the like being determined as edge lines.
- the three-dimensional object detection unit 72i calculates the luminance change of the edge line according to one of the following (Expression 8) and (Expression 9).
- the luminance change of the edge line corresponds to the evaluation value in the vertical direction in the real space.
- the following (Equation 8) shows the luminance distribution by the sum of the squares of the difference between the i-th luminance value I (xi, yi) on the attention line Le and the adjacent i + 1-th luminance value I (xi + 1, yi + 1). evaluate.
- the following (formula 9) is a luminance distribution according to the sum of absolute values of differences between the i-th luminance value I (xi, yi) on the attention line Le and the adjacent i + 1-th luminance value I (xi + 1, yi + 1).
- Evaluation value in the vertical equivalent direction ⁇ [ ⁇ I (xi, yi) ⁇ I (xi + 1, yi + 1) ⁇ 2 ]
- Evaluation value in the vertical equivalent direction ⁇
- the attribute b (xi, yi) of the attention point Pe (xi, yi) is “1”. . If the relationship is other than that, the attribute b (xi, yi) of the attention point Pei is “0”.
- This threshold value t2 is set in advance by an experiment or the like in order to determine that the attention line Le is not on the same three-dimensional object. Then, the three-dimensional object detection unit 72i sums up the attributes b for all the attention points Pe on the attention line Le, obtains an evaluation value in the vertical equivalent direction, and determines whether the edge line is correct.
- FIG. 30A is a diagram for describing a correction method of the third threshold value w according to the degree of contamination of the lens 12
- FIG. 30B is a correction of the fourth threshold value ⁇ according to the degree of contamination of the lens 12. It is a figure explaining a method.
- the third threshold value w is set in the detection sensitivity adjustment unit 50 to a predetermined value w 0.
- the horizontal axis of FIG. 30A indicates the cloudiness degree U of the lens 12 calculated by the cloudiness degree calculation unit 25, and indicates that the cloudiness degree U increases toward the right.
- the third threshold value w is corrected so as to decrease as the degree of white turbidity U increases.
- the vehicle detection sensitivity is improved.
- the degree of decrease of the third threshold w is further suppressed according to the degree of adhesion M of deposits such as mud and water droplets on the lens 12 calculated by the degree of adhesion calculation unit 26. It is corrected.
- the value of the third threshold value w corrected in this way is set in the approaching vehicle detection unit 72 and used for the vehicle detection process.
- the detection sensitivity is increased, and when a luminance difference is detected between the attention line Le and the reference line Lr set in the viewpoint conversion image, Although a point is detected as a candidate for a three-dimensional object (other vehicle), when there is an attachment on the lens 12, an improvement in detection sensitivity is suppressed, and a larger luminance difference between the attention line Le and the reference line Lr than before. Is not detected as a candidate for a three-dimensional object.
- the fourth threshold value ⁇ is also corrected by the same concept as the third threshold value w. That is, the fourth threshold value theta which is set to a predetermined value theta 0 when no contamination of the lens 12 is, FIG. 30 (b), the mud and water droplets to the lens 12, which is calculated by the adhesion degree calculation unit 26
- the attention line Le is determined to be an edge line.
- 30A and 30B show examples in which the third threshold value w and the fourth threshold value ⁇ are linearly corrected according to the height of the degree of white turbidity U, but the third threshold value w,
- the method for correcting the four threshold ⁇ is not limited to this. That is, for example, the third threshold value w and the fourth threshold value ⁇ may be corrected stepwise (step shape) according to the height of the degree of white turbidity U.
- FIG. 31 is a flowchart showing details of the three-dimensional object detection method according to this embodiment.
- processing for the detection area X1 will be described, but the same processing is executed for the detection area X2.
- step S80 the detection sensitivity adjusting unit 50 adjusts the third threshold value w and the fourth threshold value ⁇ corrected based on the degree of contamination of the lens 12 (white turbidity degree U and adhesion degree M). A value is set in the approaching vehicle detection unit 72.
- step S81 the viewpoint conversion unit 72a converts the image I picked up by the image pickup unit 10 into a viewpoint conversion image looked down vertically from the sky.
- step S82 the luminance difference calculation unit 72g sets the attention line Le inside the detection region X1. At this time, the luminance difference calculation unit 72g sets a line corresponding to a line extending in the vertical direction in the real space as the attention line Le.
- step S83 the luminance difference calculation unit 72g corresponds to a line segment extending in the vertical direction in the real space inside the detection area X1, and a line separated from the attention line Le by a predetermined distance in the real space. , Set as a reference line Lr.
- step S84 the luminance difference calculation unit 72g sets a plurality of attention points Pe on the attention line Le. At this time, the luminance difference calculation unit 72g sets the attention points Pe as many as not causing a problem when the edge is detected by the edge line detection unit 72h.
- step S85 the luminance difference calculation unit 72g sets the reference point Pr so that the attention point Pe and the reference point Pr are substantially the same height in the real space. Thereby, the attention point Pe and the reference point Pr are arranged in a substantially horizontal direction, and it becomes easy to detect an edge line extending in the vertical direction in the real space.
- step S86 the luminance difference calculation unit 72g calculates the luminance difference between the attention point Pe and the reference point Pr that have the same height in the real space. Then, the edge line detection unit 72h calculates the attribute s of each attention point Pe according to the above (Formula 5).
- step S87 the edge line detection unit 72h calculates the continuity c of the attribute s of each attention point Pe according to the above (formula 6).
- step S88 the edge line detection unit 72h determines whether or not the value obtained by normalizing the sum of continuity c is greater than the fourth threshold value ⁇ according to the above (Equation 7).
- the edge line detection unit 72h detects the attention line Le as an edge line in step S89. Then, the process proceeds to step S90.
- the edge line detection unit 72h does not detect the attention line Le as an edge line. The process proceeds to step S90.
- step S90 the approaching vehicle detection unit 72 determines whether or not the processing in steps S82 to S89 has been executed for all the attention lines Le that can be set on the detection region X1.
- the processing returns to Step S82, a new attention line Le is set, and the processing up to Step S89 is repeated.
- step S91 the process proceeds to step S91.
- step S91 the three-dimensional object detection unit 72i calculates a luminance change along the edge line for each edge line detected in step S89.
- the three-dimensional object detection unit 72i calculates the luminance change of the edge line according to any one of the above (Expression 8), (Expression 9), and (Expression 10).
- step S92 the three-dimensional object detection unit 72i excludes edge lines whose luminance change is larger than a predetermined threshold from the edge lines. That is, it is determined that an edge line having a large luminance change is not a correct edge line, and the edge line is not used for detecting a three-dimensional object.
- the predetermined threshold value is a value set based on a luminance change generated by characters on the road surface, weeds on the road shoulder, or the like obtained in advance by experiments or the like.
- the three-dimensional object detection unit 72i determines whether or not the amount of the edge line is equal to or greater than the fifth threshold value ⁇ .
- the fifth threshold value ⁇ is determined and set in advance by experiments or the like. For example, when a four-wheeled vehicle is set as a detection target, the fifth threshold value ⁇ is set based on the number of edge lines of the four-wheeled vehicle that have appeared in the detection region X1 in advance through experiments or the like.
- the three-dimensional object detection unit 72i determines that a three-dimensional object exists in the detection region X1 in Step S94.
- Step S93 determines that there is no three-dimensional object in the detection region X1. Thereafter, the process shown in FIG. 31 is terminated, and the process returns to the main routine (FIG. 7).
- the detected three-dimensional object may be determined to be another vehicle 6 that travels in the adjacent lane adjacent to the lane in which the host vehicle 5 travels, and the relative speed of the detected three-dimensional object with respect to the host vehicle 5 is considered. Then, it may be determined whether the vehicle 6 is traveling in the adjacent lane.
- a method for detecting a three-dimensional object (approaching vehicle) using differential waveform information and a method for detecting a three-dimensional object (approaching vehicle) using edge information have been described.
- the method of doing is not limited to that. That is, for example, without performing the viewpoint conversion described in the first embodiment, a three-dimensional object (approaching vehicle) is obtained by performing image processing such as calculating an optical flow on the image I captured by the imaging unit 10. It can also be detected. Also at this time, the detection sensitivity adjustment unit 50 sets the threshold for detecting the feature points from the time-series images and the threshold for determining that the feature points correspond to each other when the feature points are associated with each other. By correcting in accordance with the degree U and the degree M of attached matter, the other vehicle 6 can be reliably detected.
- the vehicle-mounted image recognition device 8 of the embodiment of the present invention configured as described above, it is installed in the host vehicle 5 and the surroundings of the host vehicle 5 are observed through the lens 12 and observed. Detection of a moving object existing around the host vehicle 5 with a predetermined detection sensitivity, for example, another vehicle 6, from an image captured by the imaging unit 10 that converts the optical signal around the subject vehicle 5 into an image signal Calculated by the adhesion degree calculation unit 26 in the detection sensitivity adjustment unit 50 that adjusts the detection sensitivity of the image recognition application execution unit that performs the detection, for example, the vehicle detection unit 70 in a direction to improve the detection sensitivity according to the height of the white turbidity degree U.
- a predetermined detection sensitivity for example, another vehicle 6
- the detection sensitivity adjustment unit 50 that adjusts the detection sensitivity of the image recognition application execution unit that performs the detection, for example, the vehicle detection unit 70 in a direction to improve the detection sensitivity according to the height of the white turbidity degree U.
- the cloudiness degree calculation unit 22 causes the cloudiness of the lens 12 to be determined by at least one of the luminance gradient and the edge intensity distribution of the image I captured by the imaging unit 10. Since the degree U is calculated, the cloudiness degree U of the lens 12 can be stably and reliably calculated regardless of the brightness outside the host vehicle 5.
- the detection sensitivity adjustment unit 50 increases as the adhesion degree M of mud, water droplets, etc., to the lens 12 calculated by the adhesion degree calculation unit 26 increases.
- the improvement of the detection sensitivity of the other vehicle 6 is suppressed even when it is determined that the degree of white turbidity U is high due to the high degree of adhesion M.
- the other vehicle 6 can be reliably detected by the image recognition application execution unit, for example, the vehicle detection unit 70.
- the detection sensitivity adjustment unit 50 detects pixels having a luminance difference from one image I captured by the imaging unit 10. 1 threshold p, a second threshold value ⁇ for detecting a pixel having a luminance change from time series images taken at different times by the imaging unit 10, or a time series image taken at different times by the imaging unit 10
- the vehicle detection unit 70 can detect the other vehicle 6 more reliably.
- the detection sensitivity adjustment unit 50 has a high turbidity degree U of the lens 12 and an adhesion degree M of deposits such as mud and water droplets on the lens 12. Occasionally, at least one of the thresholds is corrected to suppress an improvement in detection sensitivity at night compared to daytime. Therefore, at night, vehicle detection sensitivity (in accordance with the degree of turbidity U of the lens 12) For example, the amount of suppression of the first threshold value p and the second threshold value ⁇ ) can be reduced, and the other vehicle 6 can be detected more reliably.
- the image recognition application execution unit for example, the vehicle detection unit 70 is behind the host vehicle 5 and is close to the host vehicle 5. Since the vehicle 6 is detected, when the host vehicle 5 changes lanes, it is possible to reliably confirm the safety behind the vehicle.
- the detection sensitivity adjustment unit 50 has a high turbidity degree U of the lens 12 and an adhesion degree M of deposits such as mud and water droplets on the lens 12.
- the relative speed has a positive value greater than or equal to a predetermined value in order to suppress an improvement in detection sensitivity.
- the amount of suppression of the vehicle detection sensitivity for example, the first threshold value p and the second threshold value ⁇
- the approaching vehicle can be detected more reliably.
- the image recognition application that operates simultaneously with the in-vehicle image recognition device 8 is not limited to the BSW system 9. That is, the position of a lane marker such as a white line that moves in accordance with the travel position of the host vehicle 5 is detected from the image I captured by the imaging unit 10, and the lane marker position is detected based on the position of the lane marker thus detected. It is also possible to apply the present invention to an LDW (Lane Departure Warning) system that detects a deviation in advance and notifies the deviation and other systems.
- LDW LiDane Departure Warning
Abstract
Priority Applications (9)
| Application Number | Priority Date | Filing Date | Title |
|---|---|---|---|
| MX2015001004A MX341857B (es) | 2012-07-27 | 2013-07-19 | Reconocedor de imagenes en vehiculo. |
| RU2015106695/11A RU2573110C1 (ru) | 2012-07-27 | 2013-07-19 | Бортовое устройство распознавания изображений |
| CN201380039863.3A CN104509090B (zh) | 2012-07-27 | 2013-07-19 | 车载用图像识别装置 |
| EP13823445.5A EP2879370B1 (fr) | 2012-07-27 | 2013-07-19 | Dispositif de reconnaissance d'image monté a l'intérieur un véhicule |
| JP2014526897A JP6126094B2 (ja) | 2012-07-27 | 2013-07-19 | 車載用画像認識装置 |
| BR112015001872-6A BR112015001872B1 (pt) | 2012-07-27 | 2013-07-19 | Reconhecedor de imagem em veículos |
| US14/416,851 US9288381B2 (en) | 2012-07-27 | 2013-07-19 | In-vehicle image recognizer |
| IN489KON2015 IN2015KN00489A (fr) | 2012-07-27 | 2013-07-19 | |
| MYPI2015000197A MY184347A (en) | 2012-07-27 | 2013-07-19 | In-vehicle image recognizer |
Applications Claiming Priority (2)
| Application Number | Priority Date | Filing Date | Title |
|---|---|---|---|
| JP2012-167702 | 2012-07-27 | ||
| JP2012167702 | 2012-07-27 |
Publications (1)
| Publication Number | Publication Date |
|---|---|
| WO2014017403A1 true WO2014017403A1 (fr) | 2014-01-30 |
Family
ID=49997216
Family Applications (1)
| Application Number | Title | Priority Date | Filing Date |
|---|---|---|---|
| PCT/JP2013/069667 WO2014017403A1 (fr) | 2012-07-27 | 2013-07-19 | Dispositif de reconnaissance d'image monté dans un véhicule |
Country Status (10)
| Country | Link |
|---|---|
| US (1) | US9288381B2 (fr) |
| EP (1) | EP2879370B1 (fr) |
| JP (1) | JP6126094B2 (fr) |
| CN (1) | CN104509090B (fr) |
| BR (1) | BR112015001872B1 (fr) |
| IN (1) | IN2015KN00489A (fr) |
| MX (1) | MX341857B (fr) |
| MY (1) | MY184347A (fr) |
| RU (1) | RU2573110C1 (fr) |
| WO (1) | WO2014017403A1 (fr) |
Cited By (9)
| Publication number | Priority date | Publication date | Assignee | Title |
|---|---|---|---|---|
| WO2015008566A1 (fr) * | 2013-07-18 | 2015-01-22 | クラリオン株式会社 | Dispositif embarqué dans un véhicule |
| JP2016143089A (ja) * | 2015-01-29 | 2016-08-08 | 住友電気工業株式会社 | 危険車両検知システム及び車載情報処理装置 |
| JP2017191621A (ja) * | 2016-03-30 | 2017-10-19 | 日本電気株式会社 | 解析装置、解析方法及びプログラム |
| JP2018071994A (ja) * | 2016-10-24 | 2018-05-10 | 株式会社デンソーテン | 付着物検出装置および付着物検出方法 |
| JP2018160217A (ja) * | 2017-03-24 | 2018-10-11 | 株式会社Screenホールディングス | 画像処理方法および画像処理装置 |
| JP2019133333A (ja) * | 2018-01-30 | 2019-08-08 | 株式会社デンソーテン | 付着物検出装置および付着物検出方法 |
| JP2020108058A (ja) * | 2018-12-28 | 2020-07-09 | 株式会社デンソーテン | 付着物検出装置および付着物検出方法 |
| JP2020109541A (ja) * | 2018-12-28 | 2020-07-16 | 株式会社デンソーテン | 付着物検出装置および付着物検出方法 |
| JPWO2020196536A1 (fr) * | 2019-03-26 | 2020-10-01 |
Families Citing this family (29)
| Publication number | Priority date | Publication date | Assignee | Title |
|---|---|---|---|---|
| WO2014007175A1 (fr) * | 2012-07-03 | 2014-01-09 | クラリオン株式会社 | Dispositif de reconnaissance de l'environnement monté dans un véhicule |
| US9445057B2 (en) * | 2013-02-20 | 2016-09-13 | Magna Electronics Inc. | Vehicle vision system with dirt detection |
| JP6380843B2 (ja) * | 2013-12-19 | 2018-08-29 | 株式会社リコー | 物体検出装置及びこれを備えた移動体機器制御システム並びに物体検出用プログラム |
| EP3149656B1 (fr) * | 2014-05-27 | 2020-01-15 | Robert Bosch GmbH | Détection, identification et atténuation de contamination d'objectif pour des systèmes de caméra montés dans un véhicule |
| CN104299244B (zh) * | 2014-09-26 | 2017-07-25 | 东软集团股份有限公司 | 基于单目相机的障碍物检测方法及装置 |
| KR102263731B1 (ko) | 2014-11-11 | 2021-06-11 | 현대모비스 주식회사 | 주변차량의 위치정보 보정 시스템 및 방법 |
| KR101757263B1 (ko) * | 2015-07-08 | 2017-07-12 | 현대자동차주식회사 | 근거리 물체 감지 장치 및 방법과 이를 이용한 차량 |
| JP6644509B2 (ja) * | 2015-10-01 | 2020-02-12 | アルパイン株式会社 | 車両検知警報装置および車両検知警報方法 |
| SE541846C2 (en) | 2016-02-10 | 2019-12-27 | Scania Cv Ab | Method and control unit for rear view |
| WO2018021076A1 (fr) * | 2016-07-27 | 2018-02-01 | 京セラ株式会社 | Dispositif de détection, dispositif de capture d'image, corps mobile et procédé de détection |
| EP3306523A1 (fr) * | 2016-10-06 | 2018-04-11 | Continental Automotive GmbH | Dispositif de détermination d'une situation d'éblouissement provoquée par un écran transparent d'un véhicule |
| EP3306522A1 (fr) * | 2016-10-06 | 2018-04-11 | Continental Automotive GmbH | Dispositif permettant de déterminer une région d'intérêt sur et/ou intégrée à un pare-brise de véhicule |
| US11034295B2 (en) * | 2017-02-02 | 2021-06-15 | Magna Electronics Inc. | Vehicle vision system using at least two cameras |
| JP6832224B2 (ja) * | 2017-04-28 | 2021-02-24 | 株式会社デンソーテン | 付着物検出装置および付着物検出方法 |
| CN107317700B (zh) * | 2017-06-09 | 2020-06-30 | 湖北理工学院 | 车载边缘计算节点选择系统及方法 |
| JP6772113B2 (ja) * | 2017-08-02 | 2020-10-21 | クラリオン株式会社 | 付着物検出装置、および、それを備えた車両システム |
| JP6996200B2 (ja) * | 2017-09-29 | 2022-01-17 | 富士通株式会社 | 画像処理方法、画像処理装置、および画像処理プログラム |
| EP3483781B1 (fr) * | 2017-11-13 | 2021-10-06 | Continental Automotive GmbH | Dispositif pour détecter un blocage de pare-brise |
| US10691957B2 (en) * | 2018-02-12 | 2020-06-23 | ITS Plus, Inc. | Method for increasing the accuracy of traffic cameras using optical masking technology |
| JP7234630B2 (ja) * | 2018-12-28 | 2023-03-08 | 株式会社デンソーテン | 付着物検出装置 |
| US11257375B2 (en) * | 2018-12-31 | 2022-02-22 | Ficosa Adas, S.L.U. | Method and system for detecting objects in a vehicle blind spot |
| US10943129B2 (en) | 2019-01-04 | 2021-03-09 | Ford Global Technologies, Llc | Low-light sensor cleaning |
| CN111583169A (zh) * | 2019-01-30 | 2020-08-25 | 杭州海康威视数字技术股份有限公司 | 一种车载相机镜头的污染处理方法及系统 |
| CN113841188B (zh) * | 2019-05-13 | 2024-02-20 | 日本电信电话株式会社 | 交通流估计装置、交通流估计方法、存储介质 |
| JP7200894B2 (ja) * | 2019-09-20 | 2023-01-10 | 株式会社デンソーテン | 付着物検出装置および付着物検出方法 |
| JP7151675B2 (ja) * | 2019-09-20 | 2022-10-12 | 株式会社デンソーテン | 付着物検出装置および付着物検出方法 |
| GB2588655B (en) * | 2019-10-31 | 2022-08-17 | Jaguar Land Rover Ltd | Control system and method for a vehicle |
| CN111405177B (zh) * | 2020-03-09 | 2021-09-24 | Oppo广东移动通信有限公司 | 图像处理方法、终端及计算机可读存储介质 |
| CN111443490B (zh) * | 2020-04-15 | 2022-11-18 | 杭州赶梦科技有限公司 | 一种ar hud的虚像显示区域调节方法 |
Citations (5)
| Publication number | Priority date | Publication date | Assignee | Title |
|---|---|---|---|---|
| JP2001052185A (ja) * | 1999-08-13 | 2001-02-23 | Mitsubishi Precision Co Ltd | 車両検出方法および車両検出装置 |
| JP2003044863A (ja) * | 2001-07-30 | 2003-02-14 | Nissan Motor Co Ltd | 仕切線認識装置 |
| JP2004153422A (ja) * | 2002-10-29 | 2004-05-27 | Toshiba Corp | 撮影装置、顔照合装置、撮影装置の汚れ検知方法、及び顔照合方法 |
| JP2007318355A (ja) * | 2006-05-24 | 2007-12-06 | Matsushita Electric Ind Co Ltd | 撮像装置およびレンズ汚れ検出方法 |
| JP2012038048A (ja) | 2010-08-06 | 2012-02-23 | Alpine Electronics Inc | 車両用障害物検出装置 |
Family Cites Families (12)
| Publication number | Priority date | Publication date | Assignee | Title |
|---|---|---|---|---|
| JPS6369650U (fr) * | 1986-10-27 | 1988-05-11 | ||
| JP3734512B2 (ja) * | 1993-12-27 | 2006-01-11 | 株式会社メニコン | コンタクトレンズ外観検査方法および外観検査装置 |
| JP3651387B2 (ja) * | 2000-11-22 | 2005-05-25 | 日産自動車株式会社 | 白線検出装置 |
| JP3756452B2 (ja) * | 2002-01-18 | 2006-03-15 | 本田技研工業株式会社 | 赤外線画像処理装置 |
| JP3987048B2 (ja) * | 2003-03-20 | 2007-10-03 | 本田技研工業株式会社 | 車両周辺監視装置 |
| US7340767B2 (en) * | 2003-06-26 | 2008-03-04 | Matsushita Electric Industrial Co, Ltd. | Camera apparatus, image server and image server system |
| RU2286267C2 (ru) * | 2004-11-09 | 2006-10-27 | Аркадий Вениаминович Дубровский | Система зеркал транспортного средства |
| JP2008064630A (ja) * | 2006-09-07 | 2008-03-21 | Hitachi Ltd | 付着物検知機能付き車載用撮像装置 |
| EP2351351B1 (fr) * | 2008-10-01 | 2015-09-16 | Connaught Electronics Limited | Procédé et système de détection de la présence sur une lentille d'un dispositif de capture d'images d'une obstruction au passage de la lumière à travers la lentille du dispositif de capture d'images |
| KR101042302B1 (ko) * | 2010-12-27 | 2011-06-17 | 위재영 | 차량 외부 영상 장치용 하우징 |
| WO2014007153A1 (fr) * | 2012-07-03 | 2014-01-09 | クラリオン株式会社 | Dispositif de contrôle des environs d'un véhicule |
| JP6120395B2 (ja) * | 2012-07-03 | 2017-04-26 | クラリオン株式会社 | 車載装置 |
-
2013
- 2013-07-19 EP EP13823445.5A patent/EP2879370B1/fr active Active
- 2013-07-19 WO PCT/JP2013/069667 patent/WO2014017403A1/fr active Application Filing
- 2013-07-19 MX MX2015001004A patent/MX341857B/es active IP Right Grant
- 2013-07-19 JP JP2014526897A patent/JP6126094B2/ja active Active
- 2013-07-19 MY MYPI2015000197A patent/MY184347A/en unknown
- 2013-07-19 BR BR112015001872-6A patent/BR112015001872B1/pt active IP Right Grant
- 2013-07-19 US US14/416,851 patent/US9288381B2/en active Active
- 2013-07-19 RU RU2015106695/11A patent/RU2573110C1/ru active
- 2013-07-19 IN IN489KON2015 patent/IN2015KN00489A/en unknown
- 2013-07-19 CN CN201380039863.3A patent/CN104509090B/zh active Active
Patent Citations (5)
| Publication number | Priority date | Publication date | Assignee | Title |
|---|---|---|---|---|
| JP2001052185A (ja) * | 1999-08-13 | 2001-02-23 | Mitsubishi Precision Co Ltd | 車両検出方法および車両検出装置 |
| JP2003044863A (ja) * | 2001-07-30 | 2003-02-14 | Nissan Motor Co Ltd | 仕切線認識装置 |
| JP2004153422A (ja) * | 2002-10-29 | 2004-05-27 | Toshiba Corp | 撮影装置、顔照合装置、撮影装置の汚れ検知方法、及び顔照合方法 |
| JP2007318355A (ja) * | 2006-05-24 | 2007-12-06 | Matsushita Electric Ind Co Ltd | 撮像装置およびレンズ汚れ検出方法 |
| JP2012038048A (ja) | 2010-08-06 | 2012-02-23 | Alpine Electronics Inc | 車両用障害物検出装置 |
Non-Patent Citations (1)
| Title |
|---|
| See also references of EP2879370A4 |
Cited By (17)
| Publication number | Priority date | Publication date | Assignee | Title |
|---|---|---|---|---|
| US10095934B2 (en) | 2013-07-18 | 2018-10-09 | Clarion Co., Ltd. | In-vehicle device |
| WO2015008566A1 (fr) * | 2013-07-18 | 2015-01-22 | クラリオン株式会社 | Dispositif embarqué dans un véhicule |
| JP2016143089A (ja) * | 2015-01-29 | 2016-08-08 | 住友電気工業株式会社 | 危険車両検知システム及び車載情報処理装置 |
| US11176698B2 (en) | 2016-03-30 | 2021-11-16 | Nec Corporation | Analysis apparatus, analysis method, and storage medium |
| US11094076B2 (en) | 2016-03-30 | 2021-08-17 | Nec Corporation | Analysis apparatus, analysis method, and storage medium |
| JP2017191621A (ja) * | 2016-03-30 | 2017-10-19 | 日本電気株式会社 | 解析装置、解析方法及びプログラム |
| JP2018071994A (ja) * | 2016-10-24 | 2018-05-10 | 株式会社デンソーテン | 付着物検出装置および付着物検出方法 |
| JP2018160217A (ja) * | 2017-03-24 | 2018-10-11 | 株式会社Screenホールディングス | 画像処理方法および画像処理装置 |
| JP7112181B2 (ja) | 2017-03-24 | 2022-08-03 | 株式会社Screenホールディングス | 画像処理方法および画像処理装置 |
| JP2019133333A (ja) * | 2018-01-30 | 2019-08-08 | 株式会社デンソーテン | 付着物検出装置および付着物検出方法 |
| JP7210882B2 (ja) | 2018-01-30 | 2023-01-24 | 株式会社デンソーテン | 付着物検出装置および付着物検出方法 |
| JP2020108058A (ja) * | 2018-12-28 | 2020-07-09 | 株式会社デンソーテン | 付着物検出装置および付着物検出方法 |
| JP7163766B2 (ja) | 2018-12-28 | 2022-11-01 | 株式会社デンソーテン | 付着物検出装置および付着物検出方法 |
| JP2020109541A (ja) * | 2018-12-28 | 2020-07-16 | 株式会社デンソーテン | 付着物検出装置および付着物検出方法 |
| WO2020196536A1 (fr) * | 2019-03-26 | 2020-10-01 | 株式会社小糸製作所 | Système de photographie et dispositif de traitement d'image |
| JPWO2020196536A1 (fr) * | 2019-03-26 | 2020-10-01 | ||
| JP7426987B2 (ja) | 2019-03-26 | 2024-02-02 | 株式会社小糸製作所 | 撮影システムおよび画像処理装置 |
Also Published As
| Publication number | Publication date |
|---|---|
| MX2015001004A (es) | 2015-11-23 |
| MY184347A (en) | 2021-04-01 |
| CN104509090B (zh) | 2016-08-24 |
| US20150201120A1 (en) | 2015-07-16 |
| RU2573110C1 (ru) | 2016-01-20 |
| JP6126094B2 (ja) | 2017-05-10 |
| BR112015001872A2 (pt) | 2017-08-08 |
| EP2879370A4 (fr) | 2016-05-11 |
| EP2879370A1 (fr) | 2015-06-03 |
| US9288381B2 (en) | 2016-03-15 |
| BR112015001872B1 (pt) | 2021-11-03 |
| CN104509090A (zh) | 2015-04-08 |
| MX341857B (es) | 2016-09-05 |
| EP2879370B1 (fr) | 2020-09-02 |
| IN2015KN00489A (fr) | 2015-07-17 |
| JPWO2014017403A1 (ja) | 2016-07-11 |
Similar Documents
| Publication | Publication Date | Title |
|---|---|---|
| JP6126094B2 (ja) | 車載用画像認識装置 | |
| JP6174975B2 (ja) | 周囲環境認識装置 | |
| JP6117634B2 (ja) | レンズ付着物検知装置、レンズ付着物検知方法、および、車両システム | |
| JP5997276B2 (ja) | 立体物検出装置及び異物検出装置 | |
| RU2636120C2 (ru) | Устройство обнаружения трехмерных объектов | |
| US9892328B2 (en) | Hazard detection from a camera in a scene with moving shadows | |
| JP5896027B2 (ja) | 立体物検出装置及び立体物検出方法 | |
| US8436902B2 (en) | Method and system for weather condition detection with image-based road characterization | |
| JP5776795B2 (ja) | 立体物検出装置 | |
| RU2570892C9 (ru) | Устройство обнаружения трехмерных объектов и способ обнаружения трехмерных объектов | |
| JP5902049B2 (ja) | レンズ白濁状態診断装置 | |
| JP5743020B2 (ja) | 立体物検出装置 | |
| CN102156977A (zh) | 一种基于视觉的道路检测方法 | |
| JP6003986B2 (ja) | 立体物検出装置、立体物検出方法及び異物検出装置 | |
| KR20160108344A (ko) | 차량 검출 시스템 및 방법 | |
| JP5835459B2 (ja) | 立体物検出装置 | |
| JP6011110B2 (ja) | 立体物検出装置および立体物検出方法 | |
| JP6020568B2 (ja) | 立体物検出装置および立体物検出方法 | |
| Basu et al. | Night Time Vehicle Detection for Adaptive Beam and Collision Avoidance Systems |
Legal Events
| Date | Code | Title | Description |
|---|---|---|---|
| 121 | Ep: the epo has been informed by wipo that ep was designated in this application |
Ref document number: 13823445 Country of ref document: EP Kind code of ref document: A1 |
|
| ENP | Entry into the national phase |
Ref document number: 2014526897 Country of ref document: JP Kind code of ref document: A |
|
| WWE | Wipo information: entry into national phase |
Ref document number: MX/A/2015/001004 Country of ref document: MX |
|
| WWE | Wipo information: entry into national phase |
Ref document number: 14416851 Country of ref document: US |
|
| NENP | Non-entry into the national phase |
Ref country code: DE |
|
| WWE | Wipo information: entry into national phase |
Ref document number: 2013823445 Country of ref document: EP |
|
| ENP | Entry into the national phase |
Ref document number: 2015106695 Country of ref document: RU Kind code of ref document: A |
|
| REG | Reference to national code |
Ref country code: BR Ref legal event code: B01A Ref document number: 112015001872 Country of ref document: BR |
|
| ENP | Entry into the national phase |
Ref document number: 112015001872 Country of ref document: BR Kind code of ref document: A2 Effective date: 20150127 |