US9792706B2 - Graph processing system, graph processing method, and non-transitory computer readable medium - Google Patents
Graph processing system, graph processing method, and non-transitory computer readable medium Download PDFInfo
- Publication number
- US9792706B2 US9792706B2 US14/832,169 US201514832169A US9792706B2 US 9792706 B2 US9792706 B2 US 9792706B2 US 201514832169 A US201514832169 A US 201514832169A US 9792706 B2 US9792706 B2 US 9792706B2
- Authority
- US
- United States
- Prior art keywords
- graph
- segment
- record set
- elements
- record
- Prior art date
- Legal status (The legal status is an assumption and is not a legal conclusion. Google has not performed a legal analysis and makes no representation as to the accuracy of the status listed.)
- Active, expires
Links
Images


Classifications
-
- G—PHYSICS
- G06—COMPUTING; CALCULATING OR COUNTING
- G06T—IMAGE DATA PROCESSING OR GENERATION, IN GENERAL
- G06T11/00—2D [Two Dimensional] image generation
- G06T11/20—Drawing from basic elements, e.g. lines or circles
- G06T11/206—Drawing of charts or graphs
Definitions
- Embodiments described herein relate generally to a graph processing system, a graph processing method, and a non-transitory computer readable medium.
- a graph displaying device In order to visually represent a feature and a tendency of numerical data, in general, a graph displaying device is widely used.
- a graph is created based on the numerical data, and the graph is displayed on a display screen.
- a user can variously indicate a range of the numerical data and a shape of a graph used for creating the graph.
- a data amount handled by processing the big data is enormous. Accordingly, when a graph based on the numerical data is displayed, the user often wants to indicate a segment of specific numerical data, in order to display a graph in the segment.
- FIG. 1 is one example showing a display screen 100 of a graph processing system 1 according to a first embodiment.
- FIG. 2 is one example showing a segment graph according to conventional technique.
- FIG. 3 is a block diagram of the graph processing system 1 .
- FIG. 4 is a hardware component of an information processing terminal 2 and a server 3 in the information processing system 1 .
- FIG. 5 is a schematic diagram of functional blocks of the graph processing system 1 .
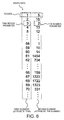
- FIG. 6 is one example of graph data stored in a storage unit 120 of the graph processing system 1 .
- FIG. 7 is a flow chart of processing of the graph processing system 1 .
- FIG. 8 is one example of a segment graph displayed according to a first modification of the first embodiment.
- FIG. 9 is one example of a first display screen 101 according to a third modification of the first embodiment.
- FIG. 10 is one example of a second display screen 102 according to the third modification of the first embodiment.
- FIG. 11 is one example showing a display screen 500 of a graph processing system 50 according to a second embodiment.
- FIG. 12 is a schematic diagram of functional blocks of the graph processing system 50 .
- FIG. 13 is one example of graph data stored in a storage unit 220 of the graph processing system 50 .
- FIG. 14 is one example of a segment graph displayed according to a first modification of the second embodiment.
- FIG. 15 is one example showing a display screen 600 of a graph processing system 60 according to a third embodiment.
- a graph processing system includes a specifying unit, a decision unit, and a generation unit.
- the specifying unit specifies a first record set corresponding to a first segment of first elements in graph data including a plurality of records. Each record has a first element and a second element.
- the decision unit analyzes the first record set on the basis of a predetermined rule, and determines at least one second record set corresponding to a second segment of first elements. The second segment is apart of the first segment.
- the generation unit generates a segment graph corresponding to the second record set.
- a graph can be created and displayed.
- the graph processing system is suitable for analyzing big data and displaying a graph which visualizes the analysis result.
- an indication of a segment (it is called “selection segment”) on which a user wants to focus is accepted from the user.
- graph data corresponding to the indicated selection segment is analyzed.
- this graph data is displayed as a final graph (it is called “segment graph”), graph data used for the segment graph is determined so as not to display crushed parts influenced by the range.
- a range of the graph is adjusted so as to include both a maximum and a minimum in graph data to be displayed. Accordingly, if an outlier exists in the graph data, a graph of a segment except for the outlier is displayed with crushed. Here, the outlier is a value largely shifted from other values in graph data of the indicated segment.
- graph data used for a segment graph is determined so as not to display crushed parts influenced by the range. Accordingly, a graph easy for the user to view can be displayed.
- FIG. 1 is one example showing a display screen 100 of the graph processing system 1 according to the first embodiment.
- a first display screen 101 and a second display screen 102 are displayed on the display screen 100 .
- the first display screen 101 and the second display screen 102 may be located at any position of the display screen 100 .
- the first display screen 101 displays an initial graph based on some graph data.
- the second display screen 102 displays a segment graph.
- a horizontal axis represents a first element in graph data
- a vertical axis represents a second element in the graph data (detail will be explained afterwards).
- a user may indicate a selection segment by using a mouse pointer and so on.
- FIG. 2 is one example of a segment graph displayed by the conventional graph display device. In this case, if an outlier is included in the selection segment, a graph except for the outlier is crushed, and the segment graph shown in FIG. 2 is displayed.
- a segment graph is corrected so that a segment crushed by influence of range is not displayed, and the corrected segment graph is displayed.
- the graph described in the first embodiment may be any graph can be created from graph data, for example, a scatter diagram, a pie graph, a bar graph, a line graph, an area graph, a Gantt chart, a box plot, a table, a correlation diagram, a heat map, a tree chart, a matrix map.
- FIG. 3 is a block diagram of the graph processing system 1 .
- the graph processing system 1 includes an information processing terminal 2 and a server 3 .
- the information processing terminal 2 and the server 3 are connected via a network 4 such as Internet.
- the information processing terminal 2 is a device operable by a user, for example, a personal computer (PC), a tablet PC, or a smart phone.
- the server 3 performs at least one part of processing to create a graph displayed on the information processing terminal 2 .
- the information processing terminal 2 and the server 3 are respectively drawn as one unit.
- the information processing terminal 2 and the server 3 may be respectively a plurality of units.
- FIG. 4 is one example of hardware component of the information processing terminal 2 and the server 3 .
- the information processing terminal 2 and the server 3 includes component used for regular computer, i.e., a CPU (Central Processing Unit) 5 , a ROM (Read Only Memory) 6 , a RAM (Random Access Memory) 7 , an input device 8 , an output device 9 , and a communication I/F 10 .
- the CPU 5 performs predetermined operation processing according to control program stored in the ROM 6 , by using the RAM 7 as working area.
- the input device 8 is a device to input information from the outside, for example, a keyboard, a mouse, or a touch panel.
- the output device 9 is a device to output information created at the inside to the outside, for example, a display.
- the communication I/F 10 is a device able to send/receive information with an external device via the network 4 .
- FIG. 5 is a functional block diagram of the graph processing system 1 .
- the graph processing system 1 includes an input device 11 , a processing device 12 , and a display device 13 .
- the input device 11 includes a selection unit 111 .
- the processing device 12 includes a storage unit 120 , a specifying unit 121 , a decision unit 122 , and a generation unit 123 .
- the display device 13 includes a display unit 131 .
- the information processing terminal 2 may include the input device 11 and the display device 13 .
- the server 3 may include the processing device 12 .
- the storage unit 120 stores graph data used for the initial graph and the segment graph.
- FIG. 6 is one example showing graph data stored in the storage unit 120 .
- the storage unit 120 stores graph data in which a first element and a second element are corresponded.
- the first element may include a plurality of time series-parameters of which attribute is time.
- the second element may include a plurality of the number-parameters of which attribute is the number. Namely, each element includes a plurality of parameters having common attribute.
- a pair of one time series-parameter and the number-parameter corresponding thereto is called a record.
- a pair of a time series-parameter “1” and the number-parameter “5” corresponding thereto is one record.
- graph data is represented as a set of records.
- the selection unit 111 selects a selection segment of arbitrary first element in the initial graph by the user's operation.
- the specifying unit 121 extracts graph data stored in the storage unit 120 , and specifies a set of records included in the selection segment as a first record set.
- the decision unit 122 analyzes the first record set, and determines a second record set corresponding to a segment (it is called “display segment”) to be displayed as a segment graph according to a predetermined rule.
- the generation unit 123 generates a segment graph corresponding to the second record set.
- the display unit 131 displays the segment graph.
- FIG. 7 is a flow chart of processing of the graph processing system 1 .
- the selection unit 111 selects a selection segment in the initial graph by a user's operation (S 101 ).
- the user may select a selection segment by using a mouse pointer.
- a segment of which the first element is “1” ⁇ “70” is selected as a selection segment.
- the specifying unit 121 extracts graph data stored in the storage unit 120 , and specifies a first record set corresponding to the selection segment (S 102 ).
- the specifying unit 121 specifies records of which the first element is “1” ⁇ “70” as a first record set.
- the decision unit 122 analyzes the first record set, and determines a second record set corresponding to the display segment according to a predetermined rule (S 103 ).
- the decision unit 122 analyzes the first record set according to a predetermined rule. If the first record set is displayed as a segment graph, the decision unit 122 decides whether crushed parts influenced by range are displayed in the segment graph. In the first embodiment, if it is decided that at least one crushed part is displayed, the decision unit 122 divides the first record set into a group corresponding to segments where crushed parts are displayed and a group corresponding to other segments. The decision unit 122 determines a group in which the number of records is the largest as a second record set.
- the decision unit 122 calculates a difference between two second elements adjacently positioned in alignment (arrangement) order of the first element.
- the difference is calculated as an absolute value.
- the decision unit 122 divides the first record set into each group having records of which differences (between two second elements adjacently positioned in alignment order of the first element) are continuously below a predetermined threshold. Among each group, the decision unit 122 determines a group of which the number of records is the largest, as a second record set.
- the predetermined threshold may be previously determined.
- the decision unit 122 divides the first record set into a group A having the first elements “1” ⁇ “60”, and a group B having the first elements “61” ⁇ “70”. Among each group, the decision unit 122 determines the group A of which the number of records is the largest, as a second record set.
- the decision unit 122 divides the first record set into each group having records of which differences (between two second elements adjacently positioned in alignment order of the first element) are continuously within predetermined maximum and minimum thresholds. Among each group, the decision unit 122 determines a group of which the number of records is the largest, as a second record set.
- the generation unit 123 generates a segment graph (corresponding to the second record set) of which axes are the first element and the second element (S 104 ).
- the second record set is the group A having the first elements “1” ⁇ “60”. Accordingly, the generation unit 123 generates a segment graph corresponding to the group A.
- the generation unit 123 may adjust a range of the segment graph so as to include data having maximum and data having minimum in the second record set.
- the display unit 131 displays the segment graph (S 105 ).
- the display unit 131 displays a segment graph shown in lower part of FIG. 1 .
- a first record set corresponding to the selection segment (indicated by the user) is analyzed.
- a segment graph is generated from a second record set having a part of segments of the first record set.
- the segment graph is displayed without crushing a segment for the user to actually focus on.
- the decision unit 122 divides the first record set into a group corresponding to segments where crushed parts are displayed and a group corresponding to other segments, and determines a group in which the number of records is the largest as a second record set.
- the division processing is not limited to this method.
- the decision unit 122 divides the first record set into each group having records of which differences (between two second elements adjacently positioned in alignment order of the first element) are continuously below a predetermined threshold.
- the decision unit 122 determines each group as a second record set respectively. Namely, in example of FIG. 6 , the group A having the first element “1” ⁇ “60” and the group B having the first element “61” ⁇ “70” are set to the second record set respectively.
- the generation unit 123 generates a segment graph corresponding to each second record set.
- the display unit 131 displays each segment graph.
- the generation unit 123 adjusts a range of each segment graph so as to include data having maximum and data having minimum.
- FIG. 8 is one example of the segment graph displayed according to the first modification.
- a second display screen 102 is only shown.
- the decision unit 122 may determine the second record set from the first record set. For example, based on an average or a standard deviation of the first elements of records included in the first record set, the predetermined rule may be determined. Furthermore, based on Smirnov-Grubbs test or Thompson test (already known), the predetermined rule may be determined.
- the selection unit 111 selects one selection segment in the initial graph. However, a plurality of selection segments may be selected.
- FIG. 9 is one example showing a first display screen 101 according to the third modification.
- the selection unit 111 selects two selection segments (a segment A and a segment B in FIG. 9 ) in the initial graph by the user's operation.
- processing from S 102 to S 105 is executed for each selection segment.
- FIG. 10 is one example showing a second display screen 102 according to the third modification.
- the display unit 131 displays a segment graph A corresponding to the selection segment A and a segment graph B corresponding to the selection segment B on the second display screen 102 respectively.
- the selection unit 111 selects a selection segment of the first element in the initial graph by the user's operation.
- a plurality of selection segments of the second element may be selected.
- the specifying unit 121 extracts graph data stored in the storage unit 120 , and specifies records included in both the selection segment of the first element and the selection segment of the second segment, as a first record set. Following processing from this specifying process is same as the first embodiment.
- FIG. 11 is one example showing a display screen 500 of a graph processing system 50 according to the second embodiment.
- each record included in graph data has three elements (the first element, the second element, and a third element), from the initial graph of which axes are the first element and the second element, a segment graph of which axes are the first element and the third element is generated.
- a segment graph representing time series-change of sales number of commodity corresponding to this selection segment is displayed.
- the second embodiment is suitable for this case.
- FIG. 12 is a functional block diagram of the graph processing system 50 .
- the processing device 12 in comparison with the graph processing system 1 , the processing device 12 is replaced with a processing device 22 , the storage unit 120 is replaced with a storage unit 220 , the decision unit 122 is replaced with a decision unit 222 , and the generation unit 123 is replaced with a generation unit 223 .
- FIG. 13 is one example of graph data stored in the storage unit 220 according to the second embodiment.
- the storage unit 220 stores graph data in which the first element, the second element and the third element are corresponded.
- the first element a plurality of time series-parameters of which attribute is time is included.
- the second element a plurality of the number of accesses-parameters of which attribute is the number of access times is included.
- the third element a plurality of the number-parameters of which attribute is the number is included. Namely, in the second embodiment, each record includes parameters of the first element, the second element and the third element.
- the initial graph is a graph of which horizontal axis is the first element and vertical axis is the second element.
- the segment graph is a graph of which horizontal axis is the first element and vertical axis is the third element.
- a flow chart of processing of the graph processing system 50 is same as the flow chart of the first embodiment shown in FIG. 7 .
- the selection unit 111 performs same processing of the first embodiment.
- a segment of which the first element is “1” ⁇ “70” is selected as a selection segment.
- the specifying unit 121 extracts graph data stored in the storage unit 220 , and specifies a first record set corresponding to the selection segment. In this example, among the graph data extracted, the specifying unit 121 specifies records having the first element “1” ⁇ “70” as a first record set.
- the decision unit 222 analyzes the first record set, and determines a second record set corresponding to a display segment according to a predetermined rule. In the second embodiment, among each record of the first record set, the decision unit 222 calculates a difference between two third elements adjacently positioned in alignment (arrangement) order of the first element. The decision unit 222 divides the first record set into each group having records of which differences (between two third elements adjacently positioned in alignment order of the first element) are continuously below a predetermined threshold. Among each group, the decision unit 222 determines a group of which the number of records is the largest, as a second record set.
- the generation unit 223 generates a segment graph (corresponding to the second record set) of which axes are the first element and the third element.
- the display unit 131 displays the segment graph generated.
- the first, second, third and fourth modifications of the first embodiment can be applied to the second embodiment.
- the selection unit 111 may select “1” ⁇ “70” as a selection segment of the first element and “1” ⁇ “1000” as a selection segment of the second element by the user's indication.
- the specifying unit 221 extracts graph data stored in the storage unit 220 , and specifies records included in both the selection segment of the first element and the selection segment of the second element as a first record set.
- the first record set is divided into each group having records of which differences (between two third elements adjacently positioned in alignment order of the first element) are continuously below a predetermined threshold.
- Each group is determined as a second record set respectively.
- FIG. 14 is one example showing a segment graph displayed by the display unit 131 according to the first modification.
- the second display screen 502 is only shown.
- FIG. 14 by displaying the segment graph generated by above-mentioned method, a segment on which the user actually wants to focus is displayed without crushing.
- the number of elements of each record included in graph data is three (the first element ⁇ the third element) was explained.
- the number of elements of each record is larger than or equal to four.
- following case is imagined.
- a horizontal axis is the first element and a vertical axis is the second element.
- a horizontal axis is the third element and a vertical axis is the fourth element.
- the decision unit 222 calculates a difference between two fourth elements adjacently positioned in alignment (arrangement) order of the third element corresponding to the horizontal axis of the segment graph.
- the decision unit 222 divides the first record set into each group having records of which differences (between two fourth elements adjacently positioned in alignment order of the third element) are continuously below a predetermined threshold.
- the decision unit 222 determines a group of which the number of records is the largest, as a second record set.
- graph data of the first embodiment data representing time series-transition of the sales number of some commodity was explained as an example.
- graph data of the second embodiment in an electronic commerce site that handles specific commodities on Internet, the sales number of the commodities and the number of access times in this site were explained as an example.
- the graph data are not limited to these examples.
- each element of the graph data of the third embodiment is related to the execution of software program.
- each element may be numerically represented such as the number of loop rotations, the number of calling times of function, the number of execution times of specific part of program, the number of execution times of hardware module, the number of execution cycles, the number of times of data access, the number of times of data writing access, the number of times of data reading access, the number of times of array access, the number of times of array writing access, the number of times of array reading access, the number of times of structure access, the number of times of structure writing access, the number of times of structure reading access, a value of variable, a value of array element, a value of structure element, the number of times of memory access, the number of times of memory writing access, the number of times of memory reading access, an elapsed time of processing, or a memory address.
- each element may be an ID specifying a part of software program such as
- FIG. 15 is one example showing a display screen 600 of the graph processing system according to the third embodiment.
- the first element is the number of times of memory access
- the second element is the number of execution cycles.
- a selection segment of each element is selected, a segment graph (Gantt chart) of which the third element is an elapsed time and the fourth element is a hardware module name is displayed.
- processing of the graph processing system 60 is same as that of the second embodiment.
- a graph easy for the user to view can be displayed.
- the processing can be performed by a computer program stored in a computer-readable medium.
- the computer readable medium may be, for example, a magnetic disk, a flexible disk, a hard disk, an optical disk (e.g., CD-ROM, CD-R, DVD), an optical magnetic disk (e.g., MD).
- any computer readable medium which is configured to store a computer program for causing a computer to perform the processing described above, may be used.
- OS operating system
- MW middle ware software
- the memory device is not limited to a device independent from the computer. By downloading a program transmitted through a LAN or the Internet, a memory device in which the program is stored is included. Furthermore, the memory device is not limited to one. In the case that the processing of the embodiments is executed by a plurality of memory devices, a plurality of memory devices may be included in the memory device.
- a computer may execute each processing stage of the embodiments according to the program stored in the memory device.
- the computer may be one apparatus such as a personal computer or a system in which a plurality of processing apparatuses are connected through a network.
- the computer is not limited to a personal computer.
- a computer includes a processing unit in an information processor, a microcomputer, and so on.
- the equipment and the apparatus that can execute the functions in embodiments using the program are generally called the computer.
Landscapes
- Physics & Mathematics (AREA)
- General Physics & Mathematics (AREA)
- Engineering & Computer Science (AREA)
- Theoretical Computer Science (AREA)
- User Interface Of Digital Computer (AREA)
- Information Retrieval, Db Structures And Fs Structures Therefor (AREA)
Applications Claiming Priority (2)
| Application Number | Priority Date | Filing Date | Title |
|---|---|---|---|
| JP2015-056977 | 2015-03-19 | ||
| JP2015056977A JP6397785B2 (ja) | 2015-03-19 | 2015-03-19 | グラフ処理システム、方法、及びプログラム |
Publications (2)
| Publication Number | Publication Date |
|---|---|
| US20160275707A1 US20160275707A1 (en) | 2016-09-22 |
| US9792706B2 true US9792706B2 (en) | 2017-10-17 |
Family
ID=56925467
Family Applications (1)
| Application Number | Title | Priority Date | Filing Date |
|---|---|---|---|
| US14/832,169 Active 2035-09-04 US9792706B2 (en) | 2015-03-19 | 2015-08-21 | Graph processing system, graph processing method, and non-transitory computer readable medium |
Country Status (2)
| Country | Link |
|---|---|
| US (1) | US9792706B2 (ja) |
| JP (1) | JP6397785B2 (ja) |
Cited By (1)
| Publication number | Priority date | Publication date | Assignee | Title |
|---|---|---|---|---|
| US20160358352A1 (en) * | 2015-06-02 | 2016-12-08 | Kabushiki Kaisha Toshiba | Information generation system, method, and computer program product |
Families Citing this family (2)
| Publication number | Priority date | Publication date | Assignee | Title |
|---|---|---|---|---|
| JP6511860B2 (ja) * | 2015-02-27 | 2019-05-15 | 富士通株式会社 | 表示制御システム、グラフ表示方法およびグラフ表示プログラム |
| US10109086B1 (en) * | 2016-01-25 | 2018-10-23 | Google Llc | Animated transitions between graphs |
Citations (5)
| Publication number | Priority date | Publication date | Assignee | Title |
|---|---|---|---|---|
| JPH03164969A (ja) | 1989-11-24 | 1991-07-16 | Matsushita Electric Ind Co Ltd | データ処理装置 |
| JPH04337880A (ja) | 1991-05-15 | 1992-11-25 | Hitachi Ltd | グラフ表示支援方法 |
| JP2009245128A (ja) | 2008-03-31 | 2009-10-22 | Dainippon Printing Co Ltd | 時系列データ用グラフ表示装置 |
| US20140173504A1 (en) | 2012-12-17 | 2014-06-19 | Microsoft Corporation | Scrollable user interface control |
| US20160275661A1 (en) * | 2015-03-17 | 2016-09-22 | International Business Machines Corporation | Data interpretation overlay mechanism |
Family Cites Families (5)
| Publication number | Priority date | Publication date | Assignee | Title |
|---|---|---|---|---|
| JPH09257522A (ja) * | 1996-03-26 | 1997-10-03 | Hitachi Ltd | グラフの表示領域を補正する情報処理装置 |
| JP2010015437A (ja) * | 2008-07-04 | 2010-01-21 | Dainippon Screen Mfg Co Ltd | グラフ描画装置、グラフ描画方法及びグラフ描画プログラム |
| JP2010153588A (ja) * | 2008-12-25 | 2010-07-08 | Fujitsu Semiconductor Ltd | データ解析プログラム、データ解析装置およびデータ解析方法 |
| JP5925583B2 (ja) * | 2012-04-27 | 2016-05-25 | 株式会社東芝 | トレンドグラフ表示システム |
| JP6171152B2 (ja) * | 2012-05-28 | 2017-08-02 | ピーアンドダブリューソリューションズ株式会社 | 情報処理装置、方法及びプログラム |
-
2015
- 2015-03-19 JP JP2015056977A patent/JP6397785B2/ja active Active
- 2015-08-21 US US14/832,169 patent/US9792706B2/en active Active
Patent Citations (5)
| Publication number | Priority date | Publication date | Assignee | Title |
|---|---|---|---|---|
| JPH03164969A (ja) | 1989-11-24 | 1991-07-16 | Matsushita Electric Ind Co Ltd | データ処理装置 |
| JPH04337880A (ja) | 1991-05-15 | 1992-11-25 | Hitachi Ltd | グラフ表示支援方法 |
| JP2009245128A (ja) | 2008-03-31 | 2009-10-22 | Dainippon Printing Co Ltd | 時系列データ用グラフ表示装置 |
| US20140173504A1 (en) | 2012-12-17 | 2014-06-19 | Microsoft Corporation | Scrollable user interface control |
| US20160275661A1 (en) * | 2015-03-17 | 2016-09-22 | International Business Machines Corporation | Data interpretation overlay mechanism |
Cited By (2)
| Publication number | Priority date | Publication date | Assignee | Title |
|---|---|---|---|---|
| US20160358352A1 (en) * | 2015-06-02 | 2016-12-08 | Kabushiki Kaisha Toshiba | Information generation system, method, and computer program product |
| US10861201B2 (en) * | 2015-06-02 | 2020-12-08 | Kabushiki Kaisha Toshiba | Information generation system, method, and computer program product |
Also Published As
| Publication number | Publication date |
|---|---|
| US20160275707A1 (en) | 2016-09-22 |
| JP2016177517A (ja) | 2016-10-06 |
| JP6397785B2 (ja) | 2018-09-26 |
Similar Documents
| Publication | Publication Date | Title |
|---|---|---|
| US11670021B1 (en) | Enhanced graphical user interface for representing events | |
| US9824469B2 (en) | Determining alternative visualizations for data based on an initial data visualization | |
| Conati et al. | Evaluating the impact of user characteristics and different layouts on an interactive visualization for decision making | |
| US9972105B2 (en) | Visualization of data clusters | |
| CN113011400A (zh) | 对数据的自动识别和洞察 | |
| US20170103214A1 (en) | Testing insecure computing environments using random data sets generated from characterizations of real data sets | |
| KR101773574B1 (ko) | 데이터 테이블의 차트 시각화 방법 | |
| CN103970527A (zh) | 为报表生成提供辅助覆盖的方法和系统 | |
| US9633081B1 (en) | Systems and methods for determining application installation likelihood based on user network characteristics | |
| US9792706B2 (en) | Graph processing system, graph processing method, and non-transitory computer readable medium | |
| Lee et al. | Spatiotemporal biosurveillance with spatial clusters: control limit approximation and impact of spatial correlation | |
| WO2015163322A1 (ja) | データ分析装置、データ分析方法およびプログラム | |
| US20180253677A1 (en) | Method for Performing Dynamic Data Analytics | |
| CN110168484B (zh) | 信息提示装置、信息提示方法及计算机可读取的存储介质 | |
| US8805809B2 (en) | Autotransform system | |
| JP2017151731A (ja) | 需要量予測プログラム、需要量予測方法、及び情報処理装置 | |
| US20140325457A1 (en) | Searching of line pattern representations using gestures | |
| TW201619852A (zh) | 用於感知情境並推薦資訊之電子計算裝置、其方法及其電腦程式產品 | |
| JP2014238666A (ja) | 予測式生成方法、予測式生成装置、及び、予測式生成プログラム | |
| JP2014186573A (ja) | オブジェクト分類方法、装置及びプログラム。 | |
| Hia et al. | Robustness of Support Vector Regression and Random Forest Models: A Simulation Study | |
| JP2018180711A (ja) | テストケースを選択する計算機及びテストケースの選択方法 | |
| JP5417359B2 (ja) | 文書評価支援システム、及び文書評価支援方法 | |
| JP6875633B2 (ja) | 提示プログラム、提示方法、および提示装置 | |
| Dong et al. | A modified combined p-value multiple test |
Legal Events
| Date | Code | Title | Description |
|---|---|---|---|
| AS | Assignment |
Owner name: KABUSHIKI KAISHA TOSHIBA, JAPAN Free format text: ASSIGNMENT OF ASSIGNORS INTEREST;ASSIGNORS:KURODA, AKIRA;MATSUZAKI, HIDENORI;TOJO, NOBUAKI;AND OTHERS;REEL/FRAME:036390/0529 Effective date: 20150806 |
|
| STCF | Information on status: patent grant |
Free format text: PATENTED CASE |
|
| MAFP | Maintenance fee payment |
Free format text: PAYMENT OF MAINTENANCE FEE, 4TH YEAR, LARGE ENTITY (ORIGINAL EVENT CODE: M1551); ENTITY STATUS OF PATENT OWNER: LARGE ENTITY Year of fee payment: 4 |