EP4535104A1 - Anomaliedetektionsvorrichtung, anomaliedetektionsverfahren und programm - Google Patents
Anomaliedetektionsvorrichtung, anomaliedetektionsverfahren und programm Download PDFInfo
- Publication number
- EP4535104A1 EP4535104A1 EP23815688.9A EP23815688A EP4535104A1 EP 4535104 A1 EP4535104 A1 EP 4535104A1 EP 23815688 A EP23815688 A EP 23815688A EP 4535104 A1 EP4535104 A1 EP 4535104A1
- Authority
- EP
- European Patent Office
- Prior art keywords
- variables
- unit
- values
- target
- standard
- Prior art date
- Legal status (The legal status is an assumption and is not a legal conclusion. Google has not performed a legal analysis and makes no representation as to the accuracy of the status listed.)
- Pending
Links
Images


Classifications
-
- G—PHYSICS
- G05—CONTROLLING; REGULATING
- G05B—CONTROL OR REGULATING SYSTEMS IN GENERAL; FUNCTIONAL ELEMENTS OF SUCH SYSTEMS; MONITORING OR TESTING ARRANGEMENTS FOR SUCH SYSTEMS OR ELEMENTS
- G05B19/00—Program-control systems
- G05B19/02—Program-control systems electric
- G05B19/418—Total factory control, i.e. centrally controlling a plurality of machines, e.g. direct or distributed numerical control [DNC], flexible manufacturing systems [FMS], integrated manufacturing systems [IMS] or computer integrated manufacturing [CIM]
- G05B19/4184—Total factory control, i.e. centrally controlling a plurality of machines, e.g. direct or distributed numerical control [DNC], flexible manufacturing systems [FMS], integrated manufacturing systems [IMS] or computer integrated manufacturing [CIM] characterised by fault tolerance, reliability of production system
-
- G—PHYSICS
- G05—CONTROLLING; REGULATING
- G05B—CONTROL OR REGULATING SYSTEMS IN GENERAL; FUNCTIONAL ELEMENTS OF SUCH SYSTEMS; MONITORING OR TESTING ARRANGEMENTS FOR SUCH SYSTEMS OR ELEMENTS
- G05B23/00—Testing or monitoring of control systems or parts thereof
- G05B23/02—Electric testing or monitoring
- G05B23/0205—Electric testing or monitoring by means of a monitoring system capable of detecting and responding to faults
- G05B23/0218—Electric testing or monitoring by means of a monitoring system capable of detecting and responding to faults characterised by the fault detection method dealing with either existing or incipient faults
- G05B23/0224—Process history based detection method, e.g. whereby history implies the availability of large amounts of data
- G05B23/024—Quantitative history assessment, e.g. mathematical relationships between available data; Functions therefor; Principal component analysis [PCA]; Partial least square [PLS]; Statistical classifiers, e.g. Bayesian networks, linear regression or correlation analysis; Neural networks
-
- G—PHYSICS
- G05—CONTROLLING; REGULATING
- G05B—CONTROL OR REGULATING SYSTEMS IN GENERAL; FUNCTIONAL ELEMENTS OF SUCH SYSTEMS; MONITORING OR TESTING ARRANGEMENTS FOR SUCH SYSTEMS OR ELEMENTS
- G05B2219/00—Program-control systems
- G05B2219/30—Nc systems
- G05B2219/31—From computer integrated manufacturing till monitoring
- G05B2219/31455—Monitor process status
-
- G—PHYSICS
- G05—CONTROLLING; REGULATING
- G05B—CONTROL OR REGULATING SYSTEMS IN GENERAL; FUNCTIONAL ELEMENTS OF SUCH SYSTEMS; MONITORING OR TESTING ARRANGEMENTS FOR SUCH SYSTEMS OR ELEMENTS
- G05B2219/00—Program-control systems
- G05B2219/30—Nc systems
- G05B2219/32—Operator till task planning
- G05B2219/32191—Real time statistical process monitoring
-
- G—PHYSICS
- G05—CONTROLLING; REGULATING
- G05B—CONTROL OR REGULATING SYSTEMS IN GENERAL; FUNCTIONAL ELEMENTS OF SUCH SYSTEMS; MONITORING OR TESTING ARRANGEMENTS FOR SUCH SYSTEMS OR ELEMENTS
- G05B2219/00—Program-control systems
- G05B2219/30—Nc systems
- G05B2219/32—Operator till task planning
- G05B2219/32201—Build statistical model of past normal proces, compare with actual process
Definitions
- the user can narrow down an effective variable having a large degree of influence on the statistic among a plurality of effective variables based on the determined degree of influence. This allows the user to conduct measures such as maintenance for the target to be monitored and a review of a production plan at an early stage to adjust the effective variable narrowed down.
- the reference range is equal to or larger than threshold value TH. Therefore, a standard SN ratio departing from the reference range (that is, smaller than threshold value TH) means that production line 2 has some anomaly. The user can confirm the result of step (4) to easily confirm whether production line 2 has an anomaly.
- Fig. 2 is a diagram showing an example of the production line.
- Production line 2 shown in Fig. 2 includes a cutting step 21, a part shipping step 22, an assembly step 23, and a product shipping step 24.
- Cutting step 21 a piece of metal is cut to produce a metal part having a predetermined shape, for example.
- Cutting step 21 includes one or more cutting devices 21a, a timer 21b, and counters 21c and 21d.
- Assembly step 23 is provided with a sensor 23a to count for each unit time how many metal parts transported from cutting step 21 are still unassembled with parts to be assembled (hereinafter referred to as a "number in process").
- Sensor 23a is, for example, an image sensor, and counts a number in process by using an image acquired by imaging a tray on which any metal part is placed before a part to be assembled is assembled to the metal part.
- assembly step 23 is provided with a sensor 23b to count how many workers are deployed (hereinafter referred to as a “number of personnel (for the assembly step)”) for each unit time and a counter 23c to count how many products are manufactured (hereinafter referred to as a “yield (for the assembly step)”) in the unit time.
- Sensor 23b is, for example, an image sensor, and counts the number of personnel (for the assembly step) using an image acquired by imaging assembly step 23.
- Counter 23c is, for example, a limit switch provided on a conveyor belt on which a product is placed.
- product shipping step 24 a product is packaged and shipped.
- Storage 103 is typically a non-volatile magnetic storage device such as a hard disk drive.
- Storage 103 stores an anomaly detection program 131 and a simulation program 132 executed by processor 101.
- a variety of types of programs installed in storage 103 are distributed in a state of being stored in a memory card or the like.
- anomaly detection program 131 and simulation program 132 may be partially or entirely implemented as dedicated hardware circuitry.
- Fig. 5 is a diagram illustrating a process performed by the simulation unit.
- a virtual model 2M is created in advance according to production line 2.
- the virtual model responsively outputs values of a plurality of variables for each unit time, the plurality of variables indicating a status of production line 2, the values being acquired through a simulative operation of the virtual model of production line 2 in accordance with the production plan.
- Fig. 5 illustrates a process performed by the simulation unit.
- a virtual model 2M is created in advance according to production line 2.
- the virtual model receives a variety of types of data indicating a production plan
- the virtual model responsively outputs values of a plurality of variables for each unit time, the plurality of variables indicating a status of production line 2, the values being acquired through a simulative operation of the virtual model of production line 2 in accordance with the production plan.
- Virtual model 2M is a model predicated on that a device and a worker perform a standard work in each step. Accordingly, simulation unit 11 acquires values of the plurality of variables for each unit time (for example of 1 minute, 5 minutes, etc.) that are output from virtual model 2M as values (or standard values) of the plurality of variables acquired while production line 2 normally operates.
- Collection unit 12 illustrated in Fig. 4 collects from production line 2 actual values of the plurality of variables indicating the current status of production line 2 for each unit time (for example of 1 minute, 5 minutes, etc.). Specifically, collection unit 12 collects actual values of "cutting time”, “number of devices”, and “yield (for the cutting step)” for each unit time from timer 21b, counter 21c, and counter 21d, respectively, of cutting step 21. Collection unit 12 collects actual values of "AGV operation time”, “number of personnel (for the part shipping step)", and “yield (for the part shipping step)” for each unit time from timer 22c, sensor 22a, and counter 22d, respectively, of part shipping step 22. Collection unit 12 collects actual values of "number in process”, “number of personnel (for the assembly step)", and “yield (for the assembly step)” for each unit time from sensor 23a, sensor 23b, and counter 23c, respectively, of assembly step 23.
- Fig. 6 is a diagram illustrating a process performed by the calculation unit.
- Fig. 6 shows an example in which "cutting time”, “number of devices”, “yield (for the cutting step)", “AGV operation time”, “number of personnel (for the part shipping step)”, “yield (for the part shipping step)", “number in process”, “number of personnel (for the assembly step)", and “yield (for the assembly step)” are used as a plurality of variables.
- Calculation unit 13 calculates for each unit time a standard SN ratio of the actual values of the plurality of variables collected by collection unit 12 to the standard values of the plurality of variables calculated by simulation unit 11.
- Calculation unit 13 may cause display device 70 to display a graph 30 representing how the calculated standard SN ratio transitions. The user can confirm graph 30 to see how production line 2 transitions in status.
- Detection unit 14 illustrated in Fig. 4 uses the standard SN ratio calculated by calculation unit 13 to detect that production line 2 has an anomaly.
- the standard SN ratio is smaller for a larger degree of deviation between standard values and actual values for the plurality of variables. Accordingly, detection unit 14 detects that production line 2 has an anomaly in response to the standard SN ratio deviating from the reference range (that is, being smaller than threshold value TH). For example, in the case of graph 30 shown in Fig. 6 , detection unit 14 detects that production line 2 has an anomaly at a timing T, that is, when the standard SN ratio is smaller than threshold value TH. Detection unit 14 may cause display device 70 to display error notification in response to detecting that production line 2 has an anomaly. This ensures that the user can see that production line 2 has an anomaly.
- Xij is a value after a j-th explanatory variable for an i-th unit time is standardized.
- Standardization is a process of subtracting an average value of values of a variable indicated by a data set.
- ⁇ j represents an SN ratio for the j-th explanatory variable.
- SN ratio ⁇ j indicates linearity between the value of the j-th explanatory variable and the value of the objective variable, and represents accuracy of estimation of the value of the objective variable.
- ⁇ j represents a constant of proportionality for a simple regression.
- Mi is an estimated value after an objective variable for the i-th unit time is standardized.
- selection unit 15 uses a two-level orthogonal array to select from a plurality of variables an effective variable effective in improving estimated accuracy of an objective variable.
- Selection unit 15 selects the effective variable for example using a method described in Genichi TAGUCHI, "Objective Function and Generic Function (6) - Prediction by T Method", Quality Engineering, 2005, Vol. 13, No. 3, pp. 5-10 (NPL 2).
- an explanatory variable effective in improving accuracy of estimating an objective variable can be selected and an explanatory variable having a negative effect on (or reducing) accuracy of estimating the objective variable can be excluded.
- an effect when there is an interaction between items can be considered. Specifically, according to Genichi TAGUCHI, "Objective Function and Generic Function (6) - Prediction by T Method", Quality Engineering, 2005, Vol. 13, No. 3, pp.
- an orthogonal array is created to provide either one of two levels of using and not using for each of a plurality of explanatory variables (or items), and a total SN ratio is calculated for each row of the orthogonal array. Based on a total SN ratio when each item is used and that when it is not used, selection unit 15 determines the item's effect on estimating an objective variable and whether the item has a negative effect on estimating the objective variable. Based on the result of the determination, selection unit 15 selects an effective variable from the plurality of variables.
- Analysis unit 16 shown in Fig. 4 performs a principal component analysis (PCA) using an actual value of an effective variable and a standard SN ratio for each unit time.
- PCA principal component analysis
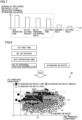
- Fig. 8 is a diagram illustrating an example of a result of the analysis by the analysis unit.
- Fig. 8 shows a result of the principal component analysis for "AGC operation time”, “number of devices”, “number of personnel (for shipping parts)”, “processing time”, and “standard SN ratio” for each unit time.
- Analysis unit 16 selects two principal components that maximize variance of the standard SN ratio. Specifically, analysis unit 16 selects a first principal component having a maximum contribution ratio and a second principal component having a second largest contribution ratio.
- analysis unit 16 causes display device 70 to display a biplot 40 of two selected principal components.
- Biplot 40 superimposes and thus displays principal component loadings on principal component scores.
- a form of displaying a point corresponding to principal component scores of two principal components acquired from data for each unit time differs depending on the value of the standard SN ratio.
- the standard SN ratios are separated in magnitude.
- the user can see which variable affects a decrease in the standard SN ratio. That is, the user can determine a variable corresponding to a vector of vectors v1 to v4 having a large component parallel to vector v0 as a variable affecting a decrease in the standard SN ratio. For example, in biplot 40 shown in Fig. 8 , the user can determine variables "AGV operation time" and "cutting time” corresponding to vectors v1 and v4, which are not orthogonal to the direction of vector v0 and are large in magnitude, as variables affecting a decrease in the standard SN ratio.
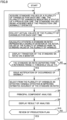
- Fig. 9 is a flowchart of an example of a flow of a process performed by the anomaly detection device.
- processor 101 of anomaly detection device 100 acquires standard values of a plurality of variables for each unit time, the plurality of variables indicating a status of production line 2, the standard values being acquired while production line 2 normally operates (step S1).
- processor 101 inputs production plan data to virtual model 2M to acquire, as the standard values, values of the plurality of variables for each unit time that are output from virtual model 2M.
- processor 101 collects actual values of the plurality of variables for each unit time from production line 2 (step S2).
- Processor 101 calculates for each unit time a standard SN ratio representing a degree of deviation of the actual values of the plurality of variables from the standard values of the plurality of variables (step S3).
- Processor 101 causes display device 70 to display graph 30 indicating how the standard SN ratio transitions (step S4).
- processor 101 performs a principal component analysis using an actual value of the effective variable and a standard SN ratio for each unit time (step S8).
- Processor 101 causes display device 70 to display a result of the principal component analysis (step S9).
- processor 101 causes display device 70 to display biplot 40 shown in Fig. 8 .
- processor 101 may determine a degree of influence of the effective variable on the standard SN ratio based on principal component loading in each of the effective variable and the standard SN ratio, and cause display device 70 to display the determined degree of influence.
- the user can narrow down a variable of a plurality of effective variables that has a large degree of influence on the standard SN ratio.
- the user can perform maintenance for production line 2 to adjust the variable narrowed down.
- the user performs maintenance for cutting device 21a in cutting step 21.
- the user may review the production plan.
- the user may adjust a number of workers deployed in assembly step 23, a number of cutting devices 21a operating in cutting step 21, etc.
- step S10 When the production plan is reviewed (YES in step S10), the process returns to step S1. As a result, the standard values of the plurality of variables for each unit time indicating a status of the production line are updated. When the production plan is not reviewed (NO in step S10), the process returns to step S2.
- Performance database 18 includes one or more data sets indicating values of a plurality of variables for each unit time, the values being acquired previously while production line 2 normally operates.
- step S10 is not performed, and the process returns to step S1 after step S9.
- a target to be monitored at a production site is production line 2.
- the target to be monitored is not limited to production line 2.
- the target to be monitored may be a manufacturing apparatus.
- anomaly detection device 100 calculates a statistic representing a degree of deviation of actual values of a plurality of variables from standard values of the plurality of variables for each unit time.
- anomaly detection device 100 may calculate the statistic for each unit interval.
- the unit interval is, for example, a period of time for which a target operation is performed by the manufacturing apparatus.
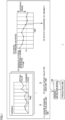
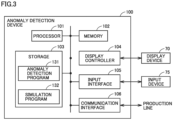
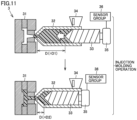
- Fig. 11 is a diagram showing an example of a manufacturing apparatus to be monitored.
- Fig. 11 shows an injection molding machine 3 as the manufacturing apparatus to be monitored.
- Injection molding machine 3 includes a mold 31, a cylinder 32, a screw 33, a hopper 34, a screw driving device 35, and a sensor group 36.
- Cylinder 32 is a cylindrical member and has an internal space fed with resin. Hopper 34 feeds resin into the internal space of cylinder 32. Screw 33 is inserted into the internal space of cylinder 32. Screw driving device 35 is connected to a proximal end portion of screw 33. Screw 33 rotates as controlled by screw driving device 35 and is movable in the longitudinal direction of cylinder 32. Sensor group 36 measures values of a variety of types of parameters indicating a status of injection molding machine 3.
- Injection molding machine 3 repeatedly performs an injection molding operation.
- the injection molding operation is an operation of injecting the resin accommodated in the internal space of cylinder 32 into mold 31 by moving screw 33 from a state shown in the upper portion of Fig. 11 to a state shown in the lower portion of the same figure.
- collection unit 12 acquires actual values of the plurality of variables indicating a status of injection molding machine 3 for each injection molding period.
- Collection unit 12 may acquire the actual values of the plurality of variables from sensor group 36, or may acquire the actual values of the plurality of variables from a control device (e.g., a PLC) (not shown) that controls injection molding machine 3.
- a control device e.g., a PLC
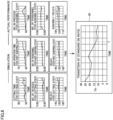
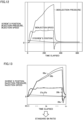
- Fig. 13 represents standard and actual values of the plurality of variables indicating statuses of injection molding machine 3.
- a line 37a represents standard values of the screw's position (n variables) at times t1, t2, ..., tn elapsing after the injection molding period starts.
- a line 38a represents standard values of injection pressure (n variables) at times t1, t2, ..., tn.
- a line 39a represents standard values of injection speed (n variables) at times t1, t2, ..., tn.
- a line 37b represents actual values of the screw's position (n variables) at times t1, t2, ..., tn elapsing after the injection molding period starts.
- a line 38b represents actual values of injection pressure (n variables) at times t1, t2, ..., tn.
- a line 39b represents actual values of injection speed (n variables) at times t1, t2, ..., tn.
- Chuck 44 holds a chip 42 having a bump 43 attached thereto.
- Drive device 45 controls generation of ultrasonic waves, upward/downward movement of chuck 44, and a force exerted by chuck 44 to hold chip 42.
- Sensor group 46 measures values of a variety of types of parameters indicating a status of mounter 4.
- drive device 45 lowers chuck 44 holding chip 42.
- mounter 4 performs a bonding operation to bond bump 43 to substrate 41.
- drive device 45 generates ultrasonic waves to encourage bonding between bump 43 and substrate 41, and further lowers chuck 44 while applying a load.
- drive device 45 stops generating ultrasonic waves and reduces the force exerted by chuck 44 to hold chip 42. The bonding operation thus ends. Thereafter, drive device 45 raises chuck 44. Whenever chuck 44 holds a new chip 42, mounter 4 performs the above-described bonding operation.
- the plurality of variables include, for example, a voltage, a current, and an amount of deformation for each of times t1, t2, ..., and tm elapsing after the bonding operation period starts.
- the plurality of variables include 3 ⁇ m variables.
- collection unit 12 acquires actual values of the plurality of variables indicating a status of mounter 4 for each bonding period.
- Collection unit 12 may acquire the actual values of the plurality of variables from sensor group 46, or may acquire the actual values of the plurality of variables from a control device (e.g., a PLC) (not shown) that controls mounter 4.
- a control device e.g., a PLC
- Calculation unit 13, detection unit 14, selection unit 15, and analysis unit 16 use standard and actual values of the 3 ⁇ m variables to perform the process described in the above embodiment. For example, calculation unit 13 calculates a standard SN ratio as a statistic indicating the degree of deviation of the actual values of the 3 ⁇ m variables from the standard values of the 3 ⁇ m variables.
- the unit interval is a period of time for which an operation of a manufacturing apparatus (an injection molding operation or a bonding operation) is performed.
- the unit interval is not limited thereto.
- the unit interval may be each of a plurality of intervals included in a range that a physical quantity of a manufacturing apparatus can assume.
- the screw's position can assume a range from the position of screw 33 shown in the upper part of Fig. 11 (represented by a distance D1) to the position of screw 33 shown in the lower part of Fig. 11 (represented by a distance D2).
- each of a plurality of intervals included in a range from distance D1 to distance D2 is set as a unit interval.
- an interval for which distance D is D1-D3 and an interval for which distance D is D3-D2 are set as unit intervals.
- an interval for which a physical quantity obtained from a tensile tester or a compression tester installed at a production site falls within a specific range may be set as a unit interval.
- an interval for which a stress-strain diagram presents strain in an amount falling within a predetermined range is set as a unit interval.
- an interval for which the cooling rate falls within a predetermined range may be set as a unit interval.
- the anomaly detection device (100, 100A) according to Configuration 3, wherein the selection unit (101, 15) is configured to select, as the effective variable, a variable effective in improving estimation accuracy of a T-method estimation model in which the plurality of variables are explanatory variables and the statistic is an objective variable.
- the anomaly detection device (100, 100A) according to Configuration 3 or 4, further comprising an analysis unit (101, 16) configured to perform a principal component analysis using the actual value of the effective variable and the statistic for the unit time.
- the anomaly detection device (100A) according to any one of Configurations 1 and 3 to 7, wherein the acquisition unit (101, 17) is configured to acquire, as the standard values, values of the plurality of variables for the unit time that are acquired previously while the production line (2) normally operates.
- the anomaly detection device (100A) according to any one of Configurations 2 to 7, wherein the acquisition unit (101, 17) is configured to acquire, as the standard values, values of the plurality of variables acquired in the unit interval previously while the target to be monitored (2, 3, 4) normally operates.
- the anomaly detection device (100, 100A) according to any of Configurations 1 and 3 to 12, wherein
- the anomaly detection device (100, 100A) according to any one of Configurations 2 to 12, wherein the target to be monitored includes a manufacturing apparatus (3, 4).
- An anomaly detection method comprising:
- a program (131, 132) configured to cause a computer to perform an anomaly detection method, the anomaly detection method comprising:
Landscapes
- Engineering & Computer Science (AREA)
- Physics & Mathematics (AREA)
- General Physics & Mathematics (AREA)
- Automation & Control Theory (AREA)
- General Engineering & Computer Science (AREA)
- Manufacturing & Machinery (AREA)
- Quality & Reliability (AREA)
- Artificial Intelligence (AREA)
- Evolutionary Computation (AREA)
- Mathematical Physics (AREA)
- Management, Administration, Business Operations System, And Electronic Commerce (AREA)
- General Factory Administration (AREA)
Applications Claiming Priority (3)
| Application Number | Priority Date | Filing Date | Title |
|---|---|---|---|
| JP2022090861 | 2022-06-03 | ||
| JP2023058310A JP2023178206A (ja) | 2022-06-03 | 2023-03-31 | 異常検知装置、異常検知方法およびプログラム |
| PCT/JP2023/017281 WO2023233927A1 (ja) | 2022-06-03 | 2023-05-08 | 異常検知装置、異常検知方法およびプログラム |
Publications (2)
| Publication Number | Publication Date |
|---|---|
| EP4535104A1 true EP4535104A1 (de) | 2025-04-09 |
| EP4535104A4 EP4535104A4 (de) | 2026-04-08 |
Family
ID=89026287
Family Applications (1)
| Application Number | Title | Priority Date | Filing Date |
|---|---|---|---|
| EP23815688.9A Pending EP4535104A4 (de) | 2022-06-03 | 2023-05-08 | Anomaliedetektionsvorrichtung, anomaliedetektionsverfahren und programm |
Country Status (4)
| Country | Link |
|---|---|
| EP (1) | EP4535104A4 (de) |
| CN (1) | CN119213378A (de) |
| TW (1) | TWI867544B (de) |
| WO (1) | WO2023233927A1 (de) |
Family Cites Families (24)
| Publication number | Priority date | Publication date | Assignee | Title |
|---|---|---|---|---|
| JPH0743702B2 (ja) * | 1988-10-21 | 1995-05-15 | 新日本製鐵株式会社 | 品質診断方法 |
| JP2001147713A (ja) * | 1999-11-19 | 2001-05-29 | Canon Inc | 稼働管理システムおよび稼働管理方法並びに記憶媒体 |
| JP2003044115A (ja) | 2001-07-27 | 2003-02-14 | Toshiba Corp | 製造ライン設計方法及びその装置並びに工程設計方法 |
| JP2003067033A (ja) * | 2001-08-29 | 2003-03-07 | Trinity Ind Corp | 連続処理工程表示システム |
| US7587296B2 (en) * | 2006-05-07 | 2009-09-08 | Applied Materials, Inc. | Adaptive multivariate fault detection |
| WO2008042739A2 (en) * | 2006-09-29 | 2008-04-10 | Fisher-Rosemount Systems, Inc. | On-line monitoring and diagnostics of a process using multivariate statistical analysis |
| JP5151556B2 (ja) * | 2007-08-10 | 2013-02-27 | オムロン株式会社 | 工程解析装置、工程解析方法および工程解析プログラム |
| JP5431235B2 (ja) * | 2009-08-28 | 2014-03-05 | 株式会社日立製作所 | 設備状態監視方法およびその装置 |
| JP5068383B1 (ja) * | 2011-06-21 | 2012-11-07 | ヤンマー株式会社 | 予測装置、予測方法及び予測プログラム |
| JP5986531B2 (ja) * | 2013-03-29 | 2016-09-06 | 株式会社日立製作所 | 生産管理システム、及び管理方法 |
| JP6364800B2 (ja) * | 2014-02-10 | 2018-08-01 | オムロン株式会社 | 監視装置及び監視方法 |
| JP6252675B2 (ja) * | 2014-05-20 | 2017-12-27 | 東芝三菱電機産業システム株式会社 | 製造設備診断支援装置 |
| US20160321594A1 (en) * | 2015-04-30 | 2016-11-03 | Optimal Plus Ltd. | Correlation between manufacturing segment and end- user device performance |
| JP6477423B2 (ja) * | 2015-11-02 | 2019-03-06 | オムロン株式会社 | 製造プロセスの予測システムおよび予測制御システム |
| JP2018151913A (ja) * | 2017-03-14 | 2018-09-27 | 株式会社リコー | 情報処理システム、情報処理方法、及びプログラム |
| JP2019049940A (ja) * | 2017-09-12 | 2019-03-28 | 安川情報システム株式会社 | 異常工程推定方法、異常工程推定装置および異常工程推定プログラム |
| JP6942617B2 (ja) * | 2017-11-30 | 2021-09-29 | 株式会社日立製作所 | データ分析システムおよびデータ分析装置 |
| JP2019179395A (ja) * | 2018-03-30 | 2019-10-17 | オムロン株式会社 | 異常検知システム、サポート装置および異常検知方法 |
| JP7040983B2 (ja) | 2018-03-30 | 2022-03-23 | 株式会社総合車両製作所 | 車両試験システム |
| WO2019240019A1 (ja) * | 2018-06-11 | 2019-12-19 | パナソニックIpマネジメント株式会社 | 異常解析装置、製造システム、異常解析方法及びプログラム |
| JP7279473B2 (ja) * | 2019-04-03 | 2023-05-23 | 株式会社豊田中央研究所 | 異常検知装置、異常検知方法、および、コンピュータプログラム |
| JP2021189743A (ja) * | 2020-05-29 | 2021-12-13 | 株式会社日立製作所 | データ分析支援装置、及びデータ分析支援方法 |
| JP7604486B2 (ja) * | 2020-05-29 | 2024-12-23 | 株式会社ダイセル | 異常変調原因特定装置、異常変調原因特定方法及び異常変調原因特定プログラム |
| JP6980133B1 (ja) * | 2020-07-01 | 2021-12-15 | 三菱電機株式会社 | 制御パラメータ調整システム、制御パラメータ調整装置および制御パラメータ調整方法 |
-
2023
- 2023-05-08 WO PCT/JP2023/017281 patent/WO2023233927A1/ja not_active Ceased
- 2023-05-08 EP EP23815688.9A patent/EP4535104A4/de active Pending
- 2023-05-08 CN CN202380041191.3A patent/CN119213378A/zh active Pending
- 2023-05-26 TW TW112119591A patent/TWI867544B/zh active
Also Published As
| Publication number | Publication date |
|---|---|
| CN119213378A (zh) | 2024-12-27 |
| WO2023233927A1 (ja) | 2023-12-07 |
| TWI867544B (zh) | 2024-12-21 |
| EP4535104A4 (de) | 2026-04-08 |
| TW202349321A (zh) | 2023-12-16 |
Similar Documents
| Publication | Publication Date | Title |
|---|---|---|
| EP3032367A1 (de) | Anlagenüberwachungsvorrichtung | |
| US11531327B2 (en) | Abnormality determination device and abnormality determination system | |
| TW202141212A (zh) | 異常診斷方法、異常診斷裝置及異常診斷程式 | |
| EP4071570B1 (de) | Vorhersagesystem, informationsverarbeitungsvorrichtung und informationsverarbeitungsprogramm | |
| US7640126B2 (en) | Combine-information processing apparatus, method for processing combine-information, program, and recording medium | |
| US20100312374A1 (en) | System and method for implementing a virtual metrology advanced process control platform | |
| US11480941B2 (en) | Analysis device, analysis method, and non-transitory computer readable medium recording an analysis program | |
| US20120296606A1 (en) | Method, computer program, and system for performing interpolation on sensor data for high system availability | |
| US10901398B2 (en) | Controller, control program, control system, and control method | |
| EP4005785B1 (de) | Anomalitätsdetektionsvorrichtung, anomalitätsdetektionsverfahren und anomalitätsdetektionsprogramm | |
| JP7604486B2 (ja) | 異常変調原因特定装置、異常変調原因特定方法及び異常変調原因特定プログラム | |
| EP3416011B1 (de) | Überwachungsvorrichtung und verfahren zur steuerung der überwachungsvorrichtung | |
| JP6801131B1 (ja) | 診断装置、診断方法、及び診断プログラム | |
| JP4568786B2 (ja) | 要因分析装置および要因分析方法 | |
| Jain et al. | Dynamic optimization of process quality control and maintenance planning | |
| WO2019016892A1 (ja) | 品質分析装置及び品質分析方法 | |
| US20260110599A1 (en) | Vibration monitoring in order to detect an error during a process automation | |
| EP4535104A1 (de) | Anomaliedetektionsvorrichtung, anomaliedetektionsverfahren und programm | |
| JP7131611B2 (ja) | 異常判定装置及び異常判定方法 | |
| CN116125242B (zh) | 对象检测方法及系统 | |
| JP2023178206A (ja) | 異常検知装置、異常検知方法およびプログラム | |
| EP4535110A1 (de) | Vorrichtung zur erkennung von anomalieschildern, verfahren zur erkennung von anomalieschildern und programm | |
| EP4216002B1 (de) | Steuerungsvorrichtung und steuerungsverfahren | |
| EP4361742A1 (de) | Vorhersagesystem, informationsverarbeitungsvorrichtung und informationsverarbeitungsprogramm | |
| JP2023178207A (ja) | 異常予兆検知装置、異常予兆の検知方法およびプログラム |
Legal Events
| Date | Code | Title | Description |
|---|---|---|---|
| STAA | Information on the status of an ep patent application or granted ep patent |
Free format text: STATUS: THE INTERNATIONAL PUBLICATION HAS BEEN MADE |
|
| PUAI | Public reference made under article 153(3) epc to a published international application that has entered the european phase |
Free format text: ORIGINAL CODE: 0009012 |
|
| STAA | Information on the status of an ep patent application or granted ep patent |
Free format text: STATUS: REQUEST FOR EXAMINATION WAS MADE |
|
| 17P | Request for examination filed |
Effective date: 20241126 |
|
| AK | Designated contracting states |
Kind code of ref document: A1 Designated state(s): AL AT BE BG CH CY CZ DE DK EE ES FI FR GB GR HR HU IE IS IT LI LT LU LV MC ME MK MT NL NO PL PT RO RS SE SI SK SM TR |
|
| DAV | Request for validation of the european patent (deleted) | ||
| DAX | Request for extension of the european patent (deleted) | ||
| A4 | Supplementary search report drawn up and despatched |
Effective date: 20260309 |
|
| RIC1 | Information provided on ipc code assigned before grant |
Ipc: G05B 19/418 20060101AFI20260303BHEP Ipc: G05B 23/02 20060101ALI20260303BHEP |