EP4535110A1 - Vorrichtung zur erkennung von anomalieschildern, verfahren zur erkennung von anomalieschildern und programm - Google Patents
Vorrichtung zur erkennung von anomalieschildern, verfahren zur erkennung von anomalieschildern und programm Download PDFInfo
- Publication number
- EP4535110A1 EP4535110A1 EP23815687.1A EP23815687A EP4535110A1 EP 4535110 A1 EP4535110 A1 EP 4535110A1 EP 23815687 A EP23815687 A EP 23815687A EP 4535110 A1 EP4535110 A1 EP 4535110A1
- Authority
- EP
- European Patent Office
- Prior art keywords
- parameters
- statistic
- unit
- effective
- target
- Prior art date
- Legal status (The legal status is an assumption and is not a legal conclusion. Google has not performed a legal analysis and makes no representation as to the accuracy of the status listed.)
- Pending
Links
Images


Classifications
-
- G—PHYSICS
- G05—CONTROLLING; REGULATING
- G05B—CONTROL OR REGULATING SYSTEMS IN GENERAL; FUNCTIONAL ELEMENTS OF SUCH SYSTEMS; MONITORING OR TESTING ARRANGEMENTS FOR SUCH SYSTEMS OR ELEMENTS
- G05B23/00—Testing or monitoring of control systems or parts thereof
- G05B23/02—Electric testing or monitoring
- G05B23/0205—Electric testing or monitoring by means of a monitoring system capable of detecting and responding to faults
- G05B23/0218—Electric testing or monitoring by means of a monitoring system capable of detecting and responding to faults characterised by the fault detection method dealing with either existing or incipient faults
- G05B23/0224—Process history based detection method, e.g. whereby history implies the availability of large amounts of data
- G05B23/024—Quantitative history assessment, e.g. mathematical relationships between available data; Functions therefor; Principal component analysis [PCA]; Partial least square [PLS]; Statistical classifiers, e.g. Bayesian networks, linear regression or correlation analysis; Neural networks
Definitions
- the present disclosure relates to a predictive anomaly detection device, a predictive anomaly detection method, and a program.
- Japanese Patent Laying-Open No. 2019-177783 discloses a technique for detecting deterioration of ride comfort of railroad vehicles from an increase in Mahalanobis' distance between characteristic data obtained from an acceleration sensor provided on the railroad vehicle and previously acquired unit data.
- the second calculation unit is configured to calculate a second statistic representing a similarity of measured values of the plurality of effective parameters to standard values of the plurality of effective parameters.
- the detection unit is configured to detect a predictive anomaly of the target to be monitored based on a result of comparing the second statistic with a control range.
- the user can confirm the graph to find a type of an event occurring at a timing when the second statistic varies and facilitate identifying a cause of an anomaly.
- the result of the analysis includes a scatter diagram of principal component scores of a first principal component and a second principal component for each unit interval.
- a vector indicating a principal component loading in each of the plurality of effective parameters and the second statistic is superimposed and displayed on the scatter diagram.
- the user can determine that, of the plurality of effective parameters, an effective parameter having a relatively large component parallel to the direction of the vector of the second statistic is relevant to an anomaly. The user is thus helped to identify a cause of the anomaly based on the effective parameter relevant to the anomaly.
- the acquisition unit is further configured to acquire event information indicating a type of an event occurring in the target to be monitored in the unit interval.
- the scatter diagram presents a point in a form different depending on a type of an event indicated by the event information of the unit interval corresponding to the point.
- the user can find a type of an event concentrated in the direction of the vector of the effective parameter relevant to the anomaly, and the user is thus helped to identify a cause of the anomaly.
- the selection unit is configured to provide a coefficient of determination for a T-method estimation model in which the plurality of effective parameters are explanatory variables and the second statistic is an objective variable.
- the user can determine whether the plurality of effective parameters are effective based on the coefficient of determination.
- the first statistic and the second statistic are each a standard SN ratio. This qualifies the first statistic and the second statistic to represent the similarity of the measured values to the standard values.
- the unit interval has a predetermined time length.
- the target to be monitored repeatedly performs a target operation.
- the unit interval is a period of time for which the target operation is performed.
- the target to be monitored includes a manufacturing apparatus.
- the plurality of parameters are extracted from a waveform of vibration measured by an acceleration sensor installed for the manufacturing apparatus.
- a waveform of vibration measured by an acceleration sensor tends to include a noise factor in a large amount.
- a plurality of effective parameters including a noise factor at a relatively small proportion are selected from a plurality of parameters extracted from a vibration waveform. Using such a plurality of effective parameters allows a predictive anomaly to be accurately detected.
- the fourth step is a step of calculating a second statistic representing a similarity of measured values of the plurality of effective parameters to standard values of the plurality of effective parameters.
- the fifth step is a step of detecting a predictive anomaly of the target to be monitored based on a result of comparing the second statistic with a control range.
- the predictive anomaly detection device, the predictive anomaly detection method, or the program can accurately and stably detect a predictive anomaly of a production system without relying on a particular person's experience.
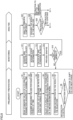
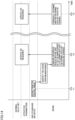
- Fig. 1 is a schematic diagram of a predictive anomaly detection method according to an embodiment. As shown in Fig. 1 , the detection method comprises steps (1) to (5). Fig. 1 shows a detection method in which a production system 2 is an example of a target to be monitored for a predictive anomaly. The target to be monitored is not limited to production system 2.
- Step (1) is a step of acquiring, for each unit period of time, measured values of a plurality of parameters indicating a state of production system 2 for the unit period of time.
- the plurality of parameters indicate, for example, a state of a manufacturing apparatus included in production system 2, quality of an intermediate product or a final product manufactured in production system 2, and the like.
- Step (3) is a step of selecting, from the plurality of parameters, a plurality of effective parameters effective in improving estimation accuracy of a T-method estimation model in which the plurality of parameters are explanatory variables and the first standard SN ratio is an objective variable.
- a plurality of effective parameters having a relatively large degree of influence on the objective variable or the first standard SN ratio can thus be selected.
- Step (4) is a step of calculating a second statistic representing a similarity of measured values of the plurality of effective parameters to standard values of the plurality of effective parameters.
- a second standard SN ratio is calculated as the second statistic.
- the second statistic is not limited to the second standard SN ratio, and may be a parameter indicating a similarity between standard values and actual values for a plurality of variables.
- the second standard SN ratio represents a similarity to a second reference space defined by the standard values of the plurality of effective parameters.
- the second standard SN ratio is calculated whenever a measured value is acquired.
- Step (5) detects a predictive anomaly of production system 2 based on a result of comparing the second standard SN ratio with a control range.
- the predictive anomaly of production system 2 is detected in response to the second standard SN ratio having a moving average departing from the control range.
- the predictive anomaly of production system 2 includes a predictive anomaly of a manufacturing apparatus included in production system 2, a predictive anomaly in quality of an intermediate product or a final product manufactured in production system 2, and the like.
- the plurality of effective parameters have a larger degree of influence on the first standard SN ratio than the remaining parameters do. This means that the effective parameters include a noise factor at a smaller proportion than the remaining parameters do.
- the second standard SN ratio accurately represents similarity for a state that production system 2 has when it normally operates.
- the plurality of effective parameters are selected based on estimation accuracy of the T-method estimation model in which the plurality of parameters are explanatory variables and the first standard SN ratio is an objective variable. Therefore, a plurality of effective parameters that accurately represent similarity for the state that production system 2 has when it normally operates are selected without relying on a particular person's experience.
- the predictive anomaly detection method of the present embodiment can accurately detect a predictive anomaly of production system 2 without relying on a particular person's experience.
- Fig. 2 is a schematic diagram of a general configuration of a system including a predictive anomaly detection device according to an embodiment. As illustrated in Fig. 2 , a system 1 comprises production system 2 and a predictive anomaly detection device 100.
- Production system 2 includes a member feeding device 2A, a press machine 2B, and an inspection device 2C.
- Member feeding device 2A feeds press machine 2B with a metal member.
- Press machine 2B is a manufacturing apparatus that shears, draws and crimps the metal member to manufacture a product having a predetermined shape.
- Inspection device 2C inspects the product in appearance, performance, etc.
- Press machine 2B is provided with an acceleration sensor 5.
- Acceleration sensor 5 measures a waveform of vibration caused in press machine 2B and outputs a measurement signal indicating a measurement result.
- press machine 2B When an event occurs in any of shearing, drawing, and crimping, press machine 2B in response outputs an event signal.
- the event is, for example, a failure that causes a temporary halt of press machine 2B.
- the event signal indicates in which of the shearing, the drawing or the crimping the event has occurred.
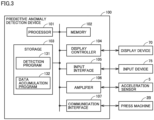
- Fig. 3 is a schematic diagram of an example of a hardware configuration of the predictive anomaly detection device according to an embodiment.
- predictive anomaly detection device 100 typically has a structure conforming to a general-purpose computer architecture.
- predictive anomaly detection device 100 includes a processor 101 such as a central processing unit (CPU) or a micro-processing unit (MPU), a memory 102, a storage 103, a display controller 104, an input interface 105, an amplifier 106, and a communication interface 107. These units are interconnected via a bus to be able to communicate data with one another.
- CPU central processing unit
- MPU micro-processing unit
- Processor 101 implements a variety of types of processes according to the present embodiment by loading a variety of types of programs stored in storage 103 into memory 102 and executing the programs.
- Memory 102 is typically a volatile storage device such as DRAM (Dynamic Random Access Memory), and stores a program read from storage 103, a variety of types of data generated as the program is executed, and the like.
- DRAM Dynamic Random Access Memory
- Storage 103 is typically a non-volatile magnetic storage device such as a hard disk drive.
- Storage 103 stores a detection program 131 and a data accumulation program 132 executed by processor 101.
- a variety of types of programs installed in storage 103 are distributed in a state of being stored in a memory card or the like.
- Display controller 104 is connected to a display device 70, and, in response to an internal command received from processor 101, outputs a signal to display device 70 for displaying a variety of types of information.
- Amplifier 106 amplifies a measurement signal received from acceleration sensor 5.
- Communication interface 107 mediates data transmission between processor 101 and an external device (e.g., press machine 2B).
- Communication interface 107 typically includes Ethernet ® , a USB (Universal Serial Bus), or the like. Note that a variety of types of programs stored in storage 103 may be downloaded from a distribution server or the like via communication interface 107.
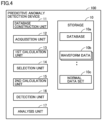
- Fig. 4 is a diagram of an example of a functional configuration of the predictive anomaly detection device according to an embodiment.
- predictive anomaly detection device 100 comprises a storage unit 10, a database construction unit 11, an acquisition unit 12, a first calculation unit 13, a selection unit 14, a second calculation unit 15, a detection unit 16, and an analysis unit 17.
- Storage unit 10 is implemented by memory 102 and storage 103.
- Database construction unit 11 is implemented by amplifier 106, communication interface 107, and processor 101 executing data accumulation program 132.
- Acquisition unit 12, first calculation unit 13, selection unit 14, second calculation unit 15, detection unit 16, and analysis unit 17 are implemented by processor 101 executing detection program 131.
- Record 10a1 is added for each unit period of time having a predetermined time length (e.g., 1 minute, 5 minutes, 20 minutes, etc.).
- Each record 10a1 includes fields 10a2 to 10a5.
- field 10a2 is described the start time of the corresponding unit period of time.
- field 10a3 is described the end time of the corresponding unit period of time.
- field 10a4 is described a location in which waveform data 10b representing a waveform of vibration as measured by acceleration sensor 5 during the corresponding unit period of time is stored.
- field 10a5 is described a type of event (any one of a "shearing event", a "drawing event” and a "crimping event") indicated by an event signal received during the corresponding unit period of time.
- acquisition unit 12 acquires, for each unit period of time, event information indicating a type of an event occurring in press machine 2B of production system 2 for the unit period of time. Specifically, acquisition unit 12 determines, for each unit period of time, the record 10a1 that corresponds to the unit period of time from database 10a, and acquires event information indicating a type of an event described in the determined record 10a1 at field 10a5.
- Selection unit 14 selects, from the plurality of parameters, a plurality of effective parameters effective in improving estimation accuracy of a T-method estimation model in which the plurality of parameters are explanatory variables and the first standard SN ratio is an objective variable.
- the T-method is one of the multivariate analysis methods provided by a Statistician Dr. Genich Taguchi, and is a method of estimating a value of one objective variable from values of a plurality of explanatory variables (See Kishio TAMURA, "Chapter 5. MT system capable of determining directions - TS method and T method," Standardization and Quality Control, 2009, Vol. 62, No. 2 (NPL 1)).
- an explanatory variable effective in improving accuracy of estimating an objective variable can be selected and an explanatory variable having a negative effect on (or reducing) accuracy of estimating the objective variable can be excluded.
- an effect when there is an interaction between items can be considered. Specifically, according to Genichi TAGUCHI, "Objective Function and Generic Function (6) - Prediction by T Method", Quality Engineering, 2005, Vol. 13, No. 3, pp.
- an orthogonal array is created to provide either one of two levels of using and not using for each of a plurality of explanatory variables (or items), and a total SN ratio is calculated for each row of the orthogonal array. Based on a total SN ratio when each item is used and that when it is not used, selection unit 14 determines the item's effect on estimating an objective variable and whether the item has a negative effect on estimating the objective variable. Based on the result of the determination, selection unit 14 selects a plurality of effective parameters from the plurality of parameters.
- selection unit 14 may not use the two-level orthogonal array; rather, the selection unit may generate a plurality of patterns each indicating a combination of two or more of the plurality of parameters. Then, selection unit 14 may generate a T-method estimation model in which actual values of the two or more parameters indicated by each pattern are explanatory variables and the first standard SN ratio is an objective variable, and the selection unit may select a plurality of effective parameters based on total SN ratios in magnitude of the generated T-method estimation model. For example, selection unit 14 selects the two or more parameters included in a pattern having a maximum total SN ratio as effective parameters.
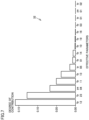
- Fig. 6 represents an example of a degree of contribution of each parameter to the first standard SN ratio in the T-method estimation model in which a plurality of parameters are all used.
- Fig. 6 shows a graph 30 representing a degree of contribution of each of 35 parameters.
- a parameter having a relatively small degree of contribution has a small degree of influence on the first standard SN ratio. This is because the parameter having a relatively small degree of contribution includes many noise factors. Therefore, it is preferable that the parameter having a relatively small degree of contribution is not selected as an effective parameter.
- Fig. 7 represents an example of a plurality of effective parameters selected by the selection unit.
- Fig. 7 shows a graph 32 representing a degree of contribution of each of 15 effective parameters selected using a two-level orthogonal array.
- a vertical axis represents a degree of contribution of each parameter in a T-method estimation model in which the 15 effective parameters are explanatory variables and the first standard SN ratio is the objective variable.
- the 15 effective parameters have a larger influence on the first standard SN ratio than the remaining parameters do. That is, the 15 effective parameters are occupied by a noise factor at a smaller proportion than the remaining parameters are.
- Second calculation unit 15 calculates a second standard SN ratio for measured values of the plurality of effective parameters with respect to standard values of the plurality of effective parameters for each unit period of time.
- the second standard SN ratio is calculated based on Genichi TAGUCHI, "Objective Function and Generic Function (6) - Prediction by T Method", Quality Engineering, 2005, Vol. 13, No. 3, pp. 5-10 (NPL 2).
- NPL 2 Quality Engineering, 2005, Vol. 13, No. 3, pp. 5-10
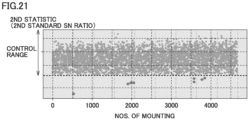
- Detection unit 16 detects a predictive anomaly of press machine 2B based on a result of comparing the second standard SN ratio with a control range.
- the control range is predetermined.
- Detection unit 16 may detect the predictive anomaly of press machine 2B in response to the second standard SN ratio for each unit period of time departing from the control range.
- detection unit 16 considers variation of the second standard SN ratio and detects the predictive anomaly of press machine 2B in response to the second standard SN ratio having a moving average deviating from the control range.
- Fig. 8 is a flowchart of an example of a flow of a process performed by the predictive anomaly detection device. As illustrated in Fig. 8 , the process by predictive anomaly detection device 100 includes a preliminary preparation phase, a monitoring phase, and an analysis phase.
- processor 101 of predictive anomaly detection device 100 reads normal data set 10c indicating standard values of a plurality of parameters acquired while press machine 2B to be monitored normally operates (step S1).
- processor 101 selects, from the plurality of parameters, a plurality of effective parameters effective in improving estimation accuracy of a T-method estimation model in which the plurality of parameters are explanatory variables and the first standard SN ratio is an objective variable (step S4).
- the user reviews normal data set 10c, waits until database 10a has data accumulated to a desired amount, or the like. Thereafter, the user enters an instruction to input device 75 to retry the preliminary preparation.
- processor 101 acquires measured values of the plurality of parameters for a new unit period of time (step S11). Specifically, processor 101 reads waveform data 10b in a storage location described in field 10a4 of a new record 10a1 added to database 10a, and calculates the measured values of the plurality of parameters from the read waveform data 10b.
- processor 101 calculates a second standard SN ratio for measured values of a plurality of effective parameters that are acquired in step S11 with respect to standard values of the plurality of effective parameters (step S13). Further, processor 101 provides a graph representing how the second standard SN ratio changes with time (step S14). Specifically, processor 101 causes display device 70 to display the graph. Thus, the user can confirm how the second standard SN ratio varies.
- step S15 When press machine 2B has no predictive anomaly (NO in step S15), the control returns to step S11.
- step S15 When press machine 2B has a predictive anomaly (YES in step S15), the control proceeds to the analysis phase.
- processor 101 initially performs a principal component analysis using the plurality of effective parameters and the second standard SN ratio for each unit period of time (step S21).
- What is subject to the principal component analysis is a data set indicating measured values of the plurality of effective parameters and a value of the second standard SN ratio for each of a plurality of unit period of times included in a target period of time including a timing at which an anomaly is detected.
- the plurality of parameters acquired while press machine 2B normally operates may vary in value. Accordingly, after the maintenance, the user confirms whether a reference space defined by the values of the plurality of parameters acquired while press machine 2B normally operates has a difference from a reference space defined by the standard values of the plurality of parameters currently indicated by normal data set 10c. If the difference is smaller than a threshold value, the user determines that it is unnecessary to change normal data set 10c, and the user enters an instruction to input device 75 to continue the monitoring.
- processor 101 confirms the instruction entered to input device 75 (step S23).
- step S23 When an instruction to continue the monitoring is entered to input device 75, the control returns to step S11.
- step S11 When an instruction to shift to the preliminary preparation phase is entered to input device 75, the control returns to step S1.
- Fig. 9 represents an example of a scatter diagram of estimated and measured values of the objective variable when the T-method estimation model is used with the plurality of parameters all used as explanatory variables and the first standard SN ratio as the objective variable.
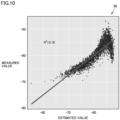
- Fig. 10 represents an example of a scatter diagram of estimated and measured values of the objective variable when the T-method estimation model is used with the plurality of effective parameters as explanatory variables and the first standard SN ratio as the objective variable.
- a scatter diagram 36 provided when the plurality of effective parameters are used as explanatory variables has smaller variation than a scatter diagram 34 provided when the plurality of parameters are all used as explanatory variables. This is because the plurality of effective parameters include a noise factor at a smaller proportion than the remaining parameters do. The plurality of effective parameters thus accurately represent similarity for the normal state of press machine 2B.
- the user can determine whether the result of the selection is valid by confirming the scatter diagram and the coefficient of determination R 2 .
- processor 101 may provide the Figs. 6 and 7 graphs 30 and 32 as information on the result of the selection. The user can thus obtain each parameter's degree of contribution.
- a crimping event occurs a plurality of times on May 31, 2021, a crimping event occurs again successively on June 1, 2021, and around the end of the same day, a defect of the crimping process spreads to the drawing process and a drawing event occurs. Thereafter, press machine 2B fails on June 3, 2021.
- processor 101 indicates in graph 38 indicating how the second standard SN ratio changes with time a type of an event indicated by the event information acquired in step S12. That is, as has been described above, in graph 38, processor 101 causes a form of displaying a point indicating a standard SN ratio for each unit period of time to be different depending on a type of an event indicated by event information for the unit period of time.
- processor 101 can identify a type of an event occurring in a time zone in which the second standard SN ratio varies. This helps the user to identify a cause of an anomaly of press machine 2B.
- an enclosure 40 indicates a confidence interval for points corresponding to unit periods of time for which no event occurs.
- An enclosure 41 indicates a confidence interval for points corresponding to unit periods of time for which an event occurs in the shearing process.
- An enclosure 42 indicates a confidence interval for points corresponding to unit periods of time for which an event occurs in the drawing process.
- An enclosure 43 indicates a confidence interval for points corresponding to unit periods of time for which an event occurs in the crimping process.
- biplot 50 shown in Fig. 13 it can be seen that the confidence interval for each type of event is separated.
- the user can determine that variables fp10, fp19, fp13, and ip02 corresponding to the vectors v1, v2, v4, and v5 having relatively large components parallel to the direction of the vector v0 are variables affecting a decrease in the second standard SN ratio.
- the user can determine that variables ip01 and fp03 corresponding to the vectors v3 and v6, respectively, having relatively small components parallel to the direction of the vector v0 are variables which do not significantly affect the decrease in the second standard SN ratio.
- the user can estimate that a type of an event corresponding to a confidence interval present in a direction of a vector of a variable affecting a decrease in the second standard SN ratio is relevant to a cause of an anomaly.
- the confidence interval indicated by enclosure 43 exists in the direction of the vector v2. This allows the user to refer to a member involved in the crimping process as a candidate for a cause of an anomaly.
- the user can determine a cause of an anomaly based on a feature of a vibration waveform represented by a variable affecting a decrease in the second standard SN ratio. For example, when a variable indicating a feature of a high frequency component of a vibration waveform affects a decrease in the second standard SN ratio, the user can refer to a metal component as a candidate for a cause of an anomaly.
- the user determines similarity of reference spaces before and after the maintenance, as defined from values of a plurality of parameters acquired while press machine 2B normally operates. The user determines whether it is necessary to update normal data set 10c according to the similarity between the reference spaces before and after the maintenance. Then, normal data set 10c is updated according to the result of the determination. As normal data set 10c is updated, the preliminary preparation phase indicated in Fig. 8 is performed, and the plurality of effective parameters are also updated.
- normal data set 10c may be periodically determined. For example, at a timing T3, the user acquires values of the plurality of parameters acquired while press machine 2B normally operates. Then, the user determines similarity between a reference space defined by the acquired values of the plurality of parameters and a reference space defined by the standard values of the plurality of parameters indicated by normal data set 10c. The user determines whether to update normal data set 10c depending on the determined similarity, and updates normal data set 10c, as necessary. As normal data set 10c is updated, the preliminary preparation phase indicated in Fig. 8 is performed, and the plurality of effective parameters are also updated.
- acquisition unit 12 acquires measured values of a plurality of parameters indicating a state of a target to be monitored for each unit period of time (or each unit interval) having a predetermined time length (e.g., of 1 minute, 5 minutes, 20 minutes, etc.).
- acquisition unit 12 may acquire the measured values of the plurality of parameters indicating the state of the target to be monitored for each unit interval without a predetermined time length.
- the unit interval may be a period of time for which a target operation is performed in press machine 2B to be monitored.
- the target operation is, for example, a series of operations of shearing, drawing, and crimping a single metal member.
- the target operation may be one processing operation selected from shearing, drawing, and crimping a single metal member.
- a target to be monitored for a predictive anomaly is production system 2 (press machine 2B, in particular).
- the target to be monitored is not limited to production system 2.
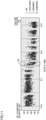
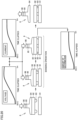
- Fig. 15 is a diagram illustrating another example of a target to be monitored.
- Fig. 15 shows an injection molding machine 6 as a target to be monitored.
- Injection molding machine 6 includes a mold 61, a cylinder 62, a screw 63, a hopper 64, a screw driving device 65, and a sensor group 66.
- Injection molding machine 6 repeatedly performs an injection molding operation.
- the injection molding operation is an operation of injecting the resin accommodated in the internal space of cylinder 62 into mold 61 by moving screw 63 from a state shown in the upper portion of Fig. 15 to a state shown in the lower portion of the same figure.
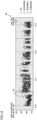
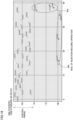
- Fig. 16 represents a transition of a physical quantity measured by a sensor group for a period of time for which the injection molding operation is performed.
- a period of time for which the injection molding operation is performed will be referred to as an "injection molding period”.
- the horizontal axis represents a time elapsing after the injection molding operation starts
- the vertical axis represents values of a variety of types of physical quantities measured by sensor group 66.
- sensor group 66 measures the screw's position, injection pressure, and injection speed as physical quantities indicating a status of injection molding machine 6.
- First calculation unit 13, selection unit 14, second calculation unit 15, detection unit 16, and analysis unit 17 use the standard and measured values of the 3 ⁇ n parameters indicated in Fig. 17 to perform the process described in the above embodiment.
- Chuck 84 holds a chip 82 having a bump 83 attached thereto.
- Drive device 85 controls generation of ultrasonic waves, upward/downward movement of chuck 84, and a force exerted by chuck 84 to hold chip 82.
- Sensor group 86 measures values of a variety of types of physical quantities indicating a status of mounter 8.
- Sensor group 86 measures a current and a voltage applied to drive device 85 and an amount by which bump 83 is deformed as physical quantities indicating a status of mounter 8.
- the amount by which bump 83 is deformed is represented by a distance between chip 82 and substrate 81.
- the predictive anomaly detection device (100) according to any one of Configurations 1 to 6, wherein the selection unit (101, 14) is configured to provide a coefficient of determination for a T-method estimation model in which the plurality of effective parameters are explanatory variables and the second statistic is an objective variable.
- the predictive anomaly detection device (100) according to any one of Configurations 1 to 8, wherein the unit interval (or the unit period of time) has a predetermined time length.
Landscapes
- Physics & Mathematics (AREA)
- Engineering & Computer Science (AREA)
- Artificial Intelligence (AREA)
- Evolutionary Computation (AREA)
- Mathematical Physics (AREA)
- General Physics & Mathematics (AREA)
- Automation & Control Theory (AREA)
- Testing And Monitoring For Control Systems (AREA)
- Testing Or Calibration Of Command Recording Devices (AREA)
- Management, Administration, Business Operations System, And Electronic Commerce (AREA)
- Complex Calculations (AREA)
Applications Claiming Priority (3)
| Application Number | Priority Date | Filing Date | Title |
|---|---|---|---|
| JP2022090862 | 2022-06-03 | ||
| JP2023058311A JP2023178207A (ja) | 2022-06-03 | 2023-03-31 | 異常予兆検知装置、異常予兆の検知方法およびプログラム |
| PCT/JP2023/017280 WO2023233926A1 (ja) | 2022-06-03 | 2023-05-08 | 異常予兆検知装置、異常予兆の検知方法およびプログラム |
Publications (2)
| Publication Number | Publication Date |
|---|---|
| EP4535110A1 true EP4535110A1 (de) | 2025-04-09 |
| EP4535110A4 EP4535110A4 (de) | 2026-04-08 |
Family
ID=89026273
Family Applications (1)
| Application Number | Title | Priority Date | Filing Date |
|---|---|---|---|
| EP23815687.1A Pending EP4535110A4 (de) | 2022-06-03 | 2023-05-08 | Vorrichtung zur erkennung von anomalieschildern, verfahren zur erkennung von anomalieschildern und programm |
Country Status (4)
| Country | Link |
|---|---|
| EP (1) | EP4535110A4 (de) |
| CN (1) | CN119213381A (de) |
| TW (1) | TWI861899B (de) |
| WO (1) | WO2023233926A1 (de) |
Family Cites Families (10)
| Publication number | Priority date | Publication date | Assignee | Title |
|---|---|---|---|---|
| JP3970483B2 (ja) * | 1999-08-30 | 2007-09-05 | 株式会社東芝 | 設備運用状態の監視装置 |
| JP5081999B1 (ja) * | 2011-06-22 | 2012-11-28 | 株式会社日立エンジニアリング・アンド・サービス | 異常予兆診断結果の表示方法 |
| JP5530020B1 (ja) * | 2013-11-01 | 2014-06-25 | 株式会社日立パワーソリューションズ | 異常診断システム及び異常診断方法 |
| JP2017187880A (ja) * | 2016-04-04 | 2017-10-12 | 株式会社リコー | 支援装置、支援システム、支援方法、及びプログラム |
| JP6723669B2 (ja) * | 2016-09-27 | 2020-07-15 | 東京エレクトロン株式会社 | 異常検知プログラム、異常検知方法および異常検知装置 |
| JP6884078B2 (ja) * | 2017-09-21 | 2021-06-09 | 三菱パワー株式会社 | プラント異常監視システム |
| JP7040983B2 (ja) | 2018-03-30 | 2022-03-23 | 株式会社総合車両製作所 | 車両試験システム |
| CN112955839B (zh) * | 2018-10-30 | 2024-08-20 | 国立研究开发法人宇宙航空研究开发机构 | 异常检测装置、异常检测方法和程序 |
| JP7367366B2 (ja) * | 2019-07-23 | 2023-10-24 | オムロン株式会社 | 異常検知装置、異常検知方法、および異常検知プログラム |
| WO2022054256A1 (ja) * | 2020-09-11 | 2022-03-17 | 三菱電機株式会社 | 異常検知装置 |
-
2023
- 2023-05-08 WO PCT/JP2023/017280 patent/WO2023233926A1/ja not_active Ceased
- 2023-05-08 EP EP23815687.1A patent/EP4535110A4/de active Pending
- 2023-05-08 CN CN202380041091.0A patent/CN119213381A/zh active Pending
- 2023-05-25 TW TW112119484A patent/TWI861899B/zh active
Also Published As
| Publication number | Publication date |
|---|---|
| TWI861899B (zh) | 2024-11-11 |
| EP4535110A4 (de) | 2026-04-08 |
| TW202409987A (zh) | 2024-03-01 |
| WO2023233926A1 (ja) | 2023-12-07 |
| CN119213381A (zh) | 2024-12-27 |
Similar Documents
| Publication | Publication Date | Title |
|---|---|---|
| Sohn et al. | Structural health monitoring using statistical process control | |
| JP5151556B2 (ja) | 工程解析装置、工程解析方法および工程解析プログラム | |
| EP0660211A2 (de) | Methode zur steuerung eines Herstellungsprozesses | |
| EP4071570B1 (de) | Vorhersagesystem, informationsverarbeitungsvorrichtung und informationsverarbeitungsprogramm | |
| US20010005821A1 (en) | Method and system for monitoring the condition of an individual machine | |
| EP3382485B1 (de) | Steuergerät, steuerungsprogramm, steuerungssystem und steuerungsverfahren | |
| US7640126B2 (en) | Combine-information processing apparatus, method for processing combine-information, program, and recording medium | |
| CN101899563A (zh) | 基于pca模型的连续退火机组炉内温度、张力监测及故障追溯方法 | |
| JP6801131B1 (ja) | 診断装置、診断方法、及び診断プログラム | |
| WO2019016892A1 (ja) | 品質分析装置及び品質分析方法 | |
| EP3416012A1 (de) | Überwachungsvorrichtung und verfahren zur steuerung der überwachungsvorrichtung | |
| US20260110599A1 (en) | Vibration monitoring in order to detect an error during a process automation | |
| Neumann et al. | Confounder-adjusted covariances of system outputs and applications to structural health monitoring | |
| EP4535110A1 (de) | Vorrichtung zur erkennung von anomalieschildern, verfahren zur erkennung von anomalieschildern und programm | |
| CN115599037B (zh) | 一种基因检测实验室设备自动化监控方法 | |
| Wang et al. | Autoregressive coefficients based Hotelling’s T2 control chart for structural health monitoring | |
| EP4535104A1 (de) | Anomaliedetektionsvorrichtung, anomaliedetektionsverfahren und programm | |
| JP2023178206A (ja) | 異常検知装置、異常検知方法およびプログラム | |
| JP2023178207A (ja) | 異常予兆検知装置、異常予兆の検知方法およびプログラム | |
| CN118395311B (zh) | 一种电子元器件生产数据智能分析方法及系统 | |
| EP4216002B1 (de) | Steuerungsvorrichtung und steuerungsverfahren | |
| Schwarzenberger et al. | Transferable condition monitoring for linear guidance systems using anomaly detection | |
| CN114295365B (zh) | 插针机精度异常监测方法、系统、设备及存储介质 | |
| CN120415211B (zh) | 一种伺服电机控制方法、控制设备及控制系统 | |
| JP2012048616A (ja) | 特徴量抽出装置および特徴量抽出方法 |
Legal Events
| Date | Code | Title | Description |
|---|---|---|---|
| STAA | Information on the status of an ep patent application or granted ep patent |
Free format text: STATUS: THE INTERNATIONAL PUBLICATION HAS BEEN MADE |
|
| PUAI | Public reference made under article 153(3) epc to a published international application that has entered the european phase |
Free format text: ORIGINAL CODE: 0009012 |
|
| STAA | Information on the status of an ep patent application or granted ep patent |
Free format text: STATUS: REQUEST FOR EXAMINATION WAS MADE |
|
| 17P | Request for examination filed |
Effective date: 20241126 |
|
| AK | Designated contracting states |
Kind code of ref document: A1 Designated state(s): AL AT BE BG CH CY CZ DE DK EE ES FI FR GB GR HR HU IE IS IT LI LT LU LV MC ME MK MT NL NO PL PT RO RS SE SI SK SM TR |
|
| DAV | Request for validation of the european patent (deleted) | ||
| DAX | Request for extension of the european patent (deleted) | ||
| A4 | Supplementary search report drawn up and despatched |
Effective date: 20260309 |
|
| RIC1 | Information provided on ipc code assigned before grant |
Ipc: G05B 23/02 20060101AFI20260303BHEP |