EP4060348A2 - Analyseverfahren, analysevorrichtung, analysesystem und analyseprogramm zum analysieren einer blutungsneigung eines probanden - Google Patents
Analyseverfahren, analysevorrichtung, analysesystem und analyseprogramm zum analysieren einer blutungsneigung eines probanden Download PDFInfo
- Publication number
- EP4060348A2 EP4060348A2 EP22161327.6A EP22161327A EP4060348A2 EP 4060348 A2 EP4060348 A2 EP 4060348A2 EP 22161327 A EP22161327 A EP 22161327A EP 4060348 A2 EP4060348 A2 EP 4060348A2
- Authority
- EP
- European Patent Office
- Prior art keywords
- value
- time
- coagulation reaction
- arrival time
- coagulation
- Prior art date
- Legal status (The legal status is an assumption and is not a legal conclusion. Google has not performed a legal analysis and makes no representation as to the accuracy of the status listed.)
- Pending
Links
- 206010062713 Haemorrhagic diathesis Diseases 0.000 title claims abstract description 72
- 208000031169 hemorrhagic disease Diseases 0.000 title claims abstract description 72
- 238000004458 analytical method Methods 0.000 title claims abstract description 55
- 230000015271 coagulation Effects 0.000 claims abstract description 101
- 238000005345 coagulation Methods 0.000 claims abstract description 101
- 238000006243 chemical reaction Methods 0.000 claims abstract description 59
- 239000008280 blood Substances 0.000 claims abstract description 40
- 210000004369 blood Anatomy 0.000 claims abstract description 40
- 230000001133 acceleration Effects 0.000 claims abstract description 35
- 230000036632 reaction speed Effects 0.000 claims abstract description 9
- 230000000694 effects Effects 0.000 claims description 39
- 108010054218 Factor VIII Proteins 0.000 claims description 32
- 102000001690 Factor VIII Human genes 0.000 claims description 32
- 101100129500 Caenorhabditis elegans max-2 gene Proteins 0.000 claims description 18
- 238000000034 method Methods 0.000 claims description 17
- 208000009292 Hemophilia A Diseases 0.000 claims description 15
- 102100026735 Coagulation factor VIII Human genes 0.000 claims description 12
- 201000003542 Factor VIII deficiency Diseases 0.000 claims description 12
- 101000911390 Homo sapiens Coagulation factor VIII Proteins 0.000 claims description 12
- 230000003287 optical effect Effects 0.000 claims description 4
- 229940105778 coagulation factor viii Drugs 0.000 claims description 3
- PGOHTUIFYSHAQG-LJSDBVFPSA-N (2S)-6-amino-2-[[(2S)-5-amino-2-[[(2S)-2-[[(2S)-2-[[(2S)-2-[[(2S)-4-amino-2-[[(2S)-2-[[(2S)-2-[[(2S)-2-[[(2S)-2-[[(2S)-5-amino-2-[[(2S)-5-amino-2-[[(2S)-2-[[(2S)-2-[[(2S)-2-[[(2S,3R)-2-[[(2S)-5-amino-2-[[(2S)-2-[[(2S)-2-[[(2S,3R)-2-[[(2S)-2-[[(2S)-2-[[(2S)-2-[[(2S)-2-[[(2S)-5-amino-2-[[(2S)-1-[(2S,3R)-2-[[(2S)-2-[[(2S)-2-[[(2R)-2-[[(2S)-2-[[(2S)-2-[[2-[[(2S)-2-[[(2S)-2-[[(2S)-2-[[(2S)-1-[(2S)-2-[[(2S)-2-[[(2S)-2-[[(2S)-2-amino-4-methylsulfanylbutanoyl]amino]-3-(1H-indol-3-yl)propanoyl]amino]-5-carbamimidamidopentanoyl]amino]propanoyl]pyrrolidine-2-carbonyl]amino]-3-methylbutanoyl]amino]-4-methylpentanoyl]amino]-4-methylpentanoyl]amino]acetyl]amino]-3-hydroxypropanoyl]amino]-4-methylpentanoyl]amino]-3-sulfanylpropanoyl]amino]-4-methylsulfanylbutanoyl]amino]-5-carbamimidamidopentanoyl]amino]-3-hydroxybutanoyl]pyrrolidine-2-carbonyl]amino]-5-oxopentanoyl]amino]-3-hydroxypropanoyl]amino]-3-hydroxypropanoyl]amino]-3-(1H-imidazol-5-yl)propanoyl]amino]-4-methylpentanoyl]amino]-3-hydroxybutanoyl]amino]-3-(1H-indol-3-yl)propanoyl]amino]-5-carbamimidamidopentanoyl]amino]-5-oxopentanoyl]amino]-3-hydroxybutanoyl]amino]-3-hydroxypropanoyl]amino]-3-carboxypropanoyl]amino]-3-hydroxypropanoyl]amino]-5-oxopentanoyl]amino]-5-oxopentanoyl]amino]-3-phenylpropanoyl]amino]-5-carbamimidamidopentanoyl]amino]-3-methylbutanoyl]amino]-4-methylpentanoyl]amino]-4-oxobutanoyl]amino]-5-carbamimidamidopentanoyl]amino]-3-(1H-indol-3-yl)propanoyl]amino]-4-carboxybutanoyl]amino]-5-oxopentanoyl]amino]hexanoic acid Chemical compound CSCC[C@H](N)C(=O)N[C@@H](Cc1c[nH]c2ccccc12)C(=O)N[C@@H](CCCNC(N)=N)C(=O)N[C@@H](C)C(=O)N1CCC[C@H]1C(=O)N[C@@H](C(C)C)C(=O)N[C@@H](CC(C)C)C(=O)N[C@@H](CC(C)C)C(=O)NCC(=O)N[C@@H](CO)C(=O)N[C@@H](CC(C)C)C(=O)N[C@@H](CS)C(=O)N[C@@H](CCSC)C(=O)N[C@@H](CCCNC(N)=N)C(=O)N[C@@H]([C@@H](C)O)C(=O)N1CCC[C@H]1C(=O)N[C@@H](CCC(N)=O)C(=O)N[C@@H](CO)C(=O)N[C@@H](CO)C(=O)N[C@@H](Cc1cnc[nH]1)C(=O)N[C@@H](CC(C)C)C(=O)N[C@@H]([C@@H](C)O)C(=O)N[C@@H](Cc1c[nH]c2ccccc12)C(=O)N[C@@H](CCCNC(N)=N)C(=O)N[C@@H](CCC(N)=O)C(=O)N[C@@H]([C@@H](C)O)C(=O)N[C@@H](CO)C(=O)N[C@@H](CC(O)=O)C(=O)N[C@@H](CO)C(=O)N[C@@H](CCC(N)=O)C(=O)N[C@@H](CCC(N)=O)C(=O)N[C@@H](Cc1ccccc1)C(=O)N[C@@H](CCCNC(N)=N)C(=O)N[C@@H](C(C)C)C(=O)N[C@@H](CC(C)C)C(=O)N[C@@H](CC(N)=O)C(=O)N[C@@H](CCCNC(N)=N)C(=O)N[C@@H](Cc1c[nH]c2ccccc12)C(=O)N[C@@H](CCC(O)=O)C(=O)N[C@@H](CCC(N)=O)C(=O)N[C@@H](CCCCN)C(O)=O PGOHTUIFYSHAQG-LJSDBVFPSA-N 0.000 claims description 2
- 108010000499 Thromboplastin Proteins 0.000 claims description 2
- 102000002262 Thromboplastin Human genes 0.000 claims description 2
- 230000001678 irradiating effect Effects 0.000 claims description 2
- 208000032843 Hemorrhage Diseases 0.000 abstract description 41
- 230000000740 bleeding effect Effects 0.000 abstract description 41
- 238000012360 testing method Methods 0.000 abstract description 12
- 230000023555 blood coagulation Effects 0.000 description 35
- 229960000301 factor viii Drugs 0.000 description 29
- 238000005259 measurement Methods 0.000 description 24
- 238000010586 diagram Methods 0.000 description 20
- 238000001514 detection method Methods 0.000 description 17
- 239000003153 chemical reaction reagent Substances 0.000 description 14
- 239000013307 optical fiber Substances 0.000 description 14
- 238000012545 processing Methods 0.000 description 13
- 102000009123 Fibrin Human genes 0.000 description 6
- 108010073385 Fibrin Proteins 0.000 description 6
- BWGVNKXGVNDBDI-UHFFFAOYSA-N Fibrin monomer Chemical compound CNC(=O)CNC(=O)CN BWGVNKXGVNDBDI-UHFFFAOYSA-N 0.000 description 6
- 238000004364 calculation method Methods 0.000 description 6
- 229950003499 fibrin Drugs 0.000 description 6
- 238000004891 communication Methods 0.000 description 5
- 230000007423 decrease Effects 0.000 description 5
- 238000002360 preparation method Methods 0.000 description 5
- 239000007825 activation reagent Substances 0.000 description 4
- 239000003146 anticoagulant agent Substances 0.000 description 4
- 229940127219 anticoagulant drug Drugs 0.000 description 4
- 108010049003 Fibrinogen Proteins 0.000 description 3
- 102000008946 Fibrinogen Human genes 0.000 description 3
- 208000031220 Hemophilia Diseases 0.000 description 3
- VYPSYNLAJGMNEJ-UHFFFAOYSA-N Silicium dioxide Chemical compound O=[Si]=O VYPSYNLAJGMNEJ-UHFFFAOYSA-N 0.000 description 3
- 230000002596 correlated effect Effects 0.000 description 3
- 230000000875 corresponding effect Effects 0.000 description 3
- 229940012952 fibrinogen Drugs 0.000 description 3
- BHPQYMZQTOCNFJ-UHFFFAOYSA-N Calcium cation Chemical compound [Ca+2] BHPQYMZQTOCNFJ-UHFFFAOYSA-N 0.000 description 2
- 108010094028 Prothrombin Proteins 0.000 description 2
- 208000007536 Thrombosis Diseases 0.000 description 2
- 230000003213 activating effect Effects 0.000 description 2
- 229910001424 calcium ion Inorganic materials 0.000 description 2
- 230000000052 comparative effect Effects 0.000 description 2
- 238000003745 diagnosis Methods 0.000 description 2
- 230000023597 hemostasis Effects 0.000 description 2
- 238000010606 normalization Methods 0.000 description 2
- 238000001556 precipitation Methods 0.000 description 2
- 239000001509 sodium citrate Substances 0.000 description 2
- UXVMQQNJUSDDNG-UHFFFAOYSA-L Calcium chloride Chemical compound [Cl-].[Cl-].[Ca+2] UXVMQQNJUSDDNG-UHFFFAOYSA-L 0.000 description 1
- KRKNYBCHXYNGOX-UHFFFAOYSA-K Citrate Chemical compound [O-]C(=O)CC(O)(CC([O-])=O)C([O-])=O KRKNYBCHXYNGOX-UHFFFAOYSA-K 0.000 description 1
- 102100022641 Coagulation factor IX Human genes 0.000 description 1
- 102100023804 Coagulation factor VII Human genes 0.000 description 1
- 108010076282 Factor IX Proteins 0.000 description 1
- 108010023321 Factor VII Proteins 0.000 description 1
- 108010014173 Factor X Proteins 0.000 description 1
- 108010074864 Factor XI Proteins 0.000 description 1
- 108010080865 Factor XII Proteins 0.000 description 1
- 102000000429 Factor XII Human genes 0.000 description 1
- HTTJABKRGRZYRN-UHFFFAOYSA-N Heparin Chemical compound OC1C(NC(=O)C)C(O)OC(COS(O)(=O)=O)C1OC1C(OS(O)(=O)=O)C(O)C(OC2C(C(OS(O)(=O)=O)C(OC3C(C(O)C(O)C(O3)C(O)=O)OS(O)(=O)=O)C(CO)O2)NS(O)(=O)=O)C(C(O)=O)O1 HTTJABKRGRZYRN-UHFFFAOYSA-N 0.000 description 1
- 208000028221 Mild hemophilia A Diseases 0.000 description 1
- 208000033375 Moderate hemophilia A Diseases 0.000 description 1
- 102100027378 Prothrombin Human genes 0.000 description 1
- 108090000190 Thrombin Proteins 0.000 description 1
- 239000002253 acid Substances 0.000 description 1
- 239000012190 activator Substances 0.000 description 1
- AGVAZMGAQJOSFJ-WZHZPDAFSA-M cobalt(2+);[(2r,3s,4r,5s)-5-(5,6-dimethylbenzimidazol-1-yl)-4-hydroxy-2-(hydroxymethyl)oxolan-3-yl] [(2r)-1-[3-[(1r,2r,3r,4z,7s,9z,12s,13s,14z,17s,18s,19r)-2,13,18-tris(2-amino-2-oxoethyl)-7,12,17-tris(3-amino-3-oxopropyl)-3,5,8,8,13,15,18,19-octamethyl-2 Chemical compound [Co+2].N#[C-].[N-]([C@@H]1[C@H](CC(N)=O)[C@@]2(C)CCC(=O)NC[C@@H](C)OP(O)(=O)O[C@H]3[C@H]([C@H](O[C@@H]3CO)N3C4=CC(C)=C(C)C=C4N=C3)O)\C2=C(C)/C([C@H](C\2(C)C)CCC(N)=O)=N/C/2=C\C([C@H]([C@@]/2(CC(N)=O)C)CCC(N)=O)=N\C\2=C(C)/C2=N[C@]1(C)[C@@](C)(CC(N)=O)[C@@H]2CCC(N)=O AGVAZMGAQJOSFJ-WZHZPDAFSA-M 0.000 description 1
- 238000007796 conventional method Methods 0.000 description 1
- 108010074361 factor V clotting antigen Proteins 0.000 description 1
- 229960004222 factor ix Drugs 0.000 description 1
- 229940012413 factor vii Drugs 0.000 description 1
- 229960002897 heparin Drugs 0.000 description 1
- 229920000669 heparin Polymers 0.000 description 1
- 230000001771 impaired effect Effects 0.000 description 1
- 238000012417 linear regression Methods 0.000 description 1
- 239000004973 liquid crystal related substance Substances 0.000 description 1
- PWPJGUXAGUPAHP-UHFFFAOYSA-N lufenuron Chemical compound C1=C(Cl)C(OC(F)(F)C(C(F)(F)F)F)=CC(Cl)=C1NC(=O)NC(=O)C1=C(F)C=CC=C1F PWPJGUXAGUPAHP-UHFFFAOYSA-N 0.000 description 1
- 229910052751 metal Inorganic materials 0.000 description 1
- 239000002184 metal Substances 0.000 description 1
- 238000012986 modification Methods 0.000 description 1
- 230000004048 modification Effects 0.000 description 1
- 150000003904 phospholipids Chemical class 0.000 description 1
- 230000031915 positive regulation of coagulation Effects 0.000 description 1
- 229940039716 prothrombin Drugs 0.000 description 1
- 230000035945 sensitivity Effects 0.000 description 1
- 239000000377 silicon dioxide Substances 0.000 description 1
- NLJMYIDDQXHKNR-UHFFFAOYSA-K sodium citrate Chemical compound O.O.[Na+].[Na+].[Na+].[O-]C(=O)CC(O)(CC([O-])=O)C([O-])=O NLJMYIDDQXHKNR-UHFFFAOYSA-K 0.000 description 1
- 239000007787 solid Substances 0.000 description 1
- 229960004072 thrombin Drugs 0.000 description 1
- HRXKRNGNAMMEHJ-UHFFFAOYSA-K trisodium citrate Chemical compound [Na+].[Na+].[Na+].[O-]C(=O)CC(O)(CC([O-])=O)C([O-])=O HRXKRNGNAMMEHJ-UHFFFAOYSA-K 0.000 description 1
- 229940038773 trisodium citrate Drugs 0.000 description 1
- 238000012795 verification Methods 0.000 description 1
Images








Classifications
-
- G—PHYSICS
- G01—MEASURING; TESTING
- G01N—INVESTIGATING OR ANALYSING MATERIALS BY DETERMINING THEIR CHEMICAL OR PHYSICAL PROPERTIES
- G01N33/00—Investigating or analysing materials by specific methods not covered by groups G01N1/00 - G01N31/00
- G01N33/48—Biological material, e.g. blood, urine; Haemocytometers
- G01N33/50—Chemical analysis of biological material, e.g. blood, urine; Testing involving biospecific ligand binding methods; Immunological testing
- G01N33/86—Chemical analysis of biological material, e.g. blood, urine; Testing involving biospecific ligand binding methods; Immunological testing involving blood coagulating time or factors, or their receptors
-
- G—PHYSICS
- G01—MEASURING; TESTING
- G01N—INVESTIGATING OR ANALYSING MATERIALS BY DETERMINING THEIR CHEMICAL OR PHYSICAL PROPERTIES
- G01N2458/00—Labels used in chemical analysis of biological material
- G01N2458/15—Non-radioactive isotope labels, e.g. for detection by mass spectrometry
Definitions
- the present invention relates to an analysis method, an analysis device, an analysis system, and an analysis program for analyzing a bleeding tendency of a patient.
- WIPO Patent Publication No. 2020/158948 discloses a method for determining the severity of hemophilia A in a patient.
- a corrected linear curve is calculated from the coagulation reaction curve of the blood of the subject
- the calculation target area value S is calculated from the obtained corrected linear curve with the maximum height value Vmax (100%) set at 5%, 10%, 20%, 30%, 40%, 50%, 60%, 70%, 80%, and 90%, respectively, of the maximum height value Vmax (100%)
- the flattening vAB and the time rate vTB are calculated for the target area at each calculated target area value S.
- the flattening vAB and the time rate vTB are calculated from the corrected linear curve for the target area at each calculation target area value S concerning blood (template specimens) from patients with severe, moderate, and mild hemophilia A, the severity of which was determined based on the activity level of coagulation factor VIII (FVIII). Then, a linear regression equation is obtained between the flatness vAB and time rate vTB of the blood of the subject and the flatness vAB and time rate vTB of each template sample, and the template sample with the highest correlation is determined to determine the severity of hemophilia A of the patient.
- WIPO Patent Publication No. 2020/158948 discloses a method for determining the severity of hemophilia A of a patient, since the determination is made based on the correlation with a template sample of a patient whose severity is determined based on the activity level of FVIII, it is not possible to detect a patient who is determined to be mild or moderate case by measuring the activity level of FVIII and later experiences severe bleeding.
- the present invention detects a patient who experiences severe bleeding, but who cannot be detected by the conventional method of measuring the activity level of FVIII via the method disclosed in WIPO Patent Publication No. 2020/158948 .
- the present invention relates to an analysis method for analyzing a bleeding tendency of a subject comprising obtaining a time-series data set of a coagulation reaction of a blood sample collected from the subject; obtaining, based on the time-series data set, a maximum speed arrival time until a coagulation reaction speed is maximized or a maximum acceleration arrival time until a coagulation reaction acceleration is maximized, and a reference time in the coagulation reaction; obtaining a value based on the maximum speed arrival time or the maximum acceleration arrival time, and the reference time; and outputting the value or information relating to the bleeding tendency based on the value.
- the present invention relates to an analysis device (100) for analyzing a bleeding tendency of a subject
- the analysis device (100) comprises a control device (10), and the control device (10) obtains a time-series data set of a coagulation reaction of a blood sample collected from the subject; obtains, based on the time-series data set, a maximum speed arrival time until a coagulation reaction speed is maximized or a maximum acceleration arrival time until a coagulation reaction acceleration is maximized, and a reference time in the coagulation reaction; obtains a value based on the maximum speed arrival time or the maximum acceleration arrival time, and the reference time; and outputs the value or information relating to the bleeding tendency based on the value.
- the present invention relates to a computer-executable analysis program (132) for analyzing a bleeding tendency of a subject, the program being configured to cause, when executed by a computer, the computer to execute the steps of: obtaining a time-series data set of a coagulation reaction of a blood sample collected from the subject; obtaining, based on the time-series data set, a maximum speed arrival time until a coagulation reaction speed is maximized or a maximum acceleration arrival time until a coagulation reaction acceleration is maximized, and a reference time in the coagulation reaction; obtaining a value based on the maximum speed arrival time or the maximum acceleration arrival time, and the reference time; and outputting the value or information relating to the bleeding tendency based on the value.
- the analysis system 1 will be described with reference to FIGS. 1 to 5 .
- the analysis system 1 includes an analyzer 100 for analyzing the bleeding tendency of a subject and a measuring device 200 including a detection unit for irradiating light on a blood sample that has started a coagulation reaction, and obtaining optical information therefrom.
- the blood sample to be analyzed by the analysis system 1 is blood collected from a subject or a sample obtained by processing the collected blood.
- a blood sample include whole blood or plasma.
- Blood is preferably collected using an anticoagulant other than a heparin preparation at the time of blood collection.
- a citrate for example a sodium citrate solution, can be used as the anticoagulant.
- a blood sample for example, a 3.1% to 3.3% (weight/volume) of trisodium citrate solution may be used as an anticoagulant, and this anticoagulant and the collected blood can be mixed so that the volume ratio is about 1:8.5 to 1:9.5.
- the subject from whom blood is collected is not limited, but is, for example, a subject who is suspected of having a bleeding tendency.
- Subjects suspected of having a bleeding tendency are, for example, patients with low factor VIII activity.
- Factors that reduce the activity of factor VIII include those occurring due to functional factors and those occurring due to quantitative factors.
- the subject suspected of having a bleeding tendency is, for example, a patient having hemophilia A.
- FIG. 2 is a diagram showing the hardware structure of the analysis system 1.
- the analysis device 100 is communicably connected to the measuring device 200.
- the analysis device 100 is connected to a media drive 98.
- the analysis device 100 is connected to an electronic medical record system 1000 via the network 99.
- the network 99 is, for example, a local area network (LAN), but may be the Internet.
- the analysis device 100 includes a control device 10, an input device 16, and an output device 17.
- the control device 10 includes a CPU (Central Processing Unit) 11 for performing data processing, a main storage device 12 used as a work area for data processing, an auxiliary storage device 13 for storing information transferred to the main storage device 12, a bus 14 for transmitting data between each device, and an interface (I/F) 15 for inputting/outputting data to/from an external device.
- the input device 16, the output device 17, the media drive 98, the network 99, and the measuring device 200 are connected to the interface (I/F) 15.
- the interface (I/F) 15 is, for example, a USB, IEEE1394, or Ethernet.
- the auxiliary storage device 13 is, for example, a solid state drive or a hard disk drive.
- the input device 16 is, for example, a keyboard or a mouse
- the output device 17 is, for example, a liquid crystal display or an organic EL display. Information regarding the bleeding tendency of the subject is output to the output device 17.
- FIG. 3 is a diagram showing information stored in the auxiliary storage device 13.
- the auxiliary storage device 13 includes a measurement program 131 for the measuring device 200 to measure blood coagulation, an analysis program 132 for analyzing the bleeding tendency of the subject, and a function database (DB) DB1 for storing mathematical formulas used for the analysis, and a reference value database (DB) DB2 for storing the reference values.
- DB function database
- DB2 reference value database
- the measuring device 200 includes a sample preparation unit 20 for preparing a sample so as to start the blood sample coagulation reaction, a light irradiation unit 27, a detection unit 22, and an interface (I/F) 25.
- the interface (I/F) 15 is, for example, a USB, IEEE1394, or Ethernet.
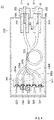
- FIG. 4 shows the structure of the light irradiation unit 27.
- the light irradiation unit 27 includes five light sources 321, 322, 323, 324, and 325, five optical fiber units 330a, 330b, 330c, 330d and 330e provided corresponding to the five light sources 321 to 325, and one holding member 340 for holding the 321 to 325 and the incident end 331 of the optical fiber portions 330a to 330e.
- the light sources 321 to 325, the optical fiber portions 330a to 330e, and the holding member 340 are housed in a metal housing 310.
- the light sources 321 to 325 are all composed of LEDs, and the first light source 321 generates light of 660 nm.
- the second light source 322 generates light of 405 nm.
- the third light source 323 generates light of 800 nm.
- the fourth light source 324 generates light of 340 nm.
- the fifth light source 325 generates light of 575 nm.
- the light sources 321 to 325 generate light under the control of the control device 10 of the measuring device 200.
- Each of the optical fiber portions 330a to 330e is configured as a cable in which optical fiber strands having one core are bundled.
- the optical fiber portions 330a to 330e are bundled together in the intermediate portion 333, the optical fiber portions 330a to 330e bundled together are divided into two bundles, and the emission end 332 of each bundle is held by an outlet 311 provided in the housing 310.
- the outlet 311 also holds an incident end 352 of the optical fiber 21 connecting the light irradiation unit 27 and the detection unit 22.
- An equalizing member 350 for equalizing the intensity distribution of the light emitted from the emitting end 332 is provided between the emitting end 332 of the optical fiber portions 330a to 330e and the incident end 352 of the optical fiber 21.
- the equalizing member 350 is a member that internally multiple-reflects the light incident from the incident surface 351 and is, for example, a polygonal columnar rod equalizer.
- FIGS. 5A and 5B show the structure of the detection unit 22. Note that although a detection unit 22 is provided for each optical fiber 21 connected to the light irradiation unit 27, since the hardware structure of the detection unit 22 is identical to all detection units 22, only a single detection unit 22 is described here.
- FIG. 5A is a diagram showing a detection unit 22 does not hold the cuvette 80 for mixing the blood sample and coagulation time measuring reagent.
- the detection unit 22 is formed with a hole 22b into which is inserted the other end 353 of the optical fiber 21 whose incident end 352 ( FIG. 4 ) is held at the outlet 311 of the light irradiation unit 27.
- the detection unit 22 also is formed with a communication hole 22c that allows the hole 22b to communicate with the holding portion 22a for holding the cuvette 80.
- the diameter of the hole 22b is larger than the diameter of the communication hole 22c.
- a lens 22d that collects light from the optical fiber 21 is arranged at the end of the hole 22b.
- a hole 22f also is formed on the inner wall surface of the holding portion 22a at a position facing the communication hole 22c.
- a light receiving unit 22g is arranged behind the hole 22f.
- the light receiving unit 22g is, for example, a photodiode, and outputs an electric signal according to the amount of received light.
- the light transmitted through the lens 22d is incident on the light receiving surface of the light receiving unit 22g through the communication hole 22c, the holding portion 22a, and the hole 22f.
- the optical fiber 21 is fixed by a leaf spring 22e with the end portion 353 inserted into the hole 22b.
- FIG. 5B is a diagram showing a detection unit 22 in a state of holding the cuvette 80.
- the light collected by the lens 22d passes through the cuvette 80 and the sample contained in the cuvette 80, and is incident on the light receiving unit 22g.
- the turbidity of the sample increases.
- the amount of light transmitted through the sample decreases, and the level of the electric signal output from the light receiving unit 22g decreases.
- the electric signal output from the light receiving unit 22g is converted into a digital signal by the A/D converter 22h, and transmitted to the analysis device 100 via the communication I/F 25 (see FIG. 1 ).
- the signal output from the light receiving unit 22g and converted by the A/D converter 22h is optical information reflecting the amount of transmitted light.
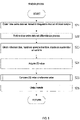
- FIG. 6 shows the flow of measurement/analysis processing by the control device 10 of the analysis device 100.
- the control device 10 executes the measurement process based on the measurement program 131 in step S1.
- the control device 10 executes the analysis process based on the analysis program 132 in step S2.
- FIG. 7 shows the flow of the measurement process executed by the control device 10 based on the measurement program 131.
- the control device 10 receives a measurement start request input by the operator from the input device 16, and in step S11 acquires information on the blood coagulation parameter (test item) ordered for each blood sample for each blood sample based on the information input by the operator from the input device 16.
- the control device 10 also may acquire information on blood coagulation parameters from, for example, an electronic medical record system 1000 in a medical facility via a network 99.
- the blood coagulation parameter (test item) acquired in step S11 is the activated partial thromboplastin time (hereinafter, may be abbreviated as "APTT")
- APTT activated partial thromboplastin time
- a coagulation time measuring reagent and a coagulation activating reagent are used.
- a test reagent for APTT measurement containing an activator such as silica, elladic acid, or Celite, and an animal-derived, plant-derived, or artificially synthesized phospholipid can be used as the coagulation time measuring reagent.
- test reagents for APTT measurement include Thromboplast (registered trademark) APTT series manufactured by Sysmex Corporation, Coagupia (registered trademark) APTT-N manufactured by Sekisui Medical Co., Ltd., and Data Phi APTT produced by Siemens Healthcare Diagnostics Products GmbH.
- the coagulation activation reagent is a reagent capable of supplying calcium ions, and is, for example, a 20 mM calcium chloride solution.
- the control device 10 controls the sample preparation unit 20 of the measuring device 200 so as to dispense the blood sample to the cuvette 80 in step S12.
- the control device 10 controls the sample preparation device 2 of the measuring device 200 to prepare a measurement sample by dispensing a coagulation time measuring reagent corresponding to the blood coagulation parameter acquired in step S11 to the cuvette 80 into which the blood sample has been dispensed in step S13.
- the control device 10 controls the sample preparation unit 20 of the measuring device 200 so as to dispense the coagulation activating reagent to the blood sample to which the coagulation time measuring reagent has been dispensed.
- step S14 the control device 10 controls the light irradiation unit 27 so as to start light irradiation on the cuvette 80 to which the coagulation activation reagent is dispensed in step S13.
- the control device 10 controls the light irradiation unit 27 so that only the first light source 321 irradiates the light.
- the control device 10 receives a signal (digital data) corresponding to the intensity of the light received through the cuvette 80 and the measurement sample, which is output from the light receiving unit 22g, from the time when the coagulation activation reagent is dispensed into the cuvette 80, and this light is continuously received until a predetermined measurement time (for example, 120 seconds to 180 seconds) is reached.
- a predetermined measurement time for example, 120 seconds to 180 seconds
- the control device 10 stores the continuously received digital data in the auxiliary storage device 13 as a time-series data set relating to the coagulation reaction of the blood sample.
- the time interval for the control device 10 to receive digital data is, for example, 0.1 seconds to 0.5 seconds.
- FIG. 8 shows the flow of the analysis process for analyzing the bleeding tendency of the subject executed by the control device 10 based on the analysis program 132.
- the control device 10 starts the analysis process by receiving a measurement start request input by the operator from the input device 16. Note that the control device 10 also may start the analysis process with the end of step S14 shown in FIG. 7 as a trigger.
- the control device 10 also may measure the activity level of FVIII in step S1 shown in FIG. 6 , compare the activity level of FVIII with a predetermined value (for example, 10%), and when the activity level of FVIII is less than the predetermined value, the analysis process may be started.
- the predetermined value is not particularly limited, but is preferably an activity level diagnosed as mild or moderate in the severity determination of a hemophilia A patient.
- step S21 the control device 10 acquires a time-series data set relating to the coagulation reaction of the blood sample collected from the subject. Specifically, the control device 10 reads out the time-series data set stored in the auxiliary storage device 13 in step S14.
- the time-series data set is a set of two-dimensional array data consisting of the intensity of the light transmitted through the measurement sample when the measurement sample is irradiated with light (hereinafter referred to as "transmitted light intensity"), and the time when the transmitted light is detected.
- FIG. 9A is a diagram showing an example of a time series data set. In the time-series data set of FIG. 9A , the upper row shows the transmitted light intensity, and the lower row shows the time when each transmitted light intensity is acquired (the elapsed time from the time (t I ) described later).
- the control device 10 normalizes the blood coagulation curve representing the time-series data set acquired in step S21, and differentiates the obtained blood coagulation curve to obtain a first derivative coagulation curve, then differentiates the first derivative coagulation curve to obtain a second derivative coagulation curve.
- FIG. 9C shows the blood coagulation curve obtained by normalizing the blood coagulation curve shown in FIG. 9B .
- each transmitted light intensity contained in the time series data set is relativized so that the blood coagulation curve obtained by normalization is such that the vertical axis represents between 0% (L1: baseline) and 100% (L2).
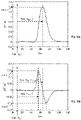
- FIG. 10A shows a first derivative coagulation curve obtained by differentiating the blood coagulation curve shown in FIG. 9C .
- FIG. 10B shows a second derivative coagulation curve obtained by differentiating the first derivative coagulation curve shown in FIG. 10A .
- the control device 10 acquires the reference time (t c ) in step S23 shown in FIG. 8 .
- the reference time (t c ) is, for example, the time from the start of coagulation of a blood sample until it reaches a predetermined coagulation state.
- the time (t I ) is the time when the coagulation activation reagent is added to the blood sample.
- fibrinogen in the blood sample has not changed to fibrin, and fibrin precipitation does not occur, so the transmitted light intensity shows a high value.
- the time (t II ) which is the coagulation reaction start time.
- the control device 10 acquires the time at which the transmitted light intensity starts to decrease in the blood coagulation curve by calculation, and sets it as the time (t II ).
- the control device 10 sets the amount of change in the transmitted light intensity over time (t II ) to 0%.
- the control device 10 acquires the time when the blood coagulation curve starts to plateau by calculation, and sets this as the time (t III ).
- Time (t III ) is the time to complete the coagulation reaction.
- the control device 10 sets the amount of change in the transmitted light intensity over time (t III ) to 100%.
- the control device 10 acquires the time (time at the intersection of the line L3 and the blood coagulation curve) when the amount of change in the transmitted light intensity is 50% as the reference time (t c ).
- the reference time (t c ) is the coagulation time in this embodiment.
- the coagulation time need not be 50% change in transmitted light intensity, and any change such as 30%, 40%, 60%, or 70% may be used.
- the reference time (t c ) may be, for example, a constant time counted from the time (t II ) which is the coagulation reaction start time.
- control device 10 acquires the first derivative coagulation curve by differentiating the blood coagulation curve shown in FIG. 9B .
- the control device 10 also acquires a reference time (t c ) based on the blood coagulation curve shown in FIG. 9B .
- step S23 shown in FIG. 8 the control device 10 obtains the maximum speed arrival time (t min1 ), which is the time from the coagulation reaction start time (t II ) to the maximum speed of the coagulation reaction, by calculation based on the first derivative coagulation curve shown in FIG. 10A acquired in step S22.
- the control device 10 also may calculate the time (t a0 ) which is the time from the coagulation reaction start time (t II ) to the acceleration of the coagulation reaction becoming 0, as the maximum speed arrival time (t min1 ) based on the second derivative coagulation curve shown in FIG. 10B .
- step S23 shown in FIG. 8 the control device 10 obtains the maximum acceleration arrival time (t min2 ) which is the time from the coagulation start time (t II ) to the time the acceleration of the coagulation reaction maximizes based on the second derivative coagulation curve shown in FIG. 10B acquired in step S22.
- step S23 shown in FIG. 8 the control device 10 calculates
- step S23 of FIG. 8 the control device 10 obtains
- step S24 shown in FIG. 8 the control device 10 acquires a value (S) based on the value acquired in step S23.
- This value (S) reflects how quickly the blood coagulation reaction proceeded after the start of the blood coagulation reaction.
- the value (S) reflects that the blood of a subject with a low bleeding tendency, the speed of the blood coagulation reaction is maximized at about the middle point of the blood coagulation reaction, and reflects that the blood of a subject with a high bleeding tendency, the speed of the blood coagulation reaction is maximized earlier than the middle point of the blood coagulation reaction.
- the formula for calculating the value (S) is stored in the function database DB1.
- step S25 shown in FIG. 8 the control device 10 compares the value (S) acquired in step S24 with a predetermined reference value.
- the predetermined reference value is a reference value for determining the height of the bleeding tendency of the subject, is set in advance, and is stored in the reference value database DB 2 of the auxiliary storage device 13.
- step S26 shown in FIG. 8 the control device 10 outputs a result based on the comparison between the value acquired in step S25 and the reference value.
- the results may include information about bleeding tendency.
- Information about bleeding tendency includes a label indicating the degree of bleeding tendency.
- the label indicating the degree of bleeding tendency may indicate the degree of bleeding tendency by a numerical value or a symbol, or may indicate via sentence or a word.
- Labels indicating the degree of bleeding tendency include a first label indicating a low bleeding tendency and a second label indicating a moderate or high bleeding tendency.
- the reference value used for the comparison in step S25 is the first reference value for determining whether the subject has a low bleeding tendency or a subject with a moderate or high bleeding tendency.
- the first and second labels are associated with the reference value and stored in advance in the reference value database DB2.
- the first and second reference values can be set to correspond to, for example, the bleeding score value by the International Society on Thrombosis and Haemostasis Bleeding Assessment Tool (ISTH-BAT) provided by the Japanese Society for Thrombosis and Hemostasis. That is, the value (S) is obtained for the blood samples of a plurality of subjects whose bleeding score values of ISTH-BAT are known, and, for example, the first reference value is set such that the first label is output for subjects whose bleeding score value of ISTH-BAT is 10 or less and the second label is output for subjects whose bleeding score value of ISTH-BAT is greater than 10.
- IHS-BAT International Society on Thrombosis and Haemostasis Bleeding Assessment Tool
- the control device 10 also may output the value (S) acquired in step S24 as a result in step S26 without performing step S25 shown in FIG. 8 . Even when the control device 10 performs step S25, the value (S) acquired in step S24 may be output as a result in step S26. In step S26, the control device 10 also may output the value (S) acquired in step S24 and the information on the bleeding tendency based on the comparison result in step S25.
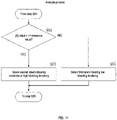
- step S25 The comparison process of step S25 will be described with reference to FIG. 11 .
- step S51 the value (S) and the first reference value are compared, and when the value (S) is larger ("YES"), the control device 10 proceeds to step S53 and selects a second label stored in the reference value database DB2 indicating that the bleeding tendency is moderate or high.
- the control device 10 proceeds to step S26 shown in FIG. 8 and outputs the second label selected in step S53 to the output device 17 as information indicating that the subject has a moderate or high bleeding tendency.
- step S51 when the value (S) is equal to or less than the first reference value (that is, when the determination is "NO"), the control device 10 proceeds to step S55 and selects the first label stored in the reference value database DB2 indicating that the bleeding tendency is low.
- the control device 10 proceeds to step S26 shown in FIG. 8 and outputs the first label selected in step S55 to the output device 17 as information indicating that the subject has a low bleeding tendency.
- the blood coagulation parameter also may be, for example, prothrombin time (hereinafter sometimes abbreviated as "PT"), thrombotest, fibrinogen, factor VIII activity, factor II activity, factor V activity, factor VII activity, factor IX activity, factor X activity, factor XI activity, factor XII activity, or whole blood coagulation time.
- PT prothrombin time
- test reagent for PT measurement When PT is acquired as a blood coagulation parameter (test item), a test reagent for PT measurement containing thrombin can be used as a coagulation time measuring reagent.
- test reagents for PT measurement include Thrombocheck (registered trademark) PT series manufactured by Sysmex Corporation, and Coagupia (registered trademark) PT series manufactured by Sekisui Medical Co., Ltd.
- Test reagents for PT measurement generally contain calcium ions required for activation of coagulation.
- the value (S) also may be, for example, a value obtained by subtracting the maximum speed arrival time (t min1 ) from the reference time (t c ), or a value obtained by subtracting the maximum acceleration arrival time (t min2 ) from the reference time (t c ).
- the value (S) also may be a value based on a coefficient and a value obtained by subtracting the maximum speed arrival time (t min1 ) from the reference time (t c ), or a value obtained by subtracting the maximum acceleration arrival time (t min2 ) from the reference time (t c ).
- the coefficients may be, for example,
- is the difference between two values (
- the value (S) more strongly reflects how fast the blood coagulation reaction progresses after the start of the coagulation reaction, and the detection sensitivity of a subject with a high bleeding tendency can be improved.
- the value (S) may be, for example, a value shown by the following formulae.
- Value S t c ⁇ t min 1 ⁇ min 2 Value
- S t c ⁇ t min 1 ⁇ min 2 ⁇ max 2 Value
- S t c ⁇ t min 1 ⁇ max 2 ⁇ min 2 Value
- S t c ⁇ t min 1 ⁇ max 2 / min 2
- Value S t c ⁇ t min 1
- S t c ⁇ t min 2 ⁇ min 1
- Value S t c ⁇ t min 2 ⁇ min 1
- Value S t c ⁇ t min 2 ⁇ min2 Value
- S t c ⁇ t min2 ⁇ max 2 ⁇ min 2
- Value S t c ⁇ t min 2 ⁇ max 2 ⁇ min 2 Value
- Value S t c ⁇ t min 2 ⁇ max 2 ⁇ min 2 or Value
- FIG. 12 shows a modified example of the comparison process shown in FIG. 11 .
- the label indicating the degree of bleeding tendency includes a third label indicating that the bleeding tendency is low or moderate, and a fourth label indicating that the bleeding tendency is high.
- the reference value is a second reference value for determining whether the subject has a low or moderate bleeding tendency or the subject has a high bleeding tendency.
- the second reference value is set such that, for a subject having an ISTH-BAT bleeding score value of 15 or less, a third label is output, and for a subject having an ISTH-BAT bleeding score value greater than 15, a fourth label is output.
- step S61 the value (S) and the second reference value are compared, and if the value (S) is larger ("YES"), the control device 10 proceeds to step S63 and selects a fourth label stored in the reference value database DB2, which indicates that the bleeding tendency is high.
- the control device 10 proceeds to step S26 shown in FIG. 8 and outputs the fourth label selected in step S63 to the output device 17 as information indicating that the subject has a high bleeding tendency.
- step S61 when the value (S) is equal to or less than the second reference value (when the determination is "NO"), the control device 10 proceeds to step S65 and selects a third label stored in the reference value database DB2, which indicates that the bleeding tendency is low or moderate.
- the control device 10 proceeds to step S26 shown in FIG. 8 and outputs the third label selected in step S65 to the output device 17 as information indicating that the subject has a low or moderate bleeding tendency.
- both reference values may be used to determine a subject with a low bleeding tendency, a subject with a moderate bleeding tendency, and a subject with a high bleeding tendency.
- the detection unit 22 may receive the light (scattered light) scattered by the sample housed in the cuvette 80, and the control device 10 may analyze the blood coagulation reaction curve based on the change in the scattered light intensity.
- the bleeding score value of ISTH-BAT was calculated for 41 subjects who were determined to be mild or moderate as a result of diagnosing the severity of hemophilia based on the activity measurement of FVIII; the figure shows a two-dimensional scatter plot in which the bleeding score value for each subject is shown on the vertical axis (Y-axis), and the horizontal axis (X-axis) shows the activity of FVIII.
- Frame P shown in FIG. 13 is a region to which a group of subjects having an ISTH-BAT bleeding score value greater than 15 and an FVIII activity of less than 10% belong.
- FIG. 14A shows a blood coagulation curve, a first derivative coagulation curve, and a second derivative coagulation curve of a healthy subject who does not have hemophilia in order from the top.
- FIG. 14B shows a blood coagulation curve, a first derivative coagulation curve, and second derivative coagulation curve of a subject having a ISTH-BAT bleeding score value of 25 with a high bleeding tendency (a subject belonging to the frame P shown in FIG. 13 ) shown in order from the top.
- the reference time (t c ) and the maximum speed arrival time (tmin1) are almost the same time. Therefore, since the value (S) is close to 0, in the comparative processing shown in FIGS. 11 and 12 , the first label indicating that the bleeding tendency is low, or the third label indicating the bleeding tendency is low or moderate is selected.
- the difference between the reference time (t c ) and the maximum speed arrival time (tmin1) is larger than the difference in the healthy subject when a subject has a high bleeding tendency, in the comparative process shown in FIGS. 11 and 12 , a second label indicating that the bleeding tendency is moderate or high, or a fourth label indicating that the bleeding tendency is high is selected.
- the difference between the reference time (t c ) and the maximum acceleration arrival time (t min2 ) is also larger for subjects with a high bleeding tendency than for healthy subjects, and therefore for subjects with a high bleeding tendency, a second label indicating a moderate or high bleeding tendency or a fourth label indicating a high bleeding tendency is selected.
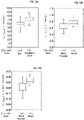
- FIGS. 15A to 15C are box-and-whisker plots in which the vertical axis (Y-axis) shows the value (S).
- 41 subjects were divided into a group of subjects having a ISTH-BAT bleeding score value of 10 or less (a group of mild subjects), and a group of subjects with a ISTH-BAT bleeding score greater than 10 (a group of moderate or severe subjects).
- the vertical axis shows the value (S) obtained using formula 1
- the box-and-whisker plot on the left side shows the group of subjects with mild cases
- the box-and-whisker plot on the right side shows the moderate or severe cases.
- the ISTH-BAT bleeding score value was found to be highly correlated with the value (S) showing it is possible to distinguish between a group of mild subjects with an ISTH-BAT bleeding score of 10 or less and a group of moderate or severe subjects with an ISTH-BAT bleeding score greater than 10.
- FIGS. 15B and 15C 41 subjects were divided into a group of subjects having a ISTH-BAT bleeding score value of 15 or less (a group of mild to moderate subjects), and a group of subjects with a ISTH-BAT bleeding score greater than 15 (a group of severe subjects).
- the vertical axis shows the value (S) obtained using formula 2
- the box-and-whisker plot on the left side shows the group of subjects with mild or moderate cases
- the box-and-whisker plot on the right side shows the severe cases.
- the ISTH-BAT bleeding score value was found to be highly correlated with the value (S) showing it is possible to distinguish between a group of mild or moderate subjects with an ISTH-BAT bleeding score of 15 or less and a group of severe subjects with an ISTH-BAT bleeding score greater than 15.
- the vertical axis shows the value (S) obtained using formula 3, the box-and-whisker plot on the left side shows the group of subjects with mild or moderate cases, and the box-and-whisker plot on the right side shows the severe cases.
- the ISTH-BAT bleeding score value was found to be highly correlated with the value (S) showing it is possible to distinguish between a group of mild or moderate subjects with an ISTH-BAT bleeding score of 15 or less and a group of severe subjects with an ISTH-BAT bleeding score greater than 15.
- the value (S) has a high correlation with the ISTH-BAT bleeding score value, and by using the value (S), it is possible to determine subjects who belong to the frame P ( FIG. 13 ) with a high bleeding score even though they are determined to be mild or moderate cases in the test based on the FVIII measurement, that is, it is possible to detect subjects who may experience severe bleeding, which could not be detected by measuring the activity level of FVIII.
- the vertical axis shows the value (S) obtained using formula 2
- the box-and-whisker plot on the left side shows the group of subjects with mild or moderate cases
- the box-and-whisker plot on the right side shows the severe cases.
- S the value obtained using formula 2
- the box-and-whisker plot on the left side shows the group of subjects with mild or moderate cases
- the box-and-whisker plot on the right side shows the severe cases.
Landscapes
- Health & Medical Sciences (AREA)
- Life Sciences & Earth Sciences (AREA)
- Hematology (AREA)
- Engineering & Computer Science (AREA)
- Molecular Biology (AREA)
- Biomedical Technology (AREA)
- Chemical & Material Sciences (AREA)
- Immunology (AREA)
- Urology & Nephrology (AREA)
- Biotechnology (AREA)
- Microbiology (AREA)
- Cell Biology (AREA)
- Food Science & Technology (AREA)
- Medicinal Chemistry (AREA)
- Physics & Mathematics (AREA)
- Analytical Chemistry (AREA)
- Biochemistry (AREA)
- General Health & Medical Sciences (AREA)
- General Physics & Mathematics (AREA)
- Pathology (AREA)
- Investigating Or Analysing Biological Materials (AREA)
Applications Claiming Priority (1)
| Application Number | Priority Date | Filing Date | Title |
|---|---|---|---|
| JP2021046534A JP7665365B2 (ja) | 2021-03-19 | 2021-03-19 | 被検者の出血傾向を解析する解析方法、解析装置、解析システム、及び解析プログラム |
Publications (2)
| Publication Number | Publication Date |
|---|---|
| EP4060348A2 true EP4060348A2 (de) | 2022-09-21 |
| EP4060348A3 EP4060348A3 (de) | 2022-09-28 |
Family
ID=81074003
Family Applications (1)
| Application Number | Title | Priority Date | Filing Date |
|---|---|---|---|
| EP22161327.6A Pending EP4060348A3 (de) | 2021-03-19 | 2022-03-10 | Analyseverfahren, analysevorrichtung, analysesystem und analyseprogramm zum analysieren einer blutungsneigung eines probanden |
Country Status (3)
| Country | Link |
|---|---|
| US (1) | US12436157B2 (de) |
| EP (1) | EP4060348A3 (de) |
| JP (1) | JP7665365B2 (de) |
Families Citing this family (1)
| Publication number | Priority date | Publication date | Assignee | Title |
|---|---|---|---|---|
| WO2025263460A1 (ja) * | 2024-06-17 | 2025-12-26 | 積水メディカル株式会社 | 血液凝固異常を有する可能性のある血液検体の選択方法 |
Citations (2)
| Publication number | Priority date | Publication date | Assignee | Title |
|---|---|---|---|---|
| US10048249B2 (en) | 2016-02-29 | 2018-08-14 | Sysmex Corporation | Blood coagulation analyzer and blood coagulation analyzing method |
| WO2020158948A1 (ja) | 2019-01-31 | 2020-08-06 | 積水メディカル株式会社 | 血液検体の血液凝固特性の分析方法 |
Family Cites Families (8)
| Publication number | Priority date | Publication date | Assignee | Title |
|---|---|---|---|---|
| US20130344519A1 (en) * | 2012-06-25 | 2013-12-26 | Bayer Healthcare Llc | Methods and systems for assessment of turbidity kinetics (waveform analysis) in coagulation testing |
| JP6430809B2 (ja) * | 2014-12-19 | 2018-11-28 | 公立大学法人奈良県立医科大学 | 血液検体を判定するための方法、システム及びコンピュータプログラム、並びに血液検体分析装置 |
| JP6871673B2 (ja) * | 2015-03-31 | 2021-05-12 | 学校法人東日本学園 | 血液検体を判定するための方法、装置及びコンピュータプログラム、並びに血液検体分析装置 |
| CN107533071A (zh) * | 2015-04-24 | 2018-01-02 | 公立大学法人奈良县立医科大学 | 血液受试体的凝固能力的评价方法、以及用于在该方法中使用的试剂、试剂盒及装置 |
| JP7101351B2 (ja) * | 2016-04-28 | 2022-07-15 | シスメックス株式会社 | 血液検体の分析方法、血液検体分析用試薬及び試薬キット、並びに血液検体分析装置 |
| JP6793916B2 (ja) | 2016-07-28 | 2020-12-02 | 公立大学法人奈良県立医科大学 | 血友病の重症度の判定方法及び血液検体分析装置 |
| JP7002718B2 (ja) | 2017-04-24 | 2022-02-10 | シスメックス株式会社 | 血液検体の分析方法、分析装置及びコンピュータプログラム |
| WO2020101025A1 (ja) | 2018-11-15 | 2020-05-22 | 積水メディカル株式会社 | 分析方法、分析装置及び分析プログラム |
-
2021
- 2021-03-19 JP JP2021046534A patent/JP7665365B2/ja active Active
-
2022
- 2022-03-10 EP EP22161327.6A patent/EP4060348A3/de active Pending
- 2022-03-18 US US17/698,144 patent/US12436157B2/en active Active
Patent Citations (2)
| Publication number | Priority date | Publication date | Assignee | Title |
|---|---|---|---|---|
| US10048249B2 (en) | 2016-02-29 | 2018-08-14 | Sysmex Corporation | Blood coagulation analyzer and blood coagulation analyzing method |
| WO2020158948A1 (ja) | 2019-01-31 | 2020-08-06 | 積水メディカル株式会社 | 血液検体の血液凝固特性の分析方法 |
Also Published As
| Publication number | Publication date |
|---|---|
| US20220299534A1 (en) | 2022-09-22 |
| JP2022145224A (ja) | 2022-10-03 |
| EP4060348A3 (de) | 2022-09-28 |
| JP7665365B2 (ja) | 2025-04-21 |
| US12436157B2 (en) | 2025-10-07 |
Similar Documents
| Publication | Publication Date | Title |
|---|---|---|
| EP3076173B1 (de) | Verfahren für blutprobenbestimmung und blutprobenanalysator | |
| JP6811975B2 (ja) | Aptt延長要因推定システム | |
| JP7235282B2 (ja) | 血液凝固機能の評価方法 | |
| EP3264096B1 (de) | Verfahren zur erfassung von informationen zum grund der verlängerung der koagulationszeit und vorrichtung zur durchführung des besagten verfahrens | |
| JP7712022B2 (ja) | 血液凝固反応の分析方法 | |
| JP7220055B2 (ja) | 血液凝固機能の評価方法 | |
| JP7594404B2 (ja) | 血液検体の分析方法、分析装置、および分析プログラム | |
| CN116917739A (zh) | 凝固时间延长因素的推断方法 | |
| JP6994528B2 (ja) | 血液検体を判定するための方法、装置及びコンピュータプログラム、並びに血液検体分析装置 | |
| JP7747410B2 (ja) | 血液凝固反応の検出方法 | |
| EP4060348A2 (de) | Analyseverfahren, analysevorrichtung, analysesystem und analyseprogramm zum analysieren einer blutungsneigung eines probanden | |
| US20240210425A1 (en) | Poor blood collection determination method, blood coagulation analysis method, and blood coagulation analysis system | |
| EP4160213A1 (de) | Verfahren, analysesystem, analysegerät und computerprogramm zur analyse der ursache zur verlängerung der koagulationszeit | |
| WO2025075088A1 (ja) | 血液凝固異常の要因の推定方法 | |
| EP4109098A1 (de) | Detektionsverfahren zur detektion des auftretens einer unspezifischen reaktion, analyseverfahren, analysator und detektionsprogramm zur detektion des auftretens einer unspezifischen reaktion | |
| JP7250103B2 (ja) | 血液検体を判定するための方法、装置及びコンピュータプログラム、並びに血液検体分析装置 | |
| EP4650782A1 (de) | Verfahren zur analyse der blutgerinnungsreaktion | |
| Tantanate | Performance Assessment of Sysmex® CA-104 for Screening Coagulogram Testing |
Legal Events
| Date | Code | Title | Description |
|---|---|---|---|
| PUAI | Public reference made under article 153(3) epc to a published international application that has entered the european phase |
Free format text: ORIGINAL CODE: 0009012 |
|
| STAA | Information on the status of an ep patent application or granted ep patent |
Free format text: STATUS: THE APPLICATION HAS BEEN PUBLISHED |
|
| PUAL | Search report despatched |
Free format text: ORIGINAL CODE: 0009013 |
|
| AK | Designated contracting states |
Kind code of ref document: A2 Designated state(s): AL AT BE BG CH CY CZ DE DK EE ES FI FR GB GR HR HU IE IS IT LI LT LU LV MC MK MT NL NO PL PT RO RS SE SI SK SM TR |
|
| AK | Designated contracting states |
Kind code of ref document: A3 Designated state(s): AL AT BE BG CH CY CZ DE DK EE ES FI FR GB GR HR HU IE IS IT LI LT LU LV MC MK MT NL NO PL PT RO RS SE SI SK SM TR |
|
| RIC1 | Information provided on ipc code assigned before grant |
Ipc: G01N 33/86 20060101AFI20220822BHEP |
|
| STAA | Information on the status of an ep patent application or granted ep patent |
Free format text: STATUS: REQUEST FOR EXAMINATION WAS MADE |
|
| 17P | Request for examination filed |
Effective date: 20230227 |
|
| RBV | Designated contracting states (corrected) |
Designated state(s): AL AT BE BG CH CY CZ DE DK EE ES FI FR GB GR HR HU IE IS IT LI LT LU LV MC MK MT NL NO PL PT RO RS SE SI SK SM TR |
|
| STAA | Information on the status of an ep patent application or granted ep patent |
Free format text: STATUS: EXAMINATION IS IN PROGRESS |
|
| 17Q | First examination report despatched |
Effective date: 20250321 |