EP2956945B1 - Multienergie-röntgenmikroskop-datenerfassungs- und bildrekonstruktionssystem sowie verfahren - Google Patents
Multienergie-röntgenmikroskop-datenerfassungs- und bildrekonstruktionssystem sowie verfahren Download PDFInfo
- Publication number
- EP2956945B1 EP2956945B1 EP14704421.8A EP14704421A EP2956945B1 EP 2956945 B1 EP2956945 B1 EP 2956945B1 EP 14704421 A EP14704421 A EP 14704421A EP 2956945 B1 EP2956945 B1 EP 2956945B1
- Authority
- EP
- European Patent Office
- Prior art keywords
- energy
- sample
- low
- volume data
- data set
- Prior art date
- Legal status (The legal status is an assumption and is not a legal conclusion. Google has not performed a legal analysis and makes no representation as to the accuracy of the status listed.)
- Active
Links
Images







Classifications
-
- G—PHYSICS
- G21—NUCLEAR PHYSICS; NUCLEAR ENGINEERING
- G21K—HANDLING OF PARTICLES OR IONISING RADIATION NOT OTHERWISE PROVIDED FOR; IRRADIATION DEVICES; GAMMA RAY OR X-RAY MICROSCOPES
- G21K7/00—Gamma- or X-ray microscopes
-
- G—PHYSICS
- G01—MEASURING; TESTING
- G01N—INVESTIGATING OR ANALYSING MATERIALS BY DETERMINING THEIR CHEMICAL OR PHYSICAL PROPERTIES
- G01N23/00—Investigating or analysing materials by the use of wave or particle radiation, e.g. X-rays or neutrons, not covered by groups G01N3/00 – G01N17/00, G01N21/00 or G01N22/00
- G01N23/02—Investigating or analysing materials by the use of wave or particle radiation, e.g. X-rays or neutrons, not covered by groups G01N3/00 – G01N17/00, G01N21/00 or G01N22/00 by transmitting the radiation through the material
- G01N23/04—Investigating or analysing materials by the use of wave or particle radiation, e.g. X-rays or neutrons, not covered by groups G01N3/00 – G01N17/00, G01N21/00 or G01N22/00 by transmitting the radiation through the material and forming images of the material
- G01N23/046—Investigating or analysing materials by the use of wave or particle radiation, e.g. X-rays or neutrons, not covered by groups G01N3/00 – G01N17/00, G01N21/00 or G01N22/00 by transmitting the radiation through the material and forming images of the material using tomography, e.g. computed tomography [CT]
-
- A—HUMAN NECESSITIES
- A61—MEDICAL OR VETERINARY SCIENCE; HYGIENE
- A61B—DIAGNOSIS; SURGERY; IDENTIFICATION
- A61B6/00—Apparatus or devices for radiation diagnosis; Apparatus or devices for radiation diagnosis combined with radiation therapy equipment
- A61B6/48—Diagnostic techniques
- A61B6/482—Diagnostic techniques involving multiple energy imaging
-
- G—PHYSICS
- G06—COMPUTING OR CALCULATING; COUNTING
- G06F—ELECTRIC DIGITAL DATA PROCESSING
- G06F3/00—Input arrangements for transferring data to be processed into a form capable of being handled by the computer; Output arrangements for transferring data from processing unit to output unit, e.g. interface arrangements
- G06F3/01—Input arrangements or combined input and output arrangements for interaction between user and computer
- G06F3/048—Interaction techniques based on graphical user interfaces [GUI]
- G06F3/0484—Interaction techniques based on graphical user interfaces [GUI] for the control of specific functions or operations, e.g. selecting or manipulating an object, an image or a displayed text element, setting a parameter value or selecting a range
- G06F3/04842—Selection of displayed objects or displayed text elements
-
- G—PHYSICS
- G06—COMPUTING OR CALCULATING; COUNTING
- G06T—IMAGE DATA PROCESSING OR GENERATION, IN GENERAL
- G06T12/00—Tomographic reconstruction from projections
- G06T12/20—Inverse problem, i.e. transformations from projection space into object space
-
- G—PHYSICS
- G06—COMPUTING OR CALCULATING; COUNTING
- G06T—IMAGE DATA PROCESSING OR GENERATION, IN GENERAL
- G06T5/00—Image enhancement or restoration
- G06T5/40—Image enhancement or restoration using histogram techniques
-
- G—PHYSICS
- G06—COMPUTING OR CALCULATING; COUNTING
- G06T—IMAGE DATA PROCESSING OR GENERATION, IN GENERAL
- G06T5/00—Image enhancement or restoration
- G06T5/50—Image enhancement or restoration using two or more images, e.g. averaging or subtraction
-
- A—HUMAN NECESSITIES
- A61—MEDICAL OR VETERINARY SCIENCE; HYGIENE
- A61B—DIAGNOSIS; SURGERY; IDENTIFICATION
- A61B6/00—Apparatus or devices for radiation diagnosis; Apparatus or devices for radiation diagnosis combined with radiation therapy equipment
- A61B6/02—Arrangements for diagnosis sequentially in different planes; Stereoscopic radiation diagnosis
- A61B6/03—Computed tomography [CT]
-
- A—HUMAN NECESSITIES
- A61—MEDICAL OR VETERINARY SCIENCE; HYGIENE
- A61B—DIAGNOSIS; SURGERY; IDENTIFICATION
- A61B6/00—Apparatus or devices for radiation diagnosis; Apparatus or devices for radiation diagnosis combined with radiation therapy equipment
- A61B6/52—Devices using data or image processing specially adapted for radiation diagnosis
-
- G—PHYSICS
- G01—MEASURING; TESTING
- G01N—INVESTIGATING OR ANALYSING MATERIALS BY DETERMINING THEIR CHEMICAL OR PHYSICAL PROPERTIES
- G01N2223/00—Investigating materials by wave or particle radiation
- G01N2223/40—Imaging
- G01N2223/419—Imaging computed tomograph
-
- G—PHYSICS
- G01—MEASURING; TESTING
- G01N—INVESTIGATING OR ANALYSING MATERIALS BY DETERMINING THEIR CHEMICAL OR PHYSICAL PROPERTIES
- G01N2223/00—Investigating materials by wave or particle radiation
- G01N2223/40—Imaging
- G01N2223/423—Imaging multispectral imaging-multiple energy imaging
-
- G—PHYSICS
- G06—COMPUTING OR CALCULATING; COUNTING
- G06T—IMAGE DATA PROCESSING OR GENERATION, IN GENERAL
- G06T15/00—Three-dimensional [3D] image rendering
- G06T15/08—Volume rendering
Definitions
- High resolution x-ray imaging systems also known as X-ray imaging microscopes (“XRM”)
- XRM X-ray imaging microscopes
- XRMs provide high-resolution/high magnification, non-destructive imaging of internal structures in samples for a variety of industrial and research applications, such as materials science, clinical research, and failure analysis to list a few examples.
- XRMs provide the ability to visualize features in samples without the need to cut and slice the samples.
- XRMs are part of the field of x-ray microscopy.
- XRMs are often used to perform computed tomography ("CT") scans of samples.
- CT scanning is the process of generating three dimensional tomographic volumes of the samples from a series of projections at different angles.
- XRMs often present these tomographic volumes in two-dimensional, cross-sectional images or "slices" of the three dimensional tomographic volume data set.
- the tomographic volumes are generated from the projection data using software reconstruction algorithms based on back-projection and other image processing techniques to reveal and analyze features within the samples.
- Operators select scanning parameters, such as x-ray energy value, exposure time, and filter settings, and direct the XRM to perform a CT scanning "run." For each run, the operator or an automatic loader installs the sample between an x-ray source and an x-ray detector system, and exposes the sample to a beam of x-rays. The XRM rotates the sample in the x-ray beam, and its detector system detects the x-rays that are transmitted through and modulated by the sample at each rotation angle.
- scanning parameters such as x-ray energy value, exposure time, and filter settings
- the sample absorbs or scatters some of the x-rays before passing through to the x-ray detector system.
- the x-ray detector system receives the attenuated photon flux of x-rays that pass through and are spatially modulated by the sample.
- the detector system creates an image representation, in pixels, of the x-ray photons that react with the detector system.
- X-ray absorption increases with sample density and thickness, and is also generally higher for elements within the sample that have a higher atomic number ("Z") in the periodic table.
- BKMs are written instructions for workflows that are written instructions for workflows that help the operator determine the optimum x-ray source voltage settings, beam pre-filter and detector settings associated with a particular sample.
- the resulting three-dimensional image representation of the sample after processing is also known as a reconstructed tomographic volume data set.
- Scanning parameters include variables such as the x-ray source voltage setting, exposure time, and source filter settings.
- XRM x-ray fluorescence
- XRF microscopy utilizes x-rays differently than does XRM. Operators use the secondary x-ray energy emission associated with XRF, or fluorescence, to uniquely identify individual atomic elements ("Z”) within the sample.
- the contrast mechanism for attenuation in the sample has two principal components in the x-ray energy range of interest called the photoelectric absorption component and the Compton scattering component.
- the photoelectric absorption process an x-ray is absorbed completely by a bound electron of an atom and ejects this electron from the atom.
- the Compton scattering process the incident x-ray loses part of its energy and gets redirected by scattering off an electron. The effects of both components contribute to the image in an XRM arising from attenuation of the illuminating x-ray beam.
- the relative strength of the photoelectric absorption and Compton scattering processes is a strong function of incident x-ray energy and the atomic number Z of the atom that interacts with the x-ray.
- the absorption due to the photoelectric effect generally dominates at lower energies and decays in strength inversely with the fourth power of the x-ray energy.
- the absorption due to the Compton scattering effect becomes dominant at higher energies and has a much slower decay with x-ray energy (inversely with first power of energy).
- the transition point between photoelectric and Compton scattering absorption is referred to as the "knee,” where the absorption changes from decaying inversely with the fourth power of the energy to the first power.
- This knee is a characteristic of the atomic number Z of the atom and increases with increasing Z.
- the change in x-ray absorption of a sample is a function of x-ray energy and atomic number. Samples containing materials with different atomic numbers will exhibit different absorption characteristics when subjected to x-rays at different energies. As a result, measurements of a sample taken at two distinct x-ray energies permit the separation of the sample's absorption characteristics, or x-ray attenuation, into its basic components. This type of measurement is known as "dual energy" (DE) scanning.
- DE dual energy
- the present invention provides a multi energy, such as dual-energy, x-ray imaging system data acquisition and image reconstruction system and method for combining separate reconstructed volumes taken at multiple energies and allowing the operator to manipulate and optimize the image contrast of a sample using the effects of DE. Operators use the system and method to achieve superior image quality and contrast over current XRM data acquisition and image reconstruction systems and methods, and to generate contrast based on the atomic number Z of the constituents of the sample.
- an operator uses the DE x-ray imaging system and its associated user interface applications to perform a low energy (“LE”) and high energy (“HE”) x-ray scan of the same or overlapping volume of interest of the sample.
- LE low energy
- HE high energy
- the system creates a separate low-energy reconstructed tomographic volume data set from the set of low-energy projections and a separate high-energy tomographic volume data set from the set of high-energy projections.
- the system subsequently performs a registration, zooming, and scaling step of the two separately reconstructed tomographic volumes to adjust for imperfections in the spatial stretch and relative position of the low-energy and high-energy tomographic datasets. This ensures the correlation of voxels in both datasets.
- the operator selects a desired slice of the tomographic volume that shows the features in which the operator is interested.
- the operator optimizes the image contrast of the combined (mixed) dual energy image of the selected slice using a two-dimensional histogram tool, for example.
- the two-dimensional histogram tool plots the intensity of pixels of the low energy slice against the intensity of pixels of the high energy slice.
- the intensity in the two dimensional histogram represents the number of voxels that fall into the corresponding histogram bin.
- the intensity is visualized by user-selectable color-maps that aid in the visibility and interpretation of the histogram.
- the user interactively selects one point within the two-dimensional histogram. This selected point is also known as the pivot point.
- the operator manipulates the slope of a line through the pivot point in the histogram to determine the mixing parameters for low-energy and high-energy scans.
- the pivot point does not affect the ratio of the low-energy and high-energy scans, but just the scaling of the output composite or synthetic slice.
- the slope of the line in the 2-D histogram determines the mixing ratio of LE and HE slices (i.e. the coefficients that are used to combine the LE and HE data).
- the same mixing operation associated with optimizing the contrast of the selected slice is applied to all slices in the low-energy and high-energy tomographic data sets. This creates a combined (mixed) volume data set from the LE and HE volume data sets with optimized image contrast throughout.
- the invention features a data acquisition and image reconstruction method for an x-ray imaging system.
- the method comprises performing a low-energy scan of a sample with an x-ray beam generated from an x-ray source using low-energy x-ray settings, performing a high-energy scan of the sample with an x-ray beam generated from an x-ray source using high-energy x-ray settings , generating a low-energy reconstructed tomographic volume data set from the low-energy scan, generating a high-energy reconstructed tomographic volume data set from the high-energy scan, registering, and preferably zooming and scaling the low-energy and high-energy tomographic data sets, rendering slice views from the low-energy and high-energy reconstructed tomographic volume data sets, and combining the low-energy and high-energy data.
- the data acquisition and image reconstruction method operates within an objective lens-based x-ray imaging system and a projection-based x-ray imaging system in different implementations.
- Low-energy and high-energy data acquisitions may be performed using different x-ray detectors, x-ray lenses, sources, targets, or source filters.
- the invention features a multi, such as dual, energy contrast tuning tool executing on a computer system of an x-ray imaging system, comprising: a low-energy window for displaying low-energy slices from a low-energy reconstructed tomographic volume data set, a high-energy window for displaying high-energy slices from a high-energy reconstructed tomographic volume data set, a slice selection window having a two-dimensional slice selection interactive graphic for selecting slices from the sample, a two-dimensional histogram showing voxel densities of low-energy versus high-energy pixel intensity values, a pivot point and line slope selection tool within the two-dimensional histogram tool, and a results window that displays synthetic (mixed) slices generated by combining the low-energy reconstructed tomographic volume data set and the high-energy reconstructed tomographic volume data set according to the pivot point and line slope selected in the two-dimensional histogram tool.
- an operator utilizes user interface applications on a computer system to interact with and control the XRM imaging system and its components, and to perform the data acquisition, image reconstruction, and contrast optimization of a sample.
- the computer system has a suite of applications, such as a Scout and Scan data acquisition application to select scanning parameters and create LE and HE tomographic volume data sets of a sample, and a DE Contrast Tuning Tool application to create a DE contrast-optimized volume data set from selected LE and HE tomographic volume data sets of the sample.
- the user interface applications display onto a display device attached to the computer system.
- the invention features a data acquisition and image reconstruction method for an x-ray imaging system, the method comprising: loading a sample on a sample holder of the x-ray imaging system, performing a low-energy scan by rotating the sample in a low energy x-ray beam from an x-ray source system of the x-ray imaging system, performing a high-energy scan by rotating the sample in a high energy x-ray beam from the x-ray source system, generating a low-energy reconstructed tomographic volume data set from the low-energy scan in a computer system, generating a high-energy reconstructed tomographic volume data set from the high-energy scan in the computer system, and rendering slice views from the low-energy and high-energy reconstructed tomographic volume data sets on a display device of the computer system.
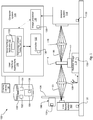
- Fig. 1 is a schematic diagram of a lens-based x-ray imaging system 100 ("lens-based system").
- the lens-based system 100 has an x-ray source system 102 that generates an x-ray beam 103, a filter changer mechanism 106 with a filter wheel 104 for filtering the x-ray beam 103, and a rotation stage 110 with sample holder 112 for holding the sample 114.
- a condenser 108 placed between the x-ray source system 102 and the sample 114 focuses the x-ray beam 103 onto the sample 114.
- the lens-based system 100 also has a detector system 118, and an objective lens 116 placed between the sample 114 and the detector system 118.
- the sample 114 absorbs and transmits x-ray photons associated with the x-ray beam 103.
- the x-ray photons transmitted through the sample form an attenuated x-ray beam 105, which the objective lens 116 images onto the detector system 118.
- the detector system 118 creates an image representation, in pixels, of the x-ray photons from the attenuated x-ray beam 105 that interact with the detector system 118.
- the image formed at the detector system 118 is also known as an x-ray projection, or an x-ray projection image.
- the lens-based system 100 also has a computer system 124 that includes an image processor 120, a controller 122, and user interface applications 126.
- a display device 136 connected to the computer system 124 displays information and graphical user interfaces from the user interface applications 126.
- the computer system 124 loads information from, and saves information to, a database 150 connected to the computer system 124.
- the controller 122 has a controller interface 130 that allows an operator to control and manage components in the lens-based system 100 under software control via the computer system 124.
- Operators utilize the user interface applications 126 to configure and manage components in the lens-based system 100 via the controller 122.
- User interface applications 126 include a scout and scan application 132 and a dual energy contrast tuning tool 134.
- the controller 122 controls components that have a controller interface 130.
- Components which have a controller interface 130 include the image processor 120, the detector system 118, the rotation stage 110, the x-ray source system 102, and the filter changer mechanism 106, in one implementation.
- the operator For selection of scanning parameters, the operator typically uses the scout and scan application 132 to configure an x-ray voltage setting and exposure time on the x-ray source system 102, and a filter setting of the filter wheel 104 of the filter changer mechanism 106.
- the operator also selects other settings such as the field of view of the x-ray beam 103 incident upon the sample 114, the number of x-ray projection images or slices to create for the sample 114, and the angles to rotate the rotation stage 110 for rotating the sample 114 in the x-ray beam 103.
- the operator performs at least a low-energy scan and a high-energy scan of the sample 114.
- the operator chooses scanning parameters associated with known x-ray absorption coefficients for compounds in the sample 114 for the low-energy and high-energy scans.
- the x-ray source system 102 generates the low-energy x-ray beam using a low energy x-ray source and generates the high-energy x-ray beam using a high energy x-ray source.
- the x-ray source system generates the low-energy x-ray beam using a low energy setting for an x-ray source and generates the high-energy x-ray beam using a high energy setting of the x-ray source system.
- the filters are used so that the x-ray source system generates the low-energy x-ray beam using a low energy filter for an x-ray source and generates the high-energy x-ray beam using a high energy filter of the x-ray source.
- different x-ray source anode targets are used so that the x-ray source system generates the low-energy x-ray beam using a low energy anode target for an x-ray source and generates the high-energy x-ray beam using a high energy anode target of the x-ray source.
- the x-ray source system can generate the low-energy x-ray beam using a low energy exposure time for an x-ray source and generate the high-energy x-ray beam using a high energy exposure of the x-ray source.
- the low-energy exposure times and high-energy exposure times are different from each other and are chosen to produce datasets with sufficient signal-to-noise ratio.
- Some settings can vary between the low-energy and high-energy scans. Certain settings, however, such as the field of view and the start and end angles, must be identical or at least overlapping for the low-energy and high-energy scans. These settings are helpful for subsequent alignment and registration of the low-energy and high -energy reconstructed tomographic data sets created by their respective scans. This is a requirement for the image optimization method 900 of Fig. 9 , discussed in the detailed description associated with Fig. 9 appearing later in this document.
- the scout and scan application 132 has one or more dual energy templates 133.
- the scout and scan application 132 provides different dual energy templates 133 depending on the types of the sample 114.
- the dual energy templates 133 provide the same settings between the low-energy and high-energy scans required by the image optimization method 900 of Fig. 9 , while allowing the operator to choose scanning parameters and other settings specific to the low-energy and high-energy scans.
- the operator defines the same field of view and the same start and end angles for the low-energy and high-energy scans.
- the operator then defines the scanning parameters associated with the low-energy and high-energy scans, and defines other settings that can vary between the scans, such as the number of projections.
- the dual energy templates 133 then provide the configuration to perform the low-energy and high-energy scans of the sample 114.
- the image processor 120 receives and processes each projection from the detector system 118.
- the scout and scan application 132 saves the projections from the image processor 120 to later generate a reconstructed tomographic volume data set of the sample 114.
- the computer system 124 saves the tomographic data sets from each scan, and their associated scanning parameters and settings, to local storage on the computer system 124, or to the database 150.
- the computer system saves a low-energy tomographic volume data set 152 for the low-energy scan, and a high-energy tomographic volume data set 154 for the high-energy scan, to local storage or to the database 150 after their calculation.
- the operator uses the dual energy contrast tuning tool 134 for optimizing the image contrast of the sample 114.
- the operator loads the low-energy tomographic volume data set 152 and high-energy tomographic volume data set 154.
- the operator selects a slice within the datasets, and selects information for optimizing the image contrast of the selected slice.
- the operator then applies this information to optimize the image contrast and create a combined or synthetic volume data set 156.
- the combined volume data set 156 contains slices with optimized image contrast, the combined volume data set 156 is also referred to as an optimized combined volume data set.
- the operator optionally uses use the dual energy contrast tuning tool 134 to calculate optimum single-scan parameters 158 from the scanning parameters associated with the creation of the combined volume data set 156. This is especially useful if the operator intends to perform runs against several samples to produce the same approximate contrast results. In this way, the operator can apply the optimum single-scan parameters 158 to the lens-based system 100 to perform a subsequent single-energy scan of the same sample 114, or of a new sample with similar elemental composition.
- Fig. 2 is a schematic diagram of a projection-based x-ray imaging system 200 ("projection-based system") according to another embodiment of the present invention.
- the projection-based system 200 is similar in structure to the lens-based system 100 and has nearly identical behavior but is typically lower performance in terms of magnification levels.
- the projection-based system 200 eliminates the condenser 108 and objective lens 116 of the lens-based system 100. Otherwise, the projection-based system 200 has the same components as the lens-based system 100, and operators utilize the projection-based system 200 and its components in an identical fashion to the lens-based system 100 for creating x-ray projections and reconstructed tomographic volume data sets of the sample 114.
- the projection-based system 200 does not rely on lenses to create a magnified transmission image of the sample 114. Instead it creates a magnified point projection image of the sample 114 by utilizing a small x-ray source spot of the x-ray source 102 projected on the detector system 118.
- the magnification is achieved by positioning the sample 114 close to the x-ray source 102, in which case the resolution of the projection based system 200 is limited by the spot size of the x-ray source.
- a magnified projection image of the sample 114 is formed on the detector system 118 with a magnification that is equal to the ratio of the source-to-sample distance 202 and the source-to-detector distance 204.
- Another way to achieve high resolution in the projection-based system 200 is to employ a very high resolution detector system 118 and to position the sample 114 close to the detector, in which case the resolution of the x-ray image is limited by the resolution of the detector system 114.
- the operator For adjusting the magnification of the image, the operator utilizes the user interface applications 124 on the computer system 124 to adjust the source-to-sample distance 202 and the source-to-detector distance 204. The operator adjusts these distances, and achieves the desired magnification, by moving the rotation stage 100 via the controller 122.
- the x-ray detector system 118 also provides the ability to adjust the field of view on the sample by changing the pixel size within the x-ray detector system 118, according to some implementations.
- Fig. 3A is a scale top view of a filter changer mechanism 106 as employed in the lens-based system 100 in in Fig. 1 and the projection-based system 200 in Fig. 2 .
- Filter changer mechanism 106 has a filter wheel 104 that holds filters in each of the circular ports 104-1 arrayed around the periphery of the wheel.
- Figs. 3B and Fig. 3C are scale front and side views of the filter changer mechanism 10.
- the filter changer mechanism 106 features a fine adjustment control mechanism 302 for improved stability and placement accuracy of the filter wheel 104.
- the filter wheel 104 has the ports 104-1 that typically include filters for filtering the x-ray beam 103. Operators select different filters under software control using the user interface applications 126 and the controller 122 of the computer system 124 in Fig. 1 and Fig. 2 .
- the controller 122 In response to operator selection of a filter associated with an aperture 104-1, the controller 122 signals the filter changer mechanism 106 to rotate the filter wheel 104 to the aperture 104-1 in response to the selection.
- the filter changer mechanism 106 In response to operator selection of a filter associated with an aperture 104-1, the controller 122 signals the filter changer mechanism 106 to rotate the filter wheel 104 to the aperture 104-1 in response to the selection.
- the lens-based system 100 in in Fig. 1 and the projection-based system 200 in Fig. 2 transmit the x-ray beam 103, the x-ray beam 103 passes through the filter associated with the selected aperture 104-1.
- the filter changer mechanism 106 is shown between the source 102 and sample 114. In other examples, the filter changer mechanism 106 is located between the sample 114 and detector system 118.
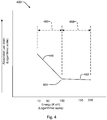
- the absorption plots 400 of low-Z elements have a LE absorption section 480 and a HE absorption section 482, separated by a knee or inflection point 484.
- the LE absorption section 480 is associated with applied x-ray energy in the LE scan range 486, and the HE absorption section 482 is associated with applied x-ray energy in the HE scan range 488.
- the LE absorption section 480 scales inversely with Z ⁇ 4 over the LE scan range 486, and the HE absorption section 482 scales inversely linearly with Z over the HE scan range 488.
- the x-ray absorption in the LE absorption section 480 is typically attributable to absorption associated with the photoelectric effect, whereas the x-ray absorption in the HE absorption section 482 is typically attributable to Compton scattering.
- the x-ray energy associated with the knee 484 of their absorption plots 400 increases with increasing Z.
- the absorption plots 400 for high-Z elements have a less-discernible knee to that of low-Z elements.
- Their LE scan ranges 486 and HE scan ranges 488 increase with increasing Z, and K-edge absorption transitions become more of a factor.
- the DE x-ray imaging techniques also apply to high-Z elements, such as Gold and Iodine, by using scanning parameters and filters specific to each element that limit or utilize the effect of K-edges in their absorption plots 400.
- Fig. 5 illustrates the graphical user interface 500 from the dual energy contrast tuning tool 134, displaying exemplary optimized contrast information associated with a sample.
- the dual energy contrast tuning tool 134 has a high energy window 404 for selection and display of a slice from a high-energy tomographic volume data set 154 of a sample, and a low energy window 406 for selection and display of a slice from a low-energy tomographic volume data set 152 of the same sample.
- the high-energy tomographic volume data set 154 and the low-energy tomographic volume data set 152 were generated using the x-ray imaging systems in Fig. 1 and Fig. 2 .
- the high energy window 404 has a high energy tomographic volume data set selector 430
- the low energy window 406 has a low energy tomographic volume data set selector 434.
- the operator uses the high energy tomographic volume data set selector 430 to open a file browser dialog for selection of a high energy tomographic volume data set 154 on the computer system 124 or on the database 156.
- the operator uses the low energy tomographic volume data set selector 434 to open a file browser dialog for selection of a low energy tomographic volume data set 152 on the computer system 124 or on the database 156.
- the dual energy contrast tuning tool 134 also has a slice selection window 408, a 2-D histogram window 410, a results window 412 that displays a synthetic or optimized slice image 460, and a log window 414.
- the slice selection window 408 has an interactive graphic 423 for displaying an operator-selected slice from the low energy tomographic volume data set 152 and the high energy tomographic volume data set 154.
- the interactive graphic 423 has a slice selection display 421.
- the slice selection window 408 has a slice selector slider bar 420, and a slice number indicator 418.
- the 2-D histogram window 410 includes a 2-D histogram 429 showing voxel or pixel intensities resulting from the plot of the pixel intensities for the LE slice 431 versus the pixel intensities of the HE slice 432.
- An operator uses the 2-D histogram window 410 to interactively determine the mixing parameters of the LE slice 432 and HE slice 431.
- the operator interactively determines the mixing parameters of the LE slice 432 and HE slice 431 by selecting a pivot point 427 and angle within the 2-D histogram 429.
- the 2-D histogram window 410 draws the slope of a line 714 through the pivot point 427 at the angle within the 2-D histogram 429.
- the pivot point does not affect the ratio of the low-energy and high-energy scans, but just the scaling of the output composite or synthetic slice.
- the slope of the line in the 2-D histogram 429 determines the mixing ratio of LE and HE slices (i.e. the coefficients that are used to combine the LE and HE data).
- the operator chooses the angle via an angle selector slider bar 422, and an angle number indicator 424 reflects the value of the angle selected in degrees.
- the pivot point 427 is selected by clicking on a point within the 2-D histogram.
- the shown brightness or intensity in the 2-D histogram 429 is a measure of the number of voxels in the slice with given pixel intensity of the LE slice 432 versus HE slice 431 pixel intensities.
- the 2-D histogram intensity is displayed with user selectable color maps that determine the colors representing different intensities.
- the 2-D histogram densities are scaled logarithmically to make sure even single pixels can be seen as points on the 2-D histogram 429 to ensure that data that corresponds to small features on the slice is still visible.
- the operator uses the distribution of pixels on the 2-D histogram as a starting guide to select the pivot and angle of the line 714.
- the results window 412 displays a synthetic slice 460 computed through settings of the line 714 in the 2-D histogram window 410.
- the log window 414 displays log information 415 associated with the operations of the dual energy contrast tuning tool 134.
- the computer system 124 auto-aligns, registers, and scales the high energy tomographic volume data set 154 and the low-energy tomographic volume data set 152 with each other, and in magnification, in response to the selections.
- the operator uses the slice selection window 408 to select a slice within the high energy tomographic volume data set 154 and the low-energy tomographic volume data set 152.
- the slice selector slider bar 420 with the aid of the interactive graphic 423, the operator selects a slice, and the slice selection display 421 of the interactive graphic provides a visual indicator of the selected slice relative to the total number of slices available.
- the slice number indicator 418 also displays the slice number of the selected slice.
- the selected slice is an abstraction or device used by the dual energy contrast tuning tool 134 to select a common slice within the high energy tomographic volume data set 154 and the low-energy tomographic volume data set 152.
- the computer system 124 uses the information associated with the selected slice to compute the 2-D histogram 429 of high-energy pixel intensity versus low-energy pixel intensity values for the selected slice.
- the points displayed on the 2-D histogram 429 form visually-distinct clusters of pixel densities associated with elements in the sample for the selected slice.
- the operator selects a pivot point of interest and angle within the histogram, and the computer system 124 computes the synthetic slice image 460 using the information associated with the point and angle selections. This is discussed in more detail in in the detailed description associated with the exemplary histogram 800 in Fig. 8 , appearing later in this document.
- the high energy window 404 displays a high-energy (“HE") slice 431 from the high-energy tomographic volume data set 154 associated with the slice selection
- the low energy window 406 displays a low-energy (“LE”) slice 432 of the low-energy tomographic volume data set 152 associated with the slice selection.
- the computer system 124 automatically creates the histogram 429, and the 2-D histogram window 410 displays the histogram 429, in response to the slice selection.
- the 2-D histogram window 410 has an angle selection slider bar 422, and an angle number indicator 424.
- the operator selects a point of interest, or pivot point 427 within the histogram 429 for image contrast optimization of the selected slice.
- the angle selection slider bar 422 becomes operable.
- the operator selects an angle within the histogram 429, and the angle number indicator 424 displays the angle, in degrees, in response to the angle selection.
- the computer system 124 draws a ratio calculation line 714 through the operator-selected point of interest 427 and angle in the histogram 429.
- the ratio calculation line 714 is a visual aid to the operator to display the ratio between the high-energy pixel intensity versus the low-energy pixel intensity information that the computer system 124 will use from the 2-D histogram 429 when optimizing the selected slice.
- the results window 412 displays the synthetic slice 460 that the computer system 124 calculates in response to the operator-selected point of interest 427 and angle in the 2-D histogram 429.
- the computer system 124 computes a new histogram 429 for the selected slice, and the 2-D histogram window 410 displays the 2-D histogram 429, and the results window 412 displays a synthetic slice 460 in response to the operator-selected point of interest 427 and angle in the 2-D histogram 429.
- the synthetic slice 460 is a contrast-optimized slice. Once the operator is satisfied with the synthetic slice 460, the operator selects the save button 463 to apply the image contrast information associated with the synthetic slice 460 to all slices in the high energy tomographic volume data set 154 and the low-energy tomographic volume data set 152, creating a new, combined tomographic volume data set. Because the combined volume data set is generated using contrast information associated with the synthetic slice 460, the combined volume data set is also known as an optimized combined tomographic volume data set 156. The computer system 124 saves the optimized combined tomographic volume data set 156 to local storage, or to the database 156.
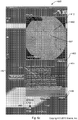
- Fig. 6a is a magnified view 600 of the dual energy contrast tuning tool in Fig. 5 , showing details of the low energy window 406 and the high energy window 404.
- the high energy window 404 also has a high energy filename indicator 490 that displays the filename associated with the selected high energy tomographic volume data set 154.
- the high energy window 404 also displays high-energy scanning parameters 502 overlaid upon the high energy slice 431.
- the low energy window 406 also has a low energy filename indicator 492 that displays the filename associated with the selected low energy tomographic volume data set 152.
- the low energy window 406 also displays high-energy scanning parameters 504 overlaid upon the low energy slice 432.
- Fig. 6b is a magnified view 620 of the dual energy contrast tuning tool 134 in Fig. 5 , showing details of the slice selection window 408 and the histogram window 410.
- the slice selection window 408 also has slice selection buttons 417-1 and 417-2 that increment and decrement, respectively, the slice selection.
- the number of the selected slice displayed on the slice number indicator 418 updates in response to the selection
- the slice selection display 421 of the interactive graphic 423 updates in response to the selection
- the slice selection slider bar 420 updates in response to the selection.
- the histogram window 410 also has angle selector buttons 428-2 and 428-1 that increment and decrement, respectively, the selected angle in the histogram 429.
- the angle displayed on the angle number indicator 424 updates in response to the selection, and the angle selection slider bar 422 updates in response to the selection.
- the histogram window 410 also has zoom in/out buttons 425 for magnifying portions of the histogram 429 displayed in the histogram window 410. This allows the operator to visualize individual points within the histogram 429 for selection of the point of interest 427.
- Fig. 6c is a magnified view 660 of the dual energy contrast tuning tool 134 in Fig. 5 , showing details of the results window and the log window during optimal single scan parameter selection.
- the results window displays the synthetic slice associated with the optimization actions the operator performs within the histogram 429 in the histogram window 410.
- the results window 460 enables the user to select an optimized point 562 on the synthetic slice 460.
- the computer system 124 creates optimum single-scanning parameters that the operator can apply to the same sample, or to a new sample with similar elemental composition.
- the dual energy contrast tuning tool 134 enables selection of a create optimum single scan parameters button 452.
- the computer system creates optimum single scanning parameters associated with the optimized point 562 in response to the selection.
- the computer computes the scan settings for the optimum single scan to approximate the contrast in the optimized point 562 as well as possible. This is accomplished by comparing transmission values through the optimized point 562 in the LE and HE data sets and picking the optimized single scan values from a look up table.
- the dual energy contrast tuning tool 134 also has an annotation palette 560 for performing statistical operations, and zooming in/out of a selected window.
- the log window also has a log button 561 for enabling the display of log information 415 in the log window 414.
- the dual energy contrast tuning tool 134 also has an exit button 496 for exiting the dual energy contrast tuning tool 134.
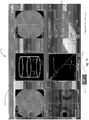
- Fig. 7a-7c illustrate the dual energy contrast tuning tool 134, displaying exemplary optimized contrast information associated with a sample containing Platinum and Lead, with selected contrast optimization angles of 153 degrees, 137 degrees, and 115 degrees, respectfully.
- the figures illustrate the separation of lead from platinum in a calibration sample through selection of the correct pivot point 427 and angle.
- the contrast information of the synthetic slice 460 changes in response to the selection, with the different particles changing from black to white.
- angle number indicator 424-2 is a magnified version of angle number indicator 424-1 for improved visibility.
- the computer system 124 draws the ratio calculation line 714 through the selected point of interest or pivot point 427 and selected angle.
- Fig. 7d illustrates the dual energy hover tool 770 within the context of the dual energy contrast tuning tool 134.
- the dual energy hover tool 770 provides real-time correlation between the images shown in the LE window 404, the HE window 406, the results window 412 and the 2-D histogram window 410.
- pointer icon 780 points to the location where the operator directs a pointing device hover operation.
- the location is a point in the HE slice 431.
- a selection of a point during a mouse hover event is also known as an indication.
- the dual energy hover tool 770 calculates and highlights the LE slice associated points 782-1, the 2-D histogram associated point 782-2, and the synthetic slice associated point 782-3.
- the operator indicates a point in the 2-D histogram 429 corresponding to one combination of LE and HE voxel intensities.
- the operator indicates a point in the 2-D histogram 429 corresponding to one combination of LE and HE voxel intensities.
- all voxels in the LE slice 432, the HE slice 431 and the synthetic slice 460 that have the corresponding LE and HE intensities will be highlighted. This allows the operator to localize different constituents from the 2-D histogram 429 in the image data.
- Fig. 8 schematically illustrates an exemplary 2-D histogram 429 of high-energy x-ray absorption versus low-energy x-ray pixel intensities for a sample 114 having two constituents with different effective atomic number Z in addition to air.
- the 2-D histogram 429 displays information associated with three visually-distinct clusters of pixel intensities associated with x-ray absorption of three materials: an air pixel intensity cluster 706, a low-Z element pixel intensity cluster 702, and a high-Z element pixel intensity cluster 704.
- the operator selects a pivot point 427 and angle within the 2-D histogram 429, and the computer system 124 draws the ratio calculation line 714 through the pivot point 427 and angle selection indicated by the angle number indicator 424.
- the ratio calculation line 714 provides the ratio of high-energy to low-energy pixel intensity for the computer system 124 to use when creating the synthetic slice 460 for the operator-selected slice in the slice selection window 408.
- the operator uses the pivot point 427 and angle selection to isolate properties in the sample 114.
- the operator wishes to provide separation between a low-Z element associated with the low-Z pixel intensity cluster 702, and a high-Z element associated with the high-Z element pixel intensity cluster 704.
- Each point on the pixel intensity clusters is a voxel 712.
- the color of the points on the 2-D histogram 429 is a measure of how many voxels are in this bin (i.e. which voxels have the same LE and the same HE x-ray pixel intensity values).
- the 2-D histogram window 410 uses an offset logarithmic scale when displaying the 2-D histogram 429 to make sure even single pixels show up in the 2-D histogram 429 as recognizable points.
- the computer system 124 calculates the synthetic slice 460 from the pivot point 427 and angle selection within the 2-D histogram 429. Specifically, the computer system 124 iterates over all voxels 712 in the 2-D histogram 429, and calculates voxel offset 716, or distance between the voxel 712 and the ratio calculation line 714 in the 2-D histogram 429, for each voxel 712.
- the voxel offset 716 is counted positive if the voxel 712 lies on one side of the ratio calculation line 714, and negative if the voxel 712 lies on the opposite side of the ratio calculation line 714. From the set of voxel offsets 716, the computer system 124 creates the synthetic slice 460.
- the computer system 124 When the computer system 124 saves the synthetic slice 460, the computer system 124 also saves other related information, including the 2-D histogram 429, a binary mask image containing 0 and 1 values, where 0 and 1 represent the separation of voxels from the line (on side or the other), a registered LE image multiplied with the binary mask, a registered HE image multiplied with the binary mask, and the high energy tomographic volume data set 154 and the low-energy tomographic volume data set 152.
- the 2-D histogram 429 a binary mask image containing 0 and 1 values, where 0 and 1 represent the separation of voxels from the line (on side or the other)
- a registered LE image multiplied with the binary mask a registered HE image multiplied with the binary mask
- the high energy tomographic volume data set 154 and the low-energy tomographic volume data set 152 the high energy tomographic volume data set 154 and the low-energy tomographic volume data set 152.
- Additional datasets are also known as associated tomographic data sets, because they are associated with the creation of and manipulation upon the optimized combined tomographic volume data set 156.
- An operator uses these additional datasets in subsequent image analysis to, in one example, isolate one material from the optimized combined tomographic volume data set 156.
- Fig. 9 is a flow diagram showing a method 900 for data acquisition and image reconstruction for an x-ray imaging system ("x-ray imaging system") according to principles of the present invention.
- the operator determines the x-ray tomography settings for low-energy (“LE”) scan and ("HE") high-energy scan based on estimated composition of the sample.
- the operator selects a filter and/or exposure time for LE scan and specifies the LE voltage setting on x-ray source system.
- the operator acquires a tomographic data set (projections) at LE settings for volume of interest of the sample.
- the x-ray imaging system generates the LE tomographic volume data set from the LE projections.
- the operator utilizes the x-ray imaging system to perform a high-energy scan of the same sample.
- the operator selects a filter and/or exposure time for HE scan and specify HE voltage setting on the x-ray source system.
- the x-ray imaging system acquires the tomographic data set (projections) at HE settings for same volume of interest of the sample as that selected for LE settings.
- the x-ray imaging system generates the HE tomographic volume data set from the HE projections.
- the operator saves the HE and LE tomographic volume data sets.
- the operator either performs the HE and LE scans separately, or uses the scout and scan application to perform the scans sequentially.
- step 920 the operator opens the dual energy contrast tuning tool, and in step 922 loads the LE and HE tomographic volume data sets.
- step 923 the computer system aligns and registers the LE and HD tomographic volume data sets with each other and in magnification to achieve pixel-by-pixel registration.
- step 924 the operator selects a slice within the LE and HE tomographic volume data sets.
- step 926 the computer system creates and displays a histogram of HE x-ray pixel intensity values vs LE x-ray pixel intensity values based on the selected slice.
- step 928 the operator selects a pivot point and angle on the histogram to calculate ratio of HE to LE to use, and create a synthetic slice.
- step 930 the operator views the synthetic slice, and in step 932, if the desired image contrast has been achieved, the operator proceeds to step 934 to apply angle and pivot point to all slices in LE and HD tomographic volume datasets and saves the optimized combined tomographic volume data set 156. Otherwise, the operator repeats step 930 and step 932 until the desired image contrast has been achieved.
- the operator selects a point on the synthetic slice for information associated with its image contrast optimization, and computes optimal single-scan parameters and performs an optimal scan in step 938.
- Fig. 10a is a flow diagram showing detail for step 902 within the flow chart of Fig. 9 , for determining the x-ray tomography settings for low-energy (“LE”) scan and ("HE") high-energy scan based on estimated sample composition.
- the operator selects the appropriate dual-energy template associated with the sample on the Scout and Scan application.
- the operator position and sizes the Field of View ("FOV") of the x-ray beam incident upon the sample to identical values for LE and HE scans.
- FOV Field of View
- the operator selects the number of projections and angles for LE and HE scans.
- Fig. 10b is a flow diagram showing detail for step 938 within the flow chart of Fig. 9 , for calculating optimum single scan parameters according to principles of the present invention.
- the computer system determines the x-ray tomography settings for optimum single-scan settings based on estimated sample composition and acquisition settings of the HE and LE scans.
- the operator verifies the filter, exposure time, and optimum voltage settings for the optimum single scan.
- the x-ray imaging system acquires the tomographic data set (projections) at optimum single-scan settings for the volume of interest of the sample.
- x-ray imaging system generates an optimum single-scan tomographic volume data set from the optimum single-scan projections.
Landscapes
- Engineering & Computer Science (AREA)
- Physics & Mathematics (AREA)
- Health & Medical Sciences (AREA)
- Theoretical Computer Science (AREA)
- General Physics & Mathematics (AREA)
- Life Sciences & Earth Sciences (AREA)
- General Engineering & Computer Science (AREA)
- General Health & Medical Sciences (AREA)
- Nuclear Medicine, Radiotherapy & Molecular Imaging (AREA)
- Radiology & Medical Imaging (AREA)
- Pathology (AREA)
- High Energy & Nuclear Physics (AREA)
- Pulmonology (AREA)
- Immunology (AREA)
- Analytical Chemistry (AREA)
- Biochemistry (AREA)
- Chemical & Material Sciences (AREA)
- Medical Informatics (AREA)
- Human Computer Interaction (AREA)
- Biophysics (AREA)
- Molecular Biology (AREA)
- Surgery (AREA)
- Animal Behavior & Ethology (AREA)
- Public Health (AREA)
- Heart & Thoracic Surgery (AREA)
- Veterinary Medicine (AREA)
- Biomedical Technology (AREA)
- Optics & Photonics (AREA)
- Analysing Materials By The Use Of Radiation (AREA)
- Apparatus For Radiation Diagnosis (AREA)
- Algebra (AREA)
- Mathematical Physics (AREA)
- Pure & Applied Mathematics (AREA)
- Mathematical Optimization (AREA)
- Mathematical Analysis (AREA)
Claims (28)
- Röntgenbildgebungssystem, das Folgendes umfasst:ein Röntgenquellensystem zum Erzeugen eines hochenergetischen Röntgenstrahls und eines niederenergetischen Röntgenstrahls;einen Probenhalter zum Drehen einer Probe in dem hochenergetischen Röntgenstrahl und dem niederenergetischen Röntgenstrahl des Röntgenquellensystems, um einen Niederenergie-Scan und einen Hochenergie-Scan der Probe durchzuführen;ein Detektorsystem zum Detektieren des hochenergetischen Röntgenstrahls und des niederenergetischen Röntgenstrahls nach einer Transmission durch die Probe, um Projektionsdaten zu erzeugen;ein Computersystem, das aus den Projektionsdaten einen rekonstruierten tomografischen Niederenergie-Volumendatensatz aus der Niederenergie-Scan erzeugt und einen rekonstruierten tomografischen Hochenergie-Volumendatensatz aus der Hochenergie-Scan erzeugt und das Schnittbilder aus dem rekonstruierten tomografischen Niederenergie- und dem Hochenergie-Volumendatensatz rendert und ein mathematisch kombiniertes synthetisches Schnittbild präsentiert,dadurch gekennzeichnet, dass das Computersystemein Schnittbildauswahlmittel von dem Niederenergie- und dem Hochenergie-Datensatz der rekonstruierten tomografischen Volumen präsentiert; undals Reaktion auf eine Benutzerauswahl eines Schnittbildes innerhalb des Schnittbildauswahlmittels ein Niederenergie-Schnittbild von dem Niederenergie-Datensatz und ein Hochenergie-Schnittbild von dem Hochenergie-Datensatz für dasselbe Gebiet der Probe rendert;ein zweidimensionales Histogramm von Hochenergie-Röntgenpixelintensitätswerten gegen Niederenergie-Röntgenpixelintensitätswerte basierend auf dem ausgewählten Schnittbild erzeugt, in welchem eine Intensität von Punkten in dem Histogramm der Anzahl an Voxeln mit den Niederenergie- und Hochenergie-Pixelintensitätswerten einer jeweiligen Pixelintensität zugeordnet ist; unddas Histogramm anzeigt.
- Röntgenbildgebungssystem nach Anspruch 1, wobei das Computersystem die rekonstruierten tomografischen Niederenergie- und die Hochenergie-Volumendatensätze in drei räumlichen Dimensionen und/oder in einer Vergrößerung miteinander ausrichtet und registriert.
- Röntgenbildgebungssystem nach Anspruch 1 oder 2, wobei das zweidimensionale Histogramm eine versetzte logarithmische Skala verwendet, um sicherzustellen, dass selbst einzelne Voxel als erkennbare Punkte angezeigt werden.
- Röntgenbildgebungssystem nach Anspruch 1, wobei das Computersystem:das synthetische Schnittbild für das ausgewählte Schnittbild durch Auswählen eines Drehpunktes und eines Winkels innerhalb des zweidimensionalen Histogramms erzeugt, wobei der Drehpunkt und der Winkel die Skalierung und das Verhältnis von Hochenergie- zu Niederenergie-Pixelintensitätswerten in dem zweidimensionalen Histogramm spezifizieren;dieselben Parameter auf den rekonstruierten tomografischen Hochenergie-Volumendatensatz und den rekonstruierten tomografischen Niederenergie-Volumendatensatz anwendet, die zum Erzeugen des synthetischen Schnittbildes für das ausgewählte Schnittbild verwendet wurden, um einen optimierten kombinierten tomografischen Volumendatensatz zu erzeugen; undden optimierten kombinierten tomografischen Volumendatensatz des tomografischen Volumens abspeichert.
- Röntgenbildgebungssystem nach Anspruch 4, wobei das Computersystem optimale Einzel-Scan-Einstellungen basierend auf dem optimierten kombinierten tomografischen Volumendatensatz des berechnet.
- Röntgenbildgebungssystem nach Anspruch 5, wobei das Computersystem:eine Auswahl eines Punktes in dem optimierten kombinierten tomografischen Volumendatensatz ermöglicht, um seine zugeordneten Scan-Einstellungen zu erhalten; unddie Scan-Einstellungen benutzt, um einen optimierten Scan der Probe oder einer neuen Probe durchzuführen, und einen rekonstruierten tomografischen Volumendatensatz für diese Probe erzeugt.
- Röntgenbildgebungssystem nach einem der Ansprüche 1 bis 6, wobei das Computersystem spezielle Materialbestandteile in der Probe identifiziert, wenn ein A-Priori-Wissen von grundlegenden Probenbestandteilen vorhanden ist; und wobei das Computersystem die Atommolarität von Elementen innerhalb der Probe aus dem Histogramm berechnet.
- Röntgenbildgebungssystem nach Anspruch 7, wobei das Computersystem eine Mikroporosität der Probe durch Berechnen der Atommolarität für eine zugeordnete effektive Atomzahl abschätzt.
- Doppelenergie-Kontrastabstimmungswerkzeug zur Verwendung mit tomografischen Röntgendaten, das auf einem Computersystem ausgeführt wird und das Folgendes umfasst:ein Niederenergie-Fenster zum Anzeigen von Niederenergie-Schnittbildern eines rekonstruierten tomografischen Niederenergie-Volumendatensatzes, der mit einem Röntgenbildgebungssystem aufgenommen wurde;ein Hochenergie-Fenster zum Anzeigen von Hochenergie-Schnittbildern eines rekonstruierten tomografischen Hochenergie-Volumendatensatzes, der mit einem Röntgenbildgebungssystem aufgenommen wurde;ein Schnittbildauswahlmittel zum Auswählen von Schnittbildern aus der Probe; undein Ergebnisfenster, das synthetische Schnittbilder anzeigt, die durch Kombinieren des Niederenergie-Volumendatensatzes und des rekonstruierten tomografischen Hochenergie-Volumendatensatzes für ein ausgewähltes Schnittbild erzeugt wurde;ein Zweidimensionales-Histogramm-Werkzeug, das eine Pixeldichte als Funktion von Niederenergie- und Hochenergie-Pixelintensitätswerten anzeigt und eine Auswahl eines Drehpunktes und eines Geradensteigungsparameters ermöglicht, die verwendet werden, um die synthetischen Schnittbilder aus dem rekonstruierten tomografischen Niederenergie-Volumendatensatz und dem rekonstruierten tomografischen Hochenergie-Volumendatensatz zu erzeugen.
- Doppelenergie-Kontrastabstimmungswerkzeug nach Anspruch 9, wobei als Reaktion auf eine Benutzerauswahl eines Schnittbildes innerhalb der zweidimensionalen Schnittbild-Auswahlgrafik das Niederenergie-Fenster die Niederenergie-Schnittbild von dem rekonstruierten tomografischen Niederenergie-Volumendatensatz anzeigt und das Hochenergie-Fenster die Hochenergie-Schnittbild des rekonstruierten tomografischen Hochenergie-Volumendatensatzes anzeigt.
- Doppelenergie-Kontrastabstimmungswerkzeug nach Anspruch 9 oder 10, wobei das Histogrammwerkzeug Folgendes beinhaltet:ein Winkelauswahlmittel für eine Winkelauswahl innerhalb des Histogramms;einen Winkelanzeiger, der den der Winkelauswahl zugeordneten Winkel anzeigt; undein Mittel zum Herein-/Herauszoomen zur Bereitstellung einer Vergrößerung des Histogramms.
- Doppelenergie-Kontrastabstimmungswerkzeug nach einem der Ansprüche 9 bis 11, wobei das Doppelenergie-Kontrastabstimmungswerkzeug einen optimierten kombinierten tomografischen Volumendatensatz in einem lokalen Speicher oder einer Datenbank abspeichert.
- Doppelenergie-Kontrastabstimmungswerkzeug nach einem der Ansprüche 9 bis 12, wobei das Histogrammwerkzeug eine versetzte logarithmische Skala verwendet, um sicherzustellen, dass einzelne Pixel in dem Histogramm als erkennbare Punkte erscheinen.
- Doppelenergie-Kontrastabstimmungswerkzeug nach einem der Ansprüche 9 bis 13, wobei das Doppelenergie-Kontrast-abstimmungswerkzeug optimale Einzel-Scan-Einstellungen berechnet.
- Doppelenergie-Kontrastabstimmungswerkzeug nach einem der Ansprüche 9 bis 14, wobei das Doppelenergie-Kontrast-abstimmungswerkzeug:eine Auswahl eines Punktes in dem optimierten kombinierten tomografischen Volumendatensatz ermöglicht, um seine zugeordneten Scan-Einstellungen zu erhalten; unddie Scan-Einstellungen benutzt, um einen optimierte Scan der Probe oder einer neuen Probe durchzuführen, und einen Datensatz für ein rekonstruiertes tomografisches Volumen für diese Probe erzeugt.
- Doppelenergie-Kontrastabstimmungswerkzeug nach einem der Ansprüche 9 bis 15, wobei das Doppelenergie-Kontrastabstimmungswerkzeug die Atommolarität und effektive Atomzahl von Elementen innerhalb der Probe aus dem Histogramm berechnet.
- Doppelenergie-Kontrastabstimmungswerkzeug nach Anspruch 16, wobei das Doppelenergie-Kontrastabstimmungswerkzeug eine Mikroporosität der Probe durch Berechnen der Atommolarität für eine zugeordnete effektive Atomzahl abschätzt.
- Doppelenergie-Kontrastabstimmungswerkzeug nach einem der Ansprüche 9 bis 17, das ferner ein Korrelationswerkzeug umfasst, das als Reaktion darauf, dass ein Bediener eine Position in einem der Fenster auswählt, die gleichen Positionen in anderen Fenstern anzeigt.
- Doppelenergie-Kontrastabstimmungswerkzeug nach Anspruch 18, wobei das Korrelationswerkzeug ein entsprechendes Voxel in dem Histogrammwerkzeug anzeigt.
- Datenerfassungs-und-Bildrekonstruktions-Verfahren für ein Röntgenbildgebungssystem, wobei das Verfahren Folgendes umfasst:Laden eines rekonstruierten tomografischen Niederenergie-Volumendatensatzes von einem Niederenergie-Scan aus einem Röntgenbildgebungssystem oder aus einer Datenbank;Laden eines rekonstruierten tomografischen Hochenergie-Volumendatensatzes eines von einem Hochenergie-Scan aus einem Röntgenbildgebungssystem oder aus einer Datenbank;Rendern von Schnittbildansichten aus dem rekonstruierten tomografischen Niederenergie- und dem rekonstruierten tomografischen Hochenergie-Volumendatensatz;Auswählen eines Schnittbildes aus den Schnittbildansichten durch einen Benutzer;als Reaktion auf eine Benutzerauswahl eines Schnittbildes Anzeigen von Schnittbildansichten des rekonstruierten tomografischen Niederenergie-Volumendatensatzes und des rekonstruierten tomografischen Hochenergie- Volumendatensatzes für dasselbe Gebiet der Probe;Erzeugen eines zweidimensionalen Histogramms von Hochenergie-Röntgenpixelintensitätswerten gegen Niederenergie-Röntgenpixelintensitätswerten basierend auf dem ausgewählten Schnittbild, in welchem eine Intensität von Punkten in dem Histogramm, die einem bestrahlten Punkt in der Probe, der als Pixel repräsentiert wird, zugeordnet ist, ein Maß dafür ist, wie gleich die Niederenergie- und die Hochenergie-Röntgenpixelintensitätswerte für den bestrahlten Punkt in der Probe sind;Anzeigen des Histogrammwerkzeuges;Auswählen eines Schwenkpunktes und eines Winkels innerhalb des Histogramms durch einen Benutzer, wobei der Schwenkpunkt und der Winkel das Verhältnis von Hochenergie- zu Niederenergie-Pixelintensitätswerten in dem Histogramm spezifizieren;Anwenden des ausgewählten Schwenkpunktes und Winkels auf den rekonstruierten tomografischen Hochenergie-Volumendatensatz und den rekonstruierten tomografischen Niederenergie-Volumendatensatz, um ein optimiertes Bild für das ausgewählte Schnittbild zu erzeugen.
- Verfahren nach Anspruch 20, das ferner Folgendes umfasst:Erzeugen eines optimierten kombinierten Datensatzes eines tomografischen Volumens.
- Verfahren nach Anspruch 20 oder 21, wobei das Verfahren ferner Folgendes umfasst:Laden einer Probe auf einen Probenhalter des Röntgenbildgebungssystems;Durchführen eines Niederenergie-Scans durch Drehen der Probe in einem niederenergetischen Röntgenstrahl eines Röntgenquellensystems des Röntgenbildgebungssystems;Durchführen eines Hochenergie-Scans durch Drehen der Probe in einem hochenergetischen Röntgenstrahl von dem Röntgenbildgebungssystem.
- Verfahren nach einem der Ansprüche 18 bis 22, das ferner Ausrichten und Registrieren des tomografischen Niederenergie- und Hochenergie-Volumendatensatzes miteinander in drei räumlichen Dimensionen und/oder in einer Vergrößerung umfasst.
- Verfahren nach einem der Ansprüche 18 bis 23, wobei Anzeigen des Histogramms Benutzen einer versetzten logarithmischen Skala in dem Histogramm umfasst, um sicherzustellen, dass einzelne Pixel in dem Histogramm als erkennbare Punkte erscheinen.
- Verfahren nach einem der Ansprüche 22 bis 24, das ferner Berechnen optimaler Einzel-Scan-Einstellungen umfasst.
- Verfahren nach Anspruch 25, wobei Berechnen der optimalen Einzel-Scan-Einstellungen Folgendes umfasst:Auswählen eines Punktes in einem optimierten kombinierten tomografischen Volumendatensatz, um seine zugeordneten Scan-Einstellungen zu erhalten; undVerwenden der Scan-Einstellungen, um einen optimierten Scan der Probe oder einer neuen Probe durchzuführen, und Erzeugen eines rekonstruierten tomografischen Volumendatensatzes für diese Probe.
- Verfahren nach einem der Ansprüche 20 bis 26, das ferner Identifizieren spezieller Materialbestandteile in der Probe umfasst, wenn ein A-Priori-Wissen von grundlegenden Probenbestandteilen vorhanden ist, indem die Atommolarität und effektive Atomzahl von Elementen innerhalb der Probe aus dem Histogramm berechnet wird.
- Verfahren nach Anspruch 27, das ferner Abschätzen einer Mikroporosität von den speziellen Materialbestandteilen in der Probe umfasst.
Applications Claiming Priority (2)
| Application Number | Priority Date | Filing Date | Title |
|---|---|---|---|
| US13/768,689 US9128584B2 (en) | 2013-02-15 | 2013-02-15 | Multi energy X-ray microscope data acquisition and image reconstruction system and method |
| PCT/US2014/011689 WO2014126672A2 (en) | 2013-02-15 | 2014-01-15 | Multi energy x-ray microscope data acquisition and image reconstruction system and method |
Publications (2)
| Publication Number | Publication Date |
|---|---|
| EP2956945A2 EP2956945A2 (de) | 2015-12-23 |
| EP2956945B1 true EP2956945B1 (de) | 2017-05-17 |
Family
ID=50102190
Family Applications (1)
| Application Number | Title | Priority Date | Filing Date |
|---|---|---|---|
| EP14704421.8A Active EP2956945B1 (de) | 2013-02-15 | 2014-01-15 | Multienergie-röntgenmikroskop-datenerfassungs- und bildrekonstruktionssystem sowie verfahren |
Country Status (4)
| Country | Link |
|---|---|
| US (2) | US9128584B2 (de) |
| EP (1) | EP2956945B1 (de) |
| CN (1) | CN104995690B (de) |
| WO (1) | WO2014126672A2 (de) |
Families Citing this family (39)
| Publication number | Priority date | Publication date | Assignee | Title |
|---|---|---|---|---|
| US9128584B2 (en) | 2013-02-15 | 2015-09-08 | Carl Zeiss X-ray Microscopy, Inc. | Multi energy X-ray microscope data acquisition and image reconstruction system and method |
| JP6357391B2 (ja) * | 2014-09-22 | 2018-07-11 | 日本電子株式会社 | 情報処理装置、及び情報処理方法 |
| US10420519B2 (en) * | 2014-11-06 | 2019-09-24 | Koninklijke Philips N.V. | Computed tomography system |
| JP6533668B2 (ja) * | 2015-03-04 | 2019-06-19 | 日本電子株式会社 | 画像表示装置、画像表示方法、およびプログラム |
| JP6403213B2 (ja) * | 2015-04-27 | 2018-10-10 | 日本電子株式会社 | 制御装置、制御方法、および分析システム |
| CN105046675B (zh) * | 2015-08-24 | 2017-09-29 | 重庆邮电大学 | 基于mvct图像消除kvct图像中金属伪影的方法 |
| EP3570295A1 (de) | 2015-10-18 | 2019-11-20 | Carl Zeiss X-Ray Microscopy, Inc. | Verfahren zum kombinieren von tomografischen volumendatensätzen und bildanalysewerkzeug eines röntgenbildgebungsmikroskopiesystems |
| CN105574904B (zh) | 2015-12-11 | 2019-01-11 | 沈阳东软医疗系统有限公司 | 一种图像重建方法、装置及设备 |
| CN105551001B (zh) | 2015-12-11 | 2019-01-15 | 沈阳东软医疗系统有限公司 | 一种图像重建方法、装置及设备 |
| EP3403238A1 (de) * | 2016-01-11 | 2018-11-21 | Carl Zeiss X-Ray Microscopy, Inc. | Multimodales system und verfahren zur mineralogiesegmentierung |
| CN107019517A (zh) * | 2016-02-01 | 2017-08-08 | 上海优医基医疗影像设备有限公司 | X射线多能成像系统及其成像控制方法 |
| US10859515B2 (en) | 2016-03-23 | 2020-12-08 | Carl Zeiss X-ray Microscopy, Inc. | Method and system for spectral characterization in computed tomography x-ray microscopy system |
| CN107345923B (zh) | 2016-05-05 | 2020-05-19 | 清华大学 | X射线探测方法、和x射线探测器 |
| CN107844487A (zh) * | 2016-09-19 | 2018-03-27 | 中国科学院大连化学物理研究所 | 用于谱分析光电子/低能电子显微镜的自动数据采集方法 |
| JP6546208B2 (ja) * | 2017-01-20 | 2019-07-17 | アンリツインフィビス株式会社 | X線検査装置 |
| JP7054329B2 (ja) | 2017-10-06 | 2022-04-13 | キヤノン株式会社 | 画像処理装置、画像処理方法及びプログラム |
| US11138767B2 (en) * | 2018-03-22 | 2021-10-05 | Carl Zeiss X-ray Microscopy, Inc. | System and method for the proscriptive determination of parameters for iterative reconstruction |
| CN109100775B (zh) * | 2018-07-06 | 2020-05-29 | 郑州云海信息技术有限公司 | 一种双层探测器的能量谱校正方法与装置 |
| JP7143567B2 (ja) * | 2018-09-14 | 2022-09-29 | 株式会社島津テクノリサーチ | 材料試験機および放射線ct装置 |
| CN109856169B (zh) * | 2019-02-19 | 2021-04-20 | 首都师范大学 | 一种高分辨显微能谱ct成像方法及系统 |
| CN110165323A (zh) * | 2019-05-29 | 2019-08-23 | 上海精测半导体技术有限公司 | 锂电池回收方法和设备 |
| WO2021072229A1 (en) * | 2019-10-11 | 2021-04-15 | Board Of Regents, The University Of Texas System | Variable zoom x-ray computed tomography method for composites |
| US11564645B2 (en) * | 2020-02-25 | 2023-01-31 | GE Precision Healthcare LLC | Methods and systems for digital mammography imaging |
| GB2592607B (en) * | 2020-03-03 | 2024-06-19 | Smiths Detection France S A S | Resolution improvement in dual energy |
| JP7501167B2 (ja) * | 2020-07-03 | 2024-06-18 | オムロン株式会社 | X線検査装置 |
| CN114431882A (zh) * | 2020-11-02 | 2022-05-06 | 深圳市安健科技股份有限公司 | 图像诊断系统及方法 |
| US12480892B2 (en) | 2020-12-07 | 2025-11-25 | Sigray, Inc. | High throughput 3D x-ray imaging system using a transmission x-ray source |
| KR20260030946A (ko) | 2020-12-07 | 2026-03-06 | 시그레이, 아이엔씨. | 투과 x-선 소스를 이용한 고처리량 3D x-선 이미징 시스템 |
| EP4266050A1 (de) * | 2021-11-05 | 2023-10-25 | Carl Zeiss X-Ray Microscopy, Inc. | 3d-partikelanalyse und -trennung mit doppelsaat |
| WO2023168204A1 (en) * | 2022-03-02 | 2023-09-07 | Sigray, Inc. | X-ray fluorescence system and x-ray source with electrically insulative target material |
| US12016718B2 (en) | 2022-03-11 | 2024-06-25 | Canon Medical Systems Corporation | Apparatus and methods for image quality improvement based on noise and dose optimization |
| US11992350B2 (en) | 2022-03-15 | 2024-05-28 | Sigray, Inc. | System and method for compact laminography utilizing microfocus transmission x-ray source and variable magnification x-ray detector |
| DE112024000873T5 (de) | 2023-02-16 | 2026-01-15 | Sigray, Inc. | Röntgen-detektorsystem mit mindestens zwei gestapelten flachen bragg-diffraktoren |
| CN121420189A (zh) * | 2023-06-01 | 2026-01-27 | 拉皮斯坎控股公司 | 用于在多个取向上自动生成对象的合成x射线扫描数据的系统和方法 |
| US12181423B1 (en) | 2023-09-07 | 2024-12-31 | Sigray, Inc. | Secondary image removal using high resolution x-ray transmission sources |
| US12429437B2 (en) | 2023-11-07 | 2025-09-30 | Sigray, Inc. | System and method for x-ray absorption spectroscopy using spectral information from two orthogonal planes |
| WO2025151383A1 (en) | 2024-01-08 | 2025-07-17 | Sigray, Inc. | X-ray analysis system with focused x-ray beam and non-x-ray microscope |
| WO2025155719A1 (en) | 2024-01-18 | 2025-07-24 | Sigray, Inc. | Sequential array of x-ray imaging detectors |
| WO2025174966A1 (en) | 2024-02-15 | 2025-08-21 | Sigray, Inc. | System and method for generating a focused x‑ray beam |
Family Cites Families (21)
| Publication number | Priority date | Publication date | Assignee | Title |
|---|---|---|---|---|
| US5361763A (en) | 1993-03-02 | 1994-11-08 | Wisconsin Alumni Research Foundation | Method for segmenting features in an image |
| US6316005B1 (en) * | 1994-04-11 | 2001-11-13 | Solvay Animal Health, Inc. | Borrelia burgdorferi bacterin |
| US6418189B1 (en) | 2000-01-24 | 2002-07-09 | Analogic Corporation | Explosive material detection apparatus and method using dual energy information of a scan |
| GB2387436A (en) * | 2000-06-12 | 2003-10-15 | Wolfowitz Susanna Helena | Article identification system |
| JP2005516376A (ja) * | 2002-01-31 | 2005-06-02 | ザ ジョンズ ホプキンズ ユニバーシティ | 選択可能なx線周波数をより効率よく生成するx線源および方法 |
| US8243876B2 (en) * | 2003-04-25 | 2012-08-14 | Rapiscan Systems, Inc. | X-ray scanners |
| US6950493B2 (en) * | 2003-06-25 | 2005-09-27 | Besson Guy M | Dynamic multi-spectral CT imaging |
| CN101071110B (zh) | 2006-05-08 | 2011-05-11 | 清华大学 | 一种基于螺旋扫描立体成像的货物安全检查方法 |
| US8223143B2 (en) * | 2006-10-27 | 2012-07-17 | Carl Zeiss Meditec, Inc. | User interface for efficiently displaying relevant OCT imaging data |
| JP4575909B2 (ja) * | 2006-11-22 | 2010-11-04 | ジーイー・メディカル・システムズ・グローバル・テクノロジー・カンパニー・エルエルシー | X線断層撮影装置 |
| US7920669B2 (en) | 2007-07-25 | 2011-04-05 | Siemens Aktiengesellschaft | Methods, apparatuses and computer readable mediums for generating images based on multi-energy computed tomography data |
| CN102088907B (zh) * | 2008-07-07 | 2013-03-27 | 皇家飞利浦电子股份有限公司 | K边缘成像 |
| CN101900696B (zh) * | 2009-05-27 | 2012-01-04 | 清华大学 | 双能欠采样物质识别方法和系统 |
| JP5730196B2 (ja) * | 2009-06-10 | 2015-06-03 | 株式会社日立メディコ | 超音波診断装置、超音波画像処理装置、超音波画像生成方法 |
| RU2434288C1 (ru) * | 2010-06-08 | 2011-11-20 | Закрытое Акционерное Общество "Импульс" | Способ коррекции цифровых изображений |
| WO2013169973A1 (en) | 2012-05-11 | 2013-11-14 | Ingrain, Inc. | A method and system for multi-energy computer tomographic cuttings analysis |
| AU2013323422B2 (en) | 2012-09-27 | 2018-07-05 | Ingrain, Inc. | Computed tomography (CT) systems and methods analyzing rock property changes resulting from a treatment |
| US9128584B2 (en) | 2013-02-15 | 2015-09-08 | Carl Zeiss X-ray Microscopy, Inc. | Multi energy X-ray microscope data acquisition and image reconstruction system and method |
| AU2015241030A1 (en) | 2014-03-31 | 2016-10-20 | Ingrain, Inc. | Digital rock physics-based trend determination and usage for upscaling |
| BR112016022665A2 (pt) | 2014-03-31 | 2017-08-15 | Ingrain Inc | Determinação de volume elementar representativo por meio de estatística baseada em agrupamento |
| EP3570295A1 (de) | 2015-10-18 | 2019-11-20 | Carl Zeiss X-Ray Microscopy, Inc. | Verfahren zum kombinieren von tomografischen volumendatensätzen und bildanalysewerkzeug eines röntgenbildgebungsmikroskopiesystems |
-
2013
- 2013-02-15 US US13/768,689 patent/US9128584B2/en active Active
-
2014
- 2014-01-15 CN CN201480008362.3A patent/CN104995690B/zh active Active
- 2014-01-15 EP EP14704421.8A patent/EP2956945B1/de active Active
- 2014-01-15 WO PCT/US2014/011689 patent/WO2014126672A2/en not_active Ceased
-
2015
- 2015-07-22 US US14/806,099 patent/US10335104B2/en active Active
Non-Patent Citations (1)
| Title |
|---|
| None * |
Also Published As
| Publication number | Publication date |
|---|---|
| WO2014126672A3 (en) | 2014-12-04 |
| CN104995690A (zh) | 2015-10-21 |
| EP2956945A2 (de) | 2015-12-23 |
| US20150323474A1 (en) | 2015-11-12 |
| US10335104B2 (en) | 2019-07-02 |
| US9128584B2 (en) | 2015-09-08 |
| WO2014126672A2 (en) | 2014-08-21 |
| CN104995690B (zh) | 2017-11-17 |
| US20140233692A1 (en) | 2014-08-21 |
Similar Documents
| Publication | Publication Date | Title |
|---|---|---|
| US10335104B2 (en) | Multi energy X-ray microscope data acquisition and image reconstruction system and method | |
| US10169865B2 (en) | Multi energy X-ray microscope data acquisition and image reconstruction system and method | |
| Liu et al. | TXM-Wizard: a program for advanced data collection and evaluation in full-field transmission X-ray microscopy | |
| US6269144B1 (en) | Method and apparatus for diffraction measurement using a scanning x-ray source | |
| Paziresh et al. | Tomography of atomic number and density of materials using dual-energy imaging and the Alvarez and Macovski attenuation model | |
| JP5370180B2 (ja) | X線分析用表示処理装置 | |
| EP3518271A1 (de) | Rasterelektronenmikroskop und messverfahren | |
| CN102525531A (zh) | 减少x射线成像检查中使用的放射剂量的方法及ct系统 | |
| US8855266B2 (en) | X-ray stress measurement apparatus | |
| JP2021143958A (ja) | X線位相撮像システム、x線画像処理装置、および、x線画像処理方法 | |
| JP4660158B2 (ja) | 状態図を利用した相分析を行う表面分析装置 | |
| KR20180047401A (ko) | 의료 영상 장치 및 의료 영상 처리 방법 | |
| Patterson et al. | Integrating 3D images using laboratory‐based micro X‐ray computed tomography and confocal X‐ray fluorescence techniques | |
| JP6462150B2 (ja) | 荷電粒子線装置、荷電粒子線装置を用いた観察方法、及び、プログラム | |
| US20180144462A1 (en) | Geometry correction for computed tomography | |
| JP5407887B2 (ja) | X線分析用表示処理装置 | |
| US12602756B2 (en) | Method and system for analytical x-ray calibration, reconstruction and indexing using simulation | |
| JP2002062270A (ja) | 電子線を用いた表面分析装置における面分析データ表示方法 | |
| JP2003240739A (ja) | 組成分布の領域分け支援機能を有するx線分析装置 | |
| WO2018159053A1 (ja) | 画像表示制御装置、x線ct装置及び画像表示方法 | |
| Butzhammer et al. | Task-specific scan trajectory modification for dimensional X-ray computed Tomography with high throughput. | |
| KR20220040466A (ko) | 하전 입자선 장치 | |
| WO2021044544A1 (ja) | 試料画像表示システムおよび荷電粒子線装置 | |
| JP2025138234A (ja) | 画像処理装置、方法及びプログラム | |
| JP2025138233A (ja) | データ処理装置、方法及びプログラム |
Legal Events
| Date | Code | Title | Description |
|---|---|---|---|
| PUAI | Public reference made under article 153(3) epc to a published international application that has entered the european phase |
Free format text: ORIGINAL CODE: 0009012 |
|
| 17P | Request for examination filed |
Effective date: 20150915 |
|
| AK | Designated contracting states |
Kind code of ref document: A2 Designated state(s): AL AT BE BG CH CY CZ DE DK EE ES FI FR GB GR HR HU IE IS IT LI LT LU LV MC MK MT NL NO PL PT RO RS SE SI SK SM TR |
|
| AX | Request for extension of the european patent |
Extension state: BA ME |
|
| 17Q | First examination report despatched |
Effective date: 20160223 |
|
| DAX | Request for extension of the european patent (deleted) | ||
| GRAP | Despatch of communication of intention to grant a patent |
Free format text: ORIGINAL CODE: EPIDOSNIGR1 |
|
| INTG | Intention to grant announced |
Effective date: 20170127 |
|
| GRAS | Grant fee paid |
Free format text: ORIGINAL CODE: EPIDOSNIGR3 |
|
| GRAA | (expected) grant |
Free format text: ORIGINAL CODE: 0009210 |
|
| AK | Designated contracting states |
Kind code of ref document: B1 Designated state(s): AL AT BE BG CH CY CZ DE DK EE ES FI FR GB GR HR HU IE IS IT LI LT LU LV MC MK MT NL NO PL PT RO RS SE SI SK SM TR |
|
| REG | Reference to a national code |
Ref country code: GB Ref legal event code: FG4D |
|
| REG | Reference to a national code |
Ref country code: CH Ref legal event code: EP |
|
| REG | Reference to a national code |
Ref country code: IE Ref legal event code: FG4D |
|
| REG | Reference to a national code |
Ref country code: AT Ref legal event code: REF Ref document number: 895126 Country of ref document: AT Kind code of ref document: T Effective date: 20170615 |
|
| REG | Reference to a national code |
Ref country code: DE Ref legal event code: R096 Ref document number: 602014009895 Country of ref document: DE |
|
| REG | Reference to a national code |
Ref country code: NL Ref legal event code: MP Effective date: 20170517 |
|
| REG | Reference to a national code |
Ref country code: LT Ref legal event code: MG4D |
|
| REG | Reference to a national code |
Ref country code: AT Ref legal event code: MK05 Ref document number: 895126 Country of ref document: AT Kind code of ref document: T Effective date: 20170517 |
|
| PG25 | Lapsed in a contracting state [announced via postgrant information from national office to epo] |
Ref country code: AT Free format text: LAPSE BECAUSE OF FAILURE TO SUBMIT A TRANSLATION OF THE DESCRIPTION OR TO PAY THE FEE WITHIN THE PRESCRIBED TIME-LIMIT Effective date: 20170517 Ref country code: FI Free format text: LAPSE BECAUSE OF FAILURE TO SUBMIT A TRANSLATION OF THE DESCRIPTION OR TO PAY THE FEE WITHIN THE PRESCRIBED TIME-LIMIT Effective date: 20170517 Ref country code: ES Free format text: LAPSE BECAUSE OF FAILURE TO SUBMIT A TRANSLATION OF THE DESCRIPTION OR TO PAY THE FEE WITHIN THE PRESCRIBED TIME-LIMIT Effective date: 20170517 Ref country code: NO Free format text: LAPSE BECAUSE OF FAILURE TO SUBMIT A TRANSLATION OF THE DESCRIPTION OR TO PAY THE FEE WITHIN THE PRESCRIBED TIME-LIMIT Effective date: 20170817 Ref country code: HR Free format text: LAPSE BECAUSE OF FAILURE TO SUBMIT A TRANSLATION OF THE DESCRIPTION OR TO PAY THE FEE WITHIN THE PRESCRIBED TIME-LIMIT Effective date: 20170517 Ref country code: LT Free format text: LAPSE BECAUSE OF FAILURE TO SUBMIT A TRANSLATION OF THE DESCRIPTION OR TO PAY THE FEE WITHIN THE PRESCRIBED TIME-LIMIT Effective date: 20170517 Ref country code: GR Free format text: LAPSE BECAUSE OF FAILURE TO SUBMIT A TRANSLATION OF THE DESCRIPTION OR TO PAY THE FEE WITHIN THE PRESCRIBED TIME-LIMIT Effective date: 20170818 |
|
| PG25 | Lapsed in a contracting state [announced via postgrant information from national office to epo] |
Ref country code: LV Free format text: LAPSE BECAUSE OF FAILURE TO SUBMIT A TRANSLATION OF THE DESCRIPTION OR TO PAY THE FEE WITHIN THE PRESCRIBED TIME-LIMIT Effective date: 20170517 Ref country code: NL Free format text: LAPSE BECAUSE OF FAILURE TO SUBMIT A TRANSLATION OF THE DESCRIPTION OR TO PAY THE FEE WITHIN THE PRESCRIBED TIME-LIMIT Effective date: 20170517 Ref country code: SE Free format text: LAPSE BECAUSE OF FAILURE TO SUBMIT A TRANSLATION OF THE DESCRIPTION OR TO PAY THE FEE WITHIN THE PRESCRIBED TIME-LIMIT Effective date: 20170517 Ref country code: BG Free format text: LAPSE BECAUSE OF FAILURE TO SUBMIT A TRANSLATION OF THE DESCRIPTION OR TO PAY THE FEE WITHIN THE PRESCRIBED TIME-LIMIT Effective date: 20170817 Ref country code: PL Free format text: LAPSE BECAUSE OF FAILURE TO SUBMIT A TRANSLATION OF THE DESCRIPTION OR TO PAY THE FEE WITHIN THE PRESCRIBED TIME-LIMIT Effective date: 20170517 Ref country code: IS Free format text: LAPSE BECAUSE OF FAILURE TO SUBMIT A TRANSLATION OF THE DESCRIPTION OR TO PAY THE FEE WITHIN THE PRESCRIBED TIME-LIMIT Effective date: 20170917 Ref country code: RS Free format text: LAPSE BECAUSE OF FAILURE TO SUBMIT A TRANSLATION OF THE DESCRIPTION OR TO PAY THE FEE WITHIN THE PRESCRIBED TIME-LIMIT Effective date: 20170517 |
|
| REG | Reference to a national code |
Ref country code: FR Ref legal event code: PLFP Year of fee payment: 5 |
|
| PG25 | Lapsed in a contracting state [announced via postgrant information from national office to epo] |
Ref country code: RO Free format text: LAPSE BECAUSE OF FAILURE TO SUBMIT A TRANSLATION OF THE DESCRIPTION OR TO PAY THE FEE WITHIN THE PRESCRIBED TIME-LIMIT Effective date: 20170517 Ref country code: SK Free format text: LAPSE BECAUSE OF FAILURE TO SUBMIT A TRANSLATION OF THE DESCRIPTION OR TO PAY THE FEE WITHIN THE PRESCRIBED TIME-LIMIT Effective date: 20170517 Ref country code: DK Free format text: LAPSE BECAUSE OF FAILURE TO SUBMIT A TRANSLATION OF THE DESCRIPTION OR TO PAY THE FEE WITHIN THE PRESCRIBED TIME-LIMIT Effective date: 20170517 Ref country code: EE Free format text: LAPSE BECAUSE OF FAILURE TO SUBMIT A TRANSLATION OF THE DESCRIPTION OR TO PAY THE FEE WITHIN THE PRESCRIBED TIME-LIMIT Effective date: 20170517 |
|
| REG | Reference to a national code |
Ref country code: DE Ref legal event code: R097 Ref document number: 602014009895 Country of ref document: DE |
|
| PG25 | Lapsed in a contracting state [announced via postgrant information from national office to epo] |
Ref country code: IT Free format text: LAPSE BECAUSE OF FAILURE TO SUBMIT A TRANSLATION OF THE DESCRIPTION OR TO PAY THE FEE WITHIN THE PRESCRIBED TIME-LIMIT Effective date: 20170517 Ref country code: SM Free format text: LAPSE BECAUSE OF FAILURE TO SUBMIT A TRANSLATION OF THE DESCRIPTION OR TO PAY THE FEE WITHIN THE PRESCRIBED TIME-LIMIT Effective date: 20170517 |
|
| PLBE | No opposition filed within time limit |
Free format text: ORIGINAL CODE: 0009261 |
|
| STAA | Information on the status of an ep patent application or granted ep patent |
Free format text: STATUS: NO OPPOSITION FILED WITHIN TIME LIMIT |
|
| 26N | No opposition filed |
Effective date: 20180220 |
|
| PG25 | Lapsed in a contracting state [announced via postgrant information from national office to epo] |
Ref country code: SI Free format text: LAPSE BECAUSE OF FAILURE TO SUBMIT A TRANSLATION OF THE DESCRIPTION OR TO PAY THE FEE WITHIN THE PRESCRIBED TIME-LIMIT Effective date: 20170517 |
|
| REG | Reference to a national code |
Ref country code: CH Ref legal event code: PL |
|
| PG25 | Lapsed in a contracting state [announced via postgrant information from national office to epo] |
Ref country code: LU Free format text: LAPSE BECAUSE OF NON-PAYMENT OF DUE FEES Effective date: 20180115 |
|
| REG | Reference to a national code |
Ref country code: IE Ref legal event code: MM4A |
|
| PG25 | Lapsed in a contracting state [announced via postgrant information from national office to epo] |
Ref country code: CH Free format text: LAPSE BECAUSE OF NON-PAYMENT OF DUE FEES Effective date: 20180131 Ref country code: LI Free format text: LAPSE BECAUSE OF NON-PAYMENT OF DUE FEES Effective date: 20180131 |
|
| PG25 | Lapsed in a contracting state [announced via postgrant information from national office to epo] |
Ref country code: IE Free format text: LAPSE BECAUSE OF NON-PAYMENT OF DUE FEES Effective date: 20180115 |
|
| PG25 | Lapsed in a contracting state [announced via postgrant information from national office to epo] |
Ref country code: MC Free format text: LAPSE BECAUSE OF FAILURE TO SUBMIT A TRANSLATION OF THE DESCRIPTION OR TO PAY THE FEE WITHIN THE PRESCRIBED TIME-LIMIT Effective date: 20170517 |
|
| PG25 | Lapsed in a contracting state [announced via postgrant information from national office to epo] |
Ref country code: MT Free format text: LAPSE BECAUSE OF NON-PAYMENT OF DUE FEES Effective date: 20180115 |
|
| PG25 | Lapsed in a contracting state [announced via postgrant information from national office to epo] |
Ref country code: TR Free format text: LAPSE BECAUSE OF FAILURE TO SUBMIT A TRANSLATION OF THE DESCRIPTION OR TO PAY THE FEE WITHIN THE PRESCRIBED TIME-LIMIT Effective date: 20170517 |
|
| PG25 | Lapsed in a contracting state [announced via postgrant information from national office to epo] |
Ref country code: PT Free format text: LAPSE BECAUSE OF FAILURE TO SUBMIT A TRANSLATION OF THE DESCRIPTION OR TO PAY THE FEE WITHIN THE PRESCRIBED TIME-LIMIT Effective date: 20170517 |
|
| PG25 | Lapsed in a contracting state [announced via postgrant information from national office to epo] |
Ref country code: HU Free format text: LAPSE BECAUSE OF FAILURE TO SUBMIT A TRANSLATION OF THE DESCRIPTION OR TO PAY THE FEE WITHIN THE PRESCRIBED TIME-LIMIT; INVALID AB INITIO Effective date: 20140115 Ref country code: MK Free format text: LAPSE BECAUSE OF NON-PAYMENT OF DUE FEES Effective date: 20170517 Ref country code: CY Free format text: LAPSE BECAUSE OF FAILURE TO SUBMIT A TRANSLATION OF THE DESCRIPTION OR TO PAY THE FEE WITHIN THE PRESCRIBED TIME-LIMIT Effective date: 20170517 |
|
| PG25 | Lapsed in a contracting state [announced via postgrant information from national office to epo] |
Ref country code: AL Free format text: LAPSE BECAUSE OF FAILURE TO SUBMIT A TRANSLATION OF THE DESCRIPTION OR TO PAY THE FEE WITHIN THE PRESCRIBED TIME-LIMIT Effective date: 20170517 |
|
| PGFP | Annual fee paid to national office [announced via postgrant information from national office to epo] |
Ref country code: GB Payment date: 20260123 Year of fee payment: 13 |
|
| PGFP | Annual fee paid to national office [announced via postgrant information from national office to epo] |
Ref country code: DE Payment date: 20260121 Year of fee payment: 13 |
|
| PGFP | Annual fee paid to national office [announced via postgrant information from national office to epo] |
Ref country code: BE Payment date: 20260121 Year of fee payment: 13 |
|
| PGFP | Annual fee paid to national office [announced via postgrant information from national office to epo] |
Ref country code: FR Payment date: 20260123 Year of fee payment: 13 |
|
| PGFP | Annual fee paid to national office [announced via postgrant information from national office to epo] |
Ref country code: CZ Payment date: 20260109 Year of fee payment: 13 |