EP2427100B1 - A system and method for improved tomography - Google Patents
A system and method for improved tomography Download PDFInfo
- Publication number
- EP2427100B1 EP2427100B1 EP10720382.0A EP10720382A EP2427100B1 EP 2427100 B1 EP2427100 B1 EP 2427100B1 EP 10720382 A EP10720382 A EP 10720382A EP 2427100 B1 EP2427100 B1 EP 2427100B1
- Authority
- EP
- European Patent Office
- Prior art keywords
- marker
- excitation
- luminescent
- imaging
- light source
- Prior art date
- Legal status (The legal status is an assumption and is not a legal conclusion. Google has not performed a legal analysis and makes no representation as to the accuracy of the status listed.)
- Active
Links
- 238000000034 method Methods 0.000 title claims description 60
- 238000003325 tomography Methods 0.000 title claims description 41
- 230000005284 excitation Effects 0.000 claims description 120
- 238000003384 imaging method Methods 0.000 claims description 80
- 239000003550 marker Substances 0.000 claims description 70
- 238000004020 luminiscence type Methods 0.000 claims description 54
- 238000009826 distribution Methods 0.000 claims description 20
- 239000000463 material Substances 0.000 claims description 8
- 238000001514 detection method Methods 0.000 claims description 7
- 230000033001 locomotion Effects 0.000 claims description 5
- 210000001519 tissue Anatomy 0.000 description 46
- 239000002105 nanoparticle Substances 0.000 description 35
- 230000008569 process Effects 0.000 description 21
- 238000000799 fluorescence microscopy Methods 0.000 description 19
- 239000002159 nanocrystal Substances 0.000 description 19
- 230000003287 optical effect Effects 0.000 description 16
- 239000000523 sample Substances 0.000 description 15
- 230000009102 absorption Effects 0.000 description 13
- 238000010521 absorption reaction Methods 0.000 description 13
- 241001465754 Metazoa Species 0.000 description 12
- 230000035945 sensitivity Effects 0.000 description 12
- 230000001419 dependent effect Effects 0.000 description 11
- 239000002609 medium Substances 0.000 description 11
- 238000002474 experimental method Methods 0.000 description 10
- 239000002096 quantum dot Substances 0.000 description 10
- 230000008901 benefit Effects 0.000 description 9
- 238000005424 photoluminescence Methods 0.000 description 9
- 238000012546 transfer Methods 0.000 description 9
- 238000001727 in vivo Methods 0.000 description 8
- 150000002500 ions Chemical class 0.000 description 8
- 239000002245 particle Substances 0.000 description 8
- 206010028980 Neoplasm Diseases 0.000 description 7
- VYXSBFYARXAAKO-WTKGSRSZSA-N chembl402140 Chemical compound Cl.C1=2C=C(C)C(NCC)=CC=2OC2=C\C(=N/CC)C(C)=CC2=C1C1=CC=CC=C1C(=O)OCC VYXSBFYARXAAKO-WTKGSRSZSA-N 0.000 description 7
- 239000002872 contrast media Substances 0.000 description 7
- 230000005281 excited state Effects 0.000 description 7
- 108091006047 fluorescent proteins Proteins 0.000 description 7
- 102000034287 fluorescent proteins Human genes 0.000 description 7
- 230000003902 lesion Effects 0.000 description 7
- 238000002595 magnetic resonance imaging Methods 0.000 description 7
- 239000000243 solution Substances 0.000 description 7
- 230000007704 transition Effects 0.000 description 7
- 239000000090 biomarker Substances 0.000 description 6
- 238000002189 fluorescence spectrum Methods 0.000 description 6
- 239000007850 fluorescent dye Substances 0.000 description 6
- 230000003993 interaction Effects 0.000 description 6
- 238000005259 measurement Methods 0.000 description 6
- XLYOFNOQVPJJNP-UHFFFAOYSA-N water Substances O XLYOFNOQVPJJNP-UHFFFAOYSA-N 0.000 description 6
- -1 aromatic amino acids Chemical class 0.000 description 5
- 238000000576 coating method Methods 0.000 description 5
- 239000000975 dye Substances 0.000 description 5
- 230000000694 effects Effects 0.000 description 5
- 239000011159 matrix material Substances 0.000 description 5
- 108090000623 proteins and genes Proteins 0.000 description 5
- 238000004088 simulation Methods 0.000 description 5
- 230000003595 spectral effect Effects 0.000 description 5
- 108010043121 Green Fluorescent Proteins Proteins 0.000 description 4
- 102000004144 Green Fluorescent Proteins Human genes 0.000 description 4
- VYPSYNLAJGMNEJ-UHFFFAOYSA-N Silicium dioxide Chemical compound O=[Si]=O VYPSYNLAJGMNEJ-UHFFFAOYSA-N 0.000 description 4
- 238000004364 calculation method Methods 0.000 description 4
- 230000001427 coherent effect Effects 0.000 description 4
- 210000004207 dermis Anatomy 0.000 description 4
- 238000010586 diagram Methods 0.000 description 4
- 238000009543 diffuse optical tomography Methods 0.000 description 4
- 238000005286 illumination Methods 0.000 description 4
- MOFVSTNWEDAEEK-UHFFFAOYSA-M indocyanine green Chemical compound [Na+].[O-]S(=O)(=O)CCCCN1C2=CC=C3C=CC=CC3=C2C(C)(C)C1=CC=CC=CC=CC1=[N+](CCCCS([O-])(=O)=O)C2=CC=C(C=CC=C3)C3=C2C1(C)C MOFVSTNWEDAEEK-UHFFFAOYSA-M 0.000 description 4
- 229960004657 indocyanine green Drugs 0.000 description 4
- 229910052761 rare earth metal Inorganic materials 0.000 description 4
- 238000001228 spectrum Methods 0.000 description 4
- KFKRXESVMDBTNQ-UHFFFAOYSA-N 3-[18-(2-carboxylatoethyl)-8,13-bis(1-hydroxyethyl)-3,7,12,17-tetramethyl-22,23-dihydroporphyrin-21,24-diium-2-yl]propanoate Chemical compound N1C2=C(C)C(C(C)O)=C1C=C(N1)C(C)=C(C(O)C)C1=CC(C(C)=C1CCC(O)=O)=NC1=CC(C(CCC(O)=O)=C1C)=NC1=C2 KFKRXESVMDBTNQ-UHFFFAOYSA-N 0.000 description 3
- 239000012190 activator Substances 0.000 description 3
- 238000013459 approach Methods 0.000 description 3
- 201000011510 cancer Diseases 0.000 description 3
- 238000006243 chemical reaction Methods 0.000 description 3
- 239000011248 coating agent Substances 0.000 description 3
- 238000009792 diffusion process Methods 0.000 description 3
- 238000000295 emission spectrum Methods 0.000 description 3
- 210000002615 epidermis Anatomy 0.000 description 3
- 238000002073 fluorescence micrograph Methods 0.000 description 3
- 239000003446 ligand Substances 0.000 description 3
- 230000000670 limiting effect Effects 0.000 description 3
- 239000003504 photosensitizing agent Substances 0.000 description 3
- 108090000765 processed proteins & peptides Proteins 0.000 description 3
- 102000004169 proteins and genes Human genes 0.000 description 3
- 238000010791 quenching Methods 0.000 description 3
- 230000008685 targeting Effects 0.000 description 3
- 102000008186 Collagen Human genes 0.000 description 2
- 108010035532 Collagen Proteins 0.000 description 2
- 102000016942 Elastin Human genes 0.000 description 2
- 108010014258 Elastin Proteins 0.000 description 2
- 108090000790 Enzymes Proteins 0.000 description 2
- 102000004190 Enzymes Human genes 0.000 description 2
- LFQSCWFLJHTTHZ-UHFFFAOYSA-N Ethanol Chemical compound CCO LFQSCWFLJHTTHZ-UHFFFAOYSA-N 0.000 description 2
- 229910052688 Gadolinium Inorganic materials 0.000 description 2
- 241000282412 Homo Species 0.000 description 2
- QIVBCDIJIAJPQS-VIFPVBQESA-N L-tryptophane Chemical compound C1=CC=C2C(C[C@H](N)C(O)=O)=CNC2=C1 QIVBCDIJIAJPQS-VIFPVBQESA-N 0.000 description 2
- 239000002616 MRI contrast agent Substances 0.000 description 2
- XUMBMVFBXHLACL-UHFFFAOYSA-N Melanin Chemical compound O=C1C(=O)C(C2=CNC3=C(C(C(=O)C4=C32)=O)C)=C2C4=CNC2=C1C XUMBMVFBXHLACL-UHFFFAOYSA-N 0.000 description 2
- 102000035195 Peptidases Human genes 0.000 description 2
- 108091005804 Peptidases Proteins 0.000 description 2
- 239000002202 Polyethylene glycol Substances 0.000 description 2
- 239000004365 Protease Substances 0.000 description 2
- 108700008625 Reporter Genes Proteins 0.000 description 2
- FOIXSVOLVBLSDH-UHFFFAOYSA-N Silver ion Chemical compound [Ag+] FOIXSVOLVBLSDH-UHFFFAOYSA-N 0.000 description 2
- 108700019146 Transgenes Proteins 0.000 description 2
- QIVBCDIJIAJPQS-UHFFFAOYSA-N Tryptophan Natural products C1=CC=C2C(CC(N)C(O)=O)=CNC2=C1 QIVBCDIJIAJPQS-UHFFFAOYSA-N 0.000 description 2
- 239000006096 absorbing agent Substances 0.000 description 2
- 239000004480 active ingredient Substances 0.000 description 2
- 230000015572 biosynthetic process Effects 0.000 description 2
- 230000008859 change Effects 0.000 description 2
- 229920001436 collagen Polymers 0.000 description 2
- 230000000052 comparative effect Effects 0.000 description 2
- 239000013078 crystal Substances 0.000 description 2
- 230000007423 decrease Effects 0.000 description 2
- 238000011161 development Methods 0.000 description 2
- 229920002549 elastin Polymers 0.000 description 2
- 238000012632 fluorescent imaging Methods 0.000 description 2
- 150000004673 fluoride salts Chemical class 0.000 description 2
- 238000007306 functionalization reaction Methods 0.000 description 2
- UIWYJDYFSGRHKR-UHFFFAOYSA-N gadolinium atom Chemical compound [Gd] UIWYJDYFSGRHKR-UHFFFAOYSA-N 0.000 description 2
- 150000002251 gadolinium compounds Chemical class 0.000 description 2
- 239000007789 gas Substances 0.000 description 2
- 230000014509 gene expression Effects 0.000 description 2
- 230000005283 ground state Effects 0.000 description 2
- 125000002887 hydroxy group Chemical group [H]O* 0.000 description 2
- 230000006872 improvement Effects 0.000 description 2
- 238000000338 in vitro Methods 0.000 description 2
- 229940028435 intralipid Drugs 0.000 description 2
- 230000031700 light absorption Effects 0.000 description 2
- 239000007788 liquid Substances 0.000 description 2
- 229930027945 nicotinamide-adenine dinucleotide Natural products 0.000 description 2
- BOPGDPNILDQYTO-NNYOXOHSSA-N nicotinamide-adenine dinucleotide Chemical compound C1=CCC(C(=O)N)=CN1[C@H]1[C@H](O)[C@H](O)[C@@H](COP(O)(=O)OP(O)(=O)OC[C@@H]2[C@H]([C@@H](O)[C@@H](O2)N2C3=NC=NC(N)=C3N=C2)O)O1 BOPGDPNILDQYTO-NNYOXOHSSA-N 0.000 description 2
- 230000005298 paramagnetic effect Effects 0.000 description 2
- 230000037361 pathway Effects 0.000 description 2
- 230000035515 penetration Effects 0.000 description 2
- 229920001223 polyethylene glycol Polymers 0.000 description 2
- 229920000642 polymer Polymers 0.000 description 2
- 238000003908 quality control method Methods 0.000 description 2
- 230000000171 quenching effect Effects 0.000 description 2
- 230000002829 reductive effect Effects 0.000 description 2
- 238000011160 research Methods 0.000 description 2
- 238000000926 separation method Methods 0.000 description 2
- 239000000377 silicon dioxide Substances 0.000 description 2
- 239000007787 solid Substances 0.000 description 2
- 239000011343 solid material Substances 0.000 description 2
- 238000004611 spectroscopical analysis Methods 0.000 description 2
- 210000000434 stratum corneum Anatomy 0.000 description 2
- 239000000126 substance Substances 0.000 description 2
- 238000004154 testing of material Methods 0.000 description 2
- 108091005957 yellow fluorescent proteins Proteins 0.000 description 2
- MBAJNQDWJUHYOF-UHFFFAOYSA-N 7h-purin-6-amine;pyridine-3-carboxamide Chemical compound NC(=O)C1=CC=CN=C1.NC1=NC=NC2=C1NC=N2 MBAJNQDWJUHYOF-UHFFFAOYSA-N 0.000 description 1
- 208000007204 Brain death Diseases 0.000 description 1
- 206010006187 Breast cancer Diseases 0.000 description 1
- 208000026310 Breast neoplasm Diseases 0.000 description 1
- 230000005778 DNA damage Effects 0.000 description 1
- 231100000277 DNA damage Toxicity 0.000 description 1
- 229910052691 Erbium Inorganic materials 0.000 description 1
- 108010010803 Gelatin Proteins 0.000 description 1
- 238000000342 Monte Carlo simulation Methods 0.000 description 1
- 230000002411 adverse Effects 0.000 description 1
- ANVAOWXLWRTKGA-XHGAXZNDSA-N all-trans-alpha-carotene Natural products CC=1CCCC(C)(C)C=1/C=C/C(/C)=C/C=C/C(/C)=C/C=C/C=C(C)C=CC=C(C)C=CC1C(C)=CCCC1(C)C ANVAOWXLWRTKGA-XHGAXZNDSA-N 0.000 description 1
- 238000004458 analytical method Methods 0.000 description 1
- 230000002238 attenuated effect Effects 0.000 description 1
- 230000033228 biological regulation Effects 0.000 description 1
- 230000008512 biological response Effects 0.000 description 1
- 239000008280 blood Substances 0.000 description 1
- 210000004369 blood Anatomy 0.000 description 1
- 239000013590 bulk material Substances 0.000 description 1
- 235000005473 carotenes Nutrition 0.000 description 1
- 238000012512 characterization method Methods 0.000 description 1
- 238000004891 communication Methods 0.000 description 1
- 238000013480 data collection Methods 0.000 description 1
- 230000007812 deficiency Effects 0.000 description 1
- 230000001066 destructive effect Effects 0.000 description 1
- 230000002542 deteriorative effect Effects 0.000 description 1
- 238000003745 diagnosis Methods 0.000 description 1
- 230000029087 digestion Effects 0.000 description 1
- 238000010494 dissociation reaction Methods 0.000 description 1
- 230000005593 dissociations Effects 0.000 description 1
- 229940079593 drug Drugs 0.000 description 1
- 239000003814 drug Substances 0.000 description 1
- 230000000857 drug effect Effects 0.000 description 1
- 235000013399 edible fruits Nutrition 0.000 description 1
- 230000009881 electrostatic interaction Effects 0.000 description 1
- 230000007613 environmental effect Effects 0.000 description 1
- 239000000835 fiber Substances 0.000 description 1
- 150000002211 flavins Chemical class 0.000 description 1
- 229920000159 gelatin Polymers 0.000 description 1
- 239000008273 gelatin Substances 0.000 description 1
- 235000019322 gelatine Nutrition 0.000 description 1
- 235000011852 gelatine desserts Nutrition 0.000 description 1
- 239000005090 green fluorescent protein Substances 0.000 description 1
- 239000012585 homogenous medium Substances 0.000 description 1
- 239000001257 hydrogen Substances 0.000 description 1
- 229910052739 hydrogen Inorganic materials 0.000 description 1
- 238000011503 in vivo imaging Methods 0.000 description 1
- 239000004615 ingredient Substances 0.000 description 1
- 238000002347 injection Methods 0.000 description 1
- 239000007924 injection Substances 0.000 description 1
- 238000001990 intravenous administration Methods 0.000 description 1
- 238000011835 investigation Methods 0.000 description 1
- 230000001788 irregular Effects 0.000 description 1
- 229910052747 lanthanoid Inorganic materials 0.000 description 1
- 150000002602 lanthanoids Chemical class 0.000 description 1
- 150000002605 large molecules Chemical class 0.000 description 1
- 229920002521 macromolecule Polymers 0.000 description 1
- 238000000386 microscopy Methods 0.000 description 1
- 230000004001 molecular interaction Effects 0.000 description 1
- 239000003068 molecular probe Substances 0.000 description 1
- 238000012806 monitoring device Methods 0.000 description 1
- 229920005615 natural polymer Polymers 0.000 description 1
- 150000007523 nucleic acids Chemical class 0.000 description 1
- 102000039446 nucleic acids Human genes 0.000 description 1
- 108020004707 nucleic acids Proteins 0.000 description 1
- 230000005693 optoelectronics Effects 0.000 description 1
- 230000037368 penetrate the skin Effects 0.000 description 1
- 230000035699 permeability Effects 0.000 description 1
- 230000008832 photodamage Effects 0.000 description 1
- 238000002428 photodynamic therapy Methods 0.000 description 1
- 102000004196 processed proteins & peptides Human genes 0.000 description 1
- 239000011253 protective coating Substances 0.000 description 1
- 230000004850 protein–protein interaction Effects 0.000 description 1
- 230000002685 pulmonary effect Effects 0.000 description 1
- 238000005086 pumping Methods 0.000 description 1
- 230000005855 radiation Effects 0.000 description 1
- 150000002910 rare earth metals Chemical class 0.000 description 1
- 108010054624 red fluorescent protein Proteins 0.000 description 1
- 238000009877 rendering Methods 0.000 description 1
- 230000027756 respiratory electron transport chain Effects 0.000 description 1
- 230000002441 reversible effect Effects 0.000 description 1
- PYWVYCXTNDRMGF-UHFFFAOYSA-N rhodamine B Chemical class [Cl-].C=12C=CC(=[N+](CC)CC)C=C2OC2=CC(N(CC)CC)=CC=C2C=1C1=CC=CC=C1C(O)=O PYWVYCXTNDRMGF-UHFFFAOYSA-N 0.000 description 1
- 239000004065 semiconductor Substances 0.000 description 1
- 210000003491 skin Anatomy 0.000 description 1
- 150000003384 small molecules Chemical class 0.000 description 1
- HQHVZNOWXQGXIX-UHFFFAOYSA-J sodium;yttrium(3+);tetrafluoride Chemical compound [F-].[F-].[F-].[F-].[Na+].[Y+3] HQHVZNOWXQGXIX-UHFFFAOYSA-J 0.000 description 1
- 239000002904 solvent Substances 0.000 description 1
- 230000003068 static effect Effects 0.000 description 1
- 238000003786 synthesis reaction Methods 0.000 description 1
- 229920001059 synthetic polymer Polymers 0.000 description 1
- 230000000699 topical effect Effects 0.000 description 1
- 231100000331 toxic Toxicity 0.000 description 1
- 230000002588 toxic effect Effects 0.000 description 1
- LOIYMIARKYCTBW-OWOJBTEDSA-N trans-urocanic acid Chemical compound OC(=O)\C=C\C1=CNC=N1 LOIYMIARKYCTBW-OWOJBTEDSA-N 0.000 description 1
- LOIYMIARKYCTBW-UHFFFAOYSA-N trans-urocanic acid Natural products OC(=O)C=CC1=CNC=N1 LOIYMIARKYCTBW-UHFFFAOYSA-N 0.000 description 1
- 238000013518 transcription Methods 0.000 description 1
- 230000035897 transcription Effects 0.000 description 1
- 230000001960 triggered effect Effects 0.000 description 1
- 239000000439 tumor marker Substances 0.000 description 1
- 239000013598 vector Substances 0.000 description 1
- 229910003366 β-NaYF4 Inorganic materials 0.000 description 1
Images


Classifications
-
- A—HUMAN NECESSITIES
- A61—MEDICAL OR VETERINARY SCIENCE; HYGIENE
- A61B—DIAGNOSIS; SURGERY; IDENTIFICATION
- A61B5/00—Measuring for diagnostic purposes; Identification of persons
- A61B5/0059—Measuring for diagnostic purposes; Identification of persons using light, e.g. diagnosis by transillumination, diascopy, fluorescence
-
- G—PHYSICS
- G01—MEASURING; TESTING
- G01N—INVESTIGATING OR ANALYSING MATERIALS BY DETERMINING THEIR CHEMICAL OR PHYSICAL PROPERTIES
- G01N21/00—Investigating or analysing materials by the use of optical means, i.e. using sub-millimetre waves, infrared, visible or ultraviolet light
- G01N21/17—Systems in which incident light is modified in accordance with the properties of the material investigated
- G01N21/47—Scattering, i.e. diffuse reflection
-
- A—HUMAN NECESSITIES
- A61—MEDICAL OR VETERINARY SCIENCE; HYGIENE
- A61B—DIAGNOSIS; SURGERY; IDENTIFICATION
- A61B5/00—Measuring for diagnostic purposes; Identification of persons
- A61B5/0059—Measuring for diagnostic purposes; Identification of persons using light, e.g. diagnosis by transillumination, diascopy, fluorescence
- A61B5/0062—Arrangements for scanning
- A61B5/0068—Confocal scanning
-
- A—HUMAN NECESSITIES
- A61—MEDICAL OR VETERINARY SCIENCE; HYGIENE
- A61B—DIAGNOSIS; SURGERY; IDENTIFICATION
- A61B5/00—Measuring for diagnostic purposes; Identification of persons
- A61B5/0059—Measuring for diagnostic purposes; Identification of persons using light, e.g. diagnosis by transillumination, diascopy, fluorescence
- A61B5/0073—Measuring for diagnostic purposes; Identification of persons using light, e.g. diagnosis by transillumination, diascopy, fluorescence by tomography, i.e. reconstruction of 3D images from 2D projections
-
- A—HUMAN NECESSITIES
- A61—MEDICAL OR VETERINARY SCIENCE; HYGIENE
- A61B—DIAGNOSIS; SURGERY; IDENTIFICATION
- A61B5/00—Measuring for diagnostic purposes; Identification of persons
- A61B5/05—Detecting, measuring or recording for diagnosis by means of electric currents or magnetic fields; Measuring using microwaves or radio waves
- A61B5/055—Detecting, measuring or recording for diagnosis by means of electric currents or magnetic fields; Measuring using microwaves or radio waves involving electronic [EMR] or nuclear [NMR] magnetic resonance, e.g. magnetic resonance imaging
-
- G—PHYSICS
- G01—MEASURING; TESTING
- G01N—INVESTIGATING OR ANALYSING MATERIALS BY DETERMINING THEIR CHEMICAL OR PHYSICAL PROPERTIES
- G01N21/00—Investigating or analysing materials by the use of optical means, i.e. using sub-millimetre waves, infrared, visible or ultraviolet light
- G01N21/17—Systems in which incident light is modified in accordance with the properties of the material investigated
- G01N21/47—Scattering, i.e. diffuse reflection
- G01N21/4795—Scattering, i.e. diffuse reflection spatially resolved investigating of object in scattering medium
-
- G—PHYSICS
- G01—MEASURING; TESTING
- G01N—INVESTIGATING OR ANALYSING MATERIALS BY DETERMINING THEIR CHEMICAL OR PHYSICAL PROPERTIES
- G01N21/00—Investigating or analysing materials by the use of optical means, i.e. using sub-millimetre waves, infrared, visible or ultraviolet light
- G01N21/62—Systems in which the material investigated is excited whereby it emits light or causes a change in wavelength of the incident light
- G01N21/63—Systems in which the material investigated is excited whereby it emits light or causes a change in wavelength of the incident light optically excited
- G01N21/64—Fluorescence; Phosphorescence
- G01N21/6428—Measuring fluorescence of fluorescent products of reactions or of fluorochrome labelled reactive substances, e.g. measuring quenching effects, using measuring "optrodes"
-
- G—PHYSICS
- G01—MEASURING; TESTING
- G01N—INVESTIGATING OR ANALYSING MATERIALS BY DETERMINING THEIR CHEMICAL OR PHYSICAL PROPERTIES
- G01N21/00—Investigating or analysing materials by the use of optical means, i.e. using sub-millimetre waves, infrared, visible or ultraviolet light
- G01N21/62—Systems in which the material investigated is excited whereby it emits light or causes a change in wavelength of the incident light
- G01N21/63—Systems in which the material investigated is excited whereby it emits light or causes a change in wavelength of the incident light optically excited
- G01N21/64—Fluorescence; Phosphorescence
- G01N21/645—Specially adapted constructive features of fluorimeters
- G01N21/6456—Spatial resolved fluorescence measurements; Imaging
Definitions
- This invention pertains in general to the field of photoluminescence imaging or photoluminescence tomography of absorbing and scattering media, as well as photoluminescent markers for such photoluminescence imaging of scattering media or for such photoluminescence tomography of scattering media.
- Tissue optics is a field devoted to study the interaction of light with such tissue. Over the last decades, the field has grown rapidly. With increasing knowledge of the light-tissue interaction, the interest in applying tissue optics as a diagnostic tool is also emerging, reaping the fruits from the fundamental research.
- photoluminescence imaging including photoluminescence tomography, which are non-invasive approaches for in-vivo imaging of humans or animals. These imaging approaches are luminescence-based and require an external source of light for excitation of luminescent biological markers.
- Photoluminescence is a process in which a substance absorbs photons and then re-radiates photons.
- a specific form of luminescence is fluorescence, where typically emitted photons are of lower energy than those used for illumination.
- fluorescence the fluorescent wavelength is Stokes shifted to a longer wavelength with reference to the wavelength of the illuminating light.
- Fluorescent imaging is known and can, for example, be used to study biological responses from drugs in small animals over a period of time, without the need to sacrifice them.
- fluorescence molecular imaging and tomography systems for diffuse luminescent imaging or diffuse luminescent tomography in absorbing and scattering media suffer from a number of drawbacks. They have for instance a low resolution or contrast, which makes diagnostic tasks based on the imaging results difficult. Hence, there is a need for such systems having improved image quality, e.g. by improved contrast and/or resolution of the two-dimensional or three-dimensional images provided.
- the autofluorescence conceals the fluorescence signal when using Stokes-shifted fluorophores, effectively limiting the signal-to-background sensitivity.
- US 2007/0249943 describes a method of optically imaging at least one biological tissue, in particular to define areas of interest of tissue(s) to be analyzed by tomography.
- the method includes introducing at least one fluorescent marker into the tissue(s).
- embodiments of the present invention preferably seek to mitigate, alleviate or eliminate one or more deficiencies, disadvantages or issues in the art, such as the above-identified, by providing a system, and a method, according to the appended patent claims.
- a method of imaging a region in a scattering medium by diffuse luminescence molecular imaging comprises at least one luminescent marker arranged in the scattering medium at a marker position, where the luminescent marker is a non-linear luminescent marker.
- the method comprises exciting the luminescent marker by excitation light emitted by one or more light sources into an excitation volume from at least one light source position, detecting luminescence from the luminescent marker due to the excitation light by a detector at a luminescent light detection position, providing movement between the light source position and the marker position, and imaging the luminescent marker based on a non-linear dependence of the detected luminescence on the excitation light intensity and the light source position in relation to the marker position.
- a system for diffuse luminescence molecular imaging of a region of interest in a scattering medium comprises a luminescent marker for use in the luminescent molecular imaging of the scattering medium, where the luminescent marker is a non-linear luminescent marker arranged in the scattering medium.
- the system comprises one or more light sources positioned by at least one light source position for exciting the luminescent marker by excitation light emitted by the one or more light sources into an excitation volume.
- the system comprises a detector at a luminescent light detection position detecting luminescence from the luminescent marker due to the excitation light, wherein the luminescent molecular imaging comprises imaging the luminescent marker based on a non-linear dependence of the detected luminescence on the excitation light intensity and the light source position in relation to the marker position.
- the luminescent marker is comprised in a group of non-linear luminescent markers configured to upconvert incoming light of an illumination wavelength, such that luminescence occurs at a luminescence wavelength that is shorter than said illumination wavelength when said luminescent marker is illuminated with said incoming light.
- the luminescent marker is in certain embodiments a biological luminescent marker.
- a use of a system of the second aspect of the disclosure is provided for luminescence imaging or tomography of tablets.
- a use of a system of the second aspect of the disclosure is provided for in-vivo or in-vitro luminescence imaging or tomography of a small animal.
- a use of a system of the second aspect of the disclosure is provided for functional diagnostics, such as cancer diagnostics, by said luminescence imaging or tomography.
- the non-linear markers are attached to an imaging contrast agent for another imaging modality.
- a non-linear marker is attached to a contrast agent for imaging with a conventional imaging modality, such as Magnetic Resonance Imaging (MRI), X-Ray, etc.
- MRI Magnetic Resonance Imaging
- X-Ray X-Ray
- a non-linear marker is attached to an organic gadolinium complex or gadolinium compound, which has paramagnetic properties.
- Some embodiments provide for increased resolution in diffuse luminescence molecular imaging and in fluorescence molecular tomography.
- Some embodiments provide for determination of distribution of ingredients in tablets.
- a non-linear luminescent marker or fluorophore may be attached to an active ingredient in a tablet.
- the spatial distribution of the active ingredient may thus advantageously be determined.
- Some embodiments provide for enhanced contrast in medical magnetic resonance imaging, when non-linear markers are used as an MRI contrast agent.
- luminescence imaging or tomography may be made, providing for functional diagnostic information combined with high resolution MRI of one and the same region of interest and in-vivo.
- Some embodiments of this disclosure pertain to an area within the aforementioned tissue optics dealing with diffuse luminescence imaging and tomography. For most visible wavelengths, light does not penetrate more than a few millimeters into tissue. But in the diagnostic window (wavelength 600 to 1600 nm), the light penetration is sufficient to allow imaging through up to several centimeters. This opens up the possibility of imaging fluorescent contrast agents deep in tissue. Fluorescent imaging of diffusely scattered light has a notable importance in biomedical applications.
- Fluorescence tomography is based on three-dimensional reconstructions of contrast agent distributions inside humans or animal.
- the three-dimensional reconstructions are based on fluorescence imaging techniques.
- the area of fluorescence imaging and tomography of diffusely scattered light has long been adversely affected by the ever-present endogenous tissue autofluorescence, and suffered from poor contrast and resolution.
- the autofluorescence conceals the signal from the contrast agents when using Stokes-shifted fluorophores, effectively limiting the signal-to-back-ground sensitivity.
- non-linear markers such as upconverting nanocrystals
- upconverting nanocrystals are shown being important biological markers for tissue imaging purposes.
- Examples for such areas are luminescent imaging or tomography for material testing, including quality control of tablets, filters for liquids or gases through which flows a medium with non-linear markers, etc.
- fluorescence imaging represents all types of imaging of luminescence.
- any imaging or tomography discussed is in highly scattering media, traditionally providing poor resolution due to the diffuse character of the light detected.
- Embodiments of the present invention advantageously improve contrast and resolution of such luminescent imaging, including in luminescent tomography.
- fluorescence imaging represents all types of imaging of luminescence. Also, any imaging or tomography discussed is in highly scattering media, providing poor resolution due to the diffuse character of the light detected.
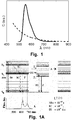
- FIG. 1A shows a Jablonski diagram showing the various decay paths from an excited state of a molecule.
- a fluorescence spectrum from haematoporphyrin in ethanol is shown.
- the abbreviations are: Sn: singlet states; Tn: triplet states; Abs: absorption; Sc: scattering; IC: internal conversion; F: fluorescence; IX: intersystem crossing; P: phosphorescence; A: transfer to other molecules.
- Sn singlet states
- Tn triplet states
- Abs absorption
- Sc scattering
- IC internal conversion
- F fluorescence
- IX intersystem crossing
- P phosphorescence
- A transfer to other molecules.
- the approximate time-scale for some processes is shown down right in Fig. 1A , as lifetimes (LT), also denoted ⁇ .
- an incoming photon has an energy that corresponds to the gap between two energy bands in the molecule, it can be absorbed.
- the photon energy will thereby be used for excitation of the molecule to the higher energy band.
- Excited states are unstable and the molecule will return to the ground state.
- the deexcitation may follow a number of different pathways, as illustrated in Figure 1A .
- the labelled levels are electronic levels, corresponding to the energy levels of atoms. S0, S1, etc. are singlet states for which the sum of the electron spin quantum numbers is zero, while T0, T1, etc. are triplet states for which the spin of one electron has changed sign. For large molecules the intervals between the levels are very small and the states overlap due to molecular interactions.
- the de-excitation may result in the emission of a photon and this process is called fluorescence. Since the transition may be terminated in any of the rotational-vibrational states of S0, the energy of the different photons will not have a distinct value, but rather a broad distribution. Thus, a fluorescence spectrum from a molecule will be broad, most often without any significant structures. The form of the spectrum will reflect the probability of transitions to the lower levels (S0). In the lower part of Fig. 1A the fluorescence spectrum of haematoporphyrin, which is a tumour marker, or photosensitizer, and will be discussed later on, is shown. Once the pathway absorption-IC-fluorescence is completed, the molecule is back in its original state and configuration. Hence, the fluorescence process is non-destructive and reversible, which is an advantage in, for instance, medical diagnostics.
- fluorescent molecules have one important feature in common, that is the unbroken chain of conjugated double bonds, i.e. every second bond is a double bond.
- the structure of haematoporphyrin is an example for this (not shown). This is a fluorescent molecule used for fluorescence diagnostics and photodynamic therapy of tumours.
- fluorescence Another important aspect of fluorescence is the rapid relaxation in the excited as well as in the ground state.
- the molecule looses some of its excitation energy by relaxation.
- the energy of the fluorescence photons is lower than that of the excitation, or in other words, the fluorescence wavelength is longer than the excitation wavelength. This is called Stokes shift and is different for different molecular environments.
- a general knowledge of the molecular environment is required for an adequate fluorescence diagnosis.
- Fluorescence imaging systems can detect a fluorescence signal in large number of points. Thus, a two-dimensional image of an area of interest is created. Atypical system comprises a camera together with a tunable filter, see Figure 5a . A similar setup in transillumination is schematically illustrated in Fig. 5b . With a tunable filter the wanted detection wavelengths can easily be selected and a spectral resolution of approximately 20 nm wide may be achieved.
- non-linear marker is a luminescent marker, wherein a luminescence (L) of the marker is not linearly dependent on the luminous flow of excitation light (E).
- E local field of excitation light
- non-linear markers or fluorophores
- contrast and resolution of luminescent imaging is improved, as is demonstrated below.
- FIG. 7a illustrates a linear fluorescence image in gray-scale. Each pixel (705) corresponds to one excitation point (704) in a grid pattern (701).
- Fig. 7b illustrates an image obtained with a two-photon, non-linear fluorophore, i.e. non-linear luminescent marker (702).
- the fluorophore (702) is shown in red (larger circle) (703), and the black dots (704) indicate the points of excitation in the grid pattern (701).
- the circle (703) corresponds to the projected image of the marker (702) on the grid pattern (701).
- the excitation points (704) corresponds to the positions of the light source, i.e. laser (503), when scanning the luminescent marker (702). It can clearly be seen that using the non-linear fluorophore increases contrast and resolution of the fluorescent image. This is further supported by Fig. 9 and Figs. 10A,B described below.
- the excitation volume is sufficiently small and localized to the light source position (706) for the non-linear marker, such that no luminescence is detected in the corresponding pixel (708) in Fig. 7b .
- the corresponding pixel (707) receives luminescence due to the increased excitation volume in the scattering media.
- the two-photon non-linear dependence provides the narrow photon-density of the excitation volume.
- imaging the marker (702) based on the non-linear dependence of the detected luminescence on the excitation light intensity, the resolution may be increased.
- Non-linear fluorophores require in general higher excitation intensities compared to linear fluorophores and some non-linear fluorophores even require coherent excitation.
- high intensities are difficult to achieve, since light cannot be focused, but rather spreads in every direction. This makes some non-linear fluorophores more suitable for fluorescence imaging in scattering media as compared to others.
- the fluorophores need to have an exceptionally high yield, and they may not require coherent excitation. Up-converting nanoparticles are one such non-linear fluorophore with high yield and non-coherent excitation.
- a planar image of the fluorescence emitted from the surface of an object contains information about several aspects.
- the spectroscopic features yield the type of fluorophore, and the intensity is related to the concentration of the fluorophore.
- Quantify means that the true concentration of a fluorophore is sought whereas the term “localize” means that the concentration in every three-dimensional voxel of the object is sought.
- the two terms also leads to the possibility to form a three-dimensional image, based on the fluorophore contrast, of the interior of the object hence motivating the use of the name tomography.
- ICG Indocyanine green
- the fluorophores can be categorized into active probes and activateable probes.
- the active probes are non-specific fluorophores that are attached to an affinity ligand specific for the target. These ligands can be antibodies, peptides and labeled small molecules.
- the active probe emits fluorescence upon excitation even if it is not attached to the target ligand. This results in background fluorescence which is non-specific, i.e. no information about the target to be imaged.
- the activateable probes are more specific since these only emit fluorescence when "switched on”.
- the fluorophores are arranged in close proximity to a quencher alternatively several fluorophores are placed together to self-quench each other. This arrangement is possible due to an enzyme-specific peptide sequence. In the presence of an enzyme the peptide sequence can be cleaved thus the fluorophores are free to emit light, no quenching.
- the use of activateable probes has been demonstrated for identification of proteases in vivo.
- the activateable probes are sometimes referred to as smart probes or optical beacons since they only are able to emit light upon excitation when the target molecule is present. Fluorescent probes are targeting a specific molecule or a specific biological event thus the function is imaged.
- probes that are genetically encoded.
- a transgene reporter gene
- the transgene encodes for a fluorescent protein (FP) which upon transcription will be produced intrinsically inside the animal.
- the probes can be detected using optical techniques and this modality is called indirect fluorescence imaging since the fluorescence emitted visualizes the presence of gene regulation or gene expression.
- Cells can be transfected with a reporter gene and cell tracking can be imaged. Fusing the FP to a gene of interest makes it possible to image almost any protein in vivo.
- the FPs in indirect fluorescence imaging provides interesting imaging capabilities e.g. protein-protein interactions due to the fact that the protein of interest might be unaffected while the FP emits fluorescence.
- GFP green fluorescent proteins
- the probe development is pushing forward to develop GFP emitting and absorbing in the NIR region.
- the contrast is dependent on the fluorophore concentration and the fluorophore position. The contrast is also controlled by so called active probes. If the fluorophore is not active no fluorescence will be emitted.
- An ever present problem using fluorescence diagnostics in biological media is autofluorescence and the background fluorescence.
- Autofluorescence is the fluorescence emitted by endogenous chromophores while the background fluorescence is fluorescence originating from fluorescent probes outside the region-of-interest. Ways of theoretically subtract the autofluorescence and the background fluorescence has been reported. The presence of non-specific fluorescence effectively reduces the contrast.
- Fluorescent proteins is evidently not an alternative for human applications hence fluorophore imaging will be achieved by functionalizing non-specific molecular probes.
- the fluorescence tomography Due to the quadratic dependence of the emitted fluorescence in e.g. up-converting nanocrystals, the fluorescence tomography is improved.
- the contrast enhancement is even further improved (not shown).
- tissue optics Light interaction with tissue is studied.
- tissue are inhomogeneous and absorptive media, with a slightly higher refractive index than water.
- tissue has a high concentration of water, it is an advantage to use light from a wavelength region where the absorption from water is low, this will enforce an ultimate limit on the usable wavelengths.
- light needs to penetrate the skin which will put further constraints on the usable wavelengths.
- the skin can be seen as a layered structure, with the stratum corneum on top, followed by the epidermis and the dermis below.
- the stratum corneum and epidermis are very effective in attenuating light, mainly due to high absorption for wavelengths ⁇ 300 nm from aromatic amino acids, nucleic acids and urocanic acid. For longer wavelengths, 350-1200 nm, melanin in the epidermis is the major absorber.
- scattering begins to dominate over absorption.
- the dermis can thus be described as a turbid tissue matrix.
- scattering usually dominates over absorption. In a crude approximation, the scattering can be modeled using Rayleigh scattering. This implies that light at shorter wavelengths will be much more scattered than light at longer wavelengths.
- the transdermal diagnostic window resides in the longer wavelength regions and can be considered to range from 600 nm to 1600 nm.
- Tissue contains several endogenous fluorophores which have a strong fluorescence with small Stokes shift when excited by A ⁇ 600 nm.
- the endogenous autofluorescence from tissue is in general much weaker.
- the signal itself is also weak, thus still limited by the background autofluorescence which causes artifacts.
- Atypical signal (continuous line) with an autofluorescence background spectrum (dashed line) is shown in Fig. 1 .
- the aforementioned autofluorescence, or the tissues own endogenous fluorescence, is caused by several different fluorophores.
- Some of the common tissue fluorophores are collagen and elastin present in connective fibres, tryptophan present in most proteins and flavins and nicotinamid adenine dinucleotide (NADH) active in the digestion of cells, see Fig. 1B showing spectra of collagen (101), Elastin (102), NADH (103), and caroten (104).
- the spectra are also influenced by the optical properties of the tissue.
- Strong absorbers such as haemoglobin, can absorb fluorescence light at certain wavelengths and thus change the appearance of the fluorescence spectrum, creating false dips and peaks.
- Haemoglobin may also decrease the overall intensity of the fluorescence spectrum, without changing its shape, by absorbing the excitation light.
- exogenous fluorophores are fluorescent proteines (FP), NIR-dyes (ND), Quantum dots (QD), or Photosensitizers (PS).
- Quantum dots are a linear fluorophore that emits a signal that is more Stokes shifted than the tissue autofluorescence. Quantum dots are fluorophores that absorb mainly in the ultraviolet (UV) region. Since using illuminating light at short wavelengths is not ideal for transdermal measurements and UV light is subject to shallow transdermal penetration depths and risks for DNA damage in the illuminated tissue, QD are not suitable for many applications. Furthermore, quantum dots are often fabricated of materials that are highly toxic for organisms. Moreover, studies have shown that quantum dots tend to react when exposed to biological environments and can be very harmful.
- non-linear fluorophores examples include nanoparticles (NP), described in more detail below.
- Upconversion is a non-linear process that occurs when two or more photons are absorbed and a photon of higher energy, than those of the incoming photons, is released.
- the process is for instance observed in materials containing a meta-stable state that can trap one electron for a long time, increasing the interaction-probability with another arriving photon.
- luminescent markers in form of solids doped with different rare earth ions are used to obtain upconversion.
- Solid state upconverting materials are for instance fabricated by doping the materials with rare earth ions.
- the rare earths fills their outer electron shells before their inner shells, giving them sharp atomic-like spectral lines, even when bound in solid materials.
- Upconversion can happen due to numerous processes, which impact the upconversion process differently depending on the ion pairs and the excitation intensities.
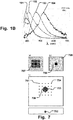
- This energy diffusion can be radiative or non-radiative, resonant or non-resonant, see Fig. 2a and Fig. 2b .
- a photon is released from the sensitizer and absorbed by the activator, while in the non-radiative case, the excitation energy will jump from one ion to the other via an electrostatic interaction.
- the two cases can be experimentally distinguished.
- the radiative transfer is dependent on the shape of the sample and also affects the emission spectrum as well as the lifetime of the activator.
- the transition is non-resonant, it has to be phonon-assisted.
- the non-resonant transitions are encountered for higher energy differences between rare-earth ions compared to other solid materials, especially in the non-radiative case.
- ETU Energy Transfer Upconversion
- ESA Excited-State Absorption
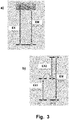
- Figs. 3 a) and b) are schematic illustrations of fluorescence and multiple excitation in upconversion luminescence, respectively.
- the emission wavelength (EM) is longer than the excitation wavelength (EX).
- Fig. 3 b) shows multiple excitation occurring in step 1 (EX1) and step 2 (EX2), where the emission wavelength (EM) is shorter than the excitation wavelengths.
- Upconverting nanocrystals are herein disclosed as fluorophores in biomedical imaging applications due to their unique property to efficiently emit anti-Stokes shifted light upon near-infrared (NIR) excitation. This provides for detecting a fluorescent signal in a region where no autofluorescence is present.
- NIR near-infrared
- Nanosized upconverting particles are for instance lanthanide doped oxides (Y 2 O 3 ), which are easy to fabricate.
- nanosized upconverting particles are for instance fluorides, which have higher efficiencies than Y 2 O 3 .
- the higher efficiencies can be explained by the low phonon energies in fluorides, which lower the probability for non-radiative decay.
- Nanosized upconverting particles are for instance made of sodium yttrium tetrafluoride (NaYF 4 ), co-doped with either Yb 3 +/Er 3 + or Yb 3 +/Tm 3+ .
- NaYF 4 sodium yttrium tetrafluoride
- NaYF 4 can crystallize in two phases, cubic or hexagonal, called ⁇ -NaYF4 and ⁇ -NaYF4, respectively.
- the upconverted luminescence from the ⁇ -phase material is approximately one order of magnitude higher compared to the upconverted luminescence from the ⁇ -phase.
- the particles also show other size-dependent properties.
- the ratio between the different emission lines is different for nanoparticles and bulk material.
- upconverting nanoparticles are suitable as biological markers for different bioimaging applications.
- Luminescent imaging does not suffer from any autofluorescence. Luminescent imaging is provided with better contrast, e.g. compared to biological markers of Stokes-shifted fluorophores.
- non-linear fluorophores such as the upconverting nanoparticles may also be biofunctionalized, giving them for example tumor seeking abilities.
- the non-linear fluorophores may be water soluble, allowing for easy administration in certain applications, such as in solutions for intravenous, peroral, or enteral administration.
- a way to provide upconverting nanoparticles as water soluble is to coat the particles with a structure that is polar.
- Coatings may for instance be made of polymers or silica. Both synthetic polymers, for example, Polyethylene glycol (PEG), and natural polymers may be used for the coating. These polymers are stable in biological environments and do not interfere with the optical properties of the nanocrystals in any significant negative way.
- PEG Polyethylene glycol
- Coating the particles with silica usually gives a very robust coating, which is in particular advantageous in biological environments.
- Water soluble upconverting nanoparticles may be provided without coatings. Hydroxyl groups may be attached to the surfaces of the upconverting nanoparticles, either by chemical bonds or physical absorption. Hydroxyl groups are by definition formed by covalent binding, and the final structure has polar properties.
- a stable protective coating may be applied to the nanoparticles for making them advantageously suitable for use in biological environments.
- Upconverting nanoparticles may be made in similar ways than functionalizing quantum dots, such as described in X. Gao et. al., In vivo cancer targeting and imaging with semiconductor quantum dots, Nature Biotechnology, 22, 8:969-976, 2004 . In Gao et. al. methods are described that are applicable on upconverting rare-earth doped nanoparticles.
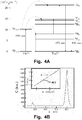
- the upconverting nanoparticles used in an embodiment in this disclosure were NaYF 4 -crystals prepared according to the method described in G. Yi et. al., Synthesis, characterization, and biological application of size-controlled nanocrystalline NaYF4:Yb,Er infrared-to-visible upconversion phosphors. Nano Letters, 4, 11:2191-2196, 2004 , doped with a combination of Yb 3+ and Tm 3+ . The energy diagrams for the two ions are shown in Fig. 4A.
- Fig. 4A is a schematic illustration of upconversion processes in the Yb 3+ /Tm 3+ ion pair.
- Nonradiative upconverting processes are illustrated with dashed arrows and non-radiative decays are omitted for clarity.
- Fig. 4B is a graph showing the emission spectrum for these upconverting nanoparticles.
- the blue emission line at 477 nm is only visible for higher pump intensities.
- the pump-power dependence of the 800 nm line was measured to be quadratic using low intensities, as seen in the inset of Fig. 4B , showing intensity (I) on the x-axis and counts (C) on the y-axis and where the slope (S) of the fitted line (401) equals 2.
- the non-linear markers are attached to an imaging contrast agent for another imaging modality.
- a non-linear marker is attached to a contrast agent for imaging with a conventional imaging modality, such as Magnetic Resonance Imaging (MRI), X-Ray, etc.
- MRI Magnetic Resonance Imaging
- a non-linear marker is attached to an organic gadolinium complex or gadolinium compound, which has paramagnetic properties.
- contrast is enhanced in medical magnetic resonance imaging.
- luminescence imaging or tomography may be made, providing for functional diagnostic information combined with high resolution MRI of one and the same region of interest and in-vivo.
- Examples for such areas are luminescent imaging or tomography for material testing, including quality control of tablets, filters for liquids or gases through which flows a medium with non-linear markers, etc.
- Upconverting nanocrystals were used in experimental set-ups in order to confirm the applicability of non-linear markers in luminescent imaging. To demonstrate the adequacy for use as fluorophores for in vivo applications, two experiments were performed.
- Figs. 5a and 5b The planar imaging systems used for data collection are shown schematically in Figs. 5a and 5b.
- Fig. 5a is a schematic illustration of a setup for fluorophore imaging (epi-fluorescence); and
- Fig. 5b is a setup for fluorophore reconstruction in transillumination.
- a tissue phantom (501) was used that consisted of a solution of intralipid ink with optical properties determined by a time-of-flight spectroscopy system (500).
- the fluorophores (502) were contained in capillary tubes with inner diameters of 2.4 mm.
- the concentrations of the fluorophores were 1 wt% for the nanoparticles and 1 ⁇ M for the traditional downconverting fluorophores of the type DY-781.
- the concentration of the nanoparticles was chosen to have a reasonable correspondence with studies using quantum dots, namely a concentration of 1 wt% was used.
- the fiber coupled lasers (503) could be raster scanned.
- the positions of the laser in the raster scan may be described by a grid pattern (701) as shown in Fig. 7 .
- An image was acquired for each scanned position with an air cooled CCD (504) camera sitting behind two dielectric band pass filters centered at 800 nm.
- Fig. 5c shows a raster scanning setup (507) where the laser is scanning the tissue phantom (501) from a below position (505).
- the CCD (504) may capture one image for every position (506) of the laser.
- the positions (506) describes a grid pattern (508) similar to the grid pattern (701) in Fig. 7 .
- the number of pixels in the image was given by the number of excitation positions (506) and not by the number of CCD pixels.
- the resolution may thus be determined by the photon-density of the excitation light from the laser light source (505), and not by the photon-density of the fluorescence emission light. In this way, because the two-photon photon-density in the excitation volume is more narrow than the single-photon photon-density, the resolution could be increased.
- a threshold value may be applied to the detected luminescence. In this way resolution may be increased. For example, only if the luminescence intensity is above a defined threshold it will be added to the total luminescence intensity.
- the threshold may be defined as a value in the CCD (504), for example if the luminescence intensity is below 30% of a peak value it will be discarded, as it might be considered as a background signal. Further, if the resulting total luminescence for a pixel, or position (506) of the laser, is below another threshold value it may be considered as background signal and removed.
- the quadratic intensities of the luminescence signal may be summed. In this way the resolution may be further increased.
- the luminescence intensity detected by the CCD (504), which may have relative value between 0 and 1 by definition of a peak intensity value in the CCD, may be multiplied with itself before added to the total luminescence intensity for the current pixel or position (506). Further, the total luminescence intensity may be multiplied with itself for each pixel or position (506).
- Fig. 16A to 16C shows images using the scanning imaging technique, where each pixel in the images corresponds to the fluorescence induced by a single excitation point, i.e. light source position (506).
- Fig. 16A shows the image for a linear conventional fluorescent dye
- Fig. 16B the image from nonlinear upconverting nanoparticles, with a comparative cross-section profile in Fig. 16C displaying the FWHM as 10.5 mm and 8.0 mm respectively, giving an improvement of a factor of 1.3.
- the epi-fluorescence setup was used for this experiment.
- DY-781 was chosen in order to get a fair comparison, since it emits at 800 nm too and has a quantum efficiency on par with more commonly used dyes, for example the rhodamine class.
- DY-781 was excited at 780 nm, and the nanoparticles were excited at 980 nm.
- the lasers were raster scanned over an area of 4.4x4.4 cm2 consisting of 121 positions.
- the images were then summed, giving a representation of the photon distribution on the surface. This, provides whether or not a fluorescent inclusion can be detected.
- a median filter with a kernel of 3x3 pixels was applied to the summed images.
- DY-781 was added into the phantom up to a point where the contrast was so poor that the data could not be used in a sensible way.
- Illumination intensities that were used were deemed non-harmful to tissue.
- the final used excitation light had a spot size of 1 cm 2 from both lasers on the surface of the phantom, giving intensities of 40 mW/cm 2 for the 780 nm laser and 85 mW/cm 2 for the 980 nm laser.
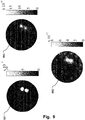
- Figs. 6 a) to d) are images and graphs showing various fluorescence intensity distributions resulting from the experiment.
- comparative images are shown with respect to the DY-781 dye, seen in Fig. 6 (a) and (c) , and the nanoparticles, seen in Fig. 6 (b) and (d) , with and without autofluorescence, along with plots showing the sums in the vertical directions, respectively.
- the white dots in the images have been added artificially and represent the positions used for the excitation light.
- the left column shows the results using DY-781, and the right column shows the results using upconverting nanoparticles.
- Figures 6a ) to d) show the images taken with and without autofluorescence along with their cross section profiles.
- the end result using the nanoparticles is mainly limited by the signal-to-noise ratio of the detector. This means that by increasing the excitation power, it is possible to enhance the obtainable image quality.
- the situation is different for the DY-781 dye.
- the dye is very efficient, and is in general not limited by the signal-to-noise ratio. However, it is limited by the signal-to-background contrast. This means that an increase in excitation power will not result in a better image quality.
- Fig. 5b Simulations of FMT using non-linear fluorophores and traditional fluorophores were performed in transmission-fluorescence setups, as shown in Fig. 5b .
- the simulated tissue phantom was modeled as a semi-infinite cylinder (508) with a radius of 43 mm.
- the fluorophores were placed closely together as sticks extending throughout the phantom as shown in Fig. 5b .
- the forward model used a uniform mesh consisting of 1785 nodes.
- a pixel basis of 17 x 17 pixels was used.
- the pixel basis was chosen, which is a set of regularly spaced pixels. This basis is suitable for problems with no spatial a priori information.
- the input data for the reconstruction were obtained from a forward simulation.
- the sources were modeled as isotropic point sources radiating with 1 W situated at a distance of one scattering event inside the phantom.
- the procedure for the reconstruction may be briefly considered as performing the following steps; i) For each of the excitation positions: calculate the excitation field with a correct power factor; ii) For each detection position: calculate the emission field with the aforementioned excitation field, i.e. the adjoint-method; iii) calculate the product between the excitation field and the emission field (adjoint) for each excitation and detection pair. That is, calculate N*M, where N is the number of excitation positions and M the number of emission positions. The latter can be considered as the calculation of the sensitivity profiles. The resulting internal distribution is stored.
- the non-linear dependence of the light propagation may be modeled for example by solving the related diffusion equation or use Monte -Carlo simulations.
- the excitation field it may be used as input data to the emission problem.
- the power dependence of the marker is be considered.
- the field strength of the excitation field is raised to the same power, i.e. calculating the quadratic product of the excitation field if the non-linear marker has a quadratic power dependence.
- reconstructing a tomographic image of the luminescent marker may comprise calculating a product of the excitation field according to the non-linear dependence, where the calculation of the emission field is based on this product.
- calculating the product may comprise multiplying the field strength of the excitation field so as to form a product of the field strength raised to the power corresponding to the power dependence of the non-linear relationship.
- the accuracy of the reconstruction is dependent on how much information, such as detected luminescence, is obtained, for each light source position when the light source is moved in relation to the luminescent marker, or the vice versa.
- a multiple of excitation wavelengths and emission wavelengths of the luminescent marker may be used to obtain the reconstruction information by instead spectral variation.
- the CCD may in this situation detect luminescence of several wavelengths for utilization in both imaging and tomography reconstruction. In the latter case, both the spatial and spectral variation may be used to calculate the aforementioned sensitivity profiles.
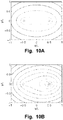
- Fig. 9 shows a comparison of tomographical reconstructions between a linear (902) and a non-linear fluorophore (903).
- the illustration in Fig. 9 is presented as an example of a quadratic fluorophore. (this case chosen to be quadratic)
- the ground truth is shown as the Input anomaly (901) in Fig. 9 .
- Two separate, but close anomalies are shown as the irregular dots in the larger circle.
- this disclosure demonstrate a method in Fluorescence diffuse optical tomography to exploit the unique nonlinear power dependence of upconverting nanoparticles to further increase the amount of information in a raster-scanning setup by including excitation with two beams simultaneously. It was found that the increased information led to more accurate reconstructions.
- Fluorescence diffuse optical tomography is a relatively new modality which seeks to reconstruct the spatial distribution of the concentration of fluorescent probes inside turbid material.
- FDOT Fluorescence diffuse optical tomography
- FDOT has numerically very ill-posed issues.
- the quality of the reconstructions for the fluorescent target is directly determined by the amount and quality of fluorescence information obtained from boundary measurements. Instrumental noise and tissue autofluorescence are the main perturbations of the measurements, resulting in poor signal quality, and can cause severe artifacts in the reconstructed results.
- such methods cannot resolve all issues, since they essentially are only utilizing the present information in a better way rather than adding new constraints for the reconstructions, i.e., adding new independent information, which is critical to improve the quality of the reconstructions.
- the excitation and emission fields can be modeled by two coupled diffusion equations [Ref. 1].
- the forward solution of the excitation light is represented by; U e r s k r i 2 while the adjoint solution to the forward fluorescence problem is represented by; U f ⁇ r d r i .
- Figure 12 shows the normalized singular-value distribution of W .
- the x-axis shows the singular value index (1120) and the y-axis shows the normalized singular value intensity (1121). For clarity, only every second singular value are shown.
- the normalized intensities of the additional sigular values due to dual-beam excitation (1124) have dropped to machine precision, which indicates that the measurements with dual-beam excitation may not alleviate the ill-posedness of FDOT.
- the type-D images may not provide more information than the existing type-S images. Hence, it may not improve the quality of the reconstructions.
- the quadratic fluorophore denoted by asterisk (1123) and dot (1125) signs in Fig. 12 .
- the intensities of the additional singular values (1125) are still significant. This implies that type-D images will contribute to the quality of the reconstructions.
- each excitation beam had a diameter of approximately 2.6 mm.
- a single excitation beam was first used to scan over the 3 x 3 grid, and one image was captured for each scanned position by a CCD camera.
- two excitation beams, located at two nearest-neighboring sites of the same grid, were simultaneously employed to illuminate the phantom, giving 6 extra type-D images.
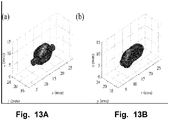
- Figures 13A-13B shows the three-dimensional rendering of the reconstructed upconverting nanoparticles.
- the red cylinders in the subfigures are identical and represent the true fluorescent lesions.
- Fig. 13 (a) only type-S images were used.
- the shape of the fluorescent lesion is overestimated. This overestimation may be explained by the ill-posedness of the inverse problem.
- the reconstruction of the fluorescent lesion shape is improved remarkably, as shown in Fig. 13B .
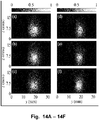
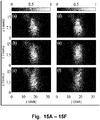
- cross-sectional slices of the reconstructed relative fluorophore distribution are shown in Figs. 14A-14F .
- This disclosure presents embodiments of non-linear luminescence imaging and tomography.
- imaging with upconverting nanocrystals is possible in scattering media resembling biological tissue.
- simulations showed that it is possible to adapt the theory used in fluorescent optical tomography, to work with the upconverting nanocrystals.
- the upconverting nanocrystal particles used in this disclosure in comparison with organic fluorophores, have a variety of applications, such as for biological markers thanks to their unique optical properties.
- the method may be performed in-vivo at a living human or animal body.
- the markers may be preintroduced into the body in any manner, such as by injection into the blood stream or subcutaneously or directly into a tumour, or alternatively by topical application, pulmonary and other non-invasive methods.
- Such preintroduction can be performed separately from the remaining method.
- Such preintroduction can be performed in connection with the remaining method but shortly therebefore.
- the method may be performed at a human or animal body, which is sacrifized after the method is performed.
- the method may be performed in vitro at a non-living human or animal body or part of a body, for example a brain-dead human or animal body.
- the method may be performed at non-medical fields, such as filters or tablets.
Landscapes
- Health & Medical Sciences (AREA)
- Life Sciences & Earth Sciences (AREA)
- Physics & Mathematics (AREA)
- Pathology (AREA)
- General Health & Medical Sciences (AREA)
- Nuclear Medicine, Radiotherapy & Molecular Imaging (AREA)
- Chemical & Material Sciences (AREA)
- Immunology (AREA)
- General Physics & Mathematics (AREA)
- Analytical Chemistry (AREA)
- Biochemistry (AREA)
- Biophysics (AREA)
- Surgery (AREA)
- Veterinary Medicine (AREA)
- Public Health (AREA)
- Engineering & Computer Science (AREA)
- Biomedical Technology (AREA)
- Heart & Thoracic Surgery (AREA)
- Medical Informatics (AREA)
- Molecular Biology (AREA)
- Animal Behavior & Ethology (AREA)
- Radiology & Medical Imaging (AREA)
- Optics & Photonics (AREA)
- Chemical Kinetics & Catalysis (AREA)
- High Energy & Nuclear Physics (AREA)
- Investigating, Analyzing Materials By Fluorescence Or Luminescence (AREA)
- Magnetic Resonance Imaging Apparatus (AREA)
- Analysing Materials By The Use Of Radiation (AREA)
- Investigating Or Analysing Materials By Optical Means (AREA)
- Endoscopes (AREA)
Applications Claiming Priority (4)
| Application Number | Priority Date | Filing Date | Title |
|---|---|---|---|
| SE0950313 | 2009-05-05 | ||
| US21588109P | 2009-05-12 | 2009-05-12 | |
| US25513909P | 2009-10-27 | 2009-10-27 | |
| PCT/EP2010/056127 WO2010128090A1 (en) | 2009-05-05 | 2010-05-05 | A system, method, and luminescent marker for improved diffuse luminescent imaging or tomography in scattering media |
Publications (2)
| Publication Number | Publication Date |
|---|---|
| EP2427100A1 EP2427100A1 (en) | 2012-03-14 |
| EP2427100B1 true EP2427100B1 (en) | 2021-08-11 |
Family
ID=42312993
Family Applications (1)
| Application Number | Title | Priority Date | Filing Date |
|---|---|---|---|
| EP10720382.0A Active EP2427100B1 (en) | 2009-05-05 | 2010-05-05 | A system and method for improved tomography |
Country Status (12)
| Country | Link |
|---|---|
| US (1) | US9012869B2 (ja) |
| EP (1) | EP2427100B1 (ja) |
| JP (3) | JP2012525883A (ja) |
| KR (1) | KR20120036304A (ja) |
| CN (1) | CN102497803B (ja) |
| AU (1) | AU2010244431B2 (ja) |
| BR (1) | BRPI1011413B1 (ja) |
| CA (1) | CA2760783C (ja) |
| IL (1) | IL216125A (ja) |
| SG (1) | SG175923A1 (ja) |
| WO (1) | WO2010128090A1 (ja) |
| ZA (1) | ZA201108562B (ja) |
Families Citing this family (26)
| Publication number | Priority date | Publication date | Assignee | Title |
|---|---|---|---|---|
| JP5945226B2 (ja) * | 2009-09-22 | 2016-07-05 | ビセン メディカル, インコーポレイテッド | 拡散媒質の仮想屈折率整合のためのシステムおよび方法 |
| JP6087049B2 (ja) | 2011-11-02 | 2017-03-01 | 浜松ホトニクス株式会社 | 蛍光ファントム装置および蛍光イメージング方法 |
| CN104603600B (zh) * | 2012-07-01 | 2017-09-01 | 卢米托股份有限公司 | 用于散射介质中改进的扩散发光成像或者断层照相的系统和方法 |
| CN103207168A (zh) * | 2012-12-26 | 2013-07-17 | 西安交通大学 | 一种心肌细胞膜电位功能信息光学重构方法 |
| CN104674994A (zh) * | 2015-01-09 | 2015-06-03 | 湘潭市众成宏鑫建筑材料有限公司 | 一种用于现浇空心楼盖的组合芯模及其制作方法 |
| US11971354B2 (en) | 2015-04-08 | 2024-04-30 | Molecular Devices, Llc | Methods and systems for fluorescence detection using infrared dyes |
| US10379046B2 (en) * | 2015-04-08 | 2019-08-13 | Molecular Devices, Llc | Method and system for multiplexed time-resolved fluorescence detection |
| EP3420535B1 (en) | 2016-02-26 | 2022-09-07 | University Of Southern California | Optimized volumetric imaging with selective volume illumination and light field detection |
| US9730649B1 (en) | 2016-09-13 | 2017-08-15 | Open Water Internet Inc. | Optical imaging of diffuse medium |
| DE102016124730A1 (de) * | 2016-12-16 | 2018-06-21 | Olympus Winter & Ibe Gmbh | Endoskopiesystem und Lichtquelle eines Endoskopiesystems |
| EP3809138A1 (en) | 2017-06-08 | 2021-04-21 | Lumito AB | A method of analysing a sample for at least one analyte |
| KR101998582B1 (ko) | 2017-12-28 | 2019-07-10 | 주식회사 에스에프에이 | 멀티 트레이 무인 반송대차 시스템 |
| US10778912B2 (en) | 2018-03-31 | 2020-09-15 | Open Water Internet Inc. | System and device for optical transformation |
| US10778911B2 (en) | 2018-03-31 | 2020-09-15 | Open Water Internet Inc. | Optical transformation device for imaging |
| US10506181B2 (en) | 2018-03-31 | 2019-12-10 | Open Water Internet Inc. | Device for optical imaging |
| US10966612B2 (en) | 2018-06-14 | 2021-04-06 | Open Water Internet Inc. | Expanding beam optical element |
| US10962929B2 (en) | 2018-09-14 | 2021-03-30 | Open Water Internet Inc. | Interference optics for optical imaging device |
| US10874370B2 (en) | 2019-01-28 | 2020-12-29 | Open Water Internet Inc. | Pulse measurement in optical imaging |
| US10955406B2 (en) | 2019-02-05 | 2021-03-23 | Open Water Internet Inc. | Diffuse optical imaging with multiple beams |
| US11320370B2 (en) | 2019-06-26 | 2022-05-03 | Open Water Internet Inc. | Apparatus for directing optical and acoustic signals |
| US11581696B2 (en) | 2019-08-14 | 2023-02-14 | Open Water Internet Inc. | Multi-channel laser |
| US11622686B2 (en) | 2019-11-22 | 2023-04-11 | Open Water Internet, Inc. | Optical imaging with unshifted reference beam |
| US11819318B2 (en) | 2020-04-27 | 2023-11-21 | Open Water Internet Inc. | Optical imaging from light coherence |
| US11259706B2 (en) | 2020-05-19 | 2022-03-01 | Open Water Internet Inc. | Dual wavelength imaging and out of sample optical imaging |
| US11559208B2 (en) | 2020-05-19 | 2023-01-24 | Open Water Internet Inc. | Imaging with scattering layer |
| KR102646948B1 (ko) * | 2021-06-07 | 2024-03-13 | 전남대학교산학협력단 | 유전자 조작 박테리아를 이용한 소장 내 급성 저산소성 허혈성 조직 진단에 필요한 정보를 제공하는 방법 |
Citations (1)
| Publication number | Priority date | Publication date | Assignee | Title |
|---|---|---|---|---|
| US20070249943A1 (en) * | 2006-04-24 | 2007-10-25 | Commissariat A L'energie Atomique | Method of optically imaging biological tissues by using fluorescence, in particular for defining regions of interest in tissues to be analyzed by tomography |
Family Cites Families (26)
| Publication number | Priority date | Publication date | Assignee | Title |
|---|---|---|---|---|
| US5451785A (en) | 1994-03-18 | 1995-09-19 | Sri International | Upconverting and time-gated two-dimensional infrared transillumination imaging |
| US5832931A (en) * | 1996-10-30 | 1998-11-10 | Photogen, Inc. | Method for improved selectivity in photo-activation and detection of molecular diagnostic agents |
| US20010032053A1 (en) * | 2000-01-24 | 2001-10-18 | Hielscher Andreas H. | Imaging of a scattering medium using the equation of radiative transfer |
| EP1207387A1 (en) * | 2000-11-20 | 2002-05-22 | Institut Curie | Multi-photon imaging installation. |
| US6615063B1 (en) | 2000-11-27 | 2003-09-02 | The General Hospital Corporation | Fluorescence-mediated molecular tomography |
| US6687620B1 (en) * | 2001-08-01 | 2004-02-03 | Sandia Corporation | Augmented classical least squares multivariate spectral analysis |
| JP4804665B2 (ja) * | 2001-08-09 | 2011-11-02 | オリンパス株式会社 | レーザ顕微鏡 |
| EP3252139A1 (en) * | 2001-09-06 | 2017-12-06 | Rapid Micro Biosystems, Inc. | Rapid detection of replicating cells |
| JP2003344285A (ja) * | 2002-05-24 | 2003-12-03 | Japan Science & Technology Corp | 環状断面レーザ光ビーム生成器および多光子顕微鏡 |
| US7303741B2 (en) | 2002-09-23 | 2007-12-04 | General Electric Company | Systems and methods for high-resolution in vivo imaging of biochemical activity in a living organism |
| DE10255013B4 (de) | 2002-11-25 | 2004-12-09 | Siemens Ag | Verfahren und Vorrichtung zur Lokalisierung von Licht emittierenden Bereichen |
| US7510699B2 (en) * | 2003-02-19 | 2009-03-31 | Sicel Technologies, Inc. | In vivo fluorescence sensors, systems, and related methods operating in conjunction with fluorescent analytes |
| EP1727460A2 (en) | 2004-03-11 | 2006-12-06 | The General Hospital Corporation | Method and system for tomographic imaging using fluorescent proteins |
| JP4309787B2 (ja) * | 2004-03-12 | 2009-08-05 | オリンパス株式会社 | 多光子励起型測定装置 |
| US7302348B2 (en) * | 2004-06-02 | 2007-11-27 | Agilent Technologies, Inc. | Method and system for quantifying and removing spatial-intensity trends in microarray data |
| JP2006023382A (ja) | 2004-07-06 | 2006-01-26 | Olympus Corp | 光走査型観察装置 |
| JP4471162B2 (ja) | 2004-07-14 | 2010-06-02 | 富士フイルム株式会社 | 蛍光ct装置 |
| WO2006102395A2 (en) * | 2005-03-22 | 2006-09-28 | Medstar Health Inc | Delivery systems and methods for diagnosing and treating cardiovascular diseases |
| WO2007009812A1 (de) * | 2005-07-22 | 2007-01-25 | Carl Zeiss Microimaging Gmbh | Auflösungsgesteigerte lumineszenz-mikroskopie |
| WO2007054846A2 (en) * | 2005-11-10 | 2007-05-18 | Philips Intellectual Property & Standards Gmbh | Absorption and scattering map reconstruction for optical fluorescence tomography |
| EP2460868A3 (en) | 2006-01-06 | 2013-06-19 | National University of Singapore | Method of preparing nano-structured material(s) and uses thereof |
| US8084753B2 (en) * | 2006-03-20 | 2011-12-27 | Baylor College Of Medicine | Method and system for non-contact fluorescence optical tomography with patterned illumination |
| SG175647A1 (en) | 2006-10-17 | 2011-11-28 | Univ Singapore | Upconversion fluorescent nano-structured material and uses thereof |
| GB0707433D0 (en) * | 2007-04-18 | 2007-05-23 | Stfc Science & Technology | Fluorescence measurement |
| WO2009046392A1 (en) | 2007-10-04 | 2009-04-09 | Trustees Of Princeton University | Synthesis of bio-functionalized rare earth doped upconverting nanophosphors |
| WO2010107720A2 (en) * | 2009-03-18 | 2010-09-23 | Tuan Vo-Dinh | Up and down conversion systems for production of emitted light from various energy sources |
-
2010
- 2010-05-05 BR BRPI1011413-0A patent/BRPI1011413B1/pt active IP Right Grant
- 2010-05-05 US US13/318,403 patent/US9012869B2/en active Active
- 2010-05-05 KR KR1020117028821A patent/KR20120036304A/ko active IP Right Grant
- 2010-05-05 SG SG2011081874A patent/SG175923A1/en unknown
- 2010-05-05 AU AU2010244431A patent/AU2010244431B2/en active Active
- 2010-05-05 WO PCT/EP2010/056127 patent/WO2010128090A1/en active Application Filing
- 2010-05-05 EP EP10720382.0A patent/EP2427100B1/en active Active
- 2010-05-05 CA CA2760783A patent/CA2760783C/en active Active
- 2010-05-05 CN CN201080030265.6A patent/CN102497803B/zh active Active
- 2010-05-05 JP JP2012509034A patent/JP2012525883A/ja active Pending
-
2011
- 2011-11-03 IL IL216125A patent/IL216125A/en active IP Right Grant
- 2011-11-22 ZA ZA2011/08562A patent/ZA201108562B/en unknown
-
2016
- 2016-04-20 JP JP2016084227A patent/JP6650334B2/ja active Active
-
2018
- 2018-05-22 JP JP2018097799A patent/JP2018128470A/ja active Pending
Patent Citations (1)
| Publication number | Priority date | Publication date | Assignee | Title |
|---|---|---|---|---|
| US20070249943A1 (en) * | 2006-04-24 | 2007-10-25 | Commissariat A L'energie Atomique | Method of optically imaging biological tissues by using fluorescence, in particular for defining regions of interest in tissues to be analyzed by tomography |
Also Published As
| Publication number | Publication date |
|---|---|
| SG175923A1 (en) | 2011-12-29 |
| CA2760783A1 (en) | 2010-11-11 |
| JP2016135316A (ja) | 2016-07-28 |
| CN102497803A (zh) | 2012-06-13 |
| US9012869B2 (en) | 2015-04-21 |
| BRPI1011413B1 (pt) | 2021-09-14 |
| AU2010244431B2 (en) | 2015-05-14 |
| US20120104281A1 (en) | 2012-05-03 |
| EP2427100A1 (en) | 2012-03-14 |
| BRPI1011413A2 (pt) | 2016-03-15 |
| CN102497803B (zh) | 2015-03-25 |
| IL216125A (en) | 2014-11-30 |
| JP2012525883A (ja) | 2012-10-25 |
| AU2010244431A1 (en) | 2011-12-01 |
| IL216125A0 (en) | 2012-01-31 |
| WO2010128090A1 (en) | 2010-11-11 |
| KR20120036304A (ko) | 2012-04-17 |
| CA2760783C (en) | 2018-06-19 |
| JP2018128470A (ja) | 2018-08-16 |
| ZA201108562B (en) | 2015-05-27 |
| JP6650334B2 (ja) | 2020-02-19 |
Similar Documents
| Publication | Publication Date | Title |
|---|---|---|
| EP2427100B1 (en) | A system and method for improved tomography | |
| Chen et al. | Near-infrared luminescence high-contrast in vivo biomedical imaging | |
| Ntziachristos et al. | Fluorescence imaging with near-infrared light: new technological advances that enable in vivo molecular imaging | |
| AU2013285996B2 (en) | A system and method for improved diffuse luminescent imaging or tomography in scattering media | |
| CA2877437A1 (en) | Method and arrangement for the relative position detection of stations by means of radio location | |
| JP2001503748A (ja) | 分子薬の光活性における選択性改善と検出のための方法 | |
| US7809431B2 (en) | Method of optically imaging biological tissues by using fluorescence, in particular for defining regions of interest in tissues to be analyzed by tomography | |
| Lee et al. | Review on optical imaging techniques for multispectral analysis of nanomaterials | |
| Ma | Background-free in vivo time domain optical molecular imaging using colloidal quantum dots | |
| Qian et al. | High contrast 3-D optical bioimaging using molecular and nanoprobes optically responsive to IR light | |
| Mansfield et al. | Distinguished photons: increased contrast with multispectral in vivo fluorescence imaging | |
| Schmidt et al. | Near-infrared II fluorescence imaging | |
| Eruv et al. | An alternative approach to analyze fluorescence lifetime images as a base for a tumor early diagnosis system | |
| Patwardhan et al. | Fluorescence molecular Imaging: Microscopic to macroscopic | |
| Terike et al. | Fluorescence Spectroscopy Utilized to Determine the Depth of an Embedded inclusion in Molecular Imaging | |
| Terike et al. | Analysis of a fluorescence spectrum for determination of fluorophore depth | |
| Balalaeva et al. | Diffuse fluorescence tomography of exo-and endogenously labeled tumors |
Legal Events
| Date | Code | Title | Description |
|---|---|---|---|
| PUAI | Public reference made under article 153(3) epc to a published international application that has entered the european phase |
Free format text: ORIGINAL CODE: 0009012 |
|
| 17P | Request for examination filed |
Effective date: 20111202 |
|
| AK | Designated contracting states |
Kind code of ref document: A1 Designated state(s): AL AT BE BG CH CY CZ DE DK EE ES FI FR GB GR HR HU IE IS IT LI LT LU LV MC MK MT NL NO PL PT RO SE SI SK SM TR |
|
| DAX | Request for extension of the european patent (deleted) | ||
| 17Q | First examination report despatched |
Effective date: 20131128 |
|
| STAA | Information on the status of an ep patent application or granted ep patent |
Free format text: STATUS: EXAMINATION IS IN PROGRESS |
|
| STAA | Information on the status of an ep patent application or granted ep patent |
Free format text: STATUS: EXAMINATION IS IN PROGRESS |
|
| GRAP | Despatch of communication of intention to grant a patent |
Free format text: ORIGINAL CODE: EPIDOSNIGR1 |
|
| STAA | Information on the status of an ep patent application or granted ep patent |
Free format text: STATUS: GRANT OF PATENT IS INTENDED |
|
| INTG | Intention to grant announced |
Effective date: 20200914 |
|
| GRAJ | Information related to disapproval of communication of intention to grant by the applicant or resumption of examination proceedings by the epo deleted |
Free format text: ORIGINAL CODE: EPIDOSDIGR1 |
|
| STAA | Information on the status of an ep patent application or granted ep patent |
Free format text: STATUS: EXAMINATION IS IN PROGRESS |
|
| INTC | Intention to grant announced (deleted) | ||
| RAP1 | Party data changed (applicant data changed or rights of an application transferred) |
Owner name: LUMITO AB |
|
| GRAP | Despatch of communication of intention to grant a patent |
Free format text: ORIGINAL CODE: EPIDOSNIGR1 |
|
| STAA | Information on the status of an ep patent application or granted ep patent |
Free format text: STATUS: GRANT OF PATENT IS INTENDED |
|
| INTG | Intention to grant announced |
Effective date: 20210422 |
|
| GRAS | Grant fee paid |
Free format text: ORIGINAL CODE: EPIDOSNIGR3 |
|
| GRAA | (expected) grant |
Free format text: ORIGINAL CODE: 0009210 |
|
| STAA | Information on the status of an ep patent application or granted ep patent |
Free format text: STATUS: THE PATENT HAS BEEN GRANTED |
|
| AK | Designated contracting states |
Kind code of ref document: B1 Designated state(s): AL AT BE BG CH CY CZ DE DK EE ES FI FR GB GR HR HU IE IS IT LI LT LU LV MC MK MT NL NO PL PT RO SE SI SK SM TR |
|
| REG | Reference to a national code |
Ref country code: GB Ref legal event code: FG4D |
|
| REG | Reference to a national code |
Ref country code: CH Ref legal event code: EP |
|
| REG | Reference to a national code |
Ref country code: DE Ref legal event code: R096 Ref document number: 602010067403 Country of ref document: DE |
|
| REG | Reference to a national code |
Ref country code: IE Ref legal event code: FG4D Ref country code: AT Ref legal event code: REF Ref document number: 1418520 Country of ref document: AT Kind code of ref document: T Effective date: 20210915 |
|
| REG | Reference to a national code |
Ref country code: LT Ref legal event code: MG9D |
|
| REG | Reference to a national code |
Ref country code: NL Ref legal event code: MP Effective date: 20210811 |
|
| REG | Reference to a national code |
Ref country code: AT Ref legal event code: MK05 Ref document number: 1418520 Country of ref document: AT Kind code of ref document: T Effective date: 20210811 |
|
| PG25 | Lapsed in a contracting state [announced via postgrant information from national office to epo] |
Ref country code: PT Free format text: LAPSE BECAUSE OF FAILURE TO SUBMIT A TRANSLATION OF THE DESCRIPTION OR TO PAY THE FEE WITHIN THE PRESCRIBED TIME-LIMIT Effective date: 20211213 Ref country code: NO Free format text: LAPSE BECAUSE OF FAILURE TO SUBMIT A TRANSLATION OF THE DESCRIPTION OR TO PAY THE FEE WITHIN THE PRESCRIBED TIME-LIMIT Effective date: 20211111 Ref country code: ES Free format text: LAPSE BECAUSE OF FAILURE TO SUBMIT A TRANSLATION OF THE DESCRIPTION OR TO PAY THE FEE WITHIN THE PRESCRIBED TIME-LIMIT Effective date: 20210811 Ref country code: FI Free format text: LAPSE BECAUSE OF FAILURE TO SUBMIT A TRANSLATION OF THE DESCRIPTION OR TO PAY THE FEE WITHIN THE PRESCRIBED TIME-LIMIT Effective date: 20210811 Ref country code: BG Free format text: LAPSE BECAUSE OF FAILURE TO SUBMIT A TRANSLATION OF THE DESCRIPTION OR TO PAY THE FEE WITHIN THE PRESCRIBED TIME-LIMIT Effective date: 20211111 Ref country code: AT Free format text: LAPSE BECAUSE OF FAILURE TO SUBMIT A TRANSLATION OF THE DESCRIPTION OR TO PAY THE FEE WITHIN THE PRESCRIBED TIME-LIMIT Effective date: 20210811 Ref country code: LT Free format text: LAPSE BECAUSE OF FAILURE TO SUBMIT A TRANSLATION OF THE DESCRIPTION OR TO PAY THE FEE WITHIN THE PRESCRIBED TIME-LIMIT Effective date: 20210811 Ref country code: HR Free format text: LAPSE BECAUSE OF FAILURE TO SUBMIT A TRANSLATION OF THE DESCRIPTION OR TO PAY THE FEE WITHIN THE PRESCRIBED TIME-LIMIT Effective date: 20210811 Ref country code: SE Free format text: LAPSE BECAUSE OF FAILURE TO SUBMIT A TRANSLATION OF THE DESCRIPTION OR TO PAY THE FEE WITHIN THE PRESCRIBED TIME-LIMIT Effective date: 20210811 |
|
| PG25 | Lapsed in a contracting state [announced via postgrant information from national office to epo] |
Ref country code: PL Free format text: LAPSE BECAUSE OF FAILURE TO SUBMIT A TRANSLATION OF THE DESCRIPTION OR TO PAY THE FEE WITHIN THE PRESCRIBED TIME-LIMIT Effective date: 20210811 Ref country code: LV Free format text: LAPSE BECAUSE OF FAILURE TO SUBMIT A TRANSLATION OF THE DESCRIPTION OR TO PAY THE FEE WITHIN THE PRESCRIBED TIME-LIMIT Effective date: 20210811 Ref country code: GR Free format text: LAPSE BECAUSE OF FAILURE TO SUBMIT A TRANSLATION OF THE DESCRIPTION OR TO PAY THE FEE WITHIN THE PRESCRIBED TIME-LIMIT Effective date: 20211112 |
|
| PG25 | Lapsed in a contracting state [announced via postgrant information from national office to epo] |
Ref country code: NL Free format text: LAPSE BECAUSE OF FAILURE TO SUBMIT A TRANSLATION OF THE DESCRIPTION OR TO PAY THE FEE WITHIN THE PRESCRIBED TIME-LIMIT Effective date: 20210811 |
|
| PG25 | Lapsed in a contracting state [announced via postgrant information from national office to epo] |
Ref country code: DK Free format text: LAPSE BECAUSE OF FAILURE TO SUBMIT A TRANSLATION OF THE DESCRIPTION OR TO PAY THE FEE WITHIN THE PRESCRIBED TIME-LIMIT Effective date: 20210811 |
|
| REG | Reference to a national code |
Ref country code: DE Ref legal event code: R097 Ref document number: 602010067403 Country of ref document: DE |
|
| PG25 | Lapsed in a contracting state [announced via postgrant information from national office to epo] |
Ref country code: SM Free format text: LAPSE BECAUSE OF FAILURE TO SUBMIT A TRANSLATION OF THE DESCRIPTION OR TO PAY THE FEE WITHIN THE PRESCRIBED TIME-LIMIT Effective date: 20210811 Ref country code: SK Free format text: LAPSE BECAUSE OF FAILURE TO SUBMIT A TRANSLATION OF THE DESCRIPTION OR TO PAY THE FEE WITHIN THE PRESCRIBED TIME-LIMIT Effective date: 20210811 Ref country code: RO Free format text: LAPSE BECAUSE OF FAILURE TO SUBMIT A TRANSLATION OF THE DESCRIPTION OR TO PAY THE FEE WITHIN THE PRESCRIBED TIME-LIMIT Effective date: 20210811 Ref country code: EE Free format text: LAPSE BECAUSE OF FAILURE TO SUBMIT A TRANSLATION OF THE DESCRIPTION OR TO PAY THE FEE WITHIN THE PRESCRIBED TIME-LIMIT Effective date: 20210811 Ref country code: CZ Free format text: LAPSE BECAUSE OF FAILURE TO SUBMIT A TRANSLATION OF THE DESCRIPTION OR TO PAY THE FEE WITHIN THE PRESCRIBED TIME-LIMIT Effective date: 20210811 Ref country code: AL Free format text: LAPSE BECAUSE OF FAILURE TO SUBMIT A TRANSLATION OF THE DESCRIPTION OR TO PAY THE FEE WITHIN THE PRESCRIBED TIME-LIMIT Effective date: 20210811 |
|
| PLBE | No opposition filed within time limit |
Free format text: ORIGINAL CODE: 0009261 |
|
| STAA | Information on the status of an ep patent application or granted ep patent |
Free format text: STATUS: NO OPPOSITION FILED WITHIN TIME LIMIT |
|
| 26N | No opposition filed |
Effective date: 20220512 |
|
| PG25 | Lapsed in a contracting state [announced via postgrant information from national office to epo] |
Ref country code: IT Free format text: LAPSE BECAUSE OF FAILURE TO SUBMIT A TRANSLATION OF THE DESCRIPTION OR TO PAY THE FEE WITHIN THE PRESCRIBED TIME-LIMIT Effective date: 20210811 |
|
| PG25 | Lapsed in a contracting state [announced via postgrant information from national office to epo] |
Ref country code: SI Free format text: LAPSE BECAUSE OF FAILURE TO SUBMIT A TRANSLATION OF THE DESCRIPTION OR TO PAY THE FEE WITHIN THE PRESCRIBED TIME-LIMIT Effective date: 20210811 |
|
| REG | Reference to a national code |
Ref country code: CH Ref legal event code: PL |
|
| REG | Reference to a national code |
Ref country code: BE Ref legal event code: MM Effective date: 20220531 |
|
| PG25 | Lapsed in a contracting state [announced via postgrant information from national office to epo] |
Ref country code: MC Free format text: LAPSE BECAUSE OF FAILURE TO SUBMIT A TRANSLATION OF THE DESCRIPTION OR TO PAY THE FEE WITHIN THE PRESCRIBED TIME-LIMIT Effective date: 20210811 Ref country code: LU Free format text: LAPSE BECAUSE OF NON-PAYMENT OF DUE FEES Effective date: 20220505 Ref country code: LI Free format text: LAPSE BECAUSE OF NON-PAYMENT OF DUE FEES Effective date: 20220531 Ref country code: CH Free format text: LAPSE BECAUSE OF NON-PAYMENT OF DUE FEES Effective date: 20220531 |
|
| PG25 | Lapsed in a contracting state [announced via postgrant information from national office to epo] |
Ref country code: IE Free format text: LAPSE BECAUSE OF NON-PAYMENT OF DUE FEES Effective date: 20220505 |
|
| PG25 | Lapsed in a contracting state [announced via postgrant information from national office to epo] |
Ref country code: BE Free format text: LAPSE BECAUSE OF NON-PAYMENT OF DUE FEES Effective date: 20220531 |
|
| PGFP | Annual fee paid to national office [announced via postgrant information from national office to epo] |
Ref country code: FR Payment date: 20230508 Year of fee payment: 14 Ref country code: DE Payment date: 20230529 Year of fee payment: 14 |
|
| PGFP | Annual fee paid to national office [announced via postgrant information from national office to epo] |
Ref country code: GB Payment date: 20230510 Year of fee payment: 14 |
|
| PG25 | Lapsed in a contracting state [announced via postgrant information from national office to epo] |
Ref country code: HU Free format text: LAPSE BECAUSE OF FAILURE TO SUBMIT A TRANSLATION OF THE DESCRIPTION OR TO PAY THE FEE WITHIN THE PRESCRIBED TIME-LIMIT; INVALID AB INITIO Effective date: 20100505 |
|
| PG25 | Lapsed in a contracting state [announced via postgrant information from national office to epo] |
Ref country code: MK Free format text: LAPSE BECAUSE OF FAILURE TO SUBMIT A TRANSLATION OF THE DESCRIPTION OR TO PAY THE FEE WITHIN THE PRESCRIBED TIME-LIMIT Effective date: 20210811 Ref country code: CY Free format text: LAPSE BECAUSE OF FAILURE TO SUBMIT A TRANSLATION OF THE DESCRIPTION OR TO PAY THE FEE WITHIN THE PRESCRIBED TIME-LIMIT Effective date: 20210811 |