EP1767484B1 - Elevator group management system and control method therefor - Google Patents
Elevator group management system and control method therefor Download PDFInfo
- Publication number
- EP1767484B1 EP1767484B1 EP06019811A EP06019811A EP1767484B1 EP 1767484 B1 EP1767484 B1 EP 1767484B1 EP 06019811 A EP06019811 A EP 06019811A EP 06019811 A EP06019811 A EP 06019811A EP 1767484 B1 EP1767484 B1 EP 1767484B1
- Authority
- EP
- European Patent Office
- Prior art keywords
- forecasted
- time
- car
- cage
- value
- Prior art date
- Legal status (The legal status is an assumption and is not a legal conclusion. Google has not performed a legal analysis and makes no representation as to the accuracy of the status listed.)
- Active
Links
Images


Classifications
-
- B—PERFORMING OPERATIONS; TRANSPORTING
- B66—HOISTING; LIFTING; HAULING
- B66B—ELEVATORS; ESCALATORS OR MOVING WALKWAYS
- B66B1/00—Control systems of elevators in general
- B66B1/24—Control systems with regulation, i.e. with retroactive action, for influencing travelling speed, acceleration, or deceleration
- B66B1/2408—Control systems with regulation, i.e. with retroactive action, for influencing travelling speed, acceleration, or deceleration where the allocation of a call to an elevator car is of importance, i.e. by means of a supervisory or group controller
- B66B1/2458—For elevator systems with multiple shafts and a single car per shaft
-
- B—PERFORMING OPERATIONS; TRANSPORTING
- B66—HOISTING; LIFTING; HAULING
- B66B—ELEVATORS; ESCALATORS OR MOVING WALKWAYS
- B66B2201/00—Aspects of control systems of elevators
- B66B2201/10—Details with respect to the type of call input
- B66B2201/102—Up or down call input
-
- B—PERFORMING OPERATIONS; TRANSPORTING
- B66—HOISTING; LIFTING; HAULING
- B66B—ELEVATORS; ESCALATORS OR MOVING WALKWAYS
- B66B2201/00—Aspects of control systems of elevators
- B66B2201/20—Details of the evaluation method for the allocation of a call to an elevator car
- B66B2201/211—Waiting time, i.e. response time
-
- B—PERFORMING OPERATIONS; TRANSPORTING
- B66—HOISTING; LIFTING; HAULING
- B66B—ELEVATORS; ESCALATORS OR MOVING WALKWAYS
- B66B2201/00—Aspects of control systems of elevators
- B66B2201/20—Details of the evaluation method for the allocation of a call to an elevator car
- B66B2201/222—Taking into account the number of passengers present in the elevator car to be allocated
-
- B—PERFORMING OPERATIONS; TRANSPORTING
- B66—HOISTING; LIFTING; HAULING
- B66B—ELEVATORS; ESCALATORS OR MOVING WALKWAYS
- B66B2201/00—Aspects of control systems of elevators
- B66B2201/20—Details of the evaluation method for the allocation of a call to an elevator car
- B66B2201/226—Taking into account the distribution of elevator cars within the elevator system, e.g. to prevent clustering of elevator cars
-
- B—PERFORMING OPERATIONS; TRANSPORTING
- B66—HOISTING; LIFTING; HAULING
- B66B—ELEVATORS; ESCALATORS OR MOVING WALKWAYS
- B66B2201/00—Aspects of control systems of elevators
- B66B2201/20—Details of the evaluation method for the allocation of a call to an elevator car
- B66B2201/234—Taking into account uncertainty terms for predicted values, e.g. the predicted arrival time of an elevator car at the floor where a call is made
-
- B—PERFORMING OPERATIONS; TRANSPORTING
- B66—HOISTING; LIFTING; HAULING
- B66B—ELEVATORS; ESCALATORS OR MOVING WALKWAYS
- B66B2201/00—Aspects of control systems of elevators
- B66B2201/30—Details of the elevator system configuration
- B66B2201/301—Shafts divided into zones
- B66B2201/302—Shafts divided into zones with variable boundaries
-
- B—PERFORMING OPERATIONS; TRANSPORTING
- B66—HOISTING; LIFTING; HAULING
- B66B—ELEVATORS; ESCALATORS OR MOVING WALKWAYS
- B66B2201/00—Aspects of control systems of elevators
- B66B2201/40—Details of the change of control mode
- B66B2201/403—Details of the change of control mode by real-time traffic data
Definitions
- the present invention relates to an elevator group management system and a control method therefor, and more particularly, to an elevator group management system and a control method therefor for improving system performance evaluations and elevator allocation control responsive to hall calls.
- An elevator group management system provides an efficient operation service for users by handling a plurality of elevator cages in one unit. Specifically, a plurality of elevator cages (generally ranging from three to eight) are managed in one group, such that an appropriate cage is selected from among this group in response to a new hall call generated at a certain floor to allocate the hall call to that cage.
- a current group management system is based on allocation control that relies on an evaluation function based on a forecasted waiting time. For example, when a new hall call is generated, the hall call is allocated to a cage which minimizes a forecasted waiting time of a hall call serviced by each cage, a cage which minimizes a maximum waiting time, or a cage which minimizes an average waiting time.
- This allocation control based on the forecasted waiting time is a basic scheme employed in group call control of every elevator manufacturer, but has the following two problems.
- JP-B-7-12890 , JP-A-1-226676 , JP-A-7-61722 , nor JP-A-2000-118890 is related to the forecast of positioning for each cage.
- WO 2005/042389 A1 discloses an elevator group management system with which the invention has the features recited in the pre-characterising first part of claim 1 in common.
- a target value is set for the time needed to service a call.
- alternative routes of the elevators are evaluated and a solution is selected which comes close to the target value for the service time and minimises energy consumption.
- EP 1 719 727 A2 is prior art under Article 54(3) EPC and relates to an elevator group management system which predicts route data of each elevator on the basis of averaged stopping probability data.
- US 4 982 817 discloses an elevator group management system making a prediction of elevator positions and directions.
- an important key for determining the control performance is balanced evaluations on a waiting time to a hall call and on a positional relationship (intervals) among respective cages.
- the evaluation on a waiting time to a hall call corresponds to an evaluation for a hall call which has been actually made (hereinafter called the "actual call")
- the evaluation on the intervals between respective cages corresponds to a hall call which can be made in the future (hereinafter called the "future call"). Therefore, the aforementioned balancing involves balancing the actual call with the future call.
- the allocation control for allocating a hall call to an elevator cannot always appropriately control the intervals for a varying traffic flow in a building to possibly cause a long average waiting time.
- one preferred embodiment of the present invention is characterized by comprising forecasted trajectory creating means for creating a forecasted trajectory indicative of movements of a forecasted position of each elevator on a time axis for a predetermined period from a current time point to the near future.
- the value of the weight is calculated on the basis of a function which is applied with a real number which continuously changes the value.
- a preferred embodiment of the present invention provides an elevator group management system which forecasts the position of each elevator, evaluates the positional relationship between the respective cages from after a predetermined time from the forecasted position of each cage, and allocates a hall call to an elevator in accordance with the evaluation value, where the predetermined time is set in accordance with a situation of a generated hall call and/or a cage call. In other wards, in interval evaluation time is set in accordance with a call generation state.
- the evaluation time for a forecasted interval between the respective cars in the future is set in accordance with the longest forecasted arrival time of all hall calls and cage calls.
- the evaluation time for the forecasted interval between the respective cages in the future is set in accordance with a measured traffic flow in a building.
- the evaluation time for the forecasted interval between the respective cages in the future at a forecasted arrival time of a call having the longest forecasted arrival time in all hall calls and cage calls, or the vicinity thereof, or one round time of each elevator.
- the elevator group management control can be properly evaluated from a forecasted trajectory of each elevator on the time axis. Also, from this, it is possible to provide technical supports for the evaluation and improvements, such as giving a suggestion to necessary improvements. For example, when there is a large forecast error, it can be determined from the slope of the forecasted trajectory whether or not this is due to an error in an estimation of a traffic demand, and the like.
- an appropriate weight can be immediately set depending on changing situation as a weight which balances an evaluation for waiting time and an evaluation for each elevator cage interval.
- an appropriate weight can be immediately set even if there are few stocks of traffic flows of the past.
- the positional relationship between the respective cages can be evaluated at an appropriate time point in order to allocate an elevator to a hall call. It is therefore possible to provide an elevator group management system and a control method therefor which comprises hall call allocation control which accomplish appropriate interval control and is capable of reducing an average waiting time.
- Figs. 1(a), 1(b), 1(c) are control conceptual diagrams of the elevator group management system according to the present invention. The description will be begun with Fig. 1(a).
- Fig. 1(a) represents a scenario immediately after a new hall call has been made, where a cage is going to be allocated in response to the hall call.
- This Fig. 1(a) represents an elevator operation diagram, where the horizontal axis represents the time, and the vertical axis represents floor positions in a building.
- the time axis represents future time beginning from the current time. In other words, this diagram represents an elevator forecasted operation diagram in the future.
- the elevator comprises two cages, i.e., a first car and a second car. It can be seen from Fig. 1(a) that the first car is located near the third floor and is moving upward at the current time. The second car is located near the fifth floor and is moving upward. Forecasted trajectories of the respective cages are represented by lines on the diagram. The two forecasted trajectories are close to each other, from which it is understood that the two cages are operated in bunch. Consider that a new hall call is made on the eighth floor for an upward transportation in such a situation.
- Fig. 1(b) represents a forecasted trajectory of each cage when the newly generated hall call is preliminarily allocated to the first car.
- the first car is stopped on the eighth floor for upward movement in order to service the new hall call.
- the subsequent forecasted trajectories of the first car and second car are spaced more from the previous state shown in Fig. 1(a) .
- this interval between the forecasted trajectories is evaluated using a positional relation evaluation time tref after the lapse of a predetermined time period from the current time, it can be clearly appreciated that the interval has extended in Fig. 1(b) , as compared with Fig. 1(a) .
- a representative example of the positional relationship between the respective cages is the interval, and in the following, the positional relationship evaluation time tref is simply called the "interval evaluation time tref.”
- Fig. 1 illustrates by the length of the horizontal axis in accordance with the necessity, where the length of the predetermined time is set to a time longer than an average periodic time of the elevator at that time point.
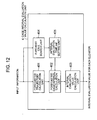
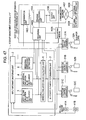
- Fig. 2 is a control block diagram of the whole elevator group management system according to one embodiment of the present invention.
- the operations of N elevator cars 32A, 32B, 32C, ... are controlled by associated elevator car control apparatuses 31A, 31B, 31C, ... and a group management control unit 1 totally controls these car control apparatuses.
- the group management control unit 1 performs the following processes. First, information on a hall call button (41A, 41B) on each floor, and information on each of N elevator car apparatuses 31A, 31B, 31C are stored in an input information storage unit 1. Here, if a new hall call is generated, a waiting time evaluation value calculation unit 3 calculates a forecasted waiting time for each hall call, including previously generated hall calls, using the information in the input information storage unit 1, and calculates a waiting time evaluation value W based on this. An interval evaluation value calculation unit 4 in turn forecasts a positional relationship between the respective elevator cages in the future, as described in connection with Fig. 1 , and calculates an interval evaluation value E based on this.
- a weighting coefficient setting unit 8 sets a weighting coefficient WT corresponding to a situation at a particular time point.
- a feature in this embodiment lies in a method of setting this weighting coefficient, the detail of which will be described later.
- a general evaluation value calculation unit 6 calculates a general evaluation value ⁇ by deriving a weighting sum of the waiting time evaluation time and interval evaluation time from the waiting time evaluation time, interval evaluation time, and weighting coefficient.
- This general evaluation value is calculated for a scenario where each cage is preliminary allocated to a new hall call.
- An allocated elevator determination unit 7 determines a cage to be allocated which exhibits the highest evaluation in regard to the waiting time and cage interval uniformity.
- the setting of the weighting coefficient in accordance with this embodiment is roughly composed of two methods.
- a first method determines a current traffic flow, repeatedly executes a group management control simulation based on the traffic flow, and finds the most appropriate value for the weighting coefficient through a search.
- a second method forecasts the number of hall calls which can be possibly generated, and finds a weighting coefficient setting range and an initial value for setting. Particularly, the latter (second method) constitutes the key to this embodiment.
- a traffic flow determination unit 20 determines a current traffic flow from information in input information storage unit 2, and a weighting coefficient optimal solution search unit 21 searches for the value of the weighting coefficient most suitable for the traffic flow.
- the search for the optimal solution for the weighting coefficient is conducted by repeatedly executing the group management control simulation under a traffic flow condition at a particular time.
- This group management control simulation is executed in a simulation unit 22.
- the weighting coefficient optimal solution search may be conducted on line or may be conducted off line (for example, during the night).
- a main traffic flow hereinafter called the "traffic flow mode" of a building concerned has been previously extracted to executes the group management control simulation off-line for this traffic flow mode.
- a hall call count calculation unit 10 calculates the number of times hall calls are generated or an amount related to the number of times hall calls are generated based on input information in the input information storage unit 2. Then, a weighting coefficient initial value calculation unit 12 and a weighting coefficient range calculation unit 11 calculate an initial value for the weighting coefficient and a range (an upper limit value and a lower limit value), respectively, based on the number of times hall calls are generated.
- the initial value sent to the weighting coefficient optimal solution search unit 21 is used as an initial value for a search (initial value when a search is made in regard to the first traffic flow).
- the initial value sent to the weighting coefficient setting unit 8 is set as a weighting coefficient which is actually used when the weighting coefficient optimal solution search is not converged for a traffic flow which is emerging at a particular time point, or when a traffic flow emerging at a particular time point is completely the first traffic flow.
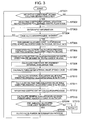
- the weighting coefficient optimal solution search should be made (ST001). This is processing performed when the weighting coefficient search is made through an off-line simulation. For example, it is determined whether or not the weighting coefficient optimal solution search should be made based on the state of a load on a processing apparatus such as a microcomputer or a personal computer, and temporal information such as day time or night. When determined that the search should be made, an optimal solution for the weighting coefficient is searched in regard to a previously extracted traffic flow mode (ST002).
- the search method at this time may involve a search for all values which can be taken by the weighting coefficient (actually, all values which fall under a certain range), a branch limit method, a mountain descending method, a neural net based search, an inheritance algorithm based search, or the like.
- the weighting coefficient optimal solution search including the case where the search is interrupted halfway without finding an optimal solution
- input information is inputted from the input information storage unit (2 in Fig. 1 ) (ST003).
- the input information After the input information has been acquired, it is checked whether or not a cage allocation process has been invoked (ST004).
- the processing flow returns to the processing at ST001 when the allocation process is not invoked, and proceeds to the next processing when the allocation process is invoked.
- each elevator cage is preliminarily allocated to a hall call (generally, a newly generated hall call) intended for the allocation, and a cage loop process (ST005) is executed for calculating an evaluation value for that case.
- a cage loop process ST005
- Ka Ka from one to N in order (N designates the number of group managed elevators), where Ka represents a preliminarily allocated cage.
- a forecasted trajectory is first calculated for the preliminary allocated cage of the Ka-th car (ST006).
- This forecasted trajectory of the preliminary allocated cage corresponds to the forecasted trajectory of the first car in Fig. 1(b) .
- a forecasted trajectory is calculated for a cage K car (each car which satisfies K ⁇ Ka) other than the preliminarily allocated cage (ST007).
- This trajectory corresponds to the forecasted trajectory of the second car in Fig. 1(b) .
- the interval evaluation time tref is calculated (ST008) (an example of tref is shown in Fig.
- a method of determining the waiting time evaluation value may involve using a waiting time for a hall call, for setting the waiting time evaluation value, when the Ka-th car is allocated to the hall call, or setting the waiting time evaluation value to a maximum waiting time within hall calls served by the Ka-th car. Further alternative methods may include a method of setting the waiting time evaluation value to an average waiting time of hall calls served by all cars including the Ka-th car, a method of setting the waiting time evaluation value to a square sum of waiting times associated with hall calls served by all the cars including the Ka-th car, and the like.
- the weighting coefficient WT is calculated (ST012).
- a weighting coefficient calculation method has been generally described in connection with Fig. 2 , and will be again described later in greater detail.
- a general evaluation value which serves as an index for determining the allocation, is calculated on the basis of the interval evaluation value, waiting time evaluation value, and weighting coefficient (ST013).
- a sequence of processing from ST005 to ST013 described above is executed until the preliminary cage allocation loop is completed (until the preliminarily allocation process is executed for all the cages) (ST014).
- a preliminarily allocated cage is updated to the next car (ST015), and the process is executed from ST006 for the updated preliminarily allocated cage of the Ka-th car.
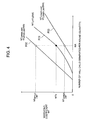
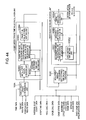
- Fig. 4 is a graph for describing a weighting coefficient setting method according to one embodiment of the present invention, where the horizontal axis represents the number of hall calls generated per round of an elevator, and the vertical axis represents the weighting coefficient.
- the number of hall calls generated per round of an elevator represents an average of the number of hall calls which can be generated while each of elevators managed in group makes a round once (for example, from the lowest floor in the upward direction to the lowest floor in the downward direction). A larger number of hall calls are generated per round during a traffic jam, while a smaller number of hall calls are generated in an inactive period.
- While the graph of Fig. 4 has lines drawn to represent input/output characteristics of three functions which includes a line F01 which represents a function for determining an appropriate initial value WT 0 for the weighting coefficient; a line F02 which represents a function for determining an appropriate upper limit value WT upper limit for the weighting coefficient; and a line F03 which represents a function for determining an appropriate lower limit value WTlower limit for the weighting coefficient.
- the function (line F01) for determining an appropriate initial value for the weighting coefficient is used by the weighting coefficient initial value calculation unit 12 in Fig. 2
- the function (line F02) for determining an appropriate upper limit value for the weighting coefficient and the function (line F03) for determining an appropriate lower limit value are used by the weighting coefficient range calculation unit 11 in Fig. 2 .
- the three functions for determining the weighting coefficient have the following four major features.
- the value of the weight is calculated on the basis of functions which continuously vary output values in response to variations in the input. Stated another way, the value of the weight is calculated on the basis of functions which receive real numbers and continuously vary the value.
- While the graph of Fig. 4 shows an example in which the horizontal axis represents the number of hall calls generated per round, similar effects can be provided as well with a value based on the number of generated hall calls (for example, the number of hall calls generated for a predetermined time, or the like), not limited to the shown example. Further, similar effects can be provided as well using an index of a scalar value related to traffic demand, not limited to the number of generated hall calls. For example, similar effects can be provided as well with a value based on the number of users, a value based on the total value of the number of generated hall calls and the number of generated cage calls, an average waiting time, and the like.
- the interval evaluation value (previously described in connection with Fig. 2 ) is an index which evaluates a temporal interval between cages, and this temporal interval between cages corresponds to a maximum waiting time for a hall call possibly generated in the future. Therefore, the importance of the interval evaluation value is strongly related to the number of hall calls possibly generated in the future. For example, as a larger number of hall calls are generated in the future, the interval should be made as temporally even as possible, so that the interval evaluation value should be forced to more strongly act.
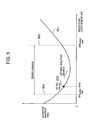
- an arbitrary location on this characteristic curve 901 provides an initial value (starting point).
- starting point a certain extent of time is required until an optimal solution is reached.
- the performance demonstrated in an initial stage can largely vary depending on where the initial value (starting point) is determined.
- the search can be made in a wrong direction, on the contrary, due to an insufficient number of times of the simulation.
- an appropriate initial value 902 for the weighting coefficient can be immediately determined from the number of generated hall calls at a particular time by using the continuous functions shown in Fig.
- an appropriate upper limit value 903 and lower limit value 904 can also be immediately determined in a similar manner. These actions are implemented by functional elements designated by reference numerals 10, 11, 12, and 8 in Fig. 2 . Further, after determining the appropriate initial value and range, the optimal solution search is made within the range based on the initial value, the optimal solution can be promptly and stably found.
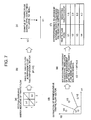
- Fig. 6 is a diagram showing an example of a weighting approach for a traffic flow in a building having six floors.
- the leftmost table in Fig. 6 shows an OD (Origin-Destination) matrix representative of a traffic flow.
- This OD matrix includes the origin represented in a column direction (horizontal direction), and the destination in a row direction (vertical direction), where each element in the matrix indicates the number of passengers corresponding to elements of the row and column to which the element belong. For example, the number of passengers who take the elevator on the second floor and get off the elevator at the fifth floor is found to be three from the table.
- the OD matrix has six rows and six columns because the building has six floors.
- the traffic flow refers to an integrated whole which represents the number of passengers on each floor, and can be represented by such an OD matrix (the OD matrix is actually used for traffic analysis intended for roads).
- the second table (OD matrix) from the left in Fig. 6 represents the number of passengers in each element in the form of variables tr1, tr2, ..., and presents a 30-adic vector (tr1, tr2, tr3, ..., tr30).
- a traffic flow having large tr1 (large upward movements from the ground floor to the first floor) and small tr2 (small upward movements from the first floor to the ground floor), such as office-going time, is represented by the point as shown in the graph.
- a two-dimensional plane of (tr1, tr2) is involved, and a complicated function must be handled if one attempts to handle this with a function having two-dimensional variables as represented by Equation (6):
- WT F tr ⁇ 1 , tr ⁇ 2
- Fig. 7(d) shows an example, where the two-dimensional plane of tr1, tr2 is divided into four areas. Then, representative traffic flow vectors V1, V2, V3, V4 are defined for the four areas, respectively. V1, V2, V3, V4 denote traffic flows representative of the whole, and correspond to the aforementioned traffic flow modes.
- the plane is not divided in a single way, but a variety of divisions are contemplated in accordance with the characteristics of a particular traffic demand in each building.
- a multi-dimensional vector when the traffic flow is handled in the input, a multi-dimensional vector must be handled as it is, if any technique is not employed therefor, and complicated processes are involved, so that the multi-dimensional vector is represented by principal traffic flow modes, such that a weighting coefficient is set to each of the modes by repeatedly executing the simulation.
- Fig. 8 is a diagram showing a comparison of one embodiment of the present invention with a conventional weighting coefficient setting method, where comparisons are made according to several items for summarization.
- This table compares, for example, a setting method disclosed in JP-A-1-226676 with the setting method of this embodiment with respect to five items. In the following, comparisons are made from the first item.
- the prior art uses a traffic flow vector or traffic flow modes which are main components extracted from the traffic flow vector.
- this embodiment uses the number of generated hall calls.
- the nature of the respective input variables is a multi-dimensional vector, for example, a vector such as tr1, tr2, tr3, ...
- the prior art selects a weighting coefficient through a search by repeatedly executing a simulation of group management control, whereas this embodiment sets a weighting coefficient using continuous functions as shown in Fig. 4 . Accordingly, the prior art is characterized by a certain time required until the selection of a value, whereas this embodiment is characterized by the ability to instantaneously determine a weighting coefficient. This characteristic makes the method of this embodiment more advantageous over the prior art in that an appropriate weighting coefficient (more precisely, an appropriate initial value for the weighting coefficient) can be immediately set for a variety of changes in traffic flow to stably exert the control performance.
- Fig. 9 is a processing flow diagram which summarizes the weighting coefficient setting method according to one embodiment of the present invention so far described.
- This sequence of processing is executed in the hall call count calculation unit 10, weighting coefficient range calculation unit 11, weighting coefficient initial value calculation unit 12, traffic flow determination unit 20, weighting coefficient optimal solution search unit 21, simulation unit 22, and weighting coefficient setting unit 8.
- the sequence of processing will be described below in order.
- input information is entered (ST101), and the number NA of hall calls generated per round is calculated on the basis of the input information (ST102). This value can be calculated, for example in the following manner.
- NA NH / NR / 2 + 1
- NH represents the total number of hall calls generated for a predetermined time which is set to a longer time than an average round time of the elevator at a particular time point
- NR represents the total number of direction inversions.
- an appropriate weighting coefficient value can be immediately set based on the initial value WT 0 determined by the function even for a traffic flow which appears for the first time in a building of interest. Also, even in an initial stage of operation in a building, an appropriate weighting coefficient value can be immediately set based on the initial value WT 0 determined by the function. Further, an appropriate weighting coefficient value can be immediately set based on the initial value WT 0 determined by the function even when the optimal solution search has not been converged and an appropriate solution has not been found.
- Fig. 10 is a processing flow diagram which summarizes the weighting coefficient optimal solution search method according to one embodiment of the present invention. This sequence of processing is performed by the hall call count calculation unit 10, weighting coefficient range calculation unit 11, weighting coefficient initial value calculation unit 12, traffic flow determination unit 20, weighting coefficient optimal solution search unit 21, and simulation unit 22. The sequence of processing will be described below in order.
- traffic flow mode data is entered (ST201), and it is determined whether or not the optimal solution search process has been executed for the traffic flow mode (ST202). When the process has been executed, an initial value for the search is set to an optimal value found in the previous search (ST208).
- the search process When the search process has not been executed, the number NA of hall calls generated per round in that traffic flow mode is calculated (ST203), and an initial value WT 0 for the weighting coefficient is calculated on the basis of the value NA (ST204), an upper limit value WT upper limit it is calculated (ST205), and a lower limit value WT lower limit is calculated (ST206). Then, the initial value for the search is set to WT 0 .
- the simulation of the group management control for the determined traffic flow mode is executed for the set initial value, and the simulation is repeated while changing the initial value to execute the optimal solution search (ST209).
- this optimal solution search or halfway in the search
- the optimal weighting coefficient value falls within the range
- this weighting coefficient value provides the optimal solution.
- the weighting coefficient value is set to the upper limit value WT upper limit or the lower limit value WT lower limit or an optimal solution found in the previous search (ST211).
- the initial value for the search can be determined to be an appropriate value using the function of the number of generated hall calls even for a traffic flow which appears for the first time.
- the optimal solution search can be made in a more efficient manner.
- the range of the search is determined to be a proper range using the function of the number of generated hall calls, the optimal solution search can be more efficiently made without searching inappropriate regions even in an initial stage of the search or in a transient state. It should be noted that these advantages have been described in Fig. 5 by showing a search concept.
- Fig. 11 illustrates in greater detail the input information storage unit 2 shown in Fig. 2 .
- the input information storage unit 2 stores the following data.
- the data includes building facility data 201, group management elevator facility data 202, and current group management elevator state data 203.
- the data includes group management elevator state data statistics 204, state data 205 on each hall in a building at a current time point, a building traffic flow data 206, and temporal information data 207.
- the building facility data 201 stores such data as the number of floors in a building, floor height of each floor, floors intended for the service of the group management, and the like.
- the group management elevator facility data 202 stores such data as the number of elevators managed in group, a rated speed of each elevator car, a number limit of a cage, a door open/close speed, a standard door open time, and the like.
- the current group management elevator state data 203 includes such data as the positions of cages, information on the direction, information on the speed, information on a load within a cage, allocated hall call information, cage call information, information on stop floors, hall call continuation time information on each hall call, a round time of each cage, and the like.
- the group management elevator state data statistics 204 store such data as the number of hall calls generated for a predetermined time , the number of generated cage calls, the number of users, an average hall call continuation time, the number of times of direction inversions, an average load, an average round time, and the like.
- the state data 205 on each hall in a building at a current time point stores such data as information on hall call buttons 41A, 41B, information on cameras 51A, 51B of hall waiting customers, and the like.
- the building traffic flow data 206 stores building traffic flow data such as that shown by the OD matrix in Fig. 6 .
- the temporal information data 207 stores calendar information such as information by a clock, year, month, day, day of the week, holidays, days on which special events take place, and the like.
- the input information storage unit 2 stores all the data listed above. In this connection, the input information storage unit 2 does not necessarily aggregate these data, but the data may be distributively stored. In this event, the input information storage unit 2 may be regarded as
- the forecasted trajectory calculation unit 401 in Fig. 12 calculates forecasted trajectories (solid trajectories from a current time point in the future direction in the diagram) of the first car and second car.
- the interval evaluation time setting unit 405 sets the interval evaluation time tref in Fig. 1(b) .
- the forecasted cage interval calculation unit 402 in Fig. 12 finds a forecasted position at the interval evaluation time from the forecasted trajectory of each cage, i.e., the positions of the first car and second car drawn on the interval evaluation time in Fig.
- the cage interval evaluation value calculation unit 403 calculates an evaluation value for evaluating a cage interval uniformity from the cage interval value. For example, when Fig. 1(b) is compared with Fig. 1(c), Fig. 1(b) presents a higher cage interval uniformity, and the cage interval evaluation value calculation unit 403 evaluates the uniformity.
- One of important factors in calculating the cage interval evaluation value is a method of setting a time at which the cage interval is estimated.
- This setting method also constitutes a feature of this embodiment, so that the method of setting an interval evaluation time will be described below with reference to Figs. 13 to 16 .
- Fig. 13 is a processing flow diagram for setting the interval evaluation time tref. This sequence of processing is executed in the furthest call search unit 404 and interval evaluation time setting unit 405 in Fig. 12 .
- a cage loop process is executed for searching each cage in order (ST501).
- the initial value for K is one.
- all hall calls allocated to the K-th car are searched to select a maximum forecasted arrival time ART_H(K) (ST502).
- All cage calls served by the K-th car are searched to select a maximum forecasted arrival time ART_C(K) (ST503).
- ART_H(K) is compared with ART_C(K) to employ the larger one for a forecasted arrival time ART_MAX(K) of the furthest call associated with the K-th car (ST504).
- the value of the forecasted arrival time of the furthest call for all cars varies from one allocation to another because new calls are generated over time (for example, in course of approximately 20 seconds) to cause change in the value.
- the interval evaluation time also varies in value each time the allocation is processed. This shows that the situation of previously generated calls (situation of the number of currently generated calls, and the like) varies from time to time, the interval evaluation time is responsively adjusted as appropriate.
- Fig. 14 shows the idea for the setting of the estimated interval time.
- the graph of Fig. 14(a) represents a time axis on the horizontal axis on which a current time is placed at the origin, and the floor position on the vertical axis.
- two trajectories drawn in solid line represents forecasted trajectories of the first car and second car, respectively.
- F10 represents the forecasted trajectory of the first car
- F11 represents the forecasted trajectory of the second car.
- the key to the interval evaluation time setting lies in at which time to evaluate the interval between the two forecasted trajectories, where the interval evaluation time has the nature as described below.
- Fig. 14(b) is a graph showing the characteristic of the interval evaluation time described above.
- the horizontal axis represents the interval evaluation time
- the vertical axis represents a forecast accuracy when the cage interval is estimated by a corresponding interval evaluation time.
- the forecast accuracy for the cage interval is low, and the forecast accuracy increases as the value of the interval evaluation time becomes larger from there. Then, the forecast accuracy reaches a maximum at a certain value, and subsequently falls more as the value becomes larger.
- the location at which the forecast accuracy reaches the maximum is thought to be near the previously mentioned forecasted arrival time of the furthest call for all the cars.
- the cage interval evaluation can be made with a high accuracy.
- the allocation can be carried out to more reliably approach to an equidistance state, thus restraining a long waiting time.
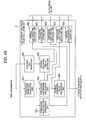
- Fig. 15 is a functional block diagram of a second embodiment of the cage interval evaluation value calculation unit different from Fig. 12 .
- components identical to those shown in Fig. 12 are designated the same reference numerals, and a description thereon is omitted.
- Fig. 15 differs from Fig. 12 in that the interval evaluation time is set by a traffic flow mode which is prevailing at a particular time point.
- a traffic flow mode determination unit 406 determines a traffic flow mode which is prevailing at a particular time point as a representative traffic flow vector of traffic flow vectors which have previously prevailed in the building in the past.
- an interval evaluation time suitable for the traffic flow mode is referenced in an interval evaluation time database 407 for the traffic flow mode to set a value therefor.
- the interval evaluation time database 407 for the traffic flow mode is a database which arranges previously extracted traffic flow mode of the building and interval evaluation times corresponding thereto in a tabular form. By using this, if the traffic flow mode is determined, the interval evaluation time corresponding thereto can be set by referencing the table.
- a time interval at which the interval evaluation time is set is substantially equal to a time constant of a traffic flow change.
- Fig. 16 is a functional block diagram of a third embodiment of the cage interval evaluation value calculation unit different from Fig. 12 .
- components shown in Fig. 12 are designated the same reference numerals, and a description thereon is omitted.
- Fig. 16 differs from Fig. 12 in that the interval evaluation time is determined on the basis of an average round time at a particular time point.
- an average round time calculation unit 408 calculates an average round time T for all elevators at a particular time point based on input information (entered from input information storage unit 2 in Fig. 1 ).
- the average round time is also related to calls, so that an appropriate interval evaluation time can be determined as well using the average round time instead of the forecasted arrival time of the furthest call, and similar advantages can be expected.
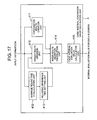
- Fig. 17 is a functional block diagram of a fourth embodiment for the cage interval evaluation value calculation unit 4 which substitutes for Fig. 12 . While a representation with a forecasted route is used herein, this forecasted route refers to the same as the forecasted trajectory which has been so far described. Fig. 17 will be described later in greater detail. In the following, the method of creating a forecasted trajectory, which is a key of this embodiment, will be described with reference to Fig. 18 .
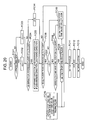
- Fig. 18 illustrates a general processing flow of a forecasted trajectory creation method.
- a variable K indicative of a number of an elevator car is set to one (FA01).
- F08 group management
- the K-th car is intended for the group management (FA08). Since elevator cars which are separated from the group management for reasons such as a dedicated operation are operated independently of the remaining elevators which are managed in group, such elevators are removed from those intended for the creation of forecasted trajectory through such processing.
- the determination as to whether or not the K-th car has a direction is, if in a different expression, equivalent to a determination made as to whether or not the K-th car is servicing a hall call or a cage call. Accordingly, when the K-th car is servicing a hall call or a cage call (when the K-th car has a direction), the processing flow proceeds to a plural round forecasted arrival time table creation process (FA03). When the K-th car is not servicing either a hall call or a cage call (when the K-th car does not have a direction), the processing flow proceeds to non-direction forecasted trajectory table creation process (FA05).
- a forecasted arrival time table is created for a plurality of rounds, for example, three or more rounds.
- the forecasted arrival time tables for plural rounds are represented by a variable tar_table(i, j, c, K), where i indicates a floor, j indicates a direction, c indicates the number of rounds, and K indicates the name of a car.
- the creation of the forecasted arrival time tables for plural rounds will be described later in greater details in connection with Fig. 33 .
- a forecasted trajectory table is created for an elevator car having a direction, based on this table.
- the forecasted trajectory table for an elevator car having a direction is represented by two variables ir(t, K) and jr(t, K).
- Ir(t, K) represents a cage position of the K-th car t seconds after a current time point
- jr(t, K) represents a cage direction of the K-th car t seconds from the current time point.
- a forecasted trajectory table is created for the car having no direction (FA05).
- the forecasted trajectory table is represented by the two variables ir(t, K) and jr(t, K). The creation of the forecasted trajectory table for the elevator cage having no direction will be described later in greater detail in connection with Fig. 27 .
- K is incremented by one (FA06), and the processing flow returns to processing FA08 to repeat the foregoing processing for a new K-th car. This is executed for all cars intended for the group management (FA07).
- the forecasted arrival time table is created for a plurality of rounds; and 2) the forecasted trajectory is created individually for a car which has a direction and a car which has no direction.
- the creation of a forecasted arrival time differs in accordance with the number of rounds (described later in greater detail).
- a trajectory of a cage having a direction (trajectory FJ03 in Fig. 30 ) and a trajectory for a cage having no direction (trajectory FJ02 in Fig. 30 ) are created in different shapes, respectively, as shown in Fig. 30 (described later in greater detail).
- highly accurate forecasted trajectories can be created in consideration of the state of each car at a particular time point, and the state of traffic demand.
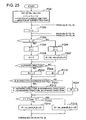
- Fig. 19 is a processing flow diagram for creating the forecasted arrival time tables for plural rounds according to one embodiment of the present invention.
- the forecasted arrival time table is represented by the variable tar_table(i, j, c, K). Details are shown in Fig. 21 , later described, which illustrates the creation of exemplary forecasted arrival time tables for plural rounds, showing a forecasted arrival time table FG02 for the first round, a forecasted arrival time table FG03 for the second round, and a forecasted arrival time table FG04 for the third round.
- Such forecasted arrival time tables are created through the flow chart of Fig. 19 .
- initial values are set for a forecasted arrival time tar, variable i indicative of the floor position of a K-th car, and a variable j indicative of the direction of the K-th car (FB01).
- tar is set to zero; i to a current cage position of the K-th car; and j to a current cage direction of the K-th car.
- a variable c indictive of the number of rounds is set to one (FB02). This means that the forecasted arrival time table is created from the first round.
- a variable n indicative of number of scans when each floor is scanned in order is reset to zero.
- the meaning represented by the value of 2(n max -1) will be described in connection with the leftmost table FG01 in Fig. 22 .
- the leftmost table in Fig. 22 indicates the floor in the row direction, and the upward direction and downward direction in the column direction, where a display method is such an elevator is represented by a ring which makes a round.
- a display method is such an elevator is represented by a ring which makes a round.
- n indicates a floor to be scanned when the floors are scanned on a floor-by-floor basis on the assumption that one round of the elevator complies with the leftmost table of Fig. 22 , where 2(n max - 1) indicates the number of all floors which are scanned per round.
- the forecasted arrival time tables for plural rounds can be created, as shown in Fig. 22 .
- the forecasted arrival time table calculation routine (FB04 in Fig. 19 ) will be described in greater detail with reference to Fig. 20 .
- Fig. 20 illustrates a processing flow diagram of the forecasted arrival time table calculation routine (FB04 in Fig. 19 ).
- a variable tar is established for a forecasted arrival time.
- the next move floor is set (the floor number is decremented by one when in the upward direction, and incremented by one when in the downward direction). 3) it is determined whether or not the number of rounds is the first round or second round.
- a stop time is added to tar when a call stop is present on a floor of interest, and a stop probability is added to tar when no call stop is present.
- a time required for a movement to the next floor is added to tar.
- the value tar_table (i, j, c, K) of the forecasted arrival time table of the floor of interest is set in tar.
- a floor to be scanned for a K-th car is indicated by i, and the direction is indicated by j.
- the cage direction j is the upward direction (FC01).
- FC02 a floor resulting from a subtraction of one from the variable i indicative of the cage position during a scan
- FC03 a floor resulting from an addition of one to i
- next move floor i2 is a direction inversion floor of the K-th car (for example, the highest floor or lowest floor) (FC04).
- the direction j2 on the next move floor is set to the direction opposite to j (FC05).
- the setting of the direction inversion floor on a car-by-car basis in this way is one key of the present invention.
- i2 is set to the same direction as j (FC14).
- c When c is the first round, it is determined whether or not a stop is caused by a hall call or a cage call for the floor/direction (i, j) which are being scanned (FC08). When there is a call stop, a stop time at that floor is added to tar (FC09). When there is no call stop, an expected stop time value of (i, j) floor/direction is added to tar (FC10).
- the expected stop time value is considered for the first round as well for a serviced floor without call stop.
- the stop time of each floor/direction and expected stop time value are updated at all times corresponding to a change in the traffic flow (FC15). For example, during an office-going rush hours, the expected stop time value of each floor/upward direction is increased, while during semi-rush hours before lunch time, the expected stop time value of each floor/downward direction is increased.
- the foregoing process is the process of the forecasted arrival time table calculation table, and is recursively executed while changing i, j, c, K in the loop process of Fig. 19 to complete the forecasted arrival time tables tar_table (i, j, c, K).
- a direction inversion floor is set for each car.
- a stop time associated with a currently generated call (hall call, cage call) is used together with the expected stop time value for a call which has not been generated.
- the expected stop time value is used on the assumption that no call has been generated.
- the stop time and expected stop time values have set values for each combination of floor/direction.
- the stop time and expected stop time value vary (are updated) corresponding to a traffic flow.
- forecasted trajectories are created in one embodiment of the present invention based on the forecasted arrival time tables for plural rounds, which have the features as listed above, elaborate forecasted trajectories can be created with a high forecast accuracy in accordance with the characteristics of each ar, state of call stop, and traffic flow state. As a result, it is possible to accurately evaluate the cage interval and the like based on the forecasted trajectories and reduce a waiting time.
- Fig. 21 shows (a) a stop time table, (b) a stop probability table, and (c) an expected stop time value table in each of floors and directions, respectively.
- the stop time table of Fig. 21(a) indicates stop times for each of the floors and directions. In this example, the same stop time (eight seconds) is set on all the floors in both directions, but different stop times may be defined on a floor-by-floor and/or direction-by-direction basis.
- the stop probability table of Fig. 21(b) indicates the stop probability for each of the floors and directions.
- the stop probability on the third floor in the upward direction is set to 0.6, which means that the elevator can be stopped by a call with a probability of 0.6 while it makes a round.
- the stop probability is different between the upward and downward directions in order to reflect the fact that the traffic demand at that time point tends to stop in the upward direction. In this way, the stop probability reflects the traffic demand (or traffic flow) at a particular time point, so that the value of each floor/direction of the stop probability varies in response to a change in the traffic demand.
- the expected stop time value table of Fig. 21(c) indicates the expected stop time value for each of the floors and directions. This expected stop time value is calculated by multiplying the stop time by the stop probability. In this embodiment, this value is used as a forecasted stop time (expected value for the stop time) for a floor on which no hall call or a cage call has been generated.
- Fig. 22 shows a specific example of the forecasted arrival time tables for plural rounds which are calculated using the stop time table, stop probability table, and expected stop time table shown in Fig. 21 .
- the leftmost table (FG01) of Fig. 22 represents a situation of the first car at a current time.
- the first car (FG05) is positioned on the first floor toward the upward direction (FG05), and is going to serve a hall call in the upward direction on the second floor (FG06) a cage call on the fourth floor (FG07), and a hall call in the downward direction on the fourth floor (FG08). Accordingly, the first car stops on the second floor in the upward direction, the fourth floor in the upward direction, and the fourth floor in the downward direction, respectively.
- the forecasted arrival time tables for the first round, second round, and third round of the first car are indicated by reference numerals FG02, FG03, FG04, respectively, in Fig. 22 .
- FG02 forecasted arrival time table
- the table begins with the second floor in the upward direction and makes a round to end with the first floor in the upward direction (FG10).
- the forecasted arrival time table (FG03) for the second round begins with the second floor in the upward direction (FG11), and make a round to end with the first floor in the upward direction (FG12).
- the forecasted arrival times are all calculated using the expected stop time values associated therewith.
- the forecasted arrival time table (FG04) for the third round is calculated as shown.
- Fig. 23 shows an example of a finally created forecasted trajectory table.
- the forecasted trajectory table stores, for each car (a column designated FH02 for the first car, and a column designated FH03 for the second car), data on a forecasted position (FH04 for the first car) of each car at each time (column FH01), and the direction (FH05 for the first car).
- FH02 for the first car
- FH03 the second car
- the forecasted trajectory table of Fig. 23 is created from the data in the forecasted arrival time tables for plural rounds in Fig. 22 . Specifically, a forecasted position at each time can be calculated through interpolation from forecasted arrival times of adjacent ones of respective floors and directions. This calculation method is conceptually shown in Fig. 24 .
- the right-hand figure shows a graph which indicates the time on the horizontal axis, and floor positions on the vertical axis.
- a line FF01 on this graph is drawn by connecting points (tx, ix) representative of each floor/direction of a K-th car and its forecasted arrival time on a two-dimensional coordinates, with line segments.
- This line FF01 is the original shape of the forecasted trajectory.
- the left-hand figure indicates the position and direction (FF02) of the K-th car at a current time, from which it can be seen that the K-th car is positioned on the first floor in the upward direction. Accordingly, the line FF01 in the right-hand figure has a point FF02 plotted at first floor/upward direction at time zero (current time).
- a point FF03 represents the position and forecasted arrival time of the K-th car on the second floor in the upward direction
- a point FF03 represents the position and forecasted arrival time of the K-th car on the adjacent third floor in the upward direction.
- Figs. 25 and 26 illustrate the flow of the creation of a forecasted trajectory table divided into two pieces.
- initial values are first set (FD01).
- a time variable parameter t of the forecasted trajectory table is set to zero, and a variable parameter c indicative of the number of rounds to zero.
- a flag variable z indicative of whether or not calculations have been completed for initial floors (which require special processing for adding a time origin) is set to zero, and a variable parameter i indicative of the position of a scanned floor is set to a cage position of a K-th car at a current time, and a variable parameter j indicative of the direction of a scanned floor is set to a direction at the current time point.
- a variable n indicative of the number of a scanned floor is set to zero.
- n is the same as the n used in Fig. 19 , where when the value of n reaches 2(n max-1 ), floors in one round have just been scanned.
- tA is set to a forecasted arrival time on a floor (iA, jA) for the K-th car in a c-th round.
- the variables iA, tA correspond to iA, tA shown in Fig. 24 , respectively (corresponding to the point FF03 in Fig. 23 ).
- jA represents a direction for iA. In other words, from two points (tA, iA) and (tB, iB), a time t between them, and a forecasted arrival time ir (t, K) are calculated, where a starting point of the two points is defined.
- stops caused by a hall call and a cage call are represented by changes in sloping angle in the first round, i.e., from the first floor in the upward direction to the ground floor in the upward direction.
- the forecasted trajectory is represented by straight lines FI106, FI107 and is represented only by the expected stop time value based on the stop probability.
- the trajectory in the second round onward has the same shape in each round.
- the upward slope (FI06) is different from the downward slope (FI07) for the trajectory in the second round onward.
- the respective forecasted trajectories present trajectories which invert in direction on the highest floor and lowest floor.
- One reason for creating such trajectories which invert in direction on the extreme floors (highest floor or lowest floor) is that the evaluation based on the forecasted trajectory of each car aims at a temporally equidistant state, which is particularly effective during rush hours. It is anticipated that a large number of hall calls and cage calls are generated during rush hours, and as a result, actual operation trajectories also invert to the opposite direction on the extreme floors, as shown in Fig. 28 . Accordingly, the forecasted trajectories are also created to invert in direction on the extreme floors.
- the forecasted trajectory creating means estimates a final cage call floor from a traffic demand at a particular time, and creates a forecasted trajectory which forces the elevator to subsequently wait at that floor. For example, in the case of Fig. 29 , it is forecasted that the first car (forecasted trajectory FQ01) will be on the first floor in the downward direction after serving the last cage call, and the resulting forecasted trajectory [FQ02] shows that the first car subsequently remains stand-by on the first floor in the downward direction.
- the right-hand diagram (FK01) in Fig. 31 shows forecasted trajectories of the two elevator cars.
- the forecasted trajectory of the first car is represented by a solid line FK02
- the forecasted trajectory of the second car is represented by a broken line FK03.
- the forecasted trajectories in Fig. 31 differ from the forecasted trajectories in Fig. 28 in that the slopes of the forecasted trajectories are different for each floor/direction because of a difference in the stop probability among the respective floors/directions in the forecasted trajectories of Fig. 31 .
- the stop probability differs because the trend of users differs among respective floors/directions.
- Fig. 32 shows a fourth example of the forecasted trajectory according to the creation method shown in this embodiment.
- the forecasted trajectory in Fig. 32 differ from the forecasted trajectories in Fig. 28 in that they are in such shapes that explicitly reveal elements of stops caused by calls on the forecasted trajectories and probabilistic stops determined by the stop probability.
- a portion of a call stop is indicated by an element (FL03) on a horizontal section of the trajectory on the fourth floor in the downward direction in the first round
- a portion of a probabilistic stop is indicated by an element (FL04) on a horizontal section of the trajectory on the third floor in the upward direction in the first round.
- An element (FL05) represented by an oblique line segment indicates a downward movement state.
- One advantage of the forecasted trajectory shown in Fig. 32 is that a highly accurate forecasted trajectory which reflects an actual shape can be created by dividing three elements, stop caused by a call, probabilistic stop, and movement in detail. Actual movements of an elevator does not match the trajectory represented by an oblique line on the time axis as shown in Fig. 28 , but involves horizontal sections because the elevator must stop. As such, the forecasted trajectory in Fig. 32 more reflects the actual state. Also, another advantage of the forecasted trajectory in Fig. 32 is the ability to visually readily classify the three elements, i.e., call stop, probabilistic stop, and movement.
- the creation of data of the forecasted trajectory data may be divided into stop, probabilistic stop, and movement.
- stop for example, in course of creating the forecasted arrival time table for plural rounds, a process of adding a call stop time or an expected stop time value, and adding a move time, where they may be separately stored in data.
- Fig. 33 shows a fifth example of the forecasted trajectories according to the forecasted trajectory creation method shown in this embodiment.
- the forecasted trajectories shown in Fig. 33 differ from the forecasted trajectories shown in Fig. 28 in that the forecasted trajectories in Fig. 33 are represented by rough trajectories according to the direction, i.e., in the upward and downward directions.
- the forecasted trajectories in Fig. 33 can be created by connecting points on the highest floor with points on the lowest floor of the forecasted trajectories in Fig. 28 . They correspond to forecasted trajectories which are based on data resulting from accumulating times of call stop, probabilistic stop, and movement for each floor/direction according to the direction.
- Fig. 34 shows a sixth example of forecasted trajectories according to the forecasted trajectory creation method shown in this embodiment.
- the forecasted trajectories shown in Fig. 34 differs from the forecasted trajectories in Fig. 28 in that the forecasted trajectories in Fig. 34 correspond to a higher floor zone (a zone of a plurality of non-stop floors located in the middle).
- Fig. 34(b) shows the section of the higher floor zone represented by a single floor. Specifically, as shown in the left-hand diagram, the first to ninth floors are represented by a single floor FN04. A forecasted trajectory in this event is a trajectory FN03 in the right-hand diagram of Fig. 34(b) . As shown, the forecasted trajectory can be precisely represented even if the higher floor zone is represented by a single floor, as long as a pass time of that zone is matched. The matching of the zone pass time can be confirmed by the pass time of the higher floor zone in Fig. 34(a) which matches the pass time of the higher floor zone in Fig. 34(b) .
- Fig. 35 shows a seventh example of the forecasted trajectories according to the creation method shown in this embodiment.
- the forecasted trajectories in Fig. 35 differ from the forecasted trajectories in Fig. 28 in that the forecasted trajectories in Fig. 35 are forecasted trajectories when respective elevator cars are assigned to services of different floor zones.
- a floor zone serviced by the first car extends over all floors from B1 floor to thirteenth floor, as shown in the leftmost diagram FP03
- a floor zone serviced by the second car extends from the first floor to the ninth floor, as shown in the second diagram FP04.
- the resulting forecasted trajectories reflect the floor zones serviced by the respective cars, as represented by the forecasted trajectories on the rightmost diagram.
- the forecasted trajectory of the first car is a trajectory FP01
- the forecasted trajectory of the second car is a trajectory FP02.
- the reason for the ability to create such forecasted trajectories lies in the fact that direction inversion floors are identified for each car in the flow chart of the forecasted arrival time table calculation routine illustrated in Fig. 20 .
- the first car inverts the direction on the B1 floor and thirteenth floor, while the second car inverts the direction on the first and tenth floors.
- Figs. 36 to 38 show details on a forecasted interval value calculation process.
- a method of calculating a forecasted interval value will be described with reference to a flow chart of Fig. 36 .
- a phase time value tp of each cage at an interval evaluation time tref is calculated using a forecast route of each cage, the creation method of which has been previously described (ST801 in Fig. 36 ).
- the interval evaluation time tref has been set by the previously described setting method.
- the calculation of the phase time value of each car will be described in greater detail with reference to Figs. 37 , 38 .
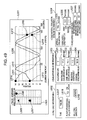
- Fig. 37 shows how the forecasted interval value is calculated from a forecast route.
- Fig. 37 shows a group management for three elevators, where the left-hand diagram in Fig. 37 shows the positions and directions of elevator cages at a current time point in a ring representation. From the left-hand diagram in Fig. 37 , the first car 610 is moving between the sixth floor and seventh floor in the upward direction, and the second car 611 is moving between the fourth floor and fifth floor in the upward direction. The third car 612 in turn is moving downward from the second floor to the first floor.
- the right-hand diagram in Fig. 37 represents forecasted routes of the respective cages, where the horizontal axis indicates the time, and the vertical axis indicates the position.
- the origin of the time axis represents the current time point.
- a cage position 600 of the first car, a cage position 601 of the second car, and a cage position 602 of the third car at the current time point are indicated, respectively, on the diagram (a forecasted route 603 of the first car, a forecasted route 604 of the second car, and a forecasted route 605 of the third car).
- the cage position at the interval evaluation time tref (606 in Fig. 37 ) can be forecasted from the forecasted route of each cage.
- a forecasted position and direction of the first car at the interval evaluation time tref are the sixth floor and upward direction (607 in Fig.
- Forecasted intervals between the respective cages can be found from such the forecasted positions and directions of the respective cages.
- the forecasted position can be converted to a phase time value.
- the reason for converting from a forecasted position to a time phase value lies in that intervals between the respective cages are expressed by time interval values in units of times.
- a time phase value is found from the forecasted position of each cage (ST801 in Fig. 36 ), and then, the respective cages are sorted in an order according to the magnitude of the phase time value (ST802 in Fig. 36 ).
- a forecasted interval value Bm between the respective cages is found in accordance with the order of rank m of this phase time values (ST803).
- Equation (18) represents the period of an average round trajectory.
- the forecasted interval of each cage is calculated using the phase time value based on the average round trajectory for the traffic flow at the current time point, so that a more proper time interval can be found in accordance with a traffic flow at a particular time. For example, at the start of a lunch time, a large number of hall calls are generated for the downward direction, resulting in the average round trajectory which has a slow slope of a line segment toward the downward direction, and a longer phase time value per floor as compared with a line segment toward the upward direction. Therefore, when two cages are spaced apart, for example, by two floors, an evaluation is made to result in different interval values for the upward direction and downward direction. Since cages going downward are more likely to stop, they are evaluated to be more spaced even on the same first floor. In this way, the time interval can be properly evaluated in accordance with the traffic flow.
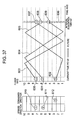
- Fig. 39 compares trajectories of elevator cages on the time axis in an scenario of a group management for three cars between the result before the implementation of the control according to this embodiment and the result after the implementation of the control according to this embodiment.
- Fig. 39(a) shows trajectories of the elevator cages on the time axis before the implementation of the control according to this embodiment. It can be seen from these trajectories that the trajectories of the three cars often overlap, showing the occurrence of a low-efficient bunch operation.
- Fig. 39(b) shows trajectories of the elevator cages on the time axis after the implementation of the control according to this embodiment. It can be seen that the trajectories of the three cages maintain equal phases, just like a three-phase alternate current, i.e., a temporally equidistant state. In this way, since the temporally equidistant state can be maintained, an elevator cage can immediately arrive in response to a hall call which is generated on whichever floor and in whichever direction, thus making it possible to restrain a long waiting time.
- a three-phase alternate current i.e., a temporally equidistant state
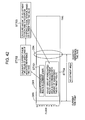
- FIG. 17 a description will be made of another exemplary configuration of the cage interval evaluation value calculation unit 4 shown in Fig. 2 .
- the configuration in Fig. 17 is intended to evaluate a cage interval from a deviation between a target route and a forecasted route (forecasted trajectory) with reference to the target route (target trajectory) which is an ideal route (trajectory) in a temporally equidistant state.
- the use of this target route is a feature of the configuration illustrated in Fig. 17 .
- Fig. 17 can evaluate each cage interval uniformity over a wide time region because the target route serves as a detailed reference for a higher time interval uniformity.
- a target route creation unit 410 creates an ideal route in a temporally equidistant state for each cage based on input information (entered from the input information storage unit 2 in Fig. 2 ), and a forecasted route creation unit 411 creates a forecasted route for each cage.
- a method of creating the forecasted route is the same as the previously described method, and the creation of the target route will be described later with reference to Figs. 42 to 44 .
- a route deviation calculation unit 414 calculates a deviation of the forecasted route from the target route for each cage. This deviation can be calculated, for example, using the area of a difference between the two routes.
- a cage interval evaluation value calculation unit 415 calculates a cage interval evaluation value (cage interval evaluation value when each cage is preliminary allocated to a hall call) for each cage based on the calculated inter-route deviation. Based on the cage interval evaluation values, a hall call is allocated to the cage having the highest evaluation value.
- An average round time calculation unit 412 calculates an average round time based on the input information, and an adjusted reference time setting unit 413 determines the value of an adjusted reference time based on the average round time T. The set adjusted reference time is used during the creation of the target route. The creation of the target route will also be described later in greater detail with reference to Figs. 42 to 44 .
- the allocation evaluation control based on the target route (one of evaluation functions for a future call), shown in Fig. 17 , will be described in greater detail.
- the allocation evaluation control based on the target route comprises three fundamental components, i.e., the target route creation unit 410, forecasted route creation unit 411, and inter-route deviation calculation unit 412.
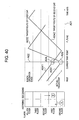
- Fig. 40 includes diagrams showing an example of the control concept of the target route control.
- the left-hand diagram is a diagram conceptually showing cross-sections of elevator paths (vertical direction) within a building, and the states of elevator cars moving therein.
- the right-hand diagram indicates the time axis on the horizontal axis (A01), and the axis of floors of the building on the vertical axis (A02), where trajectories of the operations of the respective elevator cages are represented on the time axis (generally called the operation diagram).
- the diagram shows a situation of the elevator group management for two cars by way of example.
- a first car (cage designated by 1) has inverted the direction on the ground floor and is operating toward the upward direction, wile a second car (cage designated by 2) is operating toward the downward direction from the first floor.
- a second car (cage designated by 2) is operating toward the downward direction from the first floor.
- a trajectory of each elevator cage on the left side of the current time point represents an actual trajectory.
- the actual trajectory of the first car is a trajectory A031
- the actual trajectory of the second car is a trajectory A041.
- a key to this embodiment is trajectories drawn on the time axis in the future on the right side of the current time point. They represent “target trajectories” which should be traced by the respective cages.
- the target trajectory is called the "target route.”
- a feature of the allocation control based on the target route is that the operation of each elevator cage (more precisely, the allocation) is controlled to follow the target route.
- the target routes for the respective cages are a target route A032 for the first car, and a target route A042 for the second car.
- the introduction of the target (or reference) trajectory which should be traced by each car on the time axis into the control is a feature unique to the present invention, which has not been found in the conventional group management control.
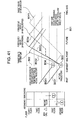
- Fig. 41 includes diagrams showing how the allocation of an elevator cage is determined for a hall call in accordance with the target routes.
- Fig. 41 includes basically the same diagrams, where the left-hand diagram shows the states of elevators on a vertical section of elevator paths, and the right-hand diagram represents an operation diagram.
- the group management control allocates an appropriate car from the first car (B03) and second car (B04).
- the target route of the first car is a trajectory B032. Forecasted route of the first car (forecasted trajectory in the future from the current time point.
- This forecasted trajectory is hereinafter called the "forecasted route" is a route B033 (forecasted route 1) when the first car is allowed to pass without allocated a new hall call. Therefore, when a new hall call is allocated to the first car, a route B034 (forecasted route 2) is employed instead.
- a route B034 forecasted route 2
- movements of each car are moved to follow the target route.
- the forecasted route 1 B033 is closer to the target route, i.e., the route on which the first car is allowed to pass without allocated a hall call, so that the first car is not allocated any hall call.
- the actual trajectory of the first car operates to follow the target route.
- the target route is drawn such that each elevator cage follows a temporally equidistant trajectory in the future.
- the actual trajectory of the cage follows its target route, and as a result, each cage can be controlled to maintain the temporally equidistant trajectory with stability for a long term.
- Fig. 41 it can be seen that the actual trajectories of the fist car (B03) and second car (B041) up to the current time point, i.e., the trajectory (B031) of the firs car and the trajectory (B041) of the second car are close to each other, and therefore, they are in a bunch operation state.
- the first car (B03) is not allocated, and following the target routes, they approach to the temporally equidistant state.
- Fig. 42 shows an outline of a target route creation process.
- Fig. 42 shows a target creation process which utilizes an adjustment area (later described).
- a graph D01 indicates the time on the horizontal axis, and floor positions in a building on the vertical direction, with a current time point defined at the origin (D03) of the time axis. While no graph is drawn in Fig. 42 , a target route, as shown in Fig. 43 , will be drawn therein by way of example.
- Fig. 43 shows an example of target route shapes before and after an adjustment according to one embodiment of the present invention.
- a target route creates a route to accomplish a temporally equidistant state at a predetermined time in the future, and this predetermined time corresponds to an adjusted reference time axis D04.
- the target route is represented by a route which represents a transient state until the temporally equidistant state prevails in an area between the time axis D03 at the current time point and the adjusted reference time axis D04 (called the "adjustment area"), and is represented as a route which enters the temporally equidistant state after the adjusted reference time axis D04.
- Such a target creation process is composed of the following four processes.
- Fig. 44 shows an example of the configuration of the target route creation unit.
- the configuration of the illustrated target route creation unit is generally composed of the following four components:
- the target route update unit 103A determines whether or not a current target route should be updated.
- the current phase time value calculation unit 103B at the next stage evaluates an interval state of the route of each cage with an index called a "phase time value" for a forecasted route of each elevator cage at that time point.
- phase is based on the fact that when the waveform of a three-phase alternate current of a sinusoidal wave is considered in the electric circuit theory, for example, a state in which the phases of the respective phases are uniformized is a state in which the phase of each phase is in an equal phase state by 2 ⁇ /3(rad) each.
- a state in which the phases of the respective phases are uniformized is a state in which the phase of each phase is in an equal phase state by 2 ⁇ /3(rad) each.
- This "phase-like index” corresponds to the index called the "phase time value” used in this embodiment. The phase time value will be described later.
- a phase time value adjustment amount for each cage is calculated in the adjustment amount calculation unit 103C for the phase time value of each cage in order to make the phase time value uniform.
- the adjusted route creation unit 103D adjusts the time phase value of the original forecasted route 103B of each cage.
- the route resulting from the adjustment serves as a target route.
- Fig. 43 is an operational conception diagram of a target route creation process executed by the target route creation unit shown in Fig. 44 . Described herein first is the operational concept of the control based on the previously described general control contents. First, the diagram (target route shape before the adjustment) of Fig. 43(a) corresponds to a forecasted route of each cage at a current time point which is based to create a target route. Here, an elevator group management system for three cars is considered. In Fig.
- a cage C010 of a first car, a cage C020 of a second car, and a cage C030 of a third car are descending the eighth floor, descending the second floor, and descending the third floor, respectively, on a axis C050 at the current time point.
- Forecasted routes (forecasted trajectories) of the three cages subsequent to the current time point are indicated by a solid line trajectory C011 for the first car, a one-dot chain line trajectory C031 for the second car, and a dotted-line trajectory C031 for the third car, respectively.
- a forecasted route creation method will be described in detail in a section of a description of the forecasted route creation unit.
- the target route update determination unit 103A determines an update of target routes
- the current phase time calculation unit 103B regards the forecasted routes C011, C021, C031 of the respective cages in Fig. 43(a) as one type of waveforms, and calculates their respective phase time values.
- the phase time values are calculated at intersections at which an adjusted reference time axis C040 in the diagram of Fig. 43(a) intersects the forecasted routes of the respective cages.
- the adjustment amount calculation unit 103C for the phase time value of each cage calculates the amounts of adjustment for the respective forecasted routes to be in an equidistant state.
- the amounts of adjustment are represented as three black circular points on the adjusted reference time axis C040 in Fig. 43(a) .
- a point C01A is a point which reflects the amount of adjustment, and the forecasted route C011 of the first car is adjusted in the next processing to pass this point C01A.
- a forecasted route C021 of the second car is adjusted in the next processing so as to pass a point C02A
- a forecasted route C032 is adjusted in the next processing so as to pass a point C03A.
- the results are the trajectories shown in Fig. 43(b).
- Fig. 43(b) is a diagram showing new target routes which are created on the basis of the forecasted routes shown in Fig. 43(a) .
- a target route of the first car C010 is a solid line trajectory C011N
- a target route of the second car C020 is a one-dot chain line trajectory C021N
- a target route of the third car C030 is a dotted line trajectory C031N .
- a feature of the trajectories of the target routes lies in that the route of each cage is drawn so as to guide to the temporally equidistant state, as shown in Fig. 43(b) .
- the target routes of the three cages are in the temporally equidistant state, respectively, after the adjusted reference axis C040.
- the trajectory is drawn such that each cage is guided to such a temporally equidistant state.
- the respective routes are adjusted such that each route passes the point found with the amount of adjustment, i.e., the point C01A, C02A, C03A on the adjusted reference axis. In this way, the target routes can be created as shown in such Fig. 43(b) .
- the current phase time value calculation unit 103B comprises an initial state route creation unit 103B1, an adjusted reference axis setting unit 103B2, a phase time value calculation unit 103B3 for calculating the phase time value of each car on the adjusted reference axis, and a phase time value order sorting unit 103B4.
- the initial state route creation unit 103B1 creates a forecasted route for each cage at a particular time point for use as a route in an initial state. This route in the initial state corresponds to the target route shape before adjustment shown in Fig. 43(a) .
- the adjusted reference axis setting unit 103B2 sets the adjusted reference time axis.
- the phase time value calculation unit 103B3 for calculating the phase time value of each axis on the adjusted reference axis calculates a phase time value of each cage on the adjusted reference time axis. Specifically, the phase time value is calculated for an intersection of the forecasted route of each cage with the adjusted reference time axis (corresponding to a forecasted position of each cage on the adjusted reference time axis).
- the phase time value order sorting unit 103B4 sorts the phase time values for the respective cages in the order of the phase time value.
- phase order For example, giving as an example the cage state of three cars in the target route shapes before the adjustment (corresponding to the forecasted routes) in Fig. 43(a) , from the intersections of the adjusted reference axis C040 with the forecasted routes C011, C021, C031 of the respective cages, the order of the phase time values of the respective cages are in the phase order of the third car, second car, and first car from the smallest one.
- the phase time value order sorting unit 103B employs a sorting algorithm, for example, a direct selection method, a bubble sort or the like to find such a phase order.
- the adjustment amount calculation unit 103C for the phase time value of each cage calculates the intervals between the respective cages using the phase time values based on the calculated phase time values of the respective cages and the phase order thereof, compares the values with a reference values for providing an equidistance, and calculates the amount of adjustment for the phase time values of the respective cages, as represented by the differences therebetween.
- the concept is that the intervals between the respective cages (evaluated by the phase time value) are found from the forecasted routes, and they are compared with the reference value for providing the equidistance, and the differences therebetween are used for the amount of adjustment to be adjusted from there. Giving Fig.
- phase order of the phase time values on the adjusted reference time axis C040 of the forecasted routes C011, C021, C031 of the respective cages is in the order of the third car, second car, and first car.
- T the three cars are equal in round time to one another
- tp(2) 0.17T for the second car
- tp(1) 0.77T for the first car.
- the interval between the second car and third car is 0.08T (tp(2)-tp(3)); the interval between the first car and second car is 0.6T (tp(1)-tp(2)); and the interval between the third car and first car is 0.32T (tp(3)-tp(1)+T).
- the interval between the second car and third car is very close.
- the intervals between respective cages in the intended temporally equidistant state can be represented by T/N in a group management for N cars.
- the difference between this target interval and the current interval between the respective cages is an interval to be adjusted.
- +0.25T is an interval value to be adjusted.
- the positive sign represents an increase in interval, where the current interval must be extended for the target.
- the negative sign represents a decrease in interval, where the current interval must be reduced for the target.
- the amount of adjustment to the phase time value is adjusted for each cage. This can be found in accordance with the following algorithm. For example, assume that in a group management for three cars, an A-car, a B-car, and a C-car are arranged in this order.
- Equation (19) represents that the difference between the adjusted phase time value of the B-car and the adjusted phase time value of the A-car, i.e., the interval satisfies T/3.
- Equation (19) represents that the difference between the adjusted phase time value of the B-car and the adjusted phase time value of the A-car, i.e., the interval satisfies T/3.
- ⁇ tp(A), ⁇ tp(B), ⁇ tp(C) cannot be solved with the three equations alone.
- the intervals between the respective cages are 0.33T and can therefore satisfy the condition for the equal intervals.
- an adjustment amount calculation unit 103D1 for a grid on the route of each cage calculates the amount of adjustment to a grid on the target route before adjustment (corresponding to the forecasted route) of each cage.
- the grid is defined to be a direction inversion point of the route intended in the adjustment area.
- the amount of adjustment to each grid is determined by a method of assigning from a grid close to a current time point in order to a value which exceeds a limiter value set for that grid, with the amount of adjustment to the cage as a total amount.
- the limiter value for the amount of adjustment to each cage is set by a grid limiter value setting unit 103D2.
- An adjusted grid position calculation unit 103D3 calculates a grid position gp_N(k, i) after the adjustment from the amount of adjustment ⁇ gtp(k, i) to each grid and the position gp(k, i) of the grid before the adjustment.
- a target route data calculation unit 103D4 calculates and updates new target route data.
- a newly updated target route passes an adjusted target point set to the amount of adjustment to the phase time value. Since the route of each cage is adjusted to pass the adjusted target point, the result of collecting the three cars is as shown in Fig. 43(b) , from which it can be seen that the target routes C011N, C021N, C031N of the three cars are in a temporally equal interval state. Of course, each route C011N, C021N, C031N passes the respective adjusted target point C01A, C02A, C03A. It can be also seen that the target route within the adjustment area adjusted by the grid plays an role of a transient guide for accomplishing the temporally equal interval state after the adjusted reference time axis. The foregoing is a detailed description on the target route creation process.
- Fig. 45 illustrates a second embodiment which is different from Fig. 2 of control blocks in the overall elevator group management system according to the present invention.
- Fig. 45 components identical to those in Fig. 2 are designated the same reference numerals, and a description thereon is omitted here.
- Fig. 45 differs from Fig. 1 in that the weighting coefficient is directly determined from the number of generated hall calls. Specifically, a hall call count calculation unit 10 calculates the number of generated hall calls, and based on this, a weighting coefficient calculation unit 5 calculates the weighting coefficient directly from the number of generated hall calls.
- Fig. 46 shows an example of a function for use by the weighting coefficient calculation unit 5 for finding the weighting coefficient.
- the horizontal axis indicates the number of hall calls generated per round
- the vertical axis indicates the weighting coefficient.
- the number of hall calls generated per round refers to an average number of hall calls which are generated during one round (for example, from the lowest floor in the upward direction to the lowest floor in the downward direction) of each of elevators which are managed in group.
- Fig. 46 the function for determining the weighting coefficient is represented by a curve F04. This function has the following four features.
- the reason for which the appropriate weighting coefficient can be found by specifying the number of hall calls generated per round of an elevator lies in that the importance of the interval evaluation value is strongly related to the number of hall calls possibly generated in the future. For example, as a larger number of hall calls are generated in the future, the interval should be made as temporally even as possible, so that the interval evaluation value should be forced to more strongly act.
- the number of hall calls possibly generated in the future has a high correlation with the number of hall calls generated per round at a particular time point or a time point subsequent thereto. Therefore, a certain relationship is established between the number of hall calls generated per round and an appropriate weighting efficient value, and by representing this as functions as shown in Fig. 10 , an appropriate weighting coefficient can be determined from the number of hall calls generated per round of the elevator.
- the graph in Fig. 46 shows an example in which the horizontal axis indicates the number of hall calls generated per round, but may indicate, not limited to this, a value based on the number of generated hall calls, for example, the number of hall calls generated for a predetermined time. Further alternatively, the horizontal axis may indicate an index of a scalar value related to traffic demand, not limited to the number of generated hall calls. For example, the horizontal axis may indicate the number of users, or a value based on the total value of the number of generated hall calls and the number of generated cage calls.
- the configuration of Fig. 45 is advantageous over the configuration of Fig. 2 in that an appropriate weighting coefficient can be promptly set by a simpler configuration. As a result, stable performance can be maintained even using a microcomputer, a processor, or the like which is expensive but provide low processing capabilities.
- Fig. 47 illustrates a third embodiment which is different from Figs. 2 and 45 of the elevator group management systems according to the present invention.
- Fig. 47 components identical to those in Fig. 2 are designated the same reference numerals, and a description thereon is omitted.
- Fig. 47 differs from Fig. 2 in that an assignment evaluation information display processing unit H01 is additionally provided.
- This assignment evaluation information display processing unit H01 is characterized by recording internal information such as an evaluation value which is relied on to determine an allocation of a hall call, intermediate information thereof, and the like, displaying the contents as required, transferring to the outside, and recording them on a recording medium.
- the purposes are to analyze, for each allocation process, which factor caused the allocation, and to reveal, when a long waiting occurred, for example, in which situation the long waiting was reached.
- a display processing means is effective because the elevator group management system according to the present invention can visually indicates the will of the group management control side through forecasted trajectories and target routes.
- the allocation evaluation information display processing unit H01 is composed of a determination unit H02, a recording unit H03, a drawing processing unit H04, a recording medium H05, and an output unit H06.
- the determination unit H02 is a component for determining whether or not evaluation value information should be recorded, and is configured to record information on allocation variation in the recording unit H03 when a recording enable signal is generated from the determination unit H02. This determination may involve, for example, a particular time zone, a particular traffic flow, the occurrence of an average waiting time equal to or larger than a predetermined value, and the occurrence of an average hall call continuation time equal to or larger than a predetermined value.
- the recording unit H03 records variety of data associated with the allocation evaluation calculated by the group management control unit 1. For example, the recording unit H03 records a waiting time evaluation value calculated b the waiting time evaluation value 3, the output of the cage interval evaluation calculation unit 4, the weighting coefficient set by the weighting coefficient setting unit 8, the output of the general evaluation value calculation unit 6, and the name of car to which an allocation is determined, which is the output of the allocated elevator determination unit 7. For the cage interval evaluation value calculation unit 4, its detailed functions have been shown in Fig. 48 , and will be described later in greater detail.
- the drawing processing unit H04 performs a drawing data creation process for drawing information related to allocations recorded in the recording unit H03 on a screen.
- the output unit H06 displays drawing data on the screen.
- the recording medium H05 preserves data recorded by the recording medium H03.
- the recording medium H05 used herein may be a floppy disk, a memory card, a USB memory, a hard disk or the like.
- the drawing data created by the drawing processing unit H04 is transferred to the outside through a communication network H07, so that the drawing data can be remotely displayed on a screen or recorded.
- Fig. 48 is a detailed functional block diagram of the interval evaluation value calculation unit 4, showing the flow of data information recorded by the recording unit H03.
- the configuration of Fig. 48 is based on Fig. 12 , so that components identical to those in Fig. 12 are designated the same reference numerals, and a description thereon is omitted here.
- Data sent to the recording unit H03 includes the interval evaluation time tref calculated by the interval evaluation time setting unit 405, which is outputted from an interval evaluation time data output unit 4Z2. Further, there is forecasted car trajectory data (specifically, the forecasted trajectory table of Fig. 23 ) created by the forecasted trajectory calculation unit 401, outputted by a forecasted trajectory data output unit 4Z3.
- forecasted trajectory data Since the forecasted trajectory data is large in amount as it is, it may be converted, for example, to a simple version of forecasted trajectories as shown in Fig. 33 to compress the data amount, and can therefore be limited to an appropriate data amount. Such a conversion process is performed by a forecasted trajectory data conversion unit 4Z1. Otherwise, forecasted cage interval data calculated by the forecasted cage interval processing unit 402 (outputted from an output unit 4Z5), interval evaluation value data calculated by the interval evaluation value calculation unit 403 (outputted from an output unit 4Z6), and the like are outputted to the recording unit H03 for recording.
- Fig. 49 shows an example of screen output data created by the drawing processing unit H04 and displayed by the output unit H06 in Fig. 47 .
- Screen output elements in Fig. 49 can be generally classified into the following four groups:
- the group L001 for displaying information related to forecasted trajectories is characterized by collectively displaying the following data on a graph L006 which represents the time and floor positions on the two axes.
- Data displayed on the graph may include forecasted trajectories of respective cars (a forecasted trajectory L010 of a first car, and a forecasted trajectory L011 of a second car), an interval evaluation time L012, and cage positions of the respective cars at an interval evaluation time (a cage position L015 of the first car and a cage position L016 of the second car).
- Such a display can show in detail how the forecasted trajectory of each car is like, at which time point a cage interval of each car is evaluated, and how the positional relationship between the cages are like at that time. As a result, how the cage interval evaluation has acted can be visually and readily confirmed together with the cage interval evaluation value, later described.
- the interval evaluation time is adaptively adjusted in accordance with a situation of call making and a situation of traffic flow, so that it is important to explicitly display which time point was selected to be the interval evaluation time in the event of that allocation.
- an upper left drawing L005 (a cage L007 of the first car, a cage L008 of the second car, and a hall call L009), which displays a cage state and a call state at the allocation time, is displayed.
- They are effective in supporting information on the forecasted trajectories. For example, it is possible to understand a basis of a forecasted trajectory drawn from which call occurrence state.
- the group L002 for displaying information related to a hall call intended for allocation displays time information L017 on a time at which the hall call was generated, hall call floor information L018, and hall call direction information L019. Details on the hall call intended for allocation can be confirmed from these pieces of information.
- the group L003 for displaying evaluation value information displays each information of an allocated car name L020, waiting time evaluation value L021 at a particular time point, a cage interval evaluation value L022, a weighting coefficient value L023, and a general evaluation value L024. All these pieces of information are important information which plays an important role in determining the allocation, and by displaying them one by one, it is possible to know from which factor the allocation was determined. In other words, the factor of determining the allocation can be roughly estimated from the information displayed in the group L003 which displays evaluation value information.
- the waiting time evaluation value strongly acted in order to avoid a long waiting time, an exacerbation of the cage interval evaluation value was avoided, the weighting coefficient value was large at a certain time point so that the cage interval evaluation value was regarded as important, and the like, which can support a search for the allocation determination factor.
- the contents of the cage interval evaluation value which is difficult to understand with numbers alone, can be more intuitively understood.
- the group L004 for displaying detailed information on the cage interval evaluation value displays detailed information internal to a process calculated in calculating the cage interval evaluation value. Specifically, information including an interval evaluation time value L025, a forecasted cage position L026 of each car at the interval evaluation time, and the forecasted cage interval L027 is displayed. Since the cage interval evaluation value is information which aggregates all, the basis of being an evaluation value can be hard to understand in a quantitative sense. In such an event, a further detailed analysis can be made from the aforementioned detailed information.
- a principal feature of the screen output data is that the forecasted trajectory of each car, the interval evaluation time which is the time at which the cage position is forecasted on the forecasted trajectory, the forecasted cage position and direction of each car at the cage interval evaluation time are collectively displayed on a single graph. Further, the screen output data features in that a waiting time evaluation value of a car intended for allocation evaluation, a cage interval evaluation value, a weighting coefficient value, and a general evaluation value are displayed in parallel as evaluation value information.
- the waiting time evaluation value is an evaluation value for an actual call which has been previously generated
- the cage interval evaluation value is an evaluation value for a future call which has not been generated
- these pieces of information show which of the actual call and feature call was a factor that resulted in allocation.
- a basic intention for the allocation can be known.
- Fig. 50 shows an embodiment of display output data different from Fig. 49 .
- elements identical to those in Fig. 49 are designated the same reference numerals, and a description thereon is omitted here.
- Fig. 50 differs from Fig. 49 in that a forecasted trajectory before hall call allocation (a forecasted trajectory L010 of a first car), indicated by a solid line, is superimposed on a forecasted trajectory after the hall call allocation (a forecasted trajectory L101 of the same first car), indicated by a broken line, in the display.
- the forecasted trajectory L101 after the hall call allocation includes a stop caused by the hall call allocation which appears on the trajectory. Specifically, this is a horizontal trajectory section indicated by reference numeral L102.
- a hall call L009 at this time is generated on the twelfth floor in the upward direction.
- the cage interval extends to the forecasted trajectory L101 after the allocation of the first car with respect to a forecasted trajectory L011 of the second car, indicated by a one-dot chain line.
- the cage interval changes in a desired direction in view of the cage interval evaluation.
- the effect produced by the allocation can be quantitatively displayed in a readily understandable manner. This is effective in analyzing a factor of allocation and understanding the basis of allocation.
- the actual operation trajectories are displayed on the left side, and the forecasted trajectories are displayed on the right side.
- all stops of the cages have actually occurred, and reference numeral L204 shown halfway on the actual operation trajectory L201 of the first car indicates that the first car has actually stopped on the second floor in the upward direction. In other words, no probabilistic stop exists. This is an apparent difference between the actual operation trajectory and forecasted trajectory.
- Fig. 52 illustrates an example of a processing flow of a forecasted trajectory display method.
- This example assumes a method of displaying a forecasted trajectory for each preliminarily allocated car.
- the flow of the process will be described below in a specific manner.
- necessary data is read (L301), and a display format is next selected (L302).
- This selection of the display format can involve, for example, a selection of items to be displayed, and a setting of a range for a display time.
- a hall call to be displayed is selected (L303).
- a display format is next selected (L402).
- This selection of the display format can involve, for example, a selection of items to be displayed, and a setting of a range for a display time.
- a database which records hall calls which have been generated in the past is searched for a hall call H to be displayed (L403).
- a past database is searched for a K-th car which is determined to be actually allocated to the retrieved hall call H (L404).
- display data (A) on a forecasted trajectory of the K-th car, when the selected hall call is allocated to the K-th car, is created (L405).
- forecasted trajectory creating means for creating a forecasted trajectory indicative of a forecasted position of each elevator for a time axis for a predetermined period in the future
- evaluation value calculating means for calculating an evaluation value related to a positional relationship between the forecasted trajectories of the respective elevators
- allocating means for allocating a hall call to an elevator
Landscapes
- Engineering & Computer Science (AREA)
- Automation & Control Theory (AREA)
- Elevator Control (AREA)
- Indicating And Signalling Devices For Elevators (AREA)
Applications Claiming Priority (3)
| Application Number | Priority Date | Filing Date | Title |
|---|---|---|---|
| JP2005280002A JP4763403B2 (ja) | 2005-09-27 | 2005-09-27 | エレベータの群管理システム及びその制御方法 |
| JP2005279991A JP4573741B2 (ja) | 2005-09-27 | 2005-09-27 | エレベータの群管理システム及びその制御方法 |
| JP2005280024A JP4800723B2 (ja) | 2005-09-27 | 2005-09-27 | エレベータの群管理システム及びその制御方法 |
Publications (2)
| Publication Number | Publication Date |
|---|---|
| EP1767484A1 EP1767484A1 (en) | 2007-03-28 |
| EP1767484B1 true EP1767484B1 (en) | 2010-11-03 |
Family
ID=37649610
Family Applications (1)
| Application Number | Title | Priority Date | Filing Date |
|---|---|---|---|
| EP06019811A Active EP1767484B1 (en) | 2005-09-27 | 2006-09-21 | Elevator group management system and control method therefor |
Country Status (3)
| Country | Link |
|---|---|
| EP (1) | EP1767484B1 (https=) |
| DE (1) | DE602006017941D1 (https=) |
| TW (1) | TW200722359A (https=) |
Families Citing this family (2)
| Publication number | Priority date | Publication date | Assignee | Title |
|---|---|---|---|---|
| US7546905B2 (en) * | 2006-03-27 | 2009-06-16 | Mitsubishi Electric Research Laboratories, Inc. | System and method for scheduling elevator cars using pairwise delay minimization |
| US11383954B2 (en) | 2018-06-26 | 2022-07-12 | Otis Elevator Company | Super group architecture with advanced building wide dispatching logic |
Citations (2)
| Publication number | Priority date | Publication date | Assignee | Title |
|---|---|---|---|---|
| US4982817A (en) * | 1988-10-19 | 1991-01-08 | Mitsubishi Denki Kabushiki Kaisha | Group supervision apparatus for elevator system |
| EP1719727A2 (en) * | 2005-05-06 | 2006-11-08 | Hitachi, Ltd. | System and display for an elevator group supervisory and method for supervising a plurality of elevators |
Family Cites Families (11)
| Publication number | Priority date | Publication date | Assignee | Title |
|---|---|---|---|---|
| JPS5811479A (ja) * | 1981-07-15 | 1983-01-22 | 株式会社日立製作所 | エレベ−タ群管理制御装置 |
| JPH0712890B2 (ja) | 1986-06-27 | 1995-02-15 | 株式会社日立製作所 | エレベーター群管理制御装置 |
| JP2607597B2 (ja) * | 1988-03-02 | 1997-05-07 | 株式会社日立製作所 | エレベータの群管理制御方法 |
| US5083640A (en) * | 1989-06-26 | 1992-01-28 | Mitsubishi Denki Kabushiki Kaisha | Method and apparatus for effecting group management of elevators |
| US5305194A (en) * | 1991-04-10 | 1994-04-19 | Inventio Ag | Method and apparatus for preventing local bunching of cars in an elevator group with variable traffic flow |
| JPH05238653A (ja) * | 1992-02-27 | 1993-09-17 | Hitachi Ltd | 群管理エレベータ装置 |
| JPH06271213A (ja) * | 1993-03-18 | 1994-09-27 | Hitachi Ltd | エレベーターの群管理制御装置 |
| JPH0761722A (ja) | 1993-08-27 | 1995-03-07 | Hitachi Ltd | エレベーターの群管理制御装置 |
| KR100294093B1 (ko) * | 1997-04-07 | 2001-10-26 | 다니구찌 이찌로오, 기타오카 다카시 | 엘리베이터의군관리제어장치 |
| JP2000118890A (ja) | 1998-10-09 | 2000-04-25 | Toshiba Corp | エレベータ群管理制御装置 |
| FI115130B (fi) | 2003-11-03 | 2005-03-15 | Kone Corp | Menetelmä ja laite hissiryhmän ohjaamiseksi |
-
2006
- 2006-09-05 TW TW095132725A patent/TW200722359A/zh not_active IP Right Cessation
- 2006-09-21 DE DE200660017941 patent/DE602006017941D1/de active Active
- 2006-09-21 EP EP06019811A patent/EP1767484B1/en active Active
Patent Citations (2)
| Publication number | Priority date | Publication date | Assignee | Title |
|---|---|---|---|---|
| US4982817A (en) * | 1988-10-19 | 1991-01-08 | Mitsubishi Denki Kabushiki Kaisha | Group supervision apparatus for elevator system |
| EP1719727A2 (en) * | 2005-05-06 | 2006-11-08 | Hitachi, Ltd. | System and display for an elevator group supervisory and method for supervising a plurality of elevators |
Also Published As
| Publication number | Publication date |
|---|---|
| TW200722359A (en) | 2007-06-16 |
| EP1767484A1 (en) | 2007-03-28 |
| TWI334849B (https=) | 2010-12-21 |
| DE602006017941D1 (de) | 2010-12-16 |
Similar Documents
| Publication | Publication Date | Title |
|---|---|---|
| JP4800723B2 (ja) | エレベータの群管理システム及びその制御方法 | |
| JP5464979B2 (ja) | エレベータの群管理システム | |
| JP4469897B2 (ja) | エレベータの群管理システムおよびエレベータの群管理制御方法 | |
| AU614151B2 (en) | Optimized "up peak" elevator channeling system with predicted traffic volume equalized sector assignments | |
| JP5094314B2 (ja) | エレベータ群管理システム | |
| EP0578339B1 (en) | Up peak elevator channeling system with optimised preferential service to high intensity traffic floors | |
| JP6038690B2 (ja) | エレベータ交通需要予測装置 | |
| JP2002230196A (ja) | エレベーターの保守契約支援システム | |
| GB2214662A (en) | Controlling elevators | |
| JP2010527873A (ja) | 新規の建物および既存の建物内のエレベータ装置用の設計プロセス | |
| JPH0517150B2 (https=) | ||
| CN113191533A (zh) | 仓库用工预测方法、装置、设备及存储介质 | |
| EP1767484B1 (en) | Elevator group management system and control method therefor | |
| CN116119471A (zh) | 一种电梯群管理系统 | |
| JP4573741B2 (ja) | エレベータの群管理システム及びその制御方法 | |
| JP6735875B1 (ja) | 予約数予測装置 | |
| JP4763403B2 (ja) | エレベータの群管理システム及びその制御方法 | |
| JPH06329352A (ja) | エレベータの運行需要予測装置 | |
| JP4454979B2 (ja) | エレベータ群管理システム、エレベータ群管理方法、およびエレベータ群管理プログラム | |
| Kim et al. | Feature engineering-based short-term prediction model for postal parcel logistics | |
| Ibrahim et al. | Industrial area weighbridge simulation model considering vehicle capacity and destination using arena software | |
| JPH01192682A (ja) | エレベーターの群管理制御装置 | |
| Baker | New approaches to yield management: comprehensive overbooking/allocation heuristics for the hotel industry | |
| JP2026004926A (ja) | 旅客流動混雑予測装置、旅客流動混雑予測方法及び旅客流動混雑予測プログラム | |
| Johny | A Forecasting model of tourists in tourist destinations using regression technology |
Legal Events
| Date | Code | Title | Description |
|---|---|---|---|
| PUAI | Public reference made under article 153(3) epc to a published international application that has entered the european phase |
Free format text: ORIGINAL CODE: 0009012 |
|
| AK | Designated contracting states |
Kind code of ref document: A1 Designated state(s): AT BE BG CH CY CZ DE DK EE ES FI FR GB GR HU IE IS IT LI LT LU LV MC NL PL PT RO SE SI SK TR |
|
| AX | Request for extension of the european patent |
Extension state: AL BA HR MK YU |
|
| 17P | Request for examination filed |
Effective date: 20070926 |
|
| AKX | Designation fees paid |
Designated state(s): DE FR |
|
| 17Q | First examination report despatched |
Effective date: 20071108 |
|
| GRAP | Despatch of communication of intention to grant a patent |
Free format text: ORIGINAL CODE: EPIDOSNIGR1 |
|
| GRAS | Grant fee paid |
Free format text: ORIGINAL CODE: EPIDOSNIGR3 |
|
| RIN1 | Information on inventor provided before grant (corrected) |
Inventor name: OKABE, RYO Inventor name: FUJINO, ATSUYA Inventor name: TANAE, SHUNICHI Inventor name: AIDA, KEIICHI Inventor name: TAMADA, MASAAKI Inventor name: TORIYABE, SATORU Inventor name: HOSHINO, TAKAMICHI Inventor name: YOSHIKAWA, TOSHIFUMI Inventor name: YONEDA, KENZI Inventor name: MURAOKA, KAZUFUMI |
|
| GRAA | (expected) grant |
Free format text: ORIGINAL CODE: 0009210 |
|
| RIN1 | Information on inventor provided before grant (corrected) |
Inventor name: FUJINO, ATSUYA Inventor name: AIDA, KEIICHI Inventor name: TANAE, SHUNICHI Inventor name: TAMADA, MASAAKI Inventor name: YONEDA, KENZI Inventor name: YOSHIKAWA, TOSHIFUMI Inventor name: MURAOKA, KAZUFUMI Inventor name: TORIYABE, SATORU Inventor name: HOSHINO, TAKAMICHI Inventor name: OKABE, RYO |
|
| AK | Designated contracting states |
Kind code of ref document: B1 Designated state(s): DE FR |
|
| REF | Corresponds to: |
Ref document number: 602006017941 Country of ref document: DE Date of ref document: 20101216 Kind code of ref document: P |
|
| PLBE | No opposition filed within time limit |
Free format text: ORIGINAL CODE: 0009261 |
|
| STAA | Information on the status of an ep patent application or granted ep patent |
Free format text: STATUS: NO OPPOSITION FILED WITHIN TIME LIMIT |
|
| 26N | No opposition filed |
Effective date: 20110804 |
|
| REG | Reference to a national code |
Ref country code: DE Ref legal event code: R097 Ref document number: 602006017941 Country of ref document: DE Effective date: 20110804 |
|
| PGFP | Annual fee paid to national office [announced via postgrant information from national office to epo] |
Ref country code: FR Payment date: 20140906 Year of fee payment: 9 |
|
| REG | Reference to a national code |
Ref country code: FR Ref legal event code: ST Effective date: 20160531 |
|
| PG25 | Lapsed in a contracting state [announced via postgrant information from national office to epo] |
Ref country code: FR Free format text: LAPSE BECAUSE OF NON-PAYMENT OF DUE FEES Effective date: 20150930 |
|
| PGFP | Annual fee paid to national office [announced via postgrant information from national office to epo] |
Ref country code: DE Payment date: 20250730 Year of fee payment: 20 |