EP1428016B1 - Method of quantitative video-microscopy and associated system and computer software program product - Google Patents
Method of quantitative video-microscopy and associated system and computer software program product Download PDFInfo
- Publication number
- EP1428016B1 EP1428016B1 EP02798993A EP02798993A EP1428016B1 EP 1428016 B1 EP1428016 B1 EP 1428016B1 EP 02798993 A EP02798993 A EP 02798993A EP 02798993 A EP02798993 A EP 02798993A EP 1428016 B1 EP1428016 B1 EP 1428016B1
- Authority
- EP
- European Patent Office
- Prior art keywords
- sample
- image
- dye
- green
- red
- Prior art date
- Legal status (The legal status is an assumption and is not a legal conclusion. Google has not performed a legal analysis and makes no representation as to the accuracy of the status listed.)
- Expired - Lifetime
Links
Images
Classifications
-
- G—PHYSICS
- G06—COMPUTING OR CALCULATING; COUNTING
- G06V—IMAGE OR VIDEO RECOGNITION OR UNDERSTANDING
- G06V20/00—Scenes; Scene-specific elements
- G06V20/60—Type of objects
- G06V20/69—Microscopic objects, e.g. biological cells or cellular parts
-
- G—PHYSICS
- G01—MEASURING; TESTING
- G01N—INVESTIGATING OR ANALYSING MATERIALS BY DETERMINING THEIR CHEMICAL OR PHYSICAL PROPERTIES
- G01N21/00—Investigating or analysing materials by the use of optical means, i.e. using sub-millimetre waves, infrared, visible or ultraviolet light
- G01N21/17—Systems in which incident light is modified in accordance with the properties of the material investigated
- G01N21/25—Colour; Spectral properties, i.e. comparison of effect of material on the light at two or more different wavelengths or wavelength bands
- G01N21/27—Colour; Spectral properties, i.e. comparison of effect of material on the light at two or more different wavelengths or wavelength bands using photo-electric detection ; circuits for computing concentration
-
- G—PHYSICS
- G06—COMPUTING OR CALCULATING; COUNTING
- G06T—IMAGE DATA PROCESSING OR GENERATION, IN GENERAL
- G06T7/00—Image analysis
- G06T7/60—Analysis of geometric attributes
-
- G—PHYSICS
- G06—COMPUTING OR CALCULATING; COUNTING
- G06T—IMAGE DATA PROCESSING OR GENERATION, IN GENERAL
- G06T2207/00—Indexing scheme for image analysis or image enhancement
- G06T2207/10—Image acquisition modality
- G06T2207/10056—Microscopic image
Definitions
- the present invention relates to image analysis and, more particularly, to a method for quantitative video-microscopy in cellular biology and pathology applications and an associated system and computer software program product therefor.
- Effective analysis of microscopic images is essential in cellular biology and pathology, particularly for detection and quantification of genetic materials such as, for example, genes or messenger RNA, or the expression of this genetic information in the form of proteins such as through, for example, gene amplification, gene deletion, gene mutation, messenger RNA molecule quantification, or protein expression analyses.
- Gene amplification is the presence of too many copies of the same gene in one cell, wherein a cell usually contains two copies, otherwise known as alleles, of the same gene.
- Gene deletion indicates that less than two copies of a gene can be found in a cell.
- Gene mutation indicates the presence of incomplete or non-functional genes.
- Messenger RNAs are molecules of genetic information, synthesized from a gene reading process, that serve as templates for protein synthesis.
- Protein expression is the production of a given protein by a cell. If the gene coding for the given protein, determined from a protein expression process, is enhanced or excess copies of the gene or mRNA are present, the protein may be over-expressed. Conversely, if the gene coding is suppressed or absent, the protein may be under-expressed or absent.
- Normal cellular behaviors are precisely controlled by molecular mechanisms involving a large number of proteins, mRNAs, and genes.
- Gene amplification, gene deletion, and gene mutation are known to have a prominent role in abnormal cellular behaviors through abnormal protein expression.
- the range of cellular behaviors of concern includes behaviors as diverse as, for example, proliferation or differentiation regulation. Therefore, effective detection and quantification in gene amplification, deletion and mutation, mRNA quantification, or protein expression analyses is necessary in order to facilitate useful research, diagnostic and prognostic tools.
- the biological samples When microscopy is the chosen laboratory technique, the biological samples must first undergo specific detection and revelation preparations. Once the samples are prepared, a human expert typically analyzes the samples with a microscope alone in a qualitative study, or with a microscope coupled to a camera and a computer in a quantitative and generally standardized study. In some instances, the microscope may be configured for fully automatic analysis, wherein the microscope is automated with a motorized stage and focus, motorized objective changers, automatic light intensity controls and the like.
- the preparation of the samples for detection may involve different types of preparation techniques that are suited to microscopic imaging analysis, such as, for example, hybridization-based and immunolabeling-based preparation techniques.
- Such detection techniques may be coupled with appropriate revelation techniques, such as, for example, fluorescence-based and visible color reaction-based techniques.
- ISH In Situ Hybridization
- FISH Fluorescent In Situ Hybridization
- ISH and FISH are detection and revelation techniques used, for example, for detection and quantification in genetic information amplification and mutation analyses.
- Both ISH and FISH can be applied to histological or cytological samples. These techniques use specific complementary probes for recognizing corresponding precise sequences.
- the specific probe may include a chemical (ISH) marker or a fluorescent (FISH) marker, wherein the samples are then analyzed using a transmission microscope or a fluorescence microscope, respectively.
- ISH chemical marker
- FISH fluorescent
- the use of a chemical marker or a fluorescent marker depends on the goal of the user, each type of marker having corresponding advantages over the other in particular instances.
- IHC immunohistochemistry
- ICC immunocytochemistry
- IHC is the application of immunochemistry to tissue sections
- ICC is the application of immunochemistry to cultured cells or tissue imprints after they have undergone specific cytological preparations such as, for example, liquid-based preparations.
- Immunochemistry is a family of techniques based on the use of a specific antibody, wherein antibodies are used to specifically target molecules inside or on the surface of cells. The antibody typically contains a marker that will undergo a biochemical reaction, and thereby experience a change color, upon encountering the targeted molecules.
- signal amplification may be integrated into the particular protocol, wherein a secondary antibody, that includes the marker stain, follows the application of a primary specific antibody.
- chromogens of different colors are used to distinguish among the different markers.
- the maximum number of markers that may be used in a study is restricted by several factors.
- the spectral overlapping of the colors used to reveal the respective markers may be a limiting factor because dyes may absorb throughout a large portion of the visible spectrum. Accordingly, the higher the number of dyes involved in a study, the higher the risk of spectral overlapping.
- the spectral resolution of the acquisition device may be a limiting factor and the minimal color shift that the device is able to detect must be considered.
- immunochemistry as well as chemistry in ISH, are generally considered to exhibit poor sensitivity when quantification of a marker must be achieved.
- the quantification accuracy of these techniques may be dependent upon several factors.
- the type of reaction used may play a role in the accuracy of the technique since the linearity of the relationship between ligand concentration and the degree of the immunochemical staining reaction may strongly depend on the reaction type. More particularly, for example, a peroxidase / anti-peroxidase method may be more linear than a biotin-avidin method.
- the cellular localization of the markers may also affect accuracy where, for example, if membrane and nuclear markers spatially overlap, the resulting color is a mixture of the respective colors.
- a calibration standard such as, for example, cells with known features, gels with given concentrations of the marker, or the like, may be required where a developed analysis model is applied to a new and different case.
- Staining kits are generally available which incorporate calibration standards.
- the calibration standard is usually only applicable to a particular specimen, such as a specific cell or a structure of a specific type which is known to exhibit constant features with respect to the standard, and may be of limited utility when applied to a sample of a different nature.
- HER2 is a membrane protein that has been shown to have a diagnostic and prognostic significance in metastatic breast cancer. Because HER2 positive patients were shown to be more sensitive to treatments including Herceptin® (a target treatment developed by Genentech), the definition of the HER2 status of metastatic breast cancers has been proven to be of first importance in the choice of the appropriate treatment protocol. This definition of the HER2 status was based on a study of samples treated with either hybridization (FISH, ISH) or immunolabeling (IHC) techniques.
- FISH hybridization
- ISH immunolabeling
- a typical microscopy device based on image acquisition and processing, the magnified image of the sample must first be captured and digitized with a camera.
- CCD charge coupled device
- Excluding spectrophotometers two different techniques are generally used to perform such colorimetric microscopy studies.
- a black and white (BW) CCD camera may be used. In such an instance, a gray level image of the sample is obtained, corresponding to a monochromatic light having a wavelength specific to the staining of the sample to be analyzed.
- the specific wavelength of light is obtained either by filtering a white source light via a specific narrow bandwidth filter, or by directly controlling the wavelength of the light source, using either manual or electronic controls. Accordingly, using this technique, the analysis time increases as the number of colors increases because a light source or a filter must be selected for every different sample staining or every different wavelength. Therefore, many different images of the sample, showing the spectral response of the sample at different wavelengths, must be individually captured in a sequential order to facilitate the analysis. When multiple scenes or fields of view must be analyzed, the typical protocol is to automate the sequence in a batch mode to conserve processing time.
- a color CCD digital camera is used, wherein three gray level images of the sample are simultaneously captured and obtained. Each gray level image corresponds to the respective Red, Green and Blue channel (RGB) of the color CCD camera.
- RGB Red, Green and Blue channel
- the images are then analyzed directly in the RGB color space by restricting the analysis to pixels located in a specific region of the RGB cube, the specific region also including pixels from a corresponding training database.
- the images are analyzed, after mathematical transform of the RGB color space, in one of the many color spaces defined by the CIE (International
- the second technique generally relies upon either the detection of contrast between the specie/species of interest and the remainder of the sample or the analysis of the sample over a narrow bandwidth.
- Spectrometers such as that described in U.S. Patent No. 6,007,996 to McNamara et al. , may implement a particular combination of dyes and an interferometer to gather the necessary image data for analysis.
- the '996 patent discloses an imaging technique that requires fluorescent dyes to be chosen according to a particular method so as to provide a specific combination of dyes.
- An interferometer configured to examine a narrow bandwidth (predefined wavelength range or predetermined set of linear combinations of spectral intensity) is then required to analyze the specimen, wherein the spectral data collection device and the selection of dyes must be such that the spectral component associated with each of the stains is collectable.
- the interferometer requires that a plurality of frames of the sample be acquired at successive measurement increments across a wavelength range to be examined, with each of the frame covering the narrow bandwidth spectral resolution of the interferometer device.
- a plurality of frames for each sample must be gathered over the wavelength range, wherein the images are separated according to each dye by integrating the plurality of frames comprising the optical signal over the spectral (wavelength) range of the CCD array using an RGB algorithm so as to provide a converted RGB image.
- WO 98/55026 to Youvan et al. discloses imaging hardware and software, calibrants, and methods for visualizing and quantifying the amount of Fluorescence Resonance Energy Transfer (FRET) occurring between donor and acceptor molecules in epifluorescence microscopy and uses algorithms that pseudocolor the image to display pixels exhibiting radiometrically-corrected fluorescence emission from the donor (blue), acceptor (green), and FRET (red), wherein an orthonormalization transformation (Förster equation) is used to convert donor, acceptor, and FRET signals into the unique red, green, and blue channels.
- FRET Fluorescence Resonance Energy Transfer
- An optical system using catadiotropic imaging includes a focusing lens group with plural lens elements of a single material with refractive surfaces having curvatures and positions selected to focus light to an intermediate image with high levels of correction in the final image of both image aberrations and chromatic variation of aberrations.
- the field lens group is positioned near the intermediate image to correct chromatic aberrations.
- the catadiotropic group includes a concave spherical reflector and a planar or near planar reflector (a reflectively coated lens element) near the final image, wherein both reflective elements have central optical apertures.
- the catadiotropic group focuses light from the intermediate image to a final image.
- the catadiotropic imaging system may be incorporated into a microscope objective which forms light collected from a sample into a magnified image that is transferred through a relay lens or lens system into the aperture of a video or CCD array camera for providing image data output.
- U.S. Patent No. 5,734,498 to Krasieva et al. likewise discloses an illuminator element for conventional light microscopes consisting of chromophores and/or light-scattering bodies in a stable matrix that completely replaces an infinite set of condensers for an optical microscope and provides illumination fully comparable to Koehler illumination.
- Color contrast filters can also be used to control contrast within black-and-white photographs and the most commonly used color contrast filter is green, because objective aberrations are most effectively compensated near the green wavelength and loss of image clarity due to chromatic aberration is averted or at least improved by a green filter.
- U.S. Patent No. 5,016,173 to Kenet et al. discloses an apparatus and method for in vivo monitoring of visually accessible surfaces of the body and synthesizes methods of systems identification and computer vision to quantify and/or classify features of surface or subsurface anatomic, physiologic, or pathologic structures or processes.
- Anatomic surfaces are stimulated with light (visible, infrared, and/or ultraviolet, structured or uniform), followed by the quantitative analysis of digital images (multiresolution, multiview, and/or multispectral) of reflected or emitted light from the surface of interest.
- US 6,007,996 discloses a method of in situ analysis of a biological sample comprising the steps of (a) staining the biological sample with stains; and (b) using a spectral data collection device for collecting spectral data from the biological sample, the spectral data collection device and the stains are selected such that a spectral component associated with each of the stains is collectable.
- WO 98/5 5026 discloses a method to calibrate fluorescence resonance energy transfer in microscopy involving an orthonormalization procedure.
- UV ultraviolet
- US 5,734,498 discloses an illuminator element-consisting of chromophores, particularly fluorophores, and/or light-scattering bodies in a stable, typically a polymer plastic, matrix.
- US 5,016,173 discloses an apparatus and method for in vivo monitoring of visually accessible surfaces of the body.
- colorimetric analyses of prepared samples are of limited use in the detection and quantification of species of interest due to several factors such as, for example, spectral overlapping, mixing of colors due to spatially overlap of membrane, cytoplasmic, and nuclear markers, chromatic aberrations in the optical path, limited spectral resolution of the acquisition device, calibration particularities, subjectivity of the detection and quantification process, and inconsistencies between human operators.
- the image processing portion of colorimetric analysis techniques has historically been directed to the subj ective detection of contrast within the prepared sample or to a complex and voluminous analysis of the sample at various specific wavelengths of light using a combination of light sources and filters.
- Such a technique should also be capable of providing high quality data, comprising the necessary analysis information about the sample, while reducing subjectivity and inconsistency in the sample analysis.
- the present invention provides a method of determining an amount of at least one molecular specie comprising a sample, each molecular specie being indicated by a dye, in a video-microscopy system, said method comprising: capturing an image of the sample as image data with a broadband color image acquisition device; determining an optical density of the sample from the image data in each of a red, green, and blue channel at a pixel in the image so as to form a corresponding optical density matrix for the pixel; and multiplying the optical density matrix by an inverse of a relative absorption coefficient matrix so as to form a resultant matrix for the pixel, the relative absorption coefficient matrix comprising a relative absorption coefficient for each dye, independently of the sample, in each of the red, green, and blue channels, the resultant matrix comprising the amount of each molecular specie, as indicated by the respective dye, for the pixel.
- the present invention provides a video-microscopy system for determining an amount of at least one molecular specie comprising a sample, each molecular specie being indicated by a dye, from an image of the sample, said system comprising: a broadband color image acquisition device configured so as to be capable of capturing an image of the sample as image data; and a computer device operably engaged with the image acquisition device and comprising: a first processing portion configured to determine an optical density of the sample from the image data in each of a red, green, and blue channel at a pixel in the image so as to form a corresponding optical density matrix for the pixel; and a second processing portion configured to multiply the optical density matrix by an inverse of a relative absorption coefficient matrix so as to form a resultant matrix for the pixel of the image, the relative absorption coefficient matrix comprising a relative absorption coefficient for each dye, independently of the sample, in each of the red, green, and blue channels, the resultant matrix comprising the amount of each molecular specie, as indicated by the respective dye, for
- Such imaging techniques as described herein when particularly adapted to color imaging, allow a substantially real time, or video rate, processing and viewing of the sample.
- a RGB color CCD camera allows acquisition and processing time for sample images to be performed at a video rate, typically 40 millisecond per frame, which provides a considerable advantage as compared to prior art imaging techniques which generally exhibit field of view acquisition and processing times of over 1 second.
- image acquisition through the different channels is performed in parallel and look-up tables (LUT) can be generated so as to map the possible RGB color input values to predetermined concentrations and/or transmittance of each of various dyes.
- LUT look-up tables
- embodiments of the present invention comprise a colorimetric analysis technique for prepared samples that provides effective detection and quantification of species of interest that overcomes limiting factors of prior art techniques such as, for example, spectral overlapping, mixing of colors due to spatially overlap of membrane and nuclear markers, limited spectral resolution of the acquisition device, calibration particularities, the subjectivity of the detection and quantification process, and inconsistencies between human operators of the analysis equipment.
- Embodiments of the present invention further provide an image processing technique which does not rely upon the subjective detection of contrast within the prepared sample or a complex and voluminous analysis of the sample at specific wavelengths of light using a combination of light sources and filters.
- embodiments of the present invention provide a simpler and more effective colorimetric analysis technique that overcomes detection and quantification limitations in prior art analysis techniques, reduces subjectivity and inconsistency in the sample analysis, and is capable of providing the necessary analysis information about the sample, once an image of the sample is captured, without relying upon further examination of the sample to complete the analysis.
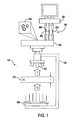
- FIG. 1 a quantitative video-microscopy system, indicated by the numeral 100, according to one embodiment of the present invention.
- the system 100 generally comprises a microscope 150 having a light source 200 and a magnifying objective 250, a camera 300, a computer device 350, and a data transmission link 400 between the camera 300
- FIG. 1 a quantitative video-microscopy system, indicated by the numeral 100, according to one embodiment of the present invention.
- the system 100 generally comprises a microscope 150 having a light source 200 and a magnifying objective 250, a camera 300, a computer device 350, and a data transmission link 400 between the camera 300 and the computer device 350.
- the microscope 150 may comprise, for example, an Axioplan (or Axiovert) microscope produced by ZEISS of Germany or a similar microscope having a bright field light source.
- the camera 300 operably engages the microscope 150 and, in one embodiment, comprises a 3CCD RGB camera such as, for instance, a Model No. DC-330E Dage-MTI RGB 3CCD camera produced by Dage-MTI, Inc. of Michigan City, IN or a similar RGB camera.
- a camera 300 also includes an associated frame grabber (not shown) to facilitate image capture, both the camera 300 and associated frame grabber being referred to herein as the "camera 300" for convenience.
- the camera 300 may be replaced by, for example, a linear flat scanner having a 3CCD chip or equivalent.
- a Model No. Super CoolScan 4000 ED scanner produced by Nikon Corporation may be used for low-resolution imaging.
- the present invention will be described herein in terms of a camera 300 and associated microscope 150. Accordingly, one skilled in the art will understand and appreciate the capabilities and methodologies associated with these different configurations for accomplishing the present invention as detailed herein.
- the camera 300 is generally configured to capture an image 450 of a sample 500 through the magnifying objective 250, wherein the image 450 may further comprise a digital image having corresponding image data (collectively referred to herein as "the image 450").
- the image 450 is generally captured as a whole, wherein the corresponding image data comprises a red channel 550, a green channel 600, and a blue channel 650 image of the field of view.
- the data transmission link 400 is configured so as to be capable of transmitting the image 450 to the computer device 350, wherein the computer device 350 is further configured to be capable of analyzing the image 450 with respect to each of the red 550, green 600, and blue 650 channels.
- the system 100 is configured to analyze the sample in accordance with the Lambert-Beer law.
- the Lambert-Beer law generally describes a proportionality that can be observed between the concentration of molecules in a solution (the concentration of the "molecular specie" or the “sample") and the light intensity measured through the solution.
- the absorption coefficient ⁇ is specific to the molecular specie and is typically expressed in units of L ⁇ mol -1 ⁇ cm -1 .
- This proportionality relationship defined by the Lambert-Beer law has been verified under the several conditions including, for example, monochromatic light illuminating the sample, low molecular concentration within the sample, generally no fluorescence or light response heterogeneity (negligible fluorescence and diffusion) of the sample, and lack of chemical photosensitivity of the sample.
- another requirement for an analysis according to the Lambert-Beer law includes, for instance, correct Koehler illumination of the sample under the microscope. Koehler illumination is available with many modem microscopes, providing an even illumination of the sample in the image plane and allowing for effective contrast control. Koehler illumination is critical for certain processes such as, for example, densitometry analysis.
- Correct Koehler illumination is typically provided by, for example, a two-stage illuminating system for the microscope in which the source is imaged in the aperture of the sub-stage condenser by an auxiliary condenser.
- the sub-stage condenser forms an image of the auxiliary condenser on the object.
- An iris diaphragm may also be placed at each condenser, wherein the first iris controls the area of the object to be illuminated, and the second iris varies the numerical aperture of the illuminating beam.
- This situation may occur, for example, in a biological analysis where a "scene," a field of view, or a portion of the sample has been stained with two dyes consisting of a marker dye for targeting the molecular specie of interest and a counterstain for staining the remainder of the sample.
- the measurements of the optical densities performed at different wavelengths must specifically correspond to the observed portion of the sample. That is, the microscopy system must be corrected for chromatic aberration, wherein such a correction or compensation may be accomplished by hardware, software, or a combination of software and hardware.
- glass tends to disperse light, which typically causes a simple glass lens to, for example, focus blue light at a shorter distance than red light. That is, a simple glass lens will exhibit different focal lengths for light comprising different wavelengths. This dispersion characteristic of glass gives rise to two observed effects.
- longitudinal chromatic aberration or the positional difference of the focal points for different wavelengths of light along the vertical axis, is observed where, upon focusing the image for selected wavelengths of light corresponding to a particular color, the image will tend to be slightly out of focus when viewed under wavelengths of light corresponding to other colors. For example, in an RGB color space, if the image is focused for green wavelengths of light, the same image will tend to be out of focus when viewed under blue or red wavelengths of light.
- lateral chromatic aberration is observed as a difference in magnification for light of different wavelengths due to the different focal lengths thereof. For example, in an RGB color space, an image viewed under relatively short blue light wavelengths will appear larger than the same image viewed under relatively longer red light wavelengths.
- a large portion of the apparent chromatic aberration may be corrected.
- some residual lateral chromatic aberration may still remain, resulting in differences in magnification across wavelengths of light.
- This lateral chromatic aberration may be difficult to visually observe since a human observer tends to concentrate on the center of the field of view where the lateral aberration is typically absent.
- a very small lateral chromatic aberration resulting in, for instance, even less that 1% difference in magnification between wavelengths, will result in slight color shifts about the edges of objects in the field of view, but located away for the optical center of the objective.
- a pixel located at a given (x,y) position on the image may not exactly depict the corresponding portion of the object under investigation depending on the wavelengths of light used to illuminate the object and the location of the object within the field of view.
- a basic premise is that the exact same part of the object in the field of view must be examined. Therefore, images obtained for separate wavelengths of light must be adjusted to provide correlation with respect to the regions of the field of view where chromagen separation equations must be solved.
- one advantageous aspect of the present invention involves a method of correcting lateral chromatic aberration within a microscopy system.
- the coordinates of the center of the magnifying objective 250 are determined with respect to the center of the electronic device or chip comprising the image-producing component of the camera 300.
- An observed magnification factor is then determined for each wavelength and compared to the magnification factor for an arbitrary chosen wavelength.
- the central wavelength namely the green channel 600 would comprise the chosen wavelength to which the magnification factor for each of the red 550 and blue 650 channels would be compared.
- the image for each wavelength is then adjusted according to the determined relative magnification factor and the relative coordinates of the center of the magnifying objective 250.
- a specific calibration slide is used, wherein the slide is configured with a grid of regularly spaced fine holes through a light blocking media.
- An image of the grid is taken at each wavelength of light used to illuminate the sample. For example, an image may be produced for each of the red 550, green 600, and blue 650 channels.
- the center of each hole is then computed in, for instance, x,y coordinates.
- the image corresponding to the wavelength of light nearest to the mean of the wavelengths of light under consideration (the green channel 600, for example) is then designated as the reference image. Subsequently, each of the images for the other wavelength under consideration is then compared to the reference image.
- Equations such as, for example, linear equations that minimize the reconstruction error for ⁇ x as a function of x and ⁇ y as a function of y, are then determined. From these two equations, the center of the objective (x o ,y o ) is determined, where x o comprising the solution of the first equation in x when ⁇ x is 0 and y o comprises the solution of the second equation in y when ⁇ y is 0.
- This image for the particular wavelength is then spatially adjusted such that the origin of the image corresponds to the center of the objective and the magnification of the image corresponds to the magnification of the reference image.
- the additive property of the Lambert-Beer law can be applied to chromagen separation.
- the additive property of the Lambert-Beer law can be expanded to a situation in which the scene is analyzed in a color environment, generated by, for example, an RGB camera, separated into a red, green, and blue channel.
- the marker dye (or "dye 1") exhibits absorption coefficients, ⁇ 1r , ⁇ 1g , and ⁇ 1b , in the red, green and blue channels, respectively.
- the analysis of the image in each of the red, green, and blue channels is equivalent to analyzing a red representation of the image across the red spectra, a green representation of the image across the green spectra, and a blue representation of the image across the blue spectra.
- the counterstain (or "dye 2") exhibits absorption coefficients, ⁇ 2r , ⁇ 2g , and ⁇ 2b , in the red, green and blue channels, respectively.
- OD r ⁇ 1 ⁇ r ⁇ l 1 ⁇ C 1 + ⁇ 2 ⁇ r ⁇ l 2 ⁇ C 2
- OD g ⁇ 1 ⁇ g ⁇ l 1 ⁇ C 1 + ⁇ 2 ⁇ g ⁇ l 2 ⁇ C 2
- OD b ⁇ 1 ⁇ b ⁇ l 1 ⁇ C 1 + ⁇ 2 ⁇ b ⁇ l 2 ⁇ C 2
- OD r , OD g , and OD b represent the optical densities of the sample measured in the red, green and blue channels, respectively.
- OD g ⁇ 1 ⁇ g ⁇ l 1 ⁇ C 1 + ⁇ 2 ⁇ g ⁇ l 2 ⁇ C 2 + ⁇ 3 ⁇ g ⁇ l 3 ⁇ C 3
- OD b ⁇ 1 ⁇ b ⁇ l 1 ⁇ C 1 + ⁇ 2 ⁇ b ⁇ l 2 ⁇ C 2 + ⁇ 3 ⁇ b ⁇ l 3 ⁇ C 3
- the three dyes may comprise, for instance, one marker dye and two counterstains, or two marker dyes and one counterstain, or even three separate marker dyes.
- one particularly advantageous embodiment of the present invention utilizes a fast capture color imaging device such as, for example, a 3CCD RGB camera, for multi-spectral imaging of the markers over three distinct (red, green, and blue) channels.
- a fast capture color imaging device such as, for example, a 3CCD RGB camera
- the exemplary analysis herein is presented in terms of three equations, though one skilled in the art will appreciate that the demonstrated concept may be applied to as many channels as are available with a particular imaging device.
- the concentration C of the molecular specie can be extended and examined as the product of I and C ( l ⁇ C ) and the results treated accordingly.
- the concentration of one dye is being compared to the concentration of another dye in a particular sample, the sample thickness term will be common to both concentrations and thus it becomes less important to determine the sample thickness as an absolute and accurate value. Accordingly, it will be understood by one skilled in the art that an accurate determination of the thickness of the sample is typically not required, but may generally be treated as a constant in examining the equations as detailed herein.
- IOD ⁇ N log I 0 x ⁇ y - log I x ⁇ y
- IOD the integrated optical density of the digital image 450 of the sample 500
- N the number of pixels in the surface image 450 of the sample.
- the logarithmic relationship described in equations (9) and (10) may be expressed in various bases within the scope of the present invention.
- the proportionality constant may be appropriately considered where relative comparisons are drawn in light intensities.
- the proportionality relationship between the optical density OD of the sample and the dye concentrations is conserved.
- the initial intensity I o of the light source 200 which corresponds to 100% transmittance, will preferably be expressed in each of the red 550, green 600, and blue 650 channels as a value approaching 255, representing the brightest possible value in each channel.
- the camera 300 and/or the light source 200 may be adjusted accordingly such that, in the absence of the sample, a pure "white" light will have an intensity value of 255 in each of the red 550, green 600, and blue 650 channels, corresponding to 100% transmittance.
- a "black image” will have an intensity value approaching 0 in each of the red 550, green 600, and blue 650 channels.
- the initial intensity I o of the light source 200 is therefore expressed as the difference between the intensity value measured in presence of the light source 200 minus the intensity value measured in absence of the light source 200 for each of the red 550, green 600, and blue 650 channels. Because the intensity of the light source 200 may vary spatially across the image 450, or over the measured field of view, and because the magnifying objective 250 or other optical components may heterogeneously absorb light, 100% transmittance may be represented by various differential intensities over the measured field of view.
- the optical density OD of the sample is expressed as the logarithm of the ratio of light transmittance in absence of the sample (initial intensity I o ) to light transmittance in presence of the sample (I), the optical density OD is largely spatially insensitive to small variations in the differential intensities over the measured field of view.
- the measurement of the light intensity for any pixel, in the presence of the sample can be translated into the transmittance I at that pixel and in each of the red 550, green 600, and blue 650 channels.
- the optical density OD can be computed. As such, at any location in the field of view 450 where a unique dye is present (as the only light-absorbing object between the light source 200 and the camera 300), the absorption coefficient s of that dye may be determined in each of the red 550, green 600, and blue 650 channels.
- 1 ⁇ C for a given pixel will be equal in each of the red 550, green 600, and blue 650 channels.
- the absorption coefficients ⁇ are computed for each channel according to the ratio of the optical density OD in each channel, measured at a given pixel, to the maximum optical density OD out of all the channels measured at the same pixel.
- the various absorption coefficient ⁇ matrices for particular dyes, as well as the original light intensity I o data for the light source 200 may be stored in, for example, the computer device 350, a server located on an intranet or the Internet, or other data storage device as will be appreciated by one skilled in the art.
- the appropriate equations may be solved as a set of linear equations so as to extract the respective concentrations of the dyes C 1 , C 2 and C 3 .
- a MN ⁇ x N b M
- a x . b
- a ij denotes the element row; while the second index the element column.
- parameters may be established such that the number of equations is greater than or equal to the number of unknowns, or M ⁇ N. As previously discussed, when M > N occurs there is, in general, no particular solution matrix x to equation (21) and the set of equations is over-determined. In such situations, however, the best "compromise" or best fit solution is often the solution that most closely and simultaneously satisfies all of the equations.
- Such closeness may be defined in, for example, a least-squares manner, wherein the sum of the squares of the differences between both sides of equation (21) is minimized.
- the over-determined set of linear equations may typically be reduced to a solvable linear problem, often referred to as a linear least-squares problem, that may be solved with singular value decomposition (SVD) mathematics as will be appreciated by one skilled in the art.
- SVD singular value decomposition
- SVD is directed to the parametric modeling of data and is usually the chosen method for solving linear least-squares problems and is described in further detail in, for example, NUMERICAL RECIPES IN C: THE ART oF SCIENTIFIC COMPUTING (ISBN 0-521-43108-S) Copyright (C) 1988-1992 by Cambridge University Press. Programs Copyright (C) 1988-1992 by Numerical Recipes Software.
- pre-computing solutions for all possible pixel values from the described system configuration may effectively facilitate real time processing of the image analysis. More particularly, if an 8 bit color image acquisition device such as, for example, an 8 bit 3CCD RGB camera is utilized, the measured light intensity I of a sample will have 256 possible values ranging between limits of 0 and 255 in each of the red 550, green 600, and blue 650 channels. In such an instance, all possible gray values (256 3 possible gray values for an 8 bit system) with respect to the original light intensity I o may be pre-computed and stored, for example, as a look-up table (LUT) within the computer device 350.
- LUT look-up table
- the transmitted light intensity I (or the optical density OD) can be measured at a pixel in each of the red 550, green 600, and blue 650 channels and then compared to the previously stored gray values and the absorption coefficient ⁇ matrix for that particular dye to thereby determine the dye concentration C , or an estimate thereof as the product I ⁇ C , at that pixel.
- a system having a gray value resolution exceeding 8 bits per channel will lead to larger LUTs such as, for example, a LUT of>1GB for a system resolution of 10 bits per channel, wherein the computer device 350 may be appropriately configured to provide the necessary computing and/or storage capabilities.
- the corresponding optical density OD matrix (each element being computed as In(I o /I)) thus becomes: OD Red Green Blue Dye 1 0.417 0.697 0.998 Dye 2 0.998 0.056 0.032 Dye 3 0.754 0.998 0.498
- an image 450 of the sample 500 is captured by the camera 300.
- the computer device 350 determines that the transmitted light intensity in each of the red 550, green 600, and blue 650 channels is: Red Green Blue I 89 168 154 where: Red Green Blue I o 255 255 255 Thus: Red Green Blue OD 1.053 0.417 0.504 for the particular pixel.
- an artificial image of the field of view may be generated in an RGB color space or in gray levels as a substantially real time or live image, or as a still image, using combinations of the dyes comprising a marker and/or a counterstain used to prepare the sample. More particularly, an artificial image of the field of view may be produced which shows the sample as affected by all of the dyes, the sample as affected by one or more marker dyes, or the sample as affected by the counterstain.
- the capabilities of the system may be extended such that, for instance, the sample or field of view may be automatically scanned to detect a specific region of interest as identified by the characteristics of a particular dye or to affect or facilitate a task to be performed on that specific region of interest.
- the system may be configured so as to be capable of detecting one or more particular dyes which have been previously characterized by the system.
- a dye may comprise, for example, the ink from a particular pen or similar ink marker that has been characterized by the system as having unique color features, these unique color features being retained by the system as a corresponding set of extinction coefficients.
- the system may be configured to recognize and respond to portions of the field of view in which this dye is identified and that, in some instances, the one or more particular markers may comprise a tangible portion of such a system as described herein.
- such a pen may be used, for example, where an operator such a pathologist or a cytotechnologist identifies special areas of interest on a sample-containing glass or plastic slide.
- a special area of interest may comprise, for example, a potential diagnostic area or a reference area.
- the operator using the pen, may then surround the area with a line of ink from that pen.
- the operator may feed the slides into, for instance, an automatic scanning system for quantitative evaluation. Having been configured to detect the ink from the pen, the system may then inclusively identify the area of interest, corresponding to the area within the ink line, circled by the operator with the pen.
- the system may thereafter appropriately process that area of the slide where, for example, one color of pen ink may indicate that a particular diagnostic evaluation must be performed, while another color of ink may indicate that the area contains a calibration or reference material and would call for the system to run a corresponding calibration procedure.
- one color of pen ink may indicate that a particular diagnostic evaluation must be performed
- another color of ink may indicate that the area contains a calibration or reference material and would call for the system to run a corresponding calibration procedure.
- the described technique may be readily adapted to examine other mounting forms for microscopic material such as, for example, microtiter plates or microarrays.
- the artificial images of the field of view may also facilitate the presentation of the data in a configuration allowing identification and selection of meaningful objects or areas of interest as, for example, still images in a report prepared for diagnostic or other reporting purposes.
- the differences in characteristics between the marker dyes and the counterstain, as realized in various dye-specific images of the sample may be used to evaluate the focus adequacy of the field of view.
- the sample may be treated with two separate dyes, one dye comprising a nuclei stain and the other dye comprising a membrane stain.
- an image directed to the membrane stain may be evaluated for focus adequacy by examining the focus of the same image directed to the nuclei stain, wherein the nuclei stain image exhibits a more definite structure upon which evaluate focus.
- the artificial image of the field of view may also be used to facilitate the identification and extraction of selected features of the treated sample.
- marked point processes, contextual analysis, and/or geo-statistics may be used to identify and extract features from the image based on, for instance, a spatial distribution analysis of a particular dye.
- Such a feature extraction capability would also allow, for example, fields of view or objects of interest to be sorted, flagged, or otherwise identified or grouped based on, for instance, the overall content of a given marker dye or a selected ratio of particular marker.
- a threshold criteria can be established, such a capability would be the detection of rare, worsening, or other serious events.
- classifiers based specifically on the image processing resulting from the counterstain and/or marker dye specific images may then be established and used to evaluate the presence of certain cell types or to perform a diagnosis based upon the field of view.
- HER2 may be evaluated in this manner by comparison to a continuous diagnosis scale established according to the system and methods described herein.
- Such classifiers may usually also encompass other informative features such as, for example, detail based upon the morphology or the texture of the cells.
- the system is capable of processing the image data at a faster rate than the images are acquired.
- the enhanced speed at which the image data is processed may allow, for example, features indicated by a particular marker dye to be processed and classified. Accordingly, various conditions may be identified based upon predetermined criteria. As such, visual and/or sonic alarms may be established and/or mapped in conjunction with the processing of the image data.
- the operator's attention may be directed to a specific field of view or object of interest when a characteristic of a marker attains a predetermined level in, for example, intensity or presence in a particular field.
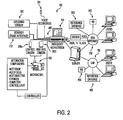
- FIG. 2 is a schematic representation of a practical realization of an extended system configuration according to one embodiment of the present invention.
- the system 100 or workstation is centered about a microscope 150.
- the microscope 150 may include one or more robotic components including, for example, a motorized stage, an automatic focus mechanism, a motorized objective changer, and an automatic light intensity adjustment.
- the system 100 may also include various input devices such as, for instances, cameras 300a and 300b having fast automatic focusing and configured for acquiring low-resolution and high-resolution images, a flat bed linear scanners 310 used for acquiring low-resolution images, a grossing station 320, and a voice-recording device 330, which are all linked to a computer device 350 through various data transmission links 400.
- the workstation 100 can be part of a Local Area Network (LAN) 700, but may also be configured to support different communication protocols such that available communication channels such as, for example, a standard telephone line, an ISDN connection, or a T1 line, can readily connect the workstation 100 to other components or devices over large distances via a Wide Area Network (WAN) 750 as will be appreciated by one skilled in the art.
- LAN Local Area Network
- WAN Wide Area Network
- the pathology workstation 100 is configured to operate in an integrated environment, the WAN 700 or LAN 750 connection may permit access to, for instance, existing reference databases 800 and Hospital Information Systems (HIS) 850.
- HIS Hospital Information Systems
- new samples and/or cases may readily be compared with the pictures and accompanying information of previously-accumulated reference cases.
- images acquired from the samples and/or slides being examined at the workstation 100 can be complemented with the patient and case history as necessary.
- the pathology workstation 100 is particularly configured for a comprehensive sample evaluation. For example, with information and digital pictures of the initial gross biological sample, images of the slides prepared from the sample can be prepared and processed as described herein. The patient and case information, the images, and the resulting quantitative information about the cell components of the sample and the sample architecture (in the case of, for instance, tissue samples) can collected, integrated if necessary, and stored in a single database. If, for example, an initial or second expert opinion is needed or if the slide is used for training or proficiency testing, the communication capabilities of the extended configuration along with the automation features of the microscope 150 may allow the workstation 100 to be used as a tele-pathology system.
- high-resolution images directed to features or objects of interest characterizing a questionable situation on a particular slide may be electronically forwarded to the expert and/or to the audited candidate.
- an overview picture of the slide may be provided, wherein the automated microscope 150 is used to scan the slide automatically on, for example, a field by field basis.
- the corresponding digital images may then be stored in the memory of the computer device 350.
- a field by field basis is used, the edges of adjacent fields may be precisely matched using correlation algorithms, so as to provide a single large overview image of the entire slide.
- Such an overview image may assist the reference pathologist in making an assessment of the information.
- the reference pathologist may remotely control the workstation 100 from a remote site to acquire necessary and/or supplemental images which may be required so as to provide a correct and thorough assessment of the slide.
- the information accumulated by the workstation 100 for a studied case such as, for instance, real or mathematically generated images, measurement results and graphical representations thereof, patient data, preparation data, and screening maps, may be selectively integrated into a report which can either be printed or accessed electronically.
- a report would provide a comprehensive picture of the case under evaluation and would also facilitate quality assurance and standardization issues.
- embodiments of the present invention comprise a colorimetric analysis technique for prepared samples that provides effective detection and quantification of species of interest that overcomes limiting factors of prior art techniques such as, for example, spectral overlapping, mixing of colors due to spatial overlap of membrane and nuclear markers, limited spectral resolution of the acquisition device, calibration particularities, the subjectivity of the detection and quantification process, and inconsistencies between human operators of the analysis equipment.
- Embodiments of the present invention further provide an image processing technique which does not rely upon the subjective detection of contrast within the prepared sample or a complex and voluminous analysis of the sample at specific wavelengths of light using a combination of light sources and filters.
- embodiments of the present invention provide a simpler and more effective colorimetric analysis technique that overcomes detection and quantification limitations in prior art analysis techniques, reduces subjectivity and inconsistency in the sample analysis, and is capable of providing the necessary analysis information about the sample, once an image of the sample is captured, without relying upon further examination of the sample to complete the analysis.
- the analysis (detection and quantification of a molecular specie of interest) of the prepared sample is accomplished through the measurement of light intensities that are manifested in a digital image of the sample captured by a color image acquisition device. Since the analysis is relatively image-dependent, rather than sample-dependent, redundant images may be captured for analysis, while many samples may be processed so as to capture the necessary images within a relatively short period of time. Once the image data has been captured and stored, the actual analysis may occur at a later time or as needed without requiring the physical presence of the actual sample. Such an analysis may be further applied to examining the entire sample or even the entire slide.
- embodiments of the present invention provide an expeditious quantitative video-microscopy system that permits the use of such a system as a routine or "production” tool capable of accomplishing a relatively high analysis throughput.
- significant advantages are realized by embodiments of the present invention as compared to prior art quantitative microscopy systems which were typically limited in sample throughput and analysis, thus generally making such systems more useful as research tools.
Landscapes
- Physics & Mathematics (AREA)
- Engineering & Computer Science (AREA)
- General Physics & Mathematics (AREA)
- Theoretical Computer Science (AREA)
- Life Sciences & Earth Sciences (AREA)
- General Health & Medical Sciences (AREA)
- Health & Medical Sciences (AREA)
- Mathematical Physics (AREA)
- Biochemistry (AREA)
- Computer Vision & Pattern Recognition (AREA)
- Molecular Biology (AREA)
- Multimedia (AREA)
- Geometry (AREA)
- Spectroscopy & Molecular Physics (AREA)
- Chemical & Material Sciences (AREA)
- Analytical Chemistry (AREA)
- Biomedical Technology (AREA)
- Immunology (AREA)
- Pathology (AREA)
- Investigating Or Analysing Materials By Optical Means (AREA)
- Microscoopes, Condenser (AREA)
- Image Analysis (AREA)
- Spectrometry And Color Measurement (AREA)
- Investigating, Analyzing Materials By Fluorescence Or Luminescence (AREA)
- Investigating Or Analysing Biological Materials (AREA)
- Closed-Circuit Television Systems (AREA)
Applications Claiming Priority (3)
| Application Number | Priority Date | Filing Date | Title |
|---|---|---|---|
| US957446 | 2001-09-19 | ||
| US09/957,446 US7065236B2 (en) | 2001-09-19 | 2001-09-19 | Method for quantitative video-microscopy and associated system and computer software program product |
| PCT/US2002/029567 WO2003025554A2 (en) | 2001-09-19 | 2002-09-18 | Method quantitative video-microscopy and associated system and computer software program product |
Publications (2)
| Publication Number | Publication Date |
|---|---|
| EP1428016A2 EP1428016A2 (en) | 2004-06-16 |
| EP1428016B1 true EP1428016B1 (en) | 2008-04-09 |
Family
ID=25499583
Family Applications (1)
| Application Number | Title | Priority Date | Filing Date |
|---|---|---|---|
| EP02798993A Expired - Lifetime EP1428016B1 (en) | 2001-09-19 | 2002-09-18 | Method of quantitative video-microscopy and associated system and computer software program product |
Country Status (9)
Families Citing this family (44)
| Publication number | Priority date | Publication date | Assignee | Title |
|---|---|---|---|---|
| US20060073509A1 (en) * | 1999-11-18 | 2006-04-06 | Michael Kilpatrick | Method for detecting and quantitating multiple subcellular components |
| AU2002322033A1 (en) * | 2001-06-04 | 2002-12-16 | Ikonisys Inc. | Method for detecting infectious agents using computer controlled automated image analysis |
| US20030097424A1 (en) * | 2001-09-26 | 2003-05-22 | Jean-Christophe Pautrat | Method to construct a technology roadmap |
| US7133547B2 (en) * | 2002-01-24 | 2006-11-07 | Tripath Imaging, Inc. | Method for quantitative video-microscopy and associated system and computer software program product |
| US20030210262A1 (en) | 2002-05-10 | 2003-11-13 | Tripath Imaging, Inc. | Video microscopy system and multi-view virtual slide viewer capable of simultaneously acquiring and displaying various digital views of an area of interest located on a microscopic slide |
| US7200252B2 (en) | 2002-10-28 | 2007-04-03 | Ventana Medical Systems, Inc. | Color space transformations for use in identifying objects of interest in biological specimens |
| US8712118B2 (en) * | 2003-04-10 | 2014-04-29 | Carl Zeiss Microimaging Gmbh | Automated measurement of concentration and/or amount in a biological sample |
| US8442280B2 (en) * | 2004-01-21 | 2013-05-14 | Edda Technology, Inc. | Method and system for intelligent qualitative and quantitative analysis of digital radiography softcopy reading |
| DE102004008675B4 (de) * | 2004-02-20 | 2009-05-07 | Imedos Gmbh | Bildgebendes Verfahren zur Erfassung medizinisch relevanter Unterschiede von Strukturen und Eigenschaften eines Untersuchungsobjektes und dazu geeignete Vorrichtung |
| US7450754B2 (en) * | 2004-03-23 | 2008-11-11 | Microsoft Corporation | Radiometric calibration from a single image |
| CA2567749C (en) | 2004-05-26 | 2013-07-23 | Anima Cell Metrology | Methods for evaluating ribonucleotide sequences |
| US7511812B2 (en) * | 2004-06-21 | 2009-03-31 | Koninklijke Philips Electronics N.V. | Aberration correction for spectroscopic analysis |
| CA2855973C (en) * | 2004-08-06 | 2017-05-16 | Compucyte Corporation | Multiple-color monochromatic light absorption and quantification of light absorption in a stained sample |
| US20060133657A1 (en) * | 2004-08-18 | 2006-06-22 | Tripath Imaging, Inc. | Microscopy system having automatic and interactive modes for forming a magnified mosaic image and associated method |
| US20060041385A1 (en) * | 2004-08-18 | 2006-02-23 | Bauer Kenneth D | Method of quantitating proteins and genes in cells using a combination of immunohistochemistry and in situ hybridization |
| AU2005289728B2 (en) * | 2004-09-22 | 2011-11-24 | Tripath Imaging, Inc. | Methods and compositions for evaluating breast cancer prognosis |
| US8084260B2 (en) * | 2004-11-24 | 2011-12-27 | Applied Biosystems, Llc | Spectral calibration method and system for multiple instruments |
| US20060178833A1 (en) * | 2005-02-04 | 2006-08-10 | Bauer Kenneth D | System for and method of providing diagnostic information through microscopic imaging |
| KR20080016847A (ko) | 2005-05-13 | 2008-02-22 | 트리패스 이미징, 인코포레이티드 | 크로모겐 분리에 기초한 영상 분석 방법 |
| JP4976387B2 (ja) * | 2005-06-13 | 2012-07-18 | トライパス イメージング インコーポレイテッド | 顕微鏡画像取得装置を用いた、スライド上のサンプル中の対象物の位置を再検索するためのシステムおよび方法 |
| US7417213B2 (en) * | 2005-06-22 | 2008-08-26 | Tripath Imaging, Inc. | Apparatus and method for rapid microscopic image focusing having a movable objective |
| US20070091109A1 (en) * | 2005-09-13 | 2007-04-26 | Roscoe Atkinson | Image quality |
| US20120157350A1 (en) * | 2005-09-13 | 2012-06-21 | Affymetrix, Inc. | Brownian Microbarcodes for Bioassays |
| JP4915071B2 (ja) * | 2005-09-22 | 2012-04-11 | 株式会社ニコン | 顕微鏡、およびバーチャルスライド作成システム |
| CN101688247A (zh) * | 2007-05-01 | 2010-03-31 | 希尔氏宠物营养品公司 | 猫科动物骨关节炎的诊断方法和组合物 |
| CA2702007C (en) | 2007-10-09 | 2017-03-21 | Anima Cell Metrology, Inc. | Systems and methods for measuring translation activity in viable cells |
| DE102007054602A1 (de) * | 2007-11-15 | 2009-05-28 | Deutsches Zentrum für Luft- und Raumfahrt e.V. | Verfahren und Messaufbau zum Erfassen der Verteilung mindestens einer Zustandsgröße in einem Messfeld mit verschiedenen Sonden |
| DE102008060379A1 (de) * | 2008-12-03 | 2010-06-10 | Krones Ag | Befüllvorrichtung |
| US9034576B2 (en) | 2009-09-24 | 2015-05-19 | Anima Cell Metrology Inc. | Systems and methods for measuring translation of target proteins in cells |
| EP2697737B1 (en) * | 2011-04-12 | 2019-07-31 | Tripath Imaging, Inc. | Method for optimization of quantitative video-microscopy and associated system |
| AU2012242996B2 (en) * | 2011-04-12 | 2015-08-13 | Tripath Imaging, Inc. | Method for preparing quantitative video-microscopy and associated system |
| BE1019985A3 (nl) * | 2011-05-23 | 2013-03-05 | Willy Boermans | Chemie doen met behulp van kleurensensoren. |
| ES2613477T3 (es) * | 2011-11-08 | 2017-05-24 | Dako Denmark A/S | Nuevo método para la evaluación de una diana en una muestra histológica |
| US8928781B2 (en) | 2011-11-30 | 2015-01-06 | Microsoft Corporation | Response function determination by rank minimization |
| JP2013170861A (ja) * | 2012-02-20 | 2013-09-02 | Dainippon Screen Mfg Co Ltd | 撮像装置、試料保持プレートおよび撮像方法 |
| WO2015114121A1 (en) | 2014-01-30 | 2015-08-06 | Bd Kiestra B.V | A system and method for image acquisition using supervised high quality imaging |
| JP2016052116A (ja) * | 2014-08-28 | 2016-04-11 | パナソニックIpマネジメント株式会社 | 画像処理装置、画像処理方法およびコンピュータプログラム |
| CN104655572B (zh) * | 2015-01-09 | 2017-07-21 | 上海绿帝环保科技有限公司 | 溶液显色反应定量分析检测装置 |
| JP6101746B2 (ja) * | 2015-06-25 | 2017-03-22 | 株式会社Screenホールディングス | 試料保持プレート、撮像装置および撮像方法 |
| JP6317003B2 (ja) * | 2017-02-27 | 2018-04-25 | 株式会社Screenホールディングス | 撮像装置および撮像方法 |
| US9738937B1 (en) | 2017-03-31 | 2017-08-22 | Cellmax, Ltd. | Identifying candidate cells using image analysis |
| CN114787607A (zh) * | 2019-06-20 | 2022-07-22 | Essenlix 公司 | 改善的光透射样品保持器和多波长分析 |
| EP4144085A4 (en) | 2020-04-30 | 2023-10-25 | Siemens Healthcare Diagnostics, Inc. | APPARATUS, METHOD FOR CALIBRATING AN APPARATUS AND ASSOCIATED DEVICE |
| CN117437235B (zh) * | 2023-12-21 | 2024-03-12 | 四川新康意众申新材料有限公司 | 基于图像处理的塑料薄膜质量检测方法 |
Family Cites Families (30)
| Publication number | Priority date | Publication date | Assignee | Title |
|---|---|---|---|---|
| US615105A (en) * | 1898-11-29 | Lifting jack | ||
| US4191940A (en) | 1978-01-09 | 1980-03-04 | Environmental Research Institute Of Michigan | Method and apparatus for analyzing microscopic specimens and the like |
| JPS5742286A (en) * | 1980-08-27 | 1982-03-09 | Hitachi Denshi Ltd | Compensation method for positional shift amount of video signal |
| DK282085D0 (da) * | 1985-06-21 | 1985-06-21 | Radiometer As | Fremgangsmaade og apparat til bestemmelse af blodkomponenter |
| US4741043B1 (en) | 1985-11-04 | 1994-08-09 | Cell Analysis Systems Inc | Method of and apparatus for image analyses of biological specimens |
| US5134662A (en) | 1985-11-04 | 1992-07-28 | Cell Analysis Systems, Inc. | Dual color camera microscope and methodology for cell staining and analysis |
| US5008185A (en) | 1985-11-04 | 1991-04-16 | Cell Analysis Systems, Inc. | Methods and apparatus for the quantitation of nuclear proteins |
| US5109429A (en) | 1985-11-04 | 1992-04-28 | Cell Analysis Systems,Inc. | Apparatus and method for analyses of biological specimens |
| US4998284A (en) | 1987-11-17 | 1991-03-05 | Cell Analysis Systems, Inc. | Dual color camera microscope and methodology for cell staining and analysis |
| US5121436A (en) | 1987-08-14 | 1992-06-09 | International Remote Imaging Systems, Inc. | Method and apparatus for generating a plurality of parameters of an object in a field of view |
| US5202931A (en) | 1987-10-06 | 1993-04-13 | Cell Analysis Systems, Inc. | Methods and apparatus for the quantitation of nuclear protein |
| US5016173A (en) | 1989-04-13 | 1991-05-14 | Vanguard Imaging Ltd. | Apparatus and method for monitoring visually accessible surfaces of the body |
| US5784162A (en) * | 1993-08-18 | 1998-07-21 | Applied Spectral Imaging Ltd. | Spectral bio-imaging methods for biological research, medical diagnostics and therapy |
| JPH0678314A (ja) * | 1992-08-27 | 1994-03-18 | Hitachi Denshi Ltd | 顕微鏡用テレビジョンカメラシステム |
| US5734498A (en) * | 1994-05-09 | 1998-03-31 | The Regents Of The University Of California | Illuminator elements for conventional light microscopes |
| US5625705A (en) | 1994-06-03 | 1997-04-29 | Neuromedical Systems, Inc. | Intensity texture based classification system and method |
| JP3556283B2 (ja) * | 1994-09-30 | 2004-08-18 | オリンパス株式会社 | 顕微鏡用照明光学系 |
| US5732150A (en) | 1995-09-19 | 1998-03-24 | Ihc Health Services, Inc. | Method and system for multiple wavelength microscopy image analysis |
| US6151405A (en) | 1996-11-27 | 2000-11-21 | Chromavision Medical Systems, Inc. | System and method for cellular specimen grading |
| GB2309368B (en) * | 1996-01-18 | 1999-09-15 | Hamamatsu Photonics Kk | An optical computer tomographic apparatus and image reconstruction method using optical computer tomography |
| JP3039388B2 (ja) * | 1996-03-22 | 2000-05-08 | 株式会社ニコン | 極低倍用第1対物レンズを備えた顕微鏡 |
| US5717518A (en) | 1996-07-22 | 1998-02-10 | Kla Instruments Corporation | Broad spectrum ultraviolet catadioptric imaging system |
| US6031930A (en) | 1996-08-23 | 2000-02-29 | Bacus Research Laboratories, Inc. | Method and apparatus for testing a progression of neoplasia including cancer chemoprevention testing |
| EP0987985A4 (en) * | 1997-06-05 | 2009-04-29 | Kairos Scient Inc | CALIBRATION OF RESONANCE ENERGY TRANSFER BY FLUORESCENCE IN MICROSCOPY |
| JP2000010012A (ja) * | 1998-06-19 | 2000-01-14 | Olympus Optical Co Ltd | 顕微鏡照明光学系 |
| JP4285807B2 (ja) * | 1998-09-22 | 2009-06-24 | オリンパス株式会社 | 落射蛍光顕微鏡 |
| JP2000310735A (ja) * | 1999-04-28 | 2000-11-07 | Olympus Optical Co Ltd | 共焦点顕微鏡 |
| US6453060B1 (en) | 1999-06-29 | 2002-09-17 | Tri Path Imaging, Inc. | Method and apparatus for deriving separate images from multiple chromogens in a branched image analysis system |
| GB9930156D0 (en) | 1999-12-22 | 2000-02-09 | Secr Defence | Optical system interface |
| EP1417632A1 (en) | 2001-05-29 | 2004-05-12 | Tissueinformatics, Inc. | Robust stain detection and quantification for histological specimens based on a physical model for stain absorption |
-
2001
- 2001-09-19 US US09/957,446 patent/US7065236B2/en not_active Expired - Lifetime
-
2002
- 2002-09-18 AU AU2002334590A patent/AU2002334590B2/en not_active Expired
- 2002-09-18 CA CA2460801A patent/CA2460801C/en not_active Expired - Lifetime
- 2002-09-18 AT AT02798993T patent/ATE391907T1/de active
- 2002-09-18 WO PCT/US2002/029567 patent/WO2003025554A2/en active Application Filing
- 2002-09-18 DE DE60226043T patent/DE60226043T2/de not_active Expired - Lifetime
- 2002-09-18 ES ES02798993T patent/ES2301706T3/es not_active Expired - Lifetime
- 2002-09-18 EP EP02798993A patent/EP1428016B1/en not_active Expired - Lifetime
- 2002-09-18 JP JP2003529133A patent/JP4550415B2/ja not_active Expired - Lifetime
-
2009
- 2009-12-01 JP JP2009273163A patent/JP5044633B2/ja not_active Expired - Lifetime
Also Published As
| Publication number | Publication date |
|---|---|
| AU2002334590B2 (en) | 2008-01-10 |
| CA2460801C (en) | 2011-08-23 |
| US20030091221A1 (en) | 2003-05-15 |
| ES2301706T3 (es) | 2008-07-01 |
| US7065236B2 (en) | 2006-06-20 |
| DE60226043T2 (de) | 2009-05-14 |
| WO2003025554A2 (en) | 2003-03-27 |
| JP4550415B2 (ja) | 2010-09-22 |
| JP2005504276A (ja) | 2005-02-10 |
| JP2010078611A (ja) | 2010-04-08 |
| EP1428016A2 (en) | 2004-06-16 |
| CA2460801A1 (en) | 2003-03-27 |
| ATE391907T1 (de) | 2008-04-15 |
| JP5044633B2 (ja) | 2012-10-10 |
| WO2003025554A3 (en) | 2003-08-21 |
| DE60226043D1 (de) | 2008-05-21 |
Similar Documents
| Publication | Publication Date | Title |
|---|---|---|
| EP1428016B1 (en) | Method of quantitative video-microscopy and associated system and computer software program product | |
| EP1470411B1 (en) | Method for quantitative video-microscopy and associated system and computer software program product | |
| AU2002334590A1 (en) | Method quantitative video-microscopy and associated system and computer software program product | |
| AU2003248207B2 (en) | Color Space Transformations for Use in Identifying Objects of Interest in Biological Specimens | |
| AU2003236675A1 (en) | Method for quantitative video-microscopy and associated system and computer software program product | |
| CN101176116B (zh) | 基于色原分离的图像分析方法 | |
| US9275441B2 (en) | Method for preparing quantitative video-microscopy and associated system | |
| US9122904B2 (en) | Method for optimization of quantitative video-microscopy and associated system | |
| AU2007249081B2 (en) | Method quantitative video-microscopy and associated system and computer software program product |
Legal Events
| Date | Code | Title | Description |
|---|---|---|---|
| PUAI | Public reference made under article 153(3) epc to a published international application that has entered the european phase |
Free format text: ORIGINAL CODE: 0009012 |
|
| 17P | Request for examination filed |
Effective date: 20040406 |
|
| AK | Designated contracting states |
Kind code of ref document: A2 Designated state(s): AT BE BG CH CY CZ DE DK EE ES FI FR GB GR IE IT LI LU MC NL PT SE SK TR |
|
| AX | Request for extension of the european patent |
Extension state: AL LT LV MK RO SI |
|
| 17Q | First examination report despatched |
Effective date: 20070123 |
|
| GRAP | Despatch of communication of intention to grant a patent |
Free format text: ORIGINAL CODE: EPIDOSNIGR1 |
|
| RTI1 | Title (correction) |
Free format text: METHOD OF QUANTITATIVE VIDEO-MICROSCOPY AND ASSOCIATED SYSTEM AND COMPUTER SOFTWARE PROGRAM PRODUCT |
|
| GRAS | Grant fee paid |
Free format text: ORIGINAL CODE: EPIDOSNIGR3 |
|
| GRAA | (expected) grant |
Free format text: ORIGINAL CODE: 0009210 |
|
| AK | Designated contracting states |
Kind code of ref document: B1 Designated state(s): AT BE BG CH CY CZ DE DK EE ES FI FR GB GR IE IT LI LU MC NL PT SE SK TR |
|
| REG | Reference to a national code |
Ref country code: GB Ref legal event code: FG4D |
|
| REG | Reference to a national code |
Ref country code: CH Ref legal event code: EP |
|
| REG | Reference to a national code |
Ref country code: IE Ref legal event code: FG4D |
|
| REF | Corresponds to: |
Ref document number: 60226043 Country of ref document: DE Date of ref document: 20080521 Kind code of ref document: P |
|
| REG | Reference to a national code |
Ref country code: SE Ref legal event code: TRGR Ref country code: ES Ref legal event code: FG2A Ref document number: 2301706 Country of ref document: ES Kind code of ref document: T3 |
|
| PG25 | Lapsed in a contracting state [announced via postgrant information from national office to epo] |
Ref country code: PT Free format text: LAPSE BECAUSE OF FAILURE TO SUBMIT A TRANSLATION OF THE DESCRIPTION OR TO PAY THE FEE WITHIN THE PRESCRIBED TIME-LIMIT Effective date: 20080909 Ref country code: FI Free format text: LAPSE BECAUSE OF FAILURE TO SUBMIT A TRANSLATION OF THE DESCRIPTION OR TO PAY THE FEE WITHIN THE PRESCRIBED TIME-LIMIT Effective date: 20080409 Ref country code: BG Free format text: LAPSE BECAUSE OF FAILURE TO SUBMIT A TRANSLATION OF THE DESCRIPTION OR TO PAY THE FEE WITHIN THE PRESCRIBED TIME-LIMIT Effective date: 20080709 |
|
| ET | Fr: translation filed | ||
| PG25 | Lapsed in a contracting state [announced via postgrant information from national office to epo] |
Ref country code: DK Free format text: LAPSE BECAUSE OF FAILURE TO SUBMIT A TRANSLATION OF THE DESCRIPTION OR TO PAY THE FEE WITHIN THE PRESCRIBED TIME-LIMIT Effective date: 20080409 Ref country code: CZ Free format text: LAPSE BECAUSE OF FAILURE TO SUBMIT A TRANSLATION OF THE DESCRIPTION OR TO PAY THE FEE WITHIN THE PRESCRIBED TIME-LIMIT Effective date: 20080409 |
|
| PLBE | No opposition filed within time limit |
Free format text: ORIGINAL CODE: 0009261 |
|
| STAA | Information on the status of an ep patent application or granted ep patent |
Free format text: STATUS: NO OPPOSITION FILED WITHIN TIME LIMIT |
|
| PG25 | Lapsed in a contracting state [announced via postgrant information from national office to epo] |
Ref country code: SK Free format text: LAPSE BECAUSE OF FAILURE TO SUBMIT A TRANSLATION OF THE DESCRIPTION OR TO PAY THE FEE WITHIN THE PRESCRIBED TIME-LIMIT Effective date: 20080409 |
|
| 26N | No opposition filed |
Effective date: 20090112 |
|
| PG25 | Lapsed in a contracting state [announced via postgrant information from national office to epo] |
Ref country code: MC Free format text: LAPSE BECAUSE OF NON-PAYMENT OF DUE FEES Effective date: 20080930 Ref country code: EE Free format text: LAPSE BECAUSE OF FAILURE TO SUBMIT A TRANSLATION OF THE DESCRIPTION OR TO PAY THE FEE WITHIN THE PRESCRIBED TIME-LIMIT Effective date: 20080409 |
|
| REG | Reference to a national code |
Ref country code: CH Ref legal event code: PL |
|
| PG25 | Lapsed in a contracting state [announced via postgrant information from national office to epo] |
Ref country code: IE Free format text: LAPSE BECAUSE OF NON-PAYMENT OF DUE FEES Effective date: 20080918 |
|
| PG25 | Lapsed in a contracting state [announced via postgrant information from national office to epo] |
Ref country code: CY Free format text: LAPSE BECAUSE OF FAILURE TO SUBMIT A TRANSLATION OF THE DESCRIPTION OR TO PAY THE FEE WITHIN THE PRESCRIBED TIME-LIMIT Effective date: 20080409 |
|
| PG25 | Lapsed in a contracting state [announced via postgrant information from national office to epo] |
Ref country code: LI Free format text: LAPSE BECAUSE OF NON-PAYMENT OF DUE FEES Effective date: 20080930 Ref country code: CH Free format text: LAPSE BECAUSE OF NON-PAYMENT OF DUE FEES Effective date: 20080930 |
|
| PG25 | Lapsed in a contracting state [announced via postgrant information from national office to epo] |
Ref country code: LU Free format text: LAPSE BECAUSE OF NON-PAYMENT OF DUE FEES Effective date: 20080918 |
|
| PG25 | Lapsed in a contracting state [announced via postgrant information from national office to epo] |
Ref country code: TR Free format text: LAPSE BECAUSE OF FAILURE TO SUBMIT A TRANSLATION OF THE DESCRIPTION OR TO PAY THE FEE WITHIN THE PRESCRIBED TIME-LIMIT Effective date: 20080409 |
|
| PGFP | Annual fee paid to national office [announced via postgrant information from national office to epo] |
Ref country code: ES Payment date: 20100927 Year of fee payment: 9 |
|
| PGFP | Annual fee paid to national office [announced via postgrant information from national office to epo] |
Ref country code: AT Payment date: 20100901 Year of fee payment: 9 |
|
| PGFP | Annual fee paid to national office [announced via postgrant information from national office to epo] |
Ref country code: SE Payment date: 20100929 Year of fee payment: 9 |
|
| PG25 | Lapsed in a contracting state [announced via postgrant information from national office to epo] |
Ref country code: GR Free format text: LAPSE BECAUSE OF NON-PAYMENT OF DUE FEES Effective date: 20080930 |
|
| REG | Reference to a national code |
Ref country code: SE Ref legal event code: EUG |
|
| REG | Reference to a national code |
Ref country code: AT Ref legal event code: MM01 Ref document number: 391907 Country of ref document: AT Kind code of ref document: T Effective date: 20110918 |
|
| PG25 | Lapsed in a contracting state [announced via postgrant information from national office to epo] |
Ref country code: AT Free format text: LAPSE BECAUSE OF NON-PAYMENT OF DUE FEES Effective date: 20110918 |
|
| REG | Reference to a national code |
Ref country code: ES Ref legal event code: FD2A Effective date: 20130417 |
|
| PG25 | Lapsed in a contracting state [announced via postgrant information from national office to epo] |
Ref country code: SE Free format text: LAPSE BECAUSE OF NON-PAYMENT OF DUE FEES Effective date: 20110919 Ref country code: ES Free format text: LAPSE BECAUSE OF NON-PAYMENT OF DUE FEES Effective date: 20110919 |
|
| REG | Reference to a national code |
Ref country code: FR Ref legal event code: PLFP Year of fee payment: 15 |
|
| REG | Reference to a national code |
Ref country code: FR Ref legal event code: PLFP Year of fee payment: 16 |
|
| REG | Reference to a national code |
Ref country code: FR Ref legal event code: PLFP Year of fee payment: 17 |
|
| PGFP | Annual fee paid to national office [announced via postgrant information from national office to epo] |
Ref country code: NL Payment date: 20210818 Year of fee payment: 20 |
|
| PGFP | Annual fee paid to national office [announced via postgrant information from national office to epo] |
Ref country code: IT Payment date: 20210824 Year of fee payment: 20 Ref country code: FR Payment date: 20210819 Year of fee payment: 20 |
|
| PGFP | Annual fee paid to national office [announced via postgrant information from national office to epo] |
Ref country code: BE Payment date: 20210820 Year of fee payment: 20 Ref country code: DE Payment date: 20210818 Year of fee payment: 20 Ref country code: GB Payment date: 20210820 Year of fee payment: 20 |
|
| REG | Reference to a national code |
Ref country code: DE Ref legal event code: R071 Ref document number: 60226043 Country of ref document: DE |
|
| REG | Reference to a national code |
Ref country code: NL Ref legal event code: MK Effective date: 20220917 |
|
| REG | Reference to a national code |
Ref country code: BE Ref legal event code: MK Effective date: 20220918 |
|
| REG | Reference to a national code |
Ref country code: GB Ref legal event code: PE20 Expiry date: 20220917 |
|
| PG25 | Lapsed in a contracting state [announced via postgrant information from national office to epo] |
Ref country code: GB Free format text: LAPSE BECAUSE OF EXPIRATION OF PROTECTION Effective date: 20220917 |