EP1153299B1 - Procede et dispositif de dosage chimique et biochimique - Google Patents
Procede et dispositif de dosage chimique et biochimique Download PDFInfo
- Publication number
- EP1153299B1 EP1153299B1 EP00903860A EP00903860A EP1153299B1 EP 1153299 B1 EP1153299 B1 EP 1153299B1 EP 00903860 A EP00903860 A EP 00903860A EP 00903860 A EP00903860 A EP 00903860A EP 1153299 B1 EP1153299 B1 EP 1153299B1
- Authority
- EP
- European Patent Office
- Prior art keywords
- solution
- component
- bead
- amount
- beads
- Prior art date
- Legal status (The legal status is an assumption and is not a legal conclusion. Google has not performed a legal analysis and makes no representation as to the accuracy of the status listed.)
- Expired - Lifetime
Links
Images


Classifications
-
- G—PHYSICS
- G01—MEASURING; TESTING
- G01N—INVESTIGATING OR ANALYSING MATERIALS BY DETERMINING THEIR CHEMICAL OR PHYSICAL PROPERTIES
- G01N21/00—Investigating or analysing materials by the use of optical means, i.e. using sub-millimetre waves, infrared, visible or ultraviolet light
- G01N21/62—Systems in which the material investigated is excited whereby it emits light or causes a change in wavelength of the incident light
- G01N21/63—Systems in which the material investigated is excited whereby it emits light or causes a change in wavelength of the incident light optically excited
- G01N21/64—Fluorescence; Phosphorescence
- G01N21/6428—Measuring fluorescence of fluorescent products of reactions or of fluorochrome labelled reactive substances, e.g. measuring quenching effects, using measuring "optrodes"
-
- Y—GENERAL TAGGING OF NEW TECHNOLOGICAL DEVELOPMENTS; GENERAL TAGGING OF CROSS-SECTIONAL TECHNOLOGIES SPANNING OVER SEVERAL SECTIONS OF THE IPC; TECHNICAL SUBJECTS COVERED BY FORMER USPC CROSS-REFERENCE ART COLLECTIONS [XRACs] AND DIGESTS
- Y10—TECHNICAL SUBJECTS COVERED BY FORMER USPC
- Y10S—TECHNICAL SUBJECTS COVERED BY FORMER USPC CROSS-REFERENCE ART COLLECTIONS [XRACs] AND DIGESTS
- Y10S436/00—Chemistry: analytical and immunological testing
- Y10S436/80—Fluorescent dyes, e.g. rhodamine
-
- Y—GENERAL TAGGING OF NEW TECHNOLOGICAL DEVELOPMENTS; GENERAL TAGGING OF CROSS-SECTIONAL TECHNOLOGIES SPANNING OVER SEVERAL SECTIONS OF THE IPC; TECHNICAL SUBJECTS COVERED BY FORMER USPC CROSS-REFERENCE ART COLLECTIONS [XRACs] AND DIGESTS
- Y10—TECHNICAL SUBJECTS COVERED BY FORMER USPC
- Y10S—TECHNICAL SUBJECTS COVERED BY FORMER USPC CROSS-REFERENCE ART COLLECTIONS [XRACs] AND DIGESTS
- Y10S436/00—Chemistry: analytical and immunological testing
- Y10S436/806—Electrical property or magnetic property
-
- Y—GENERAL TAGGING OF NEW TECHNOLOGICAL DEVELOPMENTS; GENERAL TAGGING OF CROSS-SECTIONAL TECHNOLOGIES SPANNING OVER SEVERAL SECTIONS OF THE IPC; TECHNICAL SUBJECTS COVERED BY FORMER USPC CROSS-REFERENCE ART COLLECTIONS [XRACs] AND DIGESTS
- Y10—TECHNICAL SUBJECTS COVERED BY FORMER USPC
- Y10T—TECHNICAL SUBJECTS COVERED BY FORMER US CLASSIFICATION
- Y10T436/00—Chemistry: analytical and immunological testing
- Y10T436/15—Inorganic acid or base [e.g., hcl, sulfuric acid, etc. ]
Definitions
- the present invention relates to a method and apparatus for performing chemical and biochemical assays.
- the ability to characterise processes at a cellular or subcellular level is important in both drug discovery and clinical diagnostics.
- One class of interactions frequently studied is the binding of one biological molecule to another molecule, cell or part of a cell. This may be for example the binding of antibodies to antigens; hormones to receptors; ligands to cell surface receptors, enzymes to substrates; nucleic acids to other nucleic acids; nucleic acids to proteins and viruses to cell surfaces.
- Another class of interactions important in the biology of the cell are diffusion or transport of molecules or cells across membranes. This may for example occur by osmosis; via special transport proteins or through phagocytosis.
- Many diseases are characterised by binding or transport processes.
- drug discovery the aim is to identify a means of enhancing or blocking the process.
- clinical diagnostics the aim is to detect abnormal function of these processes; the presence of abnormal nucleic acid material; or to identify foreign bodies (such as viruses or bacteria) to diagnose a disease so that appropriate treatment may be given.
- the present invention seeks to provide a rapid and simple assay to detect and quantify binding and transport processes important in drug discovery and clinical diagnostics.
- receptor shall mean any biological molecule, cell or structure that binds another molecule, cell or structure.
- ligand shall mean any organic or inorganic molecule that binds to the "receptor”.
- the discussion and examples will focus on the assay of a labelled ligand binding to a receptor.
- the prior art described and the invention can be extended to include the interaction of a non-labelled agonist or antagonist in a competition assay as commonly used in drug discovery.
- [L] concentration of unbound ligand at equilibrium
- [R] concentration of unbound receptor at equilibrium
- [L.R] concentration of bound ligand/receptor complex at equilibrium
- the concentration is commonly measured in molar, and K d for ligand; protein interactions is typically in the range 10 -4 to 10 -15 M -1 .
- the classical assay used in drug discovery and diagnostics is the separation assay.
- one component for example the ligand
- the other component for example the receptor
- the assay is performed by adding the soluble component to a well containing the immobilised component and allowing the binding of the components to come to equilibrium. It is not possible with conventional detectors such as colourimetric, fluorescent or radioactivity plate readers to directly determine the amount of bound labelled ligand in the presence of free labelled ligand.
- This problem is overcome by separating the free ligand from the bound ligand by decanting off the solution containing the free ligand. One or more washes with fresh solvent may be performed to remove any excess free ligand. A measurement of the remaining label is assumed to represent the concentration of bound complex in the original solution. This process may also be performed where the receptor is on a cell. If the cells are not attached to the well the washing process is performed in special filter plates that retain the cells, but allow the wash solvent to pass through.
- SPA Scintillation Proximity Assay
- FP Fluorescence Polarisation
- FCS Fluorescence Correlation Spectroscopy
- TRF Time Resolved Fluorescence
- SPA relies on the transfer of energy from a radiolabelled ligand to a scintillant bead onto which the receptor is attached.
- the assay has to be conducted at relatively high concentrations to produce enough signal. Legislation on the disposal of radioactive material and the risk of exposure to operators has led to companies seeking alternatives.
- SPA is not suited to some assays using whole cells and cannot be used to assay receptors or proteins inside cells. This means that functional receptor must be isolated from the cell to perform the assay, and this is costly, difficult and in some cases cannot be achieved.
- FP is a technique for estimating the mass of a fluorescent object from its speed of rotation or translocation through diffusion.
- the sample is illuminated by a burst of polarised light and emitted fluorescence is measured in the same or other polarisation plane. If the label is bound to a large object, rotation or translocation will be slower and emission will be in the same polarisation plane as the excitation for some time after the illumination. If the free label is much smaller than the bound complex the molecule may more rapidly move out of the plane of the incident polarised light and emit in another plane.
- the fluorophore has a sufficiently long decay time, the light reaching the detector will take longer to decay after excitation if a substantial number of fluorophore-labelled ligands in the solution are bound to larger molecules.
- the method is a correlation rather than a direct measurement of bound to free label. Some of the free label will emit in the same plane as the excitation. It also requires that the labelled ligand be very much smaller than the receptor and that decay time for the fluorophore be longer than the speed of rotation of target molecules. This technique has many drawbacks: it is difficult to differentiate non-specific binding and contaminating background fluorescence from specifically bound labelled ligand; it cannot be used to study intracellular interactions; the sensitivity of the method is reduced by relying on the decay of the signal rather than peak fluorescence and it is limited to the use of certain fluorophores.
- FCS is similar to FP with the exception that FCS performs correlations on single molecules.
- the technique predicts the size of a fluorescent particle or molecule from its speed of translocation through a fixed laser beam by brownian motion.
- To perform the technique it is desirable that only a single molecule of fluorophore be present in the laser beam at one time.
- FCS is usually performed with very low concentrations of label.
- This technique is highly susceptible to contaminating background fluorescence typical in practical assays. It is also comparatively slow, taking up to half an hour of continuous measurement to detect binding to larger molecules.
- FCS FCS
- the technique of FCS has been known for more than twenty years. The difficulties of using it for practical assays has prevented its use until comparatively recently.
- Some of the drawbacks of the technique are: fixed beam FCS examines only one interaction at a time which may not be representative of the whole sample; it cannot differentiate directly between specific and non-specific binding; the technique requires running assays at very low concentration, which can bring additional problems such as loss of signal through non-specific binding of the label or receptor to the walls of the vessel and low signal to noise ratio as a result of low signal strength.
- the technique is also susceptible to thermally induced eddy currents. These severe limitations could be reduced by employing an established technique used in the study of flow in liquids.
- TRF is similar to SPA in that it relies on the transfer of energy from one molecule to another in close proximity. In this case energy from one fluorophore is transferred to another fluorophore in close proximity.
- the technique requires both the receptor and the ligand to be soluble and that a fluorophore be present on both the ligand and the receptor. This is not suitable for assays where a soluble receptor cannot be obtained, and in addition chemically modifying the receptor by the addition of a label can be difficult and lead to a reduction or elimination of activity.
- a CCD has finite resolution.
- the largest CCDs available today have around 1 million pixels, but cost-effective devices used in scientific devices have significantly fewer. There is therefore a compromise between field of view and resolution. This means that typically the field of view is only 1 mm 2 with resolution of 4 ⁇ m at best. This is only sufficient to obtain poorly resolved images of around 100 cells at once, which is insufficient for obtaining statistically significant results in some assay types.
- the resolution is insufficient to allow accurate measurement of the size and shape characteristics of cells or beads.
- the sensitivity of CCDs is substantially less than PMTs, making them insufficiently sensitive for making quantitative measurements at low light levels (for example labelled ligand bound to cell surface receptors on cells where expression is low, perhaps only 5,000 receptors per cell).
- CCD imaging systems lack this ability.
- Each pixel of the CCD array has a different sensitivity, so measurements across the scan are not consistent.
- Each pixel can only detect one colour at a time.
- Multi-colour images may be obtained by using a filter wheel in front of the CCD array, and taking multiple frames with different filters. This slows down the reading time, and if the sample moves during measurement (as free cells and beads are likely to do in liquid) the spectral information is lost.
- Multiple CCD arrays can be used to collect images in multiple colours, but it is not possible to achieve perfect pixel alignment between detectors or to have true simultaneous multi-wavelength detection. CCD arrays do not exhibit uniform sensitivity across the visible range. It is very important for background rejection at low signal levels that true simultaneous spectral measurements are made.
- CCD arrays are not capable of repeatedly scanning an area at rates fast enough to perform measurements of rapid transients or time resolved fluorescence techniques (nanosecond to microsecond sampling rates).
- Some systems such as the "FLIPR” from Molecular Devices and FMAT TM from Perkin Elmer scan the sample with a laser. These systems employ confocal optics to deliberately limit the depth of the field of the detector, thus minimising the background signal from free label. This signal is not used to measure bound:free label concentrations. Additionally, resolution of these systems is too poor to allow accurate measurement of the shape or size of small beads or cells.
- Fluorescence detection is becoming the method of choice for drug discovery because it offers sensitivities approaching that of radio label assays without the health risks and disposal problems.
- the present embodiment offers a practical solution to the problems discussed above.
- the illuminating light may be generated by a laser beam.
- the received light may be light generated by fluorescence, and more than one wavelength of light may be received.
- the received intensity may be employed to determine the size and/or volume of each cell, bead, surface or well and the number of molecules bound to it.
- the illuminating light may be arranged to illuminate from above or below the sample with the emitted light being detected from above or below the sample in any combination in such a way that the illuminating light illuminates both the site and a significant volume of the solution above or adjacent to the site.
- the present invention also provides an apparatus for performing a non-separation assay for determining a level of binding of a first labelled component in solution to a second component as claimed in claim 11 hereinafter.
- An advantage of the present invention is that it can be employed to provide a reference value to the solution in which the beads, cells, surfaces or wells sit so that the concentration of any fluorescent component in the solution may be measured (free component) and the number of molecules of any fluorescent component bound to the bead, cell, surface or well (bound component) may be measured and compensation can be made for any signal from the free component that is coincident with the signal from the bound component so that an accurate value for the number of molecules bound to the bead, cell, surface or well may be measured, and further, bound:free ratios may be estimated without need to separate the components. Furthermore, it is possible with the method and apparatus of the invention to determine not only the amount of binding but the area bead, cell, surface or well volume of each to ensure more accurate results.
- the light source may scan the solution and sites in a linear fashion, with one scan overlapping the next, so that a continuous measurement of received light intensity can be provided.
- Data relating to the received light intensity may be filtered by employment of a fixed or variable threshold in order to reduce the amount of data required to be processed.
- a further advantage of the present invention is that, by employing continuous scanning of the beads, cells, surfaces or wells and solutions it is possible to determine accurately bead, cell, surface or well locations and also to provide a reliable indication of spurious results caused by contamination and the like.
- meniscus of the sample may be determined simultaneously with the measurement of bound: free and compensated for in the mathematical analysis.
- US-A-5663057 describes a method for rapidly detecting micro-organisms in water.
- the final process of this method involves scanning a laser across a membrane filter on which are retained fluorescently labelled bacteria.
- the system uses a combination of discriminants and threshold algorithms to pick out individual cells amongst the continuous background of free label and background fluorescence.
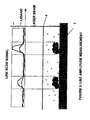
- the line amplitudes obtained for each cell is an accurate measurement of the fluorescence intensity of the cell and can be calibrated to give a measure of the amount of bound fluorophore.
- FIG. 1 is a schematic diagram of a device employed in US-A-5663057, but adapted to perform the method of the invention, this device will be described in more detail below.
- a laser 1 emits an illuminating light beam 2 which passes by a series of mirrors and a beam expander 3.
- the illuminating beam 2 is then directed via scanning mirrors 4 and a lens 5.
- the scanning mirrors 4 can be controlled to scan the beam 2 across the surface of a filter 6 and assay sample 7 in a manner that will be described below with reference to Figure 2.
- a telescope may be introduced at the beam expander position 3 to enable the spot to be focussed at different distances to the scan lens 5 or to control the size of the laser spot at the target.
- the light beam 2 is scanned sequentially over the assay sample 7 so that the total sample surface area is covered. It is preferable for the scanning to be such that each adjacent scan overlaps the previous scan, ensuring that no features are missed.
- the processing means 11 can be configured to compensate for the overlap.
- Figure 3 illustrates how line amplitudes are obtained when a sample is scanned.
- Figure 4 illustrates the principles of the assay.
- the concentration of fluorescent molecules in the cell volume needs to be significantly higher or lower than the equivalent volume of solution in order for the system to detect a difference:
- PVS/UVS >1 to demonstrate binding of a fluorophore to a cell or bead.
- the brightness of the cell volume relies primarily on three factors: the number of binding sites (or receptors) on the cell or bead; the K d of the association, and the concentration of the labelled ligand in solution at equilibrium.
- the present invention can be used to measure the extent of binding or proximity of a fluorophore to a surface where that surface may modify the fluorophore or mask or quench the emission such that light output from the fluorophore is reduced or eliminated locally.
- examples include, but are not limited to, the conversion of a fluorescent compound to a non-fluorescent compound by an enzyme; a reduction of fluorescence due to the presence of a quenching agent on a surface, bead or cell; trans-location of a label into a cell and change in the spectral characteristics of a fluorophore.
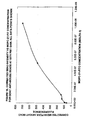
- Figure 5 gives predicted values for PVS/UVS signal ratios plotted against K d for the following conditions: 6 ⁇ m diameter bead varying indicated numbers of binding sites; 6 ⁇ m diameter laser beam; depth of liquid of 100 ⁇ m; and labelled ligand concentration at equilibrium of 1 nM.
- FIG. 6 A simple example of one embodiment of invention is shown in figure 6.
- a 5 ⁇ l sample of a solution of 48 nM fluorescein isothiocyanate-labelled biotin (FITC-biotin) is added to 5 ⁇ l of a solution of buffer containing a single 2.8 ⁇ m diameter bead coated with streptavidin (obtained from Dynal).
- the sample was presented to the instrument for scanning as a 10 ⁇ l droplet on the surface of a glass microscope slide. Illumination and light collection was arranged from above the sample.
- the instrument was set to take fluorescent intensity measurements at 1 ⁇ m intervals across the sample in the x-direction with a line-to-line step of 2.2 ⁇ m in the y-direction.
- the graphs plot the relative intensity (analogue-to-digital converter or ADC counts) against position (sample number) for several adjacent scan lines.
- the FITC-biotin has had insufficient time to diffuse to the streptavidin sites concentrated on the bead.
- the sample was scanned at intervals over the period of the experiment . It can be readily appreciated that the signal obtained from the illumination will be proportional to the number of molecules of label (FITC-biotin) in the path of the laser at each point. If, as in this case, the label is homogenous throughout the droplet then the signal at each point is proportional to the path length of the laser through the sample.
- the top diagram clearly shows that each scan line represents a cross-section through the droplet, and that the droplet meniscus in this case is hemispherical as expected.
- the concentration of the label is known it is apparent that the volume and shape of a sample (in this case a droplet) may be estimated by calculation. It also follows that if the volume or height of a solution is known then, after calibration of the apparatus with known solutions, it is possible to calculate the concentration of free label from the intensity signals obtained.
- Example 2 a measurement was made and data saved for every point in the sample.
- the Chemscan ® RDI modified for this application has three detector channels and is capable of taking in excess of 600 million readings in a single scan of 400 mm 2 . It is desirable to reduce the amount of data passed on to the computer for final analysis in order that the analysis is speeded up and the amount of data required to be stored for archiving is reduced. This can be achieved by applying.-a threshold algorithm to the raw data.
- the invention makes use of two types of threshold algorithm. In "frequency table" thresholding each measurement is put into a table of intensity values. If a single measurement exceeds the average intensity of all the measurements taken to that point by a pre-set percentage (for example 20%) then that measurement is passed on to the computer.
- dynamic thresholding the system calculates a moving average of the signal and retains those measurements that are a pre-set percentage above the moving average. It is also possible to perform dynamic thresholding by continually measuring the slope of the signal response and triggering the start and finish of an event when the slope or rate of change of the slope is greater or lesser than a.pre-set value or a set percentage of the average.
- Frequency table thresholding works well when there are few bright objects in the sample and the background is low. Dynamic thresholding has the benefit that it can isolate and record the signals due to individual sites in the presence of significant concentrations of free label.
- the raw data for one or more lines is retained for a short time by the system during scanning. This means that when an object such as a bead or cell is detected by thresholding, the measurement samples immediately before and after the object may be retained with the rest of the measurement samples for the object before rejection of the rest of the background data. These are termed pre- and post- samples.
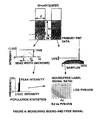
- Figure 7 shows a typical scan map of fluorescent particles detected in a liquid sample by a Chemscan ® RDI instrument of the type shown in US-A-5663059 while running a dynamic threshold.
- the left hand scan map displays all the fluorescent particles found; the right hand scan map displays those particles that match the characteristics determined for beads labelled with fluorescence in an assay performed by the method of the present embodiment.
- Figure 8 gives the line amplitudes of a typical labelled bead.
- Beads and cells being in many cases spherical, give line amplitude plots ("Z") that are "half sine wave" in X and Y. These plots are not exact replicas of the beads or cells. This is only an approximation.
- the prototype has a beam energy that is Gaussian.
- a bead is spherical. Therefore, a correction for the true width of the bead is a combination of a Gaussian and a sine wave function.
- the sampling rate is higher than the scan rate so, for example, samples are taken every 1 ⁇ mm interval (scanning at 2 ms -1 and sampling at 2 MHz), but the laser spot size is larger (6 ⁇ mm diameter). This means that the true diameter of a bead or cell will be approximately the width of the plot minus twice the diameter of the laser spot. Beads of known size are used to calibrate the instrument.
- the peak intensity on the line amplitude plot should be directly proportional to the amount of fluorophore bound to the bead or cell and the volume of fluorophore solution above it. This can be taken as the PVS.
- the peak intensity value will under-read by an amount proportional to the diameter of the cell or bead which can be compensated for.
- the area under the 3-D plot can also be used to represent the PVS with an alternative calibration.
- the UVS can be obtained from the pre- and -post samples taken before and after a bead or cell detected by a threshold algorithm.
- the dynamic threshold automatically provides a baseline for the free label contribution to the PVS and the bound label can be taken as the height or area of the peak above this threshold. It can be seen that a peak intensity value for the populated volume element can be obtained from the maxima on this plot, and that the intensity of the unpopulated volume element may be obtained from the pre-and post-samples at the edges of the plot.
- the unpopulated volume element signal can also be obtained from the average background threshold recorded by the system or as the lowest signal obtained anywhere on the scan.
- beads or cells can vary enormously in key parameters such as size, number of binding sites or receptor expression. For these reasons it is unwise to rely on the measurement of signals from just a handful of beads or cells when collecting quantitative data. In the method of the invention a significant number of beads or cells may be used (typically 100-1000 in one sample). The key parameters such as peak or average intensities of all the beads or cells are recorded individually and this data is then processed as a population. Each bead or cell is effectively a separate assay and the data obtained for the population is typically a gaussian distribution (see Fig 9).
- the invention makes use of population statistics to provide accurate data for subsequent mathematical analysis.
- the values for peak intensity or area intensity of the target site and the adjacent free label intensity is recorded for every site in the sample. This data is plotted as a frequency histogram.
- a Gaussian fit is made to the population data and the mean value is returned.
- This same Gaussian fit method is applied to frequency histograms for other major discriminants such as size, shape and spectral characteristics.
- Figure 10 shows a frequency histogram for the peak intensity of a bead population with intensity close to a background noise threshold cut-off. It can be seen that fitting these data to a Gaussian population gives an accurate representation of the population whereas an average would ignore results below the detectable threshold.
- Figure 11 shows the correlation between histograms for different measurements of the same population.
- Figure 12 shows a typical histogram for the "Gaussian shape" discriminant of a population of contaminating particles. Note that the population of contaminating particles is not itself Gaussian.
- the liquid meniscus can present problems when performing assays. It is desirable to have a fixed pathlength through the liquid (uniform depth) to enable accurate and reproducible measurements both within a well and from one well to the next when scanning from above the sample.
- the meniscus also acts as a lens, potentially resulting in some of the sample being out of focus.
- Figure 6 illustrates the ability of the apparatus to plot the meniscus of a liquid sample. This sample was a droplet on a flat slide. The system has also been used to plot the menisci of samples in micro-wells, scanning from above or below.
- the free label concentration is substantially constant throughout the volume of the sample, thus the UVS can be used to plot the meniscus and a mathematical fit can be made to the data to correct for it's affect.
- the data can be greatly reduced by plotting the UVS from the signals obtained from sites detected by dynamic thresh-holding. This way, a thousand sites (e.g. cells) would provide several thousand UVS readings allowing the meniscus to be plotted sufficient for correction, albeit at lower resolution.
- the PVS/UVS ratio can be determined for every site by measuring peak intensity (for PVS) and average of pre- and post- samples (for UVS).
- the signal obtained from the detector is not always directly proportional to the laser diameter and liquid depth. For example:
- the depth of a fluid of known fluorophore concentration The fluorophore concentration of a fluid of known depth The amount of fluorophore bound to or associated with an object within a fluorophore solution.
- the laser spot is focussed on the bottom of the plate where the beads or cells are located. Magnetic beads may be used so that a magnet can pull the beads into the focal plane of the laser.
- Most of the solution itself is not within the depth of focus, but is illuminated by a cone of light. However, the pin hole of the detector has an area far greater than that of the spot size and the emission from this cone is collected. Thus we obtain a fluorescence signal that is similar to that which would be obtained had the beam been truly collimated. This gives a near-linear relationship between liquid depth and signal for any given low fluorophore concentration even beyond the depth of focus for the laser.
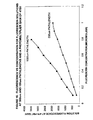
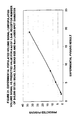
- Figure 13 shows a calibration of the apparatus with solutions of fluorescein of fixed depth and known concentration.
- Figure 14 shows a calibration of the apparatus with beads of known fluorescein content (Sigma Chemical Co.) and size within a liquid of known depth.
- the K d of the ligand/receptor association is very low and the concentration of receptors on the site is relatively high.
- concentration of receptors on the site is relatively high.
- a K d of 10 -9 is typical with perhaps 50,000-100,000 receptors present on cells or a few 100,000 receptors on beads. It is also desirable to use low concentrations of labelled ligand to reduce cost or to avoid saturation of the receptors. This leads to lower signals from the assays.
- Naturally-occurring background auto-fluorescence from components of the assay can have brightness equal to or greater than the sites being assayed. Practical experiments have shown that in a real assay there may be as many as 60,000 contaminating objects in 1 ⁇ l with a brightness similar to that of the labelled site.
- the present invention makes use of the line-to-line correlation, size discrimination, Gaussian shape criteria, colour discrimination and other discriminants described in U S -A-5663057 to reject the signals from contaminating objects.
- These discriminants were developed for positively identifying and counting bacteria which are labelled much brighter than the background and are thus not always adequate for rejecting background contamination in biochemical assays where the target analyte may be no brighter than the contamination. New discriminants have thus been added to the technique to perform the present invention:
- Background noise close to the limit of sensitivity of the instrument can often show a Gaussian shape similar to the target in the primary channel.
- the invention employs correlation between detectors.
- Target objects give signals that are Gaussian in more than one detector channel where background noise, such as electrical noise, does not.
- Bacterial detection is aimed at rare event detection.
- the relative intensity of each event is not important provided it is above a threshold.
- the present invention requires an intensity value for both the bound and free label.
- Magnetic beads coated with receptors are prepared.
- the number of receptors on the beads is estimated by incubating them in a solution of labelled ligand.
- the ligand concentration is chosen to be above the expected K d for the association.
- the amount of bound ligand is measured by drawing the beads to the focal point of the instrument with a magnet and scanning the suspension.
- a dynamic threshold algorithm is used to detect only those objects significantly brighter than the background.
- a set of discriminants for half-width, size, spectral ratios, Gaussian shape etc. are applied to the raw data and only those objects matching the characteristics of the beads are displayed.
- the histograms for all the measurements on the beads are plotted and checked for Gaussian distribution in every parameter to confirm that the system has indeed discriminated beads from background contaminating particles.
- the signal due to the free ligand may be measured adjacent to the signal from the beads.
- the threshold algorithm may be set to zero the background and measure only peaks above this background. In this way the signal due to free label may be subtracted from the total signal to give only the signal on the beads.
- the peak or average intensity of all the objects confirmed as beads is plotted in a frequency histogram.
- a Gaussian fit is made to this histogram and the intensity value at the centre of the distribution is taken as typical of the population.
- the number of molecules of fluorohore (and thus receptor) associated with the beads is then calculated by comparing the fluorescence value obtained with a calibration curve obtained for beads of known fluorophore content.
- the K d of the association may be estimated by repeating the assay with a labelled ligand concentration below the expected K d .
- a measure of the bound labelled ligand is obtained at equilibrium for the middle of the distribution of peak intensity values.
- the free ligand concentration at equilibrium is obtained from the signal from the solution adjacent to the beads.
- the volume of the beads may be estimated and a mathematical correction applied to the half-width measured for the beads.
- the volume of the beads and the average number of receptor molecules per beads are now known. This can be represented as a local concentration.
- the K d of a reversible receptor ligand interaction can be estimated by assuming that the cell or bead represents a local concentration of receptor in which the receptor molecules are considered to be distributed evenly throughout the volume of the cell or bead. We will call this Bead Receptor concentration (B R ). This working assumption works well in practise for the bead and cell sizes and associated receptor numbers used in practical assays. Hence:
- the model may predict K d vs PVS/UVS as plotted in Figure 4. Once this plot is obtained the K d of an association may be estimated from a single measurement of the PVS/UVS signal obtained over a wide range of free ligand concentrations, and thus applied to multiple assays where the bound or free label is varying.
- This mathematical model showed good correlation with experimental results of PVS/UVS in example 3.
- the technique allows for the estimation of K d by a single measurement without the need to test serial dilutions, however serial dilutions may be applied to improve the accuracy of the measurement. It is recognised that the K d for a receptor on a surface may vary from that in solution, however receptors are most often found on or in cell membranes. This technique provides a means of estimating K d for biomolecules in their natural environment.
- the calculation can be reduced to a mathematical model embedded in software in the instrument.
- the instrument automatically determines the median peak intensity signals for the beads or cells, the number of beads or cells, their true dimensions and the signal due to free fluorescence. These values are applied to the mathematical model to directly calculate a measure of K d in real time. The instrument can also estimate the statistical confidence in the accuracy of the result.
- the reagents were goat anti-mouse antibody coated polystyrene microspheres, 5.5 ⁇ m diameter, binding capacity 1.48 ⁇ g mouse IgG/mg beads, 1.045x10 9 beads / ml in borate buffer (100mM, pH8.5, containing 0.1% bovine serum albumin, 0.05% Tween, 10mM EDTA and 0.1% sodium azide), stored at 4°C, supplied by Bang's Laboratories, Inc., 9025 Technology Drive, Fishers, IN 46038-2866, USA.
- borate buffer 100mM, pH8.5, containing 0.1% bovine serum albumin, 0.05% Tween, 10mM EDTA and 0.1% sodium azide
- Mouse IgG, K (MOPC-21), fluorescein isothiocyanate (FITC) conjugate, immunoglobulin concentration 200 ⁇ g/ml, protein concentration 200 ⁇ g/ml, Fluorescein /protein molar ratio 5.8, in phosphate buffered saline (0.01M, pH7.4, containing 1% bovine serum albumin and 15mM sodium azide).
- Specificity immunoelectrophoresis: single arc of precipitation versus anti-mouse whole serum, anti-mouse IgGl and anti-mouse IgG K (prior to conjugation).
- Dubelcco's Phosphate Buffered Saline (10mM, pH7.4, containing 120mM sodium chloride, without calcium or magnesium). Supplied by Life Technologies Ltd., P.O. Box 35, 3 Fountain Drive, Inchinnan Business Park Paisly, PA4 9RF, UK.
- Quantum fluorescence beads at 450,000 molecules of equivalent soluble fluorochrome (450,000 MESF), 7-10 ⁇ m diameter, approximately 2x10 6 beads /ml in phosphate buffer containing surfactants and 0.1% sodium azide (information taken from product technical bulletin). Supplied by Sigma
- Fluorescein isothiocyanate (FITC) Isomer 1 approximately 98% pure (HPLC analysis). Supplied by Sigma.
- the first requirement for the proof of the assay assumptions is to establish that the relationship between fluorescence and fluorophore concentration at a fixed pathlength and between fluorescence and pathlength for a fixed fluorophore concentration is linear.
- the two biochemical parameters required in the proof are the K d of the binding interaction and the maximum number of available binding sites on a bead. These can both be measured in a single bead titration experiment.
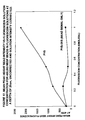
- the K d is the more obvious of the two measurements, being equivalent to the concentration of fluorescent ligand which results in half the maximum bead fluorescence, after the mean peak height bead intensity has been corrected for the intensity of the overlying ligand solution.
- the maximum number of available sites on a bead can be found by plotting the aggregate fluorescence of the free ligand (the assay should be done under conditions that do not cause solution depletion) against ligand concentration at a fixed pathlength and PMT gain. After plotting fluorescence v ligand concentration, the concentration of ligand having solution fluorescence equal to that of the corrected mean peak bead intensity can be taken. This value and the pathlength value are input into appropriate calculation software and the effective number of fluorescent ligand molecules in the laser path is then calculated. The effective number of sites per bead is equal to this number. It is important that the response of solution fluorescence v pathlength is linear for this calculation.
- the ratio of mean corrected bead fluorescence to solution fluorescence can now be plotted against the bound to free reading predicted by software using the input values of K d , available receptor sites, pathlength and fluorophore concentration. If the model is accurate and the K d and available receptor site values are correct, a graph of measured bound to free v predicted bound to free fluorescence should be a straight line with a slope of 1.
- MOPC-21-FITC conjugate Solutions of MOPC-21-FITC conjugate at concentrations of 1nM, 5nM, 10nM, 50nM, 100nM, 500nM 1.0 ⁇ M and were prepared in Dubelcco's PBS. Goat anti-mouse beads were resuspended by vortex mixing and were diluted to a concentration of 2,500 beads / ⁇ l with Dubelcco's PBS. This diluted bead suspension was then added to each of the MOPC-21-FITC solutions (2 ⁇ l beads plus 100 ⁇ l solution to give a final concentration of 50 beads/ ⁇ l), a PBS buffer blank was included. After mixing, the reaction tubes were incubated for 3 hours in the dark, at room temperature and mixed occasionally.
- the bead suspensions (50 ⁇ l of each) were then scanned from below in a clear-bottom microtitre plate in the apparatus described above, with sample depth fixed at 200 ⁇ m.
- the threshold algorithms were set to pick out each individual bead, and data was collected for peak intensity and half width.
- the solution flourescence value (UVS) was obtained by switching off the threshold and scanning a coarser profile. The solution fluorescence value was taken as the midline of the scan profile displayed.
- the uncorrected bead mean peak height fluorescence intensity (PVS) for each solution concentration was taken from the scan results screen, together with the standard deviation value and the number of results seen. In order to isolate the signal due to the bead only, the solution fluorescence was subtracted from the mean bead peak intensity fluorescence value for each data point. The corrected bead fluorescence was then plotted against MOPC-21-FITC concentration ( Figure 18).
- the K d of the binding interaction was found to be 1.2 nmoles/l and the maximum number of available binding sites / bead was found to be 245,000.
- the plot of experimental bound to free ratio against predicted PVS/UVS ratio was linear with a slope of 1.86. The linearity is more important than the slope in this proof since it has been assumed that the laser spot size is 6 ⁇ m, any variation in this value will affect the predicted B/F values in a linear fashion.
- the apparatus of the invention may be used to measure and estimate the Kd of an association; the size and volume of a bead or cell; the number of binding sites on the bead or cell; the free label concentration and the occupancy of the binding sites during an assay. Furthermore, once calibrated the system and method of the invention may be used to estimate the KD of a reversible binding interaction in a single well without the need for serial dilutions or separation by employing a simple mathematical model to the measurements obtained.
- This fundamental principle can be applied to the measurement of more complex interactions involving multiple dissociation constants, and can also be used to estimate the KD of a competing compound.
Claims (33)
- Procédé permettant d'effectuer un essai de non-séparation pour déterminer un niveau de liaison entre un composant et un autre, le procédé comprenant les étapes suivantes:fournir un premier composant étiqueté dans une solution;fournir un ensemble de perles, cellules, surfaces ou cavités et placer un second composant sur lesdites perles ou surfaces, ou dans lesdites cellules ou cavités ;immerger l'ensemble dans la solution ;balayer l'ensemble avec un faisceau de lumière d'éclairage de telle sorte que la lumière traverse la solution tout en éclairant les perles, cellules, surfaces ou cavités ;déterminer une intensité de lumière reçue de chacune des perles, cellules, surfaces ou cavités et solution à au moins une longueur d'onde au cours de l'éclairage ;déterminer, à partir d'une valeur d'intensité de crête de lumière reçue, d'une zone située en dessous d'une courbe de l'intensité de crête, ou de la zone située en dessous d'une courbe d'intensité 3-D d'un second emplacement de composant, une quantité de liaison entre le premier composant étiqueté et le second composant ;déterminer, à partir de pré- et post-valeurs d'intensité de second composant, du signal le plus faible obtenu au cours du balayage de l'ensemble ou d'une valeur d'arrière-plan moyenne obtenue au cours du balayage, une quantité de premier composant étiqueté dans la solution ; etdéterminer un rapport de i) une quantité de liaison entre le premier composant étiqueté et le second composant sur ii) la quantité de premier composant étiqueté dans la solution.
- Procédé selon la revendication 1, dans lequel la lumière d'éclairage est générée par un faisceau laser.
- Procédé selon la revendication 1 ou la revendication 2, dans lequel la lumière reçue est une lumière générée par fluorescence.
- Procédé selon l'une quelconque des revendications précédentes, dans lequel plus d'une longueur d'onde de lumière est reçue.
- Procédé selon l'une quelconque des revendications précédentes, dans lequel l'intensité reçue est employée pour déterminer i) au moins un parmi un diamètre et un volume de chaque perle, cellule ou cavité ou ii) un diamètre d'une surface, et un nombre de molécules liées à la perle, cellule, surface ou cavité.
- Procédé selon l'une quelconque des revendications précédentes, dans lequel la lumière d'éclairage est agencée pour éclairer par-dessus ou par-dessous un échantillon avec une lumière émise qui est détectée par-dessus ou par-dessous l'échantillon selon une combinaison quelconque de telle sorte que la lumière d'éclairage éclaire à la fois la perle, cellule, surface ou cavité et un volume significatif de la solution située au-dessus ou adjacente à la perle, cellule, surface ou cavité.
- Procédé selon l'une quelconque des revendications précédentes, dans lequel le faisceau de lumière d'éclairage balaie la solution et les perles, cellules, surfaces ou cavités d'une façon linéaire, un balayage chevauchant le suivant, de telle sorte qu'une mesure continue d'intensité de lumière reçue peut être fournie.
- Procédé selon l'une quelconque des revendications précédentes, dans lequel des données liées à l'intensité de lumière reçue sont filtrées en utilisant un seuil fixe ou variable afin de réduire la quantité de données devant être traitées.
- Procédé selon l'une quelconque des revendications précédentes comprenant les étapes supplémentaires consistant à utiliser un seuil pour isoler des perles, cellules, surfaces ou cavités ayant des sites de liaison associés à partir d'un signal d'étiquette libre d'arrière-plan de telle sorte que des pré- et post-échantillons de signal de seuil peuvent être utilisés comme mesure d'étiquette libre adjacente à chaque perle, cellule, surface ou cavité, et à corriger les effets d'un ménisque liquide.
- Procédé selon l'une quelconque des revendications précédentes, dans lequel une empreinte digitale ou des discriminants sont utilisés pour désigner une population de perles, cellules, surfaces ou cavités ayant des sites de liaison associés à partir de particules contaminant l'arrière-plan avant de déterminer la quantité de liaison et la quantité de premier composant étiqueté dans la solution associée aux sites de liaison.
- Appareil permettant d'effectuer un essai de non-séparation pour déterminer un niveau de liaison entre un premier composant étiqueté en solution et un second composant sur un ensemble des perles, cellules, surfaces ou cavités, l'appareil comprenant :des moyens de balayage (4, 5,6) permettant de balayer l'ensemble avec un faisceau de lumière d'éclairage (2) de telle sorte que la lumière traverse la solution tout en éclairant les perles, cellules, surfaces ou cavités;des moyens (8, 9, 10) permettant de déterminer une intensité de lumière reçue de chacune des perles, cellules, surfaces ou cavités et solution à au moins une longueur d'onde au cours de l'éclairage ;des moyens permettant de recevoir l'intensité de lumière;des moyens (11) permettant de déterminer à partir d'une valeur d'intensité de crête de lumière reçue, d'une zone située en dessous d'une courbe d'intensité de crête ou de la zone située en dessous d'une courbe d'intensité 3-D d'un second emplacement de composant, une quantité de liaison entre le premier composant étiqueté et le second composant ;des moyens permettant de déterminer à partir de pré- et post-valeurs d'intensité de second composant, du signal d'intensité le plus faible obtenu au cours du balayage de l'ensemble ou d'une valeur d'arrière-plan moyenne obtenue au cours du balayage, une quantité du premier composant étiqueté dans la solution; etdes moyens permettant de déterminer un rapport de i) une quantité de liaison entre le premier composant étiqueté et le second composant sur ii) la quantité de premier composant étiqueté dans la solution.
- Appareil selon la revendication 11, dans lequel les moyens de balayage comportent un faisceau laser.
- Appareil selon l'une quelconque des revendications 11 ou 12, dans lequel plus d'une longueur d'onde de lumière est reçue.
- Appareil selon l'une quelconque des revendications 11 à 13, dans lequel le moyen de détermination utilise l'intensité reçue pour déterminer i) au moins un parmi un diamètre et un volume de chaque perle, cellule ou cavité ou ii) un diamètre d'une surface, et un nombre de molécules liées à la perle, cellule, surface ou cavité.
- Appareil selon l'une quelconque des revendications 11 à 14, dans lequel la lumière d'éclairage est agencée pour éclairer par-dessus ou par-dessous un échantillon avec une lumière émise qui est détectée par-dessus ou par-dessous l'échantillon selon une combinaison quelconque de telle sorte que la lumière d'éclairage éclaire à la fois la perle, cellule, surface ou cavité et un volume significatif de la solution située au-dessus ou adjacente à la perle, cellule, surface
ou cavité. - Appareil selon l'une quelconque des revendications 11 à 15, dans lequel le faisceau de lumière d'éclairage balaie la solution et les perles, cellules, surfaces ou cavités d'une façon linéaire, un balayage chevauchant le suivant, de telle sorte qu'une mesure continue d'intensité de lumière reçue peut être fournie.
- Appareil selon l'une quelconque des revendications 11 à 16, dans lequel des données liées à l'intensité de lumière reçue sont filtrées par l'utilisation, par le moyen de détermination, d'un seuil fixe ou variable afin de réduire la quantité de données devant être traitées.
- Appareil selon l'une quelconque des revendications 11 à 17, dans lequel la lumière reçue est récupérée par le biais d'un trou d'épingle pouvant être fixé ou ajusté de manière à permettre à une proportion sensible de la fluorescence provenant de l'étiquette libre d'être détectée.
- Procédé selon la revendication 10, dans lequel un ajustement Gaussien est élaboré sur la population, et une valeur moyenne de celui-ci est utilisée pour déterminer la quantité de liaison et la quantité de premier composant étiqueté dans la solution.
- Procédé selon l'une quelconque des revendications 1 à 10 et 19, dans lequel la compensation de la quantité de liaison, pour un effet du premier composant étiqueté en solution autour d'une perle, cellule, surface ou cavité, est fournie en soustrayant l'intensité reçue du premier composant étiqueté en solution de l'intensité reçue du premier composant étiqueté lié à cette perle, cellule, surface ou cavité.
- Procédé selon la revendication 2, dans lequel l'ensemble est un ensemble de perles et une perle de l'ensemble est une perle magnétique, et dans lequel un aimant est prévu de telle sorte que l'aimant attire la perle dans un plan focal.
- Appareil selon l'une quelconque des revendications 11 à 18, comprenant en outre des moyens permettant de compenser la quantité de liaison déterminée, pour un effet du premier composant étiqueté en solution autour d'une perle, cellule, surface ou cavité, en soustrayant l'intensité reçue du premier composant étiqueté en solution de l'intensité reçue du premier composant étiqueté lié à cette perle, cellule, surface ou cavité.
- Appareil selon la revendication 12, dans lequel l'ensemble est un ensemble de perles et une perle de l'ensemble est une perle magnétique, et dans lequel un aimant est prévu de manière à attirer la perle dans le plan focal du faisceau laser.
- Procédé selon l'une quelconque des revendications 1 à 10, et 19 à 21, dans lequel un nombre de perles ou cellules de l'ensemble est déterminé.
- Appareil selon l'une quelconque des revendications 11 à 18, 22 et 23, comprenant en outre des moyens permettant de déterminer un nombre de perles ou cellules dans l'ensemble.
- Procédé selon l'une quelconque des revendications 1 à 10, 19 à 21 et 24, dans lequel la constante de dissociation (Kd) de la liaison est déterminée à partir du rapport de i) la quantité de liaison entre le premier composant étiqueté et le second composant sur ii) la quantité de premier composant étiqueté dans la solution.
- Appareil selon l'une quelconque des revendications 11 à 18, 22, 23 et 25, comprenant en outre des moyens permettant de déterminer, à partir du rapport de i) la quantité de liaison entre le premier composant étiqueté et le second composant sur ii) la quantité de premier composant étiqueté en solution, une constante de dissociation de la liaison.
- Procédé selon l'une quelconque des revendications 1 à 10, 19 à 21, 24 et 26, dans lequel des données liées à l'intensité de lumière reçue sont filtrées en utilisant un seuil fixe ou variable afin de détecter une ou plusieurs perles, cellules, surfaces, ou cavités.
- Appareil selon l'une quelconque des revendications 11 à 18, 22, 23, 25 et 27, dans lequel des données liées à l'intensité de lumière reçue sont filtrées en utilisant un seuil fixe ou variable afin de détecter une ou plusieurs perles, cellules, surfaces ou cavités.
- Procédé selon l'une quelconque des revendications 1 à 10, 19 à 21, 24, 26 et 28, dans lequel l'inhibition compétitive par un composé actif ajouté à l'ensemble est déterminée à partir d'un changement dans le rapport de i) la quantité de liaison entre le premier composant étiqueté et le second composant sur ii) la quantité de premier composant étiqueté dans la solution lorsque le composé est ajouté.
- Procédé selon la revendication 30, dans lequel une constante de dissociation du composé actif ajouté à l'ensemble est déterminée à partir de l'inhibition compétitive déterminée.
- Appareil selon l'une quelconque des revendications 11 à 18, 22, 23, 25, 27 et 29, dans lequel l'inhibition compétitive par un composé actif ajouté à l'ensemble est déterminée à partir d'un changement dans le rapport de i) la quantité de liaison entre le premier composant étiqueté et le second composant sur ii) la quantité de premier composant étiqueté dans la solution lorsque le composé est ajouté.
- Appareil selon la revendication 32, dans lequel une constante de dissociation du composé actif ajouté à l'ensemble est déterminée à partir de l'inhibition compétitive déterminée.
Applications Claiming Priority (3)
| Application Number | Priority Date | Filing Date | Title |
|---|---|---|---|
| GB9903555 | 1999-02-16 | ||
| GBGB9903555.2A GB9903555D0 (en) | 1999-02-16 | 1999-02-16 | Chemical and biological assay method and apparatus |
| PCT/GB2000/000549 WO2000049415A1 (fr) | 1999-02-16 | 2000-02-16 | Procede et dispositif de dosage chimique et biochimique |
Publications (2)
| Publication Number | Publication Date |
|---|---|
| EP1153299A1 EP1153299A1 (fr) | 2001-11-14 |
| EP1153299B1 true EP1153299B1 (fr) | 2007-04-11 |
Family
ID=10847903
Family Applications (1)
| Application Number | Title | Priority Date | Filing Date |
|---|---|---|---|
| EP00903860A Expired - Lifetime EP1153299B1 (fr) | 1999-02-16 | 2000-02-16 | Procede et dispositif de dosage chimique et biochimique |
Country Status (8)
| Country | Link |
|---|---|
| US (1) | US6730521B1 (fr) |
| EP (1) | EP1153299B1 (fr) |
| JP (1) | JP4527884B2 (fr) |
| AT (1) | ATE359517T1 (fr) |
| AU (1) | AU2561400A (fr) |
| DE (1) | DE60034315T2 (fr) |
| GB (1) | GB9903555D0 (fr) |
| WO (1) | WO2000049415A1 (fr) |
Families Citing this family (26)
| Publication number | Priority date | Publication date | Assignee | Title |
|---|---|---|---|---|
| EP1239284A1 (fr) * | 2001-03-08 | 2002-09-11 | The Technology Partnership Public Limited Company | Procédé de détection sans séparation et sytème utilisant des particules opaques |
| JP4583923B2 (ja) * | 2002-05-08 | 2010-11-17 | パナソニック株式会社 | 生体分子基板ならびにそれを利用した検査および診断の方法および装置 |
| US7368082B1 (en) * | 2002-12-12 | 2008-05-06 | Tung-Lian Huang | Formulation of spotting solution to achieve uniform spot size and morphology and for nondestructive quality control of assay articles |
| US20040171167A1 (en) * | 2002-12-13 | 2004-09-02 | Affymetrix, Inc. | Chip-in-a-well scanning |
| US7092843B2 (en) * | 2003-10-21 | 2006-08-15 | X-Ray Optical Systems, Inc. | Apparatus and method for suppressing insignificant variations in measured sample composition data, including data measured from dynamically changing samples using x-ray analysis techniques |
| US7877212B2 (en) * | 2004-08-04 | 2011-01-25 | Agilent Technologies, Inc. | Methods and compositions for assessing partially saturated pixel signals |
| US7767404B2 (en) * | 2005-08-16 | 2010-08-03 | Chipotle Business Group, Inc. | Apparatus and method for single-step immunosorbent assay for single and multiple analytes |
| US8735142B2 (en) * | 2005-08-16 | 2014-05-27 | Chipotle Business Group, Inc. | Systems and methods for immunosorbent assays for single and multiple analytes |
| CN102621053B (zh) | 2005-09-21 | 2015-05-06 | 卢米尼克斯股份有限公司 | 图像数据处理的方法和系统 |
| ES2464572T3 (es) * | 2008-03-21 | 2014-06-03 | Abbott Point Of Care, Inc. | Método y aparato para determinar los índices de células sanguíneas rojas en una muestra de sangre utilizando la pigmentación intrínseca de la hemoglobina contenida en las células sanguíneas rojas |
| JP4887464B2 (ja) | 2008-03-21 | 2012-02-29 | アボット ポイント オブ ケア インコーポレイテッド | 生体試料を撮像するように構成された撮像機器の焦点位置を決定するための方法及び装置 |
| US7929121B2 (en) * | 2008-03-21 | 2011-04-19 | Abbott Point Of Care, Inc. | Method and apparatus for detecting and counting platelets individually and in aggregate clumps |
| CA2718992C (fr) | 2008-03-21 | 2013-04-30 | Abbott Point Of Care, Inc. | Procede et appareil permettant de determiner l'hematocrite d'un echantillon de sang au moyen de la pigmentation intrinseque de l'hemoglobine contenue dans les globules rouges |
| JP2011516833A (ja) * | 2008-03-21 | 2011-05-26 | アボット・ポイント・オブ・ケア | 蛍光消光及び/又は蛍光退色を用いて個々の細胞又は粒状物質を分析するための方法及び装置 |
| CA2720068C (fr) * | 2008-04-02 | 2013-11-19 | Abbott Point Of Care, Inc. | Separation virtuelle de marqueur lie et libre dans un essai de ligand pour effectuer des immunoessais de fluides biologiques comprenant du sang total |
| WO2009126505A1 (fr) * | 2008-04-09 | 2009-10-15 | Abbott Point Of Care, Inc. | Procédé de détection de très faibles niveaux d'analyte à l'intérieur d'un échantillon fluide de film mince contenu dans une chambre de petite épaisseur |
| JP5734838B2 (ja) * | 2008-04-09 | 2015-06-17 | アボット ポイント オブ ケア インコーポレイテッド | 分析チャンバ内に置かれた試料の面積を計測するための方法 |
| US20100255605A1 (en) * | 2009-04-02 | 2010-10-07 | Abbott Point Of Care, Inc. | Method and device for transferring biologic fluid samples |
| EP2519820B1 (fr) * | 2009-12-31 | 2013-11-06 | Abbott Point Of Care, Inc. | Procédé et appareil pour déterminer le volume globulaire moyen des globules rouges |
| US8472693B2 (en) | 2010-03-18 | 2013-06-25 | Abbott Point Of Care, Inc. | Method for determining at least one hemoglobin related parameter of a whole blood sample |
| WO2011119441A1 (fr) | 2010-03-22 | 2011-09-29 | Bionex Solutions Inc. | Transfert ou interrogation de matériaux par des dispositifs transporteurs et récepteurs se déplaçant indépendamment et simultanément sur de multiples axes |
| JP5433517B2 (ja) | 2010-07-14 | 2014-03-05 | 株式会社日立ハイテクノロジーズ | 解析装置及び解析方法 |
| US10190986B2 (en) | 2011-06-06 | 2019-01-29 | Abbott Laboratories | Spatially resolved ligand-receptor binding assays |
| CN105894515B (zh) | 2011-10-18 | 2019-03-01 | 卢米尼克斯股份有限公司 | 用于图像数据处理的方法和系统 |
| WO2018168819A1 (fr) * | 2017-03-14 | 2018-09-20 | 凸版印刷株式会社 | Dispositif d'analyse, kit d'analyse et système d'analyse |
| WO2020025808A1 (fr) * | 2018-08-03 | 2020-02-06 | In Singulo Solutions Ab | Procédé de détermination de l'interaction entre un ligand et un récepteur |
Family Cites Families (7)
| Publication number | Priority date | Publication date | Assignee | Title |
|---|---|---|---|---|
| US4816419A (en) * | 1983-08-01 | 1989-03-28 | University Of Health Sciences/The Chicago Medical School | Fluorescence ligand binding assay using charge-matched dye and solvent components |
| US5830769A (en) * | 1985-03-18 | 1998-11-03 | Wieder; Irwin | Homogeneous fluorassay methods employing fluorescent background rejection and water-soluble rare earth metal chelates |
| GB8827853D0 (en) * | 1988-11-29 | 1988-12-29 | Ares Serono Res & Dev Ltd | Sensor for optical assay |
| JP3211389B2 (ja) * | 1992-06-30 | 2001-09-25 | 株式会社島津製作所 | 蛍光検出型ゲル電気泳動装置 |
| GB9326450D0 (en) * | 1993-12-24 | 1994-02-23 | Multilyte Ltd | Binding assay |
| DE69417900T2 (de) * | 1994-11-17 | 1999-11-11 | Chemunex Maisons Alfort | Vorrichtung und Verfahren zum schnellen und hochempfindlichen Erkennen und Zählen von Mikroorganismen mittels Fluoreszenz |
| DE69417899T2 (de) * | 1994-11-17 | 1999-11-04 | Chemunex Maisons Alfort | Vorrichtung und Verfahren zum Erkennen und Zählen von selten vorkommenden Säugerzellen |
-
1999
- 1999-02-16 GB GBGB9903555.2A patent/GB9903555D0/en not_active Ceased
-
2000
- 2000-02-16 US US09/913,630 patent/US6730521B1/en not_active Expired - Lifetime
- 2000-02-16 AU AU25614/00A patent/AU2561400A/en not_active Abandoned
- 2000-02-16 JP JP2000600105A patent/JP4527884B2/ja not_active Expired - Fee Related
- 2000-02-16 AT AT00903860T patent/ATE359517T1/de not_active IP Right Cessation
- 2000-02-16 EP EP00903860A patent/EP1153299B1/fr not_active Expired - Lifetime
- 2000-02-16 WO PCT/GB2000/000549 patent/WO2000049415A1/fr active IP Right Grant
- 2000-02-16 DE DE60034315T patent/DE60034315T2/de not_active Expired - Lifetime
Also Published As
| Publication number | Publication date |
|---|---|
| GB9903555D0 (en) | 1999-04-07 |
| ATE359517T1 (de) | 2007-05-15 |
| AU2561400A (en) | 2000-09-04 |
| JP4527884B2 (ja) | 2010-08-18 |
| US6730521B1 (en) | 2004-05-04 |
| JP2002537563A (ja) | 2002-11-05 |
| DE60034315T2 (de) | 2008-01-03 |
| DE60034315D1 (de) | 2007-05-24 |
| EP1153299A1 (fr) | 2001-11-14 |
| WO2000049415A1 (fr) | 2000-08-24 |
Similar Documents
| Publication | Publication Date | Title |
|---|---|---|
| EP1153299B1 (fr) | Procede et dispositif de dosage chimique et biochimique | |
| US20210311058A1 (en) | Methods and systems for extending dynamic range in assays for the detection of molecules or particles | |
| TW412637B (en) | Optical quantification of analytes in membranes | |
| US9643180B2 (en) | Method for detecting analytes | |
| US6713271B1 (en) | Systems and methods for performing magnetic chromatography assays | |
| CA2604434C (fr) | Dosages biologiques multifonctionnels pouvant etre configures | |
| JP2002507762A (ja) | 共焦点顕微鏡イメージングシステム | |
| US20080032281A1 (en) | Method and Device for Rapid Detection and Quantitation of Macro and Micro Matrices | |
| EP1239284A1 (fr) | Procédé de détection sans séparation et sytème utilisant des particules opaques | |
| JP2000221192A (ja) | 被検体、その相互作用又は反応動力学を定量的又は定性的に測定する方法及びサンプルキャリア |
Legal Events
| Date | Code | Title | Description |
|---|---|---|---|
| PUAI | Public reference made under article 153(3) epc to a published international application that has entered the european phase |
Free format text: ORIGINAL CODE: 0009012 |
|
| 17P | Request for examination filed |
Effective date: 20010718 |
|
| AK | Designated contracting states |
Kind code of ref document: A1 Designated state(s): AT BE CH CY DE DK ES FI FR GB GR IE IT LI LU MC NL PT SE |
|
| AX | Request for extension of the european patent |
Free format text: AL;LT;LV;MK;RO;SI |
|
| RAP1 | Party data changed (applicant data changed or rights of an application transferred) |
Owner name: TTP LABTECH LIMITED |
|
| GRAP | Despatch of communication of intention to grant a patent |
Free format text: ORIGINAL CODE: EPIDOSNIGR1 |
|
| GRAS | Grant fee paid |
Free format text: ORIGINAL CODE: EPIDOSNIGR3 |
|
| 17Q | First examination report despatched |
Effective date: 20060719 |
|
| GRAA | (expected) grant |
Free format text: ORIGINAL CODE: 0009210 |
|
| AK | Designated contracting states |
Kind code of ref document: B1 Designated state(s): AT BE CH CY DE DK ES FI FR GB GR IE IT LI LU MC NL PT SE |
|
| PG25 | Lapsed in a contracting state [announced via postgrant information from national office to epo] |
Ref country code: LI Free format text: LAPSE BECAUSE OF FAILURE TO SUBMIT A TRANSLATION OF THE DESCRIPTION OR TO PAY THE FEE WITHIN THE PRESCRIBED TIME-LIMIT Effective date: 20070411 Ref country code: FI Free format text: LAPSE BECAUSE OF FAILURE TO SUBMIT A TRANSLATION OF THE DESCRIPTION OR TO PAY THE FEE WITHIN THE PRESCRIBED TIME-LIMIT Effective date: 20070411 Ref country code: CH Free format text: LAPSE BECAUSE OF FAILURE TO SUBMIT A TRANSLATION OF THE DESCRIPTION OR TO PAY THE FEE WITHIN THE PRESCRIBED TIME-LIMIT Effective date: 20070411 |
|
| REG | Reference to a national code |
Ref country code: GB Ref legal event code: FG4D |
|
| REG | Reference to a national code |
Ref country code: CH Ref legal event code: EP |
|
| REG | Reference to a national code |
Ref country code: IE Ref legal event code: FG4D |
|
| REF | Corresponds to: |
Ref document number: 60034315 Country of ref document: DE Date of ref document: 20070524 Kind code of ref document: P |
|
| PG25 | Lapsed in a contracting state [announced via postgrant information from national office to epo] |
Ref country code: SE Free format text: LAPSE BECAUSE OF FAILURE TO SUBMIT A TRANSLATION OF THE DESCRIPTION OR TO PAY THE FEE WITHIN THE PRESCRIBED TIME-LIMIT Effective date: 20070711 |
|
| PG25 | Lapsed in a contracting state [announced via postgrant information from national office to epo] |
Ref country code: ES Free format text: LAPSE BECAUSE OF FAILURE TO SUBMIT A TRANSLATION OF THE DESCRIPTION OR TO PAY THE FEE WITHIN THE PRESCRIBED TIME-LIMIT Effective date: 20070722 |
|
| PG25 | Lapsed in a contracting state [announced via postgrant information from national office to epo] |
Ref country code: PT Free format text: LAPSE BECAUSE OF FAILURE TO SUBMIT A TRANSLATION OF THE DESCRIPTION OR TO PAY THE FEE WITHIN THE PRESCRIBED TIME-LIMIT Effective date: 20070911 |
|
| NLV1 | Nl: lapsed or annulled due to failure to fulfill the requirements of art. 29p and 29m of the patents act | ||
| ET | Fr: translation filed | ||
| REG | Reference to a national code |
Ref country code: CH Ref legal event code: PL |
|
| PG25 | Lapsed in a contracting state [announced via postgrant information from national office to epo] |
Ref country code: AT Free format text: LAPSE BECAUSE OF FAILURE TO SUBMIT A TRANSLATION OF THE DESCRIPTION OR TO PAY THE FEE WITHIN THE PRESCRIBED TIME-LIMIT Effective date: 20070411 |
|
| PG25 | Lapsed in a contracting state [announced via postgrant information from national office to epo] |
Ref country code: BE Free format text: LAPSE BECAUSE OF FAILURE TO SUBMIT A TRANSLATION OF THE DESCRIPTION OR TO PAY THE FEE WITHIN THE PRESCRIBED TIME-LIMIT Effective date: 20070411 |
|
| PG25 | Lapsed in a contracting state [announced via postgrant information from national office to epo] |
Ref country code: DK Free format text: LAPSE BECAUSE OF FAILURE TO SUBMIT A TRANSLATION OF THE DESCRIPTION OR TO PAY THE FEE WITHIN THE PRESCRIBED TIME-LIMIT Effective date: 20070411 Ref country code: NL Free format text: LAPSE BECAUSE OF FAILURE TO SUBMIT A TRANSLATION OF THE DESCRIPTION OR TO PAY THE FEE WITHIN THE PRESCRIBED TIME-LIMIT Effective date: 20070411 |
|
| PLBE | No opposition filed within time limit |
Free format text: ORIGINAL CODE: 0009261 |
|
| STAA | Information on the status of an ep patent application or granted ep patent |
Free format text: STATUS: NO OPPOSITION FILED WITHIN TIME LIMIT |
|
| 26N | No opposition filed |
Effective date: 20080114 |
|
| PG25 | Lapsed in a contracting state [announced via postgrant information from national office to epo] |
Ref country code: GR Free format text: LAPSE BECAUSE OF FAILURE TO SUBMIT A TRANSLATION OF THE DESCRIPTION OR TO PAY THE FEE WITHIN THE PRESCRIBED TIME-LIMIT Effective date: 20070712 |
|
| PG25 | Lapsed in a contracting state [announced via postgrant information from national office to epo] |
Ref country code: CY Free format text: LAPSE BECAUSE OF FAILURE TO SUBMIT A TRANSLATION OF THE DESCRIPTION OR TO PAY THE FEE WITHIN THE PRESCRIBED TIME-LIMIT Effective date: 20070411 |
|
| PG25 | Lapsed in a contracting state [announced via postgrant information from national office to epo] |
Ref country code: IT Free format text: LAPSE BECAUSE OF NON-PAYMENT OF DUE FEES Effective date: 20080229 |
|
| PGFP | Annual fee paid to national office [announced via postgrant information from national office to epo] |
Ref country code: FR Payment date: 20120221 Year of fee payment: 13 Ref country code: LU Payment date: 20120301 Year of fee payment: 13 Ref country code: IE Payment date: 20120208 Year of fee payment: 13 |
|
| PGFP | Annual fee paid to national office [announced via postgrant information from national office to epo] |
Ref country code: MC Payment date: 20121231 Year of fee payment: 14 |
|
| REG | Reference to a national code |
Ref country code: FR Ref legal event code: ST Effective date: 20131031 |
|
| REG | Reference to a national code |
Ref country code: IE Ref legal event code: MM4A |
|
| PG25 | Lapsed in a contracting state [announced via postgrant information from national office to epo] |
Ref country code: IE Free format text: LAPSE BECAUSE OF NON-PAYMENT OF DUE FEES Effective date: 20130216 Ref country code: FR Free format text: LAPSE BECAUSE OF NON-PAYMENT OF DUE FEES Effective date: 20130228 |
|
| PG25 | Lapsed in a contracting state [announced via postgrant information from national office to epo] |
Ref country code: MC Free format text: LAPSE BECAUSE OF NON-PAYMENT OF DUE FEES Effective date: 20140228 |
|
| PGFP | Annual fee paid to national office [announced via postgrant information from national office to epo] |
Ref country code: DE Payment date: 20150210 Year of fee payment: 16 |
|
| PG25 | Lapsed in a contracting state [announced via postgrant information from national office to epo] |
Ref country code: LU Free format text: LAPSE BECAUSE OF NON-PAYMENT OF DUE FEES Effective date: 20130216 |
|
| REG | Reference to a national code |
Ref country code: DE Ref legal event code: R119 Ref document number: 60034315 Country of ref document: DE |
|
| PG25 | Lapsed in a contracting state [announced via postgrant information from national office to epo] |
Ref country code: DE Free format text: LAPSE BECAUSE OF NON-PAYMENT OF DUE FEES Effective date: 20160901 |
|
| PGFP | Annual fee paid to national office [announced via postgrant information from national office to epo] |
Ref country code: GB Payment date: 20180214 Year of fee payment: 19 |
|
| GBPC | Gb: european patent ceased through non-payment of renewal fee |
Effective date: 20190216 |
|
| PG25 | Lapsed in a contracting state [announced via postgrant information from national office to epo] |
Ref country code: GB Free format text: LAPSE BECAUSE OF NON-PAYMENT OF DUE FEES Effective date: 20190216 |