EP0658751B1 - Korrektur von Spektren bezüglich Streustrahlung - Google Patents
Korrektur von Spektren bezüglich Streustrahlung Download PDFInfo
- Publication number
- EP0658751B1 EP0658751B1 EP94119876A EP94119876A EP0658751B1 EP 0658751 B1 EP0658751 B1 EP 0658751B1 EP 94119876 A EP94119876 A EP 94119876A EP 94119876 A EP94119876 A EP 94119876A EP 0658751 B1 EP0658751 B1 EP 0658751B1
- Authority
- EP
- European Patent Office
- Prior art keywords
- wavelength
- stray
- radiation
- data
- ordered
- Prior art date
- Legal status (The legal status is an assumption and is not a legal conclusion. Google has not performed a legal analysis and makes no representation as to the accuracy of the status listed.)
- Expired - Lifetime
Links
- 230000005855 radiation Effects 0.000 title claims description 150
- 238000012937 correction Methods 0.000 title claims description 40
- 238000001228 spectrum Methods 0.000 title claims description 19
- 230000003595 spectral effect Effects 0.000 claims description 118
- 230000000694 effects Effects 0.000 claims description 83
- 239000011159 matrix material Substances 0.000 claims description 41
- 238000000034 method Methods 0.000 claims description 33
- 239000000835 fiber Substances 0.000 claims description 15
- 238000010606 normalization Methods 0.000 claims description 15
- 239000013307 optical fiber Substances 0.000 claims description 11
- 108020003175 receptors Proteins 0.000 description 13
- 230000003287 optical effect Effects 0.000 description 12
- 239000006185 dispersion Substances 0.000 description 8
- 239000007788 liquid Substances 0.000 description 5
- 238000010586 diagram Methods 0.000 description 4
- 238000002834 transmittance Methods 0.000 description 4
- 230000008859 change Effects 0.000 description 3
- 230000006870 function Effects 0.000 description 3
- 238000002835 absorbance Methods 0.000 description 2
- 238000010521 absorption reaction Methods 0.000 description 2
- 238000003705 background correction Methods 0.000 description 2
- 230000008901 benefit Effects 0.000 description 2
- 230000008521 reorganization Effects 0.000 description 2
- 239000007787 solid Substances 0.000 description 2
- 238000004164 analytical calibration Methods 0.000 description 1
- 238000013459 approach Methods 0.000 description 1
- 238000004364 calculation method Methods 0.000 description 1
- 238000007796 conventional method Methods 0.000 description 1
- 238000005516 engineering process Methods 0.000 description 1
- 238000013213 extrapolation Methods 0.000 description 1
- 238000009499 grossing Methods 0.000 description 1
- 229910052736 halogen Inorganic materials 0.000 description 1
- 230000010354 integration Effects 0.000 description 1
- 238000004020 luminiscence type Methods 0.000 description 1
- 238000005259 measurement Methods 0.000 description 1
- 238000012986 modification Methods 0.000 description 1
- 230000004048 modification Effects 0.000 description 1
- 108091008695 photoreceptors Proteins 0.000 description 1
- 238000012545 processing Methods 0.000 description 1
- 230000009467 reduction Effects 0.000 description 1
- 230000035945 sensitivity Effects 0.000 description 1
- 238000010183 spectrum analysis Methods 0.000 description 1
- 238000006467 substitution reaction Methods 0.000 description 1
- 230000009466 transformation Effects 0.000 description 1
Images


Classifications
-
- G—PHYSICS
- G01—MEASURING; TESTING
- G01J—MEASUREMENT OF INTENSITY, VELOCITY, SPECTRAL CONTENT, POLARISATION, PHASE OR PULSE CHARACTERISTICS OF INFRARED, VISIBLE OR ULTRAVIOLET LIGHT; COLORIMETRY; RADIATION PYROMETRY
- G01J3/00—Spectrometry; Spectrophotometry; Monochromators; Measuring colours
- G01J3/28—Investigating the spectrum
- G01J2003/2866—Markers; Calibrating of scan
Definitions
- This invention relates to spectrometric instruments, and particularly to making corrections for stray radiation in such instruments.
- Spectrometric instruments generally function to provide a spectral analysis of radiation pertaining to a sample or an astronomical source.
- the radiation source and/or the sample may be internal or external to the instrument.
- the instrument includes a wavelength analyzer, which comprises a spectral dispersion element such as a prism or, more commonly in precision instruments, an optical grating.
- the analyzer further includes a detector system.
- the detector has a single photosensitive component with a narrow entrance slit, and the dispersion element is mechanically rotated to scan a range of radiation wavelengths over the detector.
- the detector has an array of photosensitive pixel areas for detecting spectral increments across the range simultaneously.
- Array detectors have been made practical in solid state devices providing small adjacent pixels. The array may be either linear to receive a spectrum from a single dispersion element, or two dimensional for crossed dispersion elements. A two dimensional detector is disclosed in U.S. patent No. 4,820,048 (Barnard).
- Modern precision spectrometric instruments include computer programming for calibration and treatment of the spectral information.
- U.S. patent No. 5,229,838 (Ganz et al) illustrates a grating with an array detector and teaches a system for calibrating amplitude linearity, and also teaches a particular type of instrument in which optical fibers are utilized to convey source radiation to a remote sample of liquid and back to the analyzer.
- U.S. patent application serial No. 834,448 filed February 12, 1992 (Tracy et al), of the present assignee, discloses instrument standardization using computer programming, and also illustrates correction for background which generally represents radiation and instrument noise without the source in place.
- U.S. patent No. 5,023,804 (Hoult) teaches a method and apparatus for comparing spectra by means of computer programming.
- objects of the invention are to provide a novel method and a novel apparatus to determine and correct for stray radiation in a spectrometric instrument.
- a further object is to provide improved spectral data that is corrected for stray radiation.
- a method of correcting for stray radiation in a spectrum generated by a spectrometric instrument that includes a wavelength analyzer for effecting spectral data representative of spectral intensities in wavelength increments at ordered wavelengths across a spectral range.
- a plurality of calibration wavelengths distributed across the spectral range is selected, the number of such wavelengths advantageously being substantially less than the number of ordered wavelengths.
- substantially monochromatic radiation is directed to the analyzer so as to effect an initial pattern of spectral data for the wavelength increments.
- the initial pattern has a peak profile at the calibration wavelength and is representative of stray radiation away from the peak profile.
- the initial pattern is normalized to effect a normalized pattern having a normalized peak profile. Away from the peak profile, the normalized pattern represents the proportion of the detected radiation of the calibration wavelength which is detected as stray radiation at each wavelength increment.
- the normalized peak profile is deleted from the normalized pattern to effect a remaining pattern.
- the peak profile may be delineated by fitting the initial pattern to a peak curve such as a Gaussian, determining a cutoff point on each side of the curve where data error from the curve exceeds a selected limit such as three times the noise level, and utilizing the cutoff points to delineate the peak profile therebetween.
- a peak curve such as a Gaussian
- a substitute profile is substituted for the normalized peak profile.
- the substitute is based on the remaining pattern, preferably by curve fitting to nearby points.
- a resulting pattern of correction data is effected, the pattern being representative of stray radiation.
- the correction data of each pattern is identified to the associated calibration wavelength and to respective wavelength increments.
- each wavelength increment has an associated set of correction data for the calibration wavelengths.
- the set of correction data is interpolated from the calibration wavelengths to the ordered wavelengths to effect stray proportions of radiation identified to the wavelength increment and respectively to the ordered wavelengths.
- Such an interpolation is not necessary in the embodiment wherein the number of selected wavelengths is equal to the number of ordered wavelengths. It is useful to recognize that the ordered wavelengths represent source wavelengths for stray radiation, and the wavelength increments function as receptor increments of the stray. Thus each ordered wavelength has an associated set of stray proportions identified thereto, these proportions also being identified respectively to the wavelength increments.
- the spectrometric instrument is operated with radiation from a sample source to effect spectral sample data for the wavelength increments and correspondingly for the ordered wavelengths. For each ordered wavelength, corresponding sample data is multiplied by each stray proportion identified to the ordered wavelength to effect stray portions of radiation identified to the ordered wavelength and respectively to the wavelength increments. Each wavelength increment thereby has an associated set of stray portions identified thereto.
- the stray portions identified thereto are summed to effect a total portion of stray radiation for the wavelength increment.
- the total portion is subtracted from the sample data of the wavelength increment, to effect corrected data.
- a set of corrected data effected for all wavelength increments is thereby representative of a spectrum of the sample radiation corrected for stray radiation.
- Objects are also achieved by an apparatus for correcting for stray radiation in a spectrum generated by a spectrometric instrument that includes a wavelength analyzer for effecting spectral data representative of spectral intensities in wavelength increments at ordered wavelengths across a spectral range.
- the instrument is operable with radiation from a sample source to effect spectral sample data for the wavelength increments and correspondingly for the ordered wavelengths.
- the apparatus comprises a source of monochromatic radiation operably disposed to direct substantially monochromatic radiation to the analyzer at each of a preselected plurality of calibration wavelengths distributed across the spectral range such that, for each calibration wavelength, an initial pattern of spectral data is effected for the wavelength increments.
- the initial pattern has a peak profile at the calibration wavelength and is representative of stray radiation away from the peak profile.
- the apparatus further comprises means for normalizing the initial pattern to effect a normalized pattern, means for deleting the normalized peak profile from the normalized pattern to effect a remaining pattern for each calibration wavelength, and means for substituting for each normalized peak profile a substitute profile based on the remaining pattern so as to effect a pattern of correction data representative of stray radiation.
- the correction data is identified to a calibration wavelength and respectively to the wavelength increments, whereby each receptor increment has an associated set of correction data for the calibration wavelengths.
- the apparatus further comprises means for interpolating the set of correction data for each receptor increment from the calibration wavelengths to the ordered wavelengths to effect stray proportions of radiation identified to the receptor increment and respectively to the ordered wavelengths.
- Each ordered wavelength has an associated set of stray proportions identified thereto and respectively to the wavelength increments.
- the apparatus further comprises means for multiplying, summing and subtracting.
- Sample data is multiplied, for each wavelength increment and corresponding ordered wavelength, by each stray proportion identified to the ordered wavelength to effect stray portions of radiation identified to the ordered wavelength and respectively to the wavelength increments, whereby each wavelength increment has an associated set of stray portions identified thereto.
- the stray portions identified to each wavelength increment are summed to effect a total portion of stray radiation for the wavelength increment.
- the total portion for each wavelength increment is subtracted from corresponding sample data to effect corrected data for each receptor increment.
- a set of corrected data is thereby effected for the wavelength increments, representative of a spectrum of the sample radiation corrected for stray radiation.
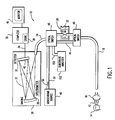
- FIG. 1 is a schematic drawing of spectrometric apparatus incorporating the invention.
- FIGS. 2A and 2B are flow diagrams of a method and means for carrying out the invention.
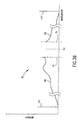
- FIGS. 3A, 3B and 3C are a sequence of spectral profiles illustrating an aspect of the invention.
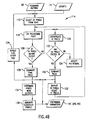
- FIGS. 4A and 4B are flow diagrams showing a preferred method and means for carrying out the invention.
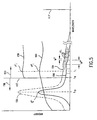
- FIG. 5 shows spectral profiles and peaks near a spectral range limit.
- FIG. 6 is a flow diagram of a method and means for a further aspect of the invention.
- the invention may be utilized generally with any conventional or desired spectrometric instrument that includes a wavelength analyzer for effecting spectral data representative of spectral intensities in wavelength increments at corresponding wavelengths ordered across a spectral range in ultraviolet, visible and/or infrared.
- a wavelength analyzer for effecting spectral data representative of spectral intensities in wavelength increments at corresponding wavelengths ordered across a spectral range in ultraviolet, visible and/or infrared.
- an instrument may be a spectrophotometer for analyzing spectral absorbance, diffuse or spectral reflectance, luminescence such as molecular fluorescence and phosphorescence, or liquid chromatographic spectral absorption.
- the associated spectral analyzer of the instrument may comprise, for example, an optical grating, a prism, an acousto-optic tunable filter, or a scanning Fabry-Perot interferometer.
- FIG. 1 illustrates such an instrument 10 which is a spectrophotometer for analyzing spectral absorption of a liquid at a location remote from the instrument, such as a Perkin-Elmer PIONIR 1024 (TM).
- TM Perkin-Elmer PIONIR 1024
- This has a diode array type of detector for which the invention is particularly useful, but the invention also is applicable to scanning instruments having a single photoreceptor type of detector and a scanning dispersion element. Operation may be generally similar to that described in the aforementioned U.S. patent No. 5,229,838.
- Radiation 12 from a broad-band light source 14 is imaged by a lens 16 onto an optical fiber 18 which carries the light to a remote location 20 where it is passed through a sample liquid 22 before being picked up by a second optical fiber 24 and returned to the wavelength analyzing section 26 of the instrument.
- Various lenses may be included conventionally in the optical train.
- the radiation is directed to a concave optical grating 28 which disperses the radiation into a spectrum 30 that is received by a detector 32 .
- Signals from the detector representing intensity versus wavelength are passed on an electrical line 34 to a data processor 36 where the signals are amplified and modified as appropriate, stored in memory 38 and eventually processed to provide output information.
- Transmitted intensity data representing a spectrum characteristic of the sample liquid may converted to absorbance data by applying a logarithm computation. Results after background correction and comparison with a standard are generally displayed on a monitor screen 40 and/or printed out.
- the detector 32 is typically a solid state type such as a charge coupled detector (CCD) that has an array of photosensitive pixel receptors 42 that detect and generate signals representative of spectral intensities for corresponding wavelength increments dispersed from the grating and centered on corresponding wavelengths ordered across a spectral range.
- Pixel size may be about 25 ⁇ m.
- Wavelength increment size is proportional to the pixel size and inversely proportional to the grating dispersion; for example, the wavelength increment may be 0.3 nm.
- the detector has a linear array of pixels in the form of a single row of 1024 pixels disposed to define the spectral range of the instrument from about 800 to 1100 nm wavelength spectral range.
- An additional optical fiber 44 may be inserted to bypass the sample with non-absorbed radiation to the analyzing section.
- the instrument is then operated via optical switches 46 with each fiber line to generate spectral intensity data, in each case with and without the light source.
- the optical switching 46 may be combined in a single unit and may comprise a beam splitter and shutter system not requiring the separate fiber 44 .
- Data without the source sometimes denoted "dark", accounts for background which is subtracted from each set of sample data to provide a corrected intensity. Transmittance ordinarily is computed as the ratio of corrected intensities for the sample and the bypass fiber.
- a further correction is made to each of the intensities to account for stray radiation within the instrument.
- the correction is preferably made to intensity data before the transmittance computation.
- stray is radiation from each wavelength being spread by scattering from an imperfect grating and from reflections in the instrument to pixel locations not centered on that wavelength.
- Correction for stray is made by utilizing a substantially monochromatic source 48 of radiation 50 for a selected plurality (e.g. 151) of calibration wavelengths distributed across the spectral range of the instrument.
- calibration wavelengths herein refers to calibration for stray radiation, and not to ordinary instrument calibration which is outside the present realm.
- a suitable source is a double monochromator, i.e. a pair of sequenced dispersion gratings, for example a Model 77274 of Oriel Corp., Stratford, Connecticut.
- the monochromatic source 48 is arranged with the main instrument 10 to direct substantially monochromatic radiation to the analyzer section 26 .
- the band pass of this source should be as small as practical while providing sufficient intensity, e.g. about 1 nm.
- This source should pass its radiation first through an optical system that fills the wavelength analyzer in substantially the same way as the substituted section of the instrument, preferably by using the same type of optical fiber and any associated lenses.
- One way (not shown) is to substitute the monochromatic source for the broad-spectrum source in the instrument. In such case it is further possible but not necessary to include the sample section in the optical train.
- a separate optical train is utilized with the monochromatic source 48 to essentially duplicate the main optical train without the sample section.
- the source 48 passes its monochromatic radiation 50 through an optical fiber system including an optical fiber 51 having the same core size and numerical aperture as the instrument fibers 18 , 24 and associated lenses (if any; none shown) the same as instrument lenses.
- the fiber 51 is shown connected through optical switching 46 .
- FIGS. 2A and 2B show flow diagrams of the sequential means for carrying out the invention with computer 36 .
- Computations include approximations.
- the programming means for carrying out computations of the invention are conveniently and readily achieved with a conventional computer language such as "C” generally available through the supplier of the operating system utilized with the computer.
- the overall program may be compiled, for example, on a Digital Equipment Corporation Model 466 computer that may be associated with the instrument. Such program is incorporated advantageously into the master program that is utilized in the operation of the instrument and the processing of spectral data therein.
- a plurality of calibration wavelengths distributed across the spectral range is preselected 62 .
- the number of such wavelengths may be equal to the number of wavelength increments (pixels), i.e. 1024, and the calibration wavelengths may even coincide with the ordered wavelengths, but this is likely to require an excessive number of calibration runs. It is more practical, and sufficiently accurate, to utilize fewer than half as many, such as 151 calibration wavelengths, and then interpolate the results. In general the number should be as small as practical but sufficiently large to capture any important spectral structures in the instrument profile.
- the monochromatic source 48 (FIG. 1) is operated 63 cooperatively with the instrument 10 to provide the calibration wavelengths as indicated above.
- radiation 50 (FIG. 1) having this wavelength is directed into the wavelength analyzer 26 so as to effect an initial pattern 64 of spectral data for all of the wavelength increments across a selected spectral range (usually the instrument range).
- This pattern (FIG. 3A) will have a peak profile 66 at the calibration wavelength L C .
- the remainder of the pattern 68 away from the peak profile represents further radiation at the calibration wavelength (although detected by pixels not positioned at that wavelength), and such remainder is representative of stray radiation.
- the stray data, for each wavelength increment (receptor), is first normalized 65 to effect a normalized pattern 64 ' that includes a normalized peak profile.
- a normalized pattern 64 ' that includes a normalized peak profile.
- FIGS. 3A, 3B and 3C are also representative of normalized data.
- Normalizing is defined and effected in the usual manner, being the data value for each ordered wavelength divided by the integration or total of all such data values in the stray data set for the calibration wavelength, said total being the sum for all increments across of the spectral range, generally the total radiation.
- Such integrated or summed total is the area under a curve representing the stray data.
- a normalization factor is the reciprocal of the area.
- this peak is deleted 70 from the normalized pattern between selected cutoff wavelengths 71 to effect the remaining pattern 68 (FIG. 3B).
- a substitute profile 72 (FIG. 3C) to replace the peak is determined 73 and inserted 69 into the remaining pattern 68 at a level based on the remaining pattern, the substitute being significantly lower than the original peak.
- the exact form or level of the substitute is not critical.
- One example of the substitute is a straight line at about the average level of the two portions 75 of remaining pattern that are adjacent to the peak profile on both sides thereof. A preferred determination of a substitute profile is described herein below.
- correction data 76 representative of stray radiation, there being a separate similar pattern for each calibration wavelength.
- Correction data representative of stray radiation for each calibration wavelength is determined across the wavelength increments of the spectral range. At this stage it is useful to recognize these wavelength increments as having a function as receptor increments of stray radiation. By reorganizing the data (at least conceptually), it may be seen that each receptor increment has an associated set of correction data for the various calibration wavelengths.
- the correction data may consist of polynomial parameters as explained later herein.
- the next step of interpolation 78 is deemed to have been accomplished. For a lessor number of calibration wavelengths, actual interpolation is effected. Also, calibration wavelengths generally will not be exactly the same as the ordered wavelengths corresponding to the wavelength increments, further necessitating interpolation. It is further useful to recognize the ordered wavelengths as representing source wavelengths of stray radiation that is scattered to each of the wavelength increments functioning as receptor increments receiving the stray.
- the set of correction data is interpolated 78 to the ordered wavelengths (sources). This effects a set of stray proportions of radiation 84 identified to the wavelength increment (receptor) ( ⁇ L) and to respective ordered wavelengths (sources) (L j ). Interpolation values may be estimated or simply an adoption of adjacent values; however, with computer programming, more direct methods are convenient and more accurate.
- the data for the stray proportions 84 may be stored as a full matrix set of data values equal in number to the square of the number of wavelength increments, e.g. 1024x1024 (without end effects discussed below). However, it is advantageous to curve-fit the data and store only the curve parameters, as illustrated below.
- the stray proportion values are preferably stored to be available for future correction of sample spectra on a real time basis. Recalibration is not necessary unless there is reason to believe a change has occurred in the instrument, for example, a change in the dispersion grating or a baffle or any other surface that may change stray light to the detector.
- the spectrophotometer is operated 87 with radiation from its normal source through a sample (which for the present purpose may be an actual sample, a standard or a run without an actual sample) to effect spectral sample data 88 (preferably corrected for background) for each ordered wavelength across the spectral range.
- spectral sample data 88 preferably corrected for background
- For each wavelength increment considering the corresponding ordered wavelength as a source wavelength, corresponding sample data 88 are multiplied 90 by each stray proportion 84 identified to the ordered wavelength to effect stray portions 92 of the actual radiation coming from the source wavelength and scattered to other wavelength increments. The stray portion is thus identified to the ordered wavelength and to the wavelength increments across the spectral range.
- each wavelength increment has an associated set of stray portions.
- all stray portions in the set are summed 94 over the ordered wavelengths (sources) to effect a total portion 96 of stray radiation scattered to the wavelength increment.
- this result is a vector that is a dot product of the stray proportion matrix and the sample data vector.
- the total portion of stray radiation is subtracted 98 from the sample data for the source increment to effect corrected data for each wavelength increment.
- the corrected data 100 for all of the increments (pixels) across the spectral range are thereby representative of a spectrum of the sample radiation corrected for stray radiation.
- the stray correction should also be applied to standard runs or runs without the sample, after the ordinary dark or background correction to each.
- the corrected intensities with and without sample (or with sample and standard) are then ratioed conventionally to obtain relative transmittance values for the wavelength increments (pixels) across the spectral range.
- FIGS. 4A and 4B (along with FIG. 3A) show an example of a preferred procedure and means for carrying out computations for the foregoing calibration for an initial pattern (from which background has been subtracted) for monochromatic radiation.
- the peak profile centers at the wavelength L C of the monochromatic radiation.
- the initial pattern 64 is normalized 65 to a normalized pattern 64 ' as explained for FIG. 2B.
- a Gaussian peak 101 is fitted 102 by least squares to the normalized pattern for the full spectral range. More generally any peak type of curve such as a parabola may be utilized, but Gaussian is particularly suitable.
- Cutoffs 71 are determined 104 at a point on each side of the Gaussian peak where the differences 112 between the data and the fitted curve exceed a preselected limit such as three times a root-mean-square noise level. Data inside of the cutoffs are deleted 106 to effect the remaining pattern 68 (also FIG. 3B).
- a polynomial curve is generated 114 in a convention manner with the spectral data of the remaining pattern 68 , as follows: A "piecewise" third-order polynomial curve is advantageous (FIG. 4B).
- This polynomial piece is repeatedly extrapolated 120 another 16 pixels until an error exceeds the three-times limit, in which case this polynomial is terminated 126 before the last extrapolation.
- the polynomial is terminated 130 earlier if it reaches 128 a point 16 pixels before the cutoff 71 (FIG. 3A) at the deleted peak profile.
- a new start for the next piece is taken from a point backed up 16 pixels from the termination, and data for 32 pixels from the new start 132 generate a new polynomial fit 118 which is extrapolated and compared in the same manner as the first piece.
- This next piece is continued until it, too, is terminated by an error determination, or until it first reaches the point 16 pixels before the cutoff for the peak profile.
- the new polynomial is terminated by the error determination, the procedure is repeated again with one or more further polynomials until the point before cutoff is reached 130 .
- the successive pieces 113 (FIG.
- the actual number of pixels used to determine the substitute profile is preferably as small as possible, so as to retain only those proximate the cutoffs, while retaining a statistically significant number.
- a useful guideline is to use about double the same number on either side of a cutoff as the number of pixels of spread due to the band pass of the system (8 in the present example). At this point a set of piecewise, normalized, polynomial parameters 140 has been generated.
- the total number of pieces of polynomial on both sides will depend on the instrument and the nature of the stray radiation therein. In the present instance, it has been found that 10 pieces of polynomial are developed resulting in 40 parameters (instead of 1024) for each of the 151 calibration wavelengths. However, such set of 40 parameters is needed for each of the pixels (1024 wavelength increments). Therefore, these normalized parameters 140 are interpolated 144 (FIG. 4A) to the corresponding wavelengths of the increments (pixels) from those for the calibration wavelengths by any conventional method such as cubic spline. Normalized correction parameters 146 for the wavelength increments are thereby determined, representing the stray proportions 84 .
- FIG. 5 shows an example for a low wavelength end of the limited spectral range, where a peak profile 150 from monochromatic light below the range limit 117 (L R ) is not detected by the wavelength analyzer, although the stray radiation 154 of this low wavelength is detected in the analyzer wavelength range.
- L R range limit
- stray radiation 154 of this low wavelength is detected in the analyzer wavelength range.
- a more accurate normalization involves generating further spectral data with the monochromatic source at one or more calibration wavelengths in each of the one or two extended spectral regions outside of the instrument spectral range limits, e.g. extending 293 ordered wavelengths below the range and 146 above it.
- a normalized factor is determined by making separate measurements with a substitute wavelength analyzer 152 (FIG. 1) that is calibrated by wavelength relative to the wavelength analyzer of the spectrometric instrument.
- the substitute need not be as accurate as the spectrometric instrument, but has a broader spectral range to encompass at least a relevant portion of that of the instrument plus the extended range(s).
- the encompassing should substantially include the extended pattern of spectral data explained below.
- a single scanning monochromator Model 77250 of Oriel Corp., Stanford, Connecticut is suitable for the substitute. Radiation from the double monochromator 48 is directed to the substitute analyzer 152 via the fiber 51 and a fiber 153 , for example through switch 46 as shown. However, as indicated above, it is advantageous to connect these fibers directly together by means of a conventional coupler, bypassing a switch.
- At least one additional calibration wavelength L O is selected in an extended range 158 (FIG. 5) outside of the limited spectral range 153 but generally near the range limit, for example at 790 nm where the lower limit L R is 800 nm.
- substantially monochromatic radiation is directed from the monochromatic source 48 at the outside wavelength L O to the wavelength analyzer so as to effect a stray pattern 154 of spectral data for the wavelength increments ⁇ L' s.
- This stray pattern is representative of stray radiation within the limited range (between 117 and 117 ' in FIG. 3C) and is included as added data in the set of correction data.
- a further wavelength L i is selected inside of the limited range but proximate the range limit L R .
- proximate wavelength may be, for example, 805 nm where the lower limit of the spectral range is 800 nm.
- Radiation from the source 14 (FIG. 1) of the instrument is measured 161 at the proximate wavelength L i by the wavelength analyzer 26 of the instrument so as to effect a profile 159 with first data value P I i at the proximate wavelength.
- the same radiation is also directed from source 14 to the substitute wavelength analyzer 152 so as to effect a profile 164 (FIG. 5) with a second data value P S i at the proximate wavelength.
- the superscript "I” refers to instrument data
- S refers to substitute analyzer data.
- the substantially monochromatic radiation at the outside calibration wavelength L O is also directed 163 into the substitute analyzer so as to effect a broadened pattern 156 of spectral data in the extended spectral range 158 and at least a portion of the limited range 153 .
- This extended pattern is integrated, for example by totalling all individual values, so as to compute 164 the area of a curve representing the pattern, the reciprocal of the area being a normalization factor N S for that curve.
- the stray data 154 can be normalized with the same factor N to effect the stray proportions, or the equivalent parameters thereof, in the spectral range 153 of the instrument by using calibration wavelengths to account for stray radiation originating outside of but proximate to this range.
- a further approximation is made for the step of effecting the stray portions of radiation from actual sample data, wherein as previously indicated, sample data for each ordered wavelength is multiplied by the stray proportions to effect stray portions of radiation identified to the ordered wavelength and the wavelength increments.
- sample data for each ordered wavelength is multiplied by the stray proportions to effect stray portions of radiation identified to the ordered wavelength and the wavelength increments.
- a further estimate (FIG. 6) for a sample data run 88 utilizes the above-described second data value P S i taken with the substitute analyzer at the inside wavelength L i , and a third peak value P S o measured 163 by the substitute analyzer for the monochromatic radiation at the selected calibration wavelength L o outside of the range limit.
- the third peak value is part of or readily derived from the broadened pattern 156 of spectral data.
- This additional value is included 170 into the spectral sample data 64 for use in determining the stray portions as described herein above.
- a plurality of such additional sample values are obtained for a corresponding plurality of ordered wavelengths extending outside of the spectral range limit as far as necessary to account for significant stray radiation scattered from outside wavelengths into the pixels for the limited spectral range.
- the range may extend down to 700 nm where the lower instrument limit is 800 nm, and up to 1150 nm where the upper instrument limit is 1100 nm. Extensions of the ordered wavelengths to be interpolated are included with the ordered wavelengths and, also, the one or more outside calibration wavelengths are included with the originally selected calibration wavelengths for the purpose of determining stray portions of radiation in the limited range.
- Monochromatic radiation is directed to the substitute analyzer at each of the plurality of extended wavelengths so as to effect the plurality of third peak values for the extended ordered wavelengths.
- the corresponding plurality of outside sample data values are computed from the above equation for D o . Interpolations are applied as needed to adjust these values to the set of extended ordered wavelengths.
- outside sample data values are all included with the spectral sample data in the step of multiplying such data by the stray proportions identified to an ordered wavelength (including an extended ordered wavelength) to effect stray portions further identified to the wavelength increments inside the limited spectral range.
- the next steps of summing and subtracting are effected as in the basic aspects of the invention.
- polynomial parameters may be stored for producing the stray proportions in real time to apply to sample data to yield the stray portions.
- An alternative is to store the matrix of stray proportions. In either case, the computation time on the sample data may be significant.
- the basic matrix of stray proportions is, for the present example, 1024x1463 where the 1463 is 1024 expanded by the 293+146 interpolated increments for calibrations outside of the instrument range. This may be reduced to a 1024x1024 matrix by summing the first 293 and last 146 columns of the matrix, but a large number of computations is still required.
- the matrix of stray proportions is reduced further for application to only a selected portion of the pixel data distributed across the spectral range, for example every eighth pixel (ordered wavelength). Interpolation by the Lagrange method or the like then approximates the values for the stray portions for the pixels between the selected pixels. Polynomial coefficients representing the stray proportions are used in place of the actual proportions, and all computations leading to the reduced new matrix are performed initially (e.g. at the factory). The reduced matrix is then stored and applied to the fraction of data in real time to produce polynomial coefficients of stray portions, and the stray portions are calculated from these.
- Q 128,1 is a reduced data vector of sample data for 128 selected pixels (every eighth)
- L 1024,128 is a matrix ("L matrix") for interpolation
- P 1024,1 is an approximation of the sample data vector for purposes of computing an approximation for S
- P 1024,1 L 1024,128 ⁇ Q 128,1
- a Lagrange transformation is suitable for deriving the L matrix by establishing weight coefficients with polynomials. For example linear coefficients may be established for interpolating between pairs of selected pixels.
- a second (or higher) order polynomial uses data for three (or more) successive pixels for each group of interpolations. For second order, for example, a group may consist of the center pixel, the four pixels below it and the three pixels above it. The next group is similarly centered on the next pixel.
- a resulting L matrix is shown below, where a1...c8 is a repeating submatrix, and q1...u3 is an end matrix at each end.
- the 8x3 submatrix a1...c8 consists of the Lagrange interpolation coefficients for the eight interpolated values in the center of the range defined by the three interpolation points (i.e. the three adjacent matrix values).
- the 5x3 end matrix values are the Lagrange interpolation values at the beginning and end of the range defined by three interpolation points.
- the benefit is that the number of columns in the N matrix is 1/8 that of the M matrix. This reduces the amount of real time calculation eightfold. Another eightfold reduction is achieved by using the coefficients of the piecewise polynomial representation of the stray proportions rather than the stray proportions themselves. This reduces the number of rows in the M and N matrices from 1024 to 128.
- Tables 1 and 2 give matrix values for the present example. 1 2 3 q 1.0000 0 0 r 0.8203 0.2344 -0.0547 s 0.6563 0.4375 -0.0939 t 0.5078 0.6094 -0.1172 u 0.3750 0.7500 -0.1250 a b c 1 0.2578 0.8594 -0.1172 2 0.1563 0.9375 -0.0938 3 0.0703 0.9844 -0.0547 4 0 1.0000 0 5 -0.0547 0.9844 0.0703 6 -0.0938 0.9375 0.1563 7 -0.1172 0.8594 0.2578 8 -0.1250 0.7500 0.3750 While the invention has been described above in detail with reference to specific embodiments, various changes and modifications which may fall within the scope of the appended claims will become apparent to those skilled in this art. The invention being limited by the appended claims only.
Landscapes
- Physics & Mathematics (AREA)
- Spectroscopy & Molecular Physics (AREA)
- General Physics & Mathematics (AREA)
- Investigating Or Analysing Materials By Optical Means (AREA)
- Spectrometry And Color Measurement (AREA)
Claims (34)
- Ein Verfahren zum Korrigieren von Streustrahlung in einem Spektrum, das durch ein spektrometrisches Instrument erzeugt worden ist, welches einen Wellenlängenanalysator zum Erzeugen spektraler Daten, die repräsentativ für spektrale Intensitäten in Wellenlängeninkrementen bei geordneten Wellenlängen über einen Spektralbereich sind, umfaßt, wobei das Verfahren aufweist:Auswählen einer Mehrzahl von Kalibrationswellenlängen, die über den Spektralbereich verteilt sind,für jede Kalibrationswellenlänge:Richten von im wesentlichen monochromatischer Strahlung bei der Kalibrationswellenlänge auf den Analysator, um so ein Anfangsmuster aus Spektraldaten für die Wellenlängeninkremente zu erzeugen, wobei das Anfangsmuster ein Peakprofil bei der Kalibrationswellenlänge aufweist und in vom Peakprofil entfernten Bereichen für Streustrahlung repräsentativ ist;Normalisieren des Anfangsmusters zum Erzeugen eines normalisierten Musters mit einem normalisierten Peakprofil;Entfernen des normalisierten Peakprofils aus dem normalisierten Muster zum Erzeugen eines Restmusters; undErsetzen des normalisierten Peakprofils durcn ein Ersatzprofil, basierend auf dem Restmuster, so daß ein Muster aus Korrekturdaten, die für die Streustrahlung repräsentativ sind, hervorgerufen wird, wobei die Korrekturdaten mit der Kalibrationswellenlänge und entsprechend mit den Wellenlängeninkrementen identifiziert sind, wodurch jedes Wellenlängeninkrement einen assoziierten Satz von Korrekturdaten für die Kalibrationswellenlängen aufweist;für jedes Wellenlängeninkrement, ein Interpolieren des Satzes der Korrekturdaten für die Kalibrationswellenlängen auf die geordneten Wellenlängen, so daß Streustrahlungsverhältnisse, die mit dem Wellenlängeninkrement und entsprechend mit den geordneten Wellenlängen identifiziert sind, erzeugt werden, wodurch die geordneten Wellenlängen Quellenwellenlängen darstellen, die Wellenlängeninkremente als Rezeptorinkremente fungieren und jede geordnete Wellenlänge einen assoziierten Satz von Streustrahlungsverhältnissen, die damit und entsprechend mit den Wellenlängeninkrementen identifiziert sind, aufweist;Betreiben des spektrometrischen Instruments mit Strahlung aus einer Probenquelle zum Erzeugen von Probenspektraldaten für die Wellenlängeninkremente und entsprechend für die geordneten Wellenlängen;für jede geordnete Wellenlänge, ein Multiplizieren entsprechender Probendaten mit jedem Streustrahlungsverhältnis, das mit der geordneten Wellenlänge identifiziert ist, so daß Streustrahlungsanteile, die mit der geordneten Wellenlänge und entsprechend mit den Wellenlängeninkrementen identifiziert sind, erzeugt werden, wodurch jedes Wellenlängeninkrement einen assoziierten Satz von Streustrahlungsanteilen, die mit diesem identifiziert sind, aufweist; undfür jedes Wellenlängeninkrement:Addieren der Streustrahlungsanteile, die mit dem Wellenlängeninkrement identifiziert sind, so daß ein Gesamtanteil an Streustrahlung für das Wellenlängeninkrement ermittelt wird; undSubtrahieren des Gesamtanteils von den Probendaten, so daß korrigierte Daten für das Wellenlängeninkrement erhalten werden;wodurch ein Satz korrigierter Daten, der für die Wellenlängeninkremente erhalten worden ist, für ein Spektrum der Probenstrahlung, das in bezug auf Streustrahlung korrigiert ist, repräsentativ ist.
- Das Verfahren nach Anspruch 1, in welchem die geordneten Wellenlängen eine vorbestimmte Anzahl derselben über den Spektralbereich verteilt aufweisen, und die ausgewählte Mehrzahl von Wellenlängen kleiner als die vorbestimmte Anzahl ist.
- Das Verfahren nach Anspruch 2, in welchem die ausgewählte Mehrzahl von Wellenlängen weniger als die Hälfte der vorbestimmten Anzahl ist.
- Das Verfahren nach Anspruch 1, in welchem der Wellenlängenanalysator einen Detektor mit einem Feld fotoempfindlicher Pixel, welche den Wellenlängeninkrementen entsprechen, aufweist.
- Das Verfahren nach Anspruch 1, weiter umfassend ein Speichern der Streustrahlungsverhältnisse, und in welchem die Schritte des Multiplizierens, Summierens und Subtrahierens in Realzeitbasis durchgeführt werden.
- Das Verfahren nach Anspruch 1, weiter umfassend ein Fitten bzw. Anpassen des Restmusters an eine Polynomkurve, die für das Restmuster repräsentativ ist, und ein Fitten der Spektraldaten des Restmusters in der Nähe des entfernten Peakprofils an ein weiteres Polynom, das repräsentativ für das Ersatzprofil ist, derart, daß Polynomparameter, welche die Polynomkurve definieren, und das weitere Polynom die Korrekturdaten für jede Kalibrationswellenlänge darstellen, in welchem der Schritt des Interpolierens ein Interpolieren der Polynomparameter auf die geordneten Wellenlängen und ein Berechnen der Streustrahlungsverhältnisse aus den interpolieren Polynomparametern umfaßt.
- Das Verfahren nach Anspruch 6, in welchem die Polynomkurve stückweise Polynome in den entsprechenden Abschnitten des Restmusters aufweist.
- Das Verfahren nach Anspruch 6, in welchem die Probendaten einen Datenvektor definieren, die Streustrahlungsverhältnisse eine Primärmatrix bilden, die so definiert sind, daß ein Multiplikationsprodukt der Primärmatrix und des Datenvektors zu einem Primärvektor führen, der den Gesamtanteil für jede geordnete Wellenlänge darstellt, und das Verfahren weiterhin aufweist ein Auswählen eines Abschnitts der geordneten Wellenlängen, die über dem Spektralbereich verteilt sind, so daß dadurch ein entsprechender Teil der Probendaten, die einen reduzierten Datenvektor bilden, ausgewählt wird, ein Bilden einer Interpolationsmatrix zum Interpolieren von Ersatzprobendaten zwischen dem ausgewählten Teil der Probendaten, und ein Erzeugen einer reduzierten Matrix, die als Produkt der Interpolationsmatrix und der Primärmatrix gebildet wird, und die Schritte des Multiplizierens und Summierens ein Multiplizieren der reduzierten Matrix mit dem reduzierten Datenvektor umfaßt, so daß ein Ersatzvektor erzeugt wird, der für den Gesamtanteil der Streustrahlung für jedes Wellenlängeninkrement repräsentativ ist.
- Das Verfahren nach Anspruch 8, weiter umfassend ein Speichern der reduzierten Matrix, und in welchem die Schritte des Multiplizierens, Summierens und Subtrahierens auf Realzeitbais durchgeführt werden.
- Das Verfahren nach Anspruch 1, weiter umfassend das Fitten bzw. Anpassen der Spektraldaten des Anfangsmusters oder des normalisierten Musters an eine Kurve des Typs mit einem Peak, Bestimmen eines Cutoff-Punkts auf jeder Seite der Kurve, in dem der Datenfehler gegenüber der Kurve eine ausgewählte Grenze übersteigt, und Verwenden der Cutoff-Punkte zum entsprechenden Darstellen des Peakprofils oder der normalisierten Peakprofile zwischen beiden.
- Das Verfahren nach Anspruch 10, in welchem die Kurve des Typs mit einem Peak eine Gauß'sche Kurve ist.
- Das Verfahren nach Anspruch 1, in welchem der Spektralbereich ein beschränkter Bereich mit einer Bereichsgrenze ist, und das Verfahren weiter aufweist:Auswählen wenigstens einer Kalibrationswellenlänge außerhalb des beschränkten Bereichs;Richten von im wesentlichen monochromatischer Strahlung mit der Wellenlänge außerhalb des Bereichs auf den Wellenlängenanalysator, so daß ein Streustrahlungsmuster der Spektraldaten für das Wellenlängeninkrement erzeugt wird, wobei das Streustrahlungsmuster für die Streustrahlung der Wellenlänge außerhalb des Bereichs, welche von den Wellenlängeninkrementen innerhalb des beschränkten Bereichs detektiert wird, repräsentativ ist, und in Form zusätzlicher Daten in dem Satz der Korrekturdaten aufgenommen wird;Bestimmen eines Normalisierungsfaktors für die zusätzlichen Daten, wenigstens teilweise basierend auf den Korrekturdaten innerhalb des beschränkten Bereichs; undVerwenden des Normalisierungsfaktors im Schritt der Normalisierung, so daß die zusätzlichen Daten normalisiert werden, wobei die normalisierten Daten in den Streustrahlungsverhältnissen umfaßt sind.
- Das Verfahren nach Anspruch 11, in welchem der Wellenlängenanalysator eine Strahlungsquelle umfaßt und eine Wellenlängenbreite (W') für die Wellenlängeninkremente aufweist, und der Schritt des Bestimmens aufweist:Zurverfügungstellen eines Ersatzwellenlängenanalysators zum Erzeugen spektraler Daten, die für die Spektralintensitäten in Wellenlängenschritten der Breite (WS) über einen verbreiterten Spektralbereich repräsentativ sind, welcher wenigstens einen Abschnitt des beschränkten Bereichs und einen erweiterten Abschnitt außerhalb des beschränkten Bereichs umfaßt, wobei das Umfassen im wesentlichen ein verbreitertes Muster der Spektraldaten einschließt;Auswählen einer benachbarten Wellenlänge innerhalb des beschränkten Bereichs in der Nähe der Bereichsgrenze;Richten der Quellenstrahlung, welche die benachbarte Wellenlänge einschließt, auf den Wellenlängenanalysator des Instruments, so daß ein erster Wert (Pl i) bei der benachbarten Wellenlänge erzeugt wird;Richten der Quellenstrahlung, welche die benachbarte Wellenlänge einschließt, auf den Ersatzwellenlängenanalysator, so daß ein zweiter Wert (PS i) bei der benachbarten Wellenlänge erzeugt wird;Richten von im wesentlichen monochromatischer Strahlung mit der Kalibrationswellenlänge außerhalb des Bereichs auf den Ersatzanalysator, so daß ein verbreitertes Muster aus Spektraldaten erzeugt wird;Bestimmen eines Normalisierungsfaktors (NS) für das verbreiterte Muster; undBerechnen eines Normalisierungsfaktors (N) für das Streustrahlungsmuster aus einer Gleichung N = (Wl * PS i * NS)/(WS * Pl).
- Das Verfahren nach Anspruch 13, weiter umfassend ein Richten der im wesentlichen monochromatischen Strahlung bei der Kalibrationswellenlänge außerhalb des Bereichs auf den Ersatzanalysator, so daß ein dritter Peakwert (PS o) bei der Wellenlänge außerhalb des Bereichs erzeugt wird, ein Identifizieren eines benachbarten Datenwerts (Di) für die ausgewählte benachbarte Wellenlänge aus den Probenspektraldaten, Berechnen eines Datenwerts (Do) außerhalb des Bereichs aus einer Gleichung Do=Di*PS o/PS i, der den Probendatenwert außerhalb des Bereichs in den Probenspektraldaten für den Schritt der Multiplikation umfaßt.
- Das Verfahren nach Anspruch 14, weiter umfassend:ein Auswählen einer Mehrzahl von Wellenlängen, die sich außerhalb der Bereichsgrenze von den geordneten Wellenlängen erstrecken, die innerhalb des beschränkten Bereichs liegen, und für den Schritt des Interpolierens und Normalisierens zum Erzeugen der Streustrahlungsverhältnisse, ein Einschließen der sich erstreckenden Wellenlängen in die geordneten Wellenlängen und ein Einschließen der Kalibrationswellenlänge außerhalb des Bereichs in die Kalibrationswellenlängen; undein Richten von im wesentlichen monochromatischer Strahlung auf den Ersatzanalysator bei der Mehrzahl der geordneten Wellenlängen, so daß eine entsprechende Mehrzahl dritter Peakwerte erzeugt wird, ein Berechnen einer entsprechenden Mehrzahl von Probendatenwerten außerhalb des Bereichs, jeweils aus der Gleichung für Do, und Einschließen der Mehrzahl der Probendatenwerte außerhalb des Bereichs in den Probenspektraldaten für den Schritt des Multiplizierens.
- Das Verfahren nach Anspruch 1, in welcher das spektrometrische Instrument ein erstes optisches Fasersystem zum Richten der Strahlung von der Probenquelle auf den Wellenlängenanalysator aufweist, wobei das erste Fasersystem einen Kerndurchmesser und eine numerische Apertur aufweist, und der Schritt des Richtens das Richten der im wesentlichen monochromatischen Strahlung auf den Analysator mittels eines zweiten optischen Fasersystems umfaßt, das im wesentlichen denselben Kerndurchmesser und dieselbe numerische Apertur wie das erste Fasersystem aufweist.
- Ein Verfahren zum Korrigieren von Streustrahlung in einem Spektrum, das durch ein spektrometrisches Instrument erzeugt worden ist, welches einen Wellenlängenanalysator zum Erzeugen spektraler Daten, die repräsentativ für Spektralintensitäten in Wellenlängeninkrementen bei geordneten Wellenlängen über einen spektralen Bereich sind, umfaßt, wobei das Verfahren aufweist:für jede geordnete Wellenlänge:Richten von im wesentlichen monochromatischer Strahlung bei der geordneten Wellenlänge auf den Analysator, so daß ein Anfangsmuster aus Spektraldaten für das Wellenlängeninkrement erzeugt wird, wobei das Anfangsmuster ein Peakprofil bei der geordneten Wellenlänge aufweist und in vom Peakprofil entfernten Bereichen für die Streustrahlung repräsentativ ist,Normalisieren des Anfangsmusters zur Erzeugung eines normalisierten Musters mit einem normalisierten Peakprofil;Entfernen des normalisierten Peakprofils aus dem normalisierten Muster zur Erzeugung eines Restmusters; undErsetzen des normalisierten Peakprofils durch ein Ersatzprofil, basierend auf dem Restprofil, so daß ein Muster aus Streustrahlungsverhältnissen erzeugt wird, das repräsentativ für die Streustrahlung ist, wobei die Streustrahlungsverhältnisse mit der geordneten Wellenlänge und entsprechend mit den Wellenlängeninkrementen identifiziert sind, wodurch die geordneten Wellenlängen Quellenwellenlängen darstellen, die Wellenlängeninkremente als Rezeptorinkremente fungieren und jede geordnete Wellenlänge einen assoziierten Satz von Streustrahlungsverhältnissen, die damit und entsprechend mit den Rezeptorinkrementen identifiziert sind, aufweist;Betreiben des spektrometrischen Instruments mit Strahlung von einer Probenquelle, so daß Probenspektraldaten für die Wellenlängeninkremente und entsprechend für die geordneten Wellenlängen erzeugt werden;für jede geordnete Wellenlänge, ein Multiplizieren entsprechender Probendaten mit jedem Streustrahlungsverhältnis, das mit der geordneten Wellenlänge identifiziert ist, so daß Streustrahlungsanteile, die mit der geordneten Wellenlänge und entsprechend mit den Wellenlängeninkrementen identifiziert sind, erzeugt werden, wodurch jedes Wellenlängeninkrement einen assoziierten Satz von Streustrahlungsanteilen, die mit diesem identifiziert sind, aufweist; undfür jedes derartige Wellenlängeninkrement:Addieren der Streustrahlungsanteile, die mit dem Wellenlängeninkrement identifiziert sind, so daß ein Gesamtanteil an Streustrahlung für das Wellenlängeninkrement erzeugt wird; undSubtrahieren des Gesamtanteils von den Probendaten, so daß korrigierte Daten für das Wellenlängenelement erhalten werden;wodurch ein Satz korrigierter Daten, der für alle Wellenlängeninkremente erhalten worden ist, für ein Spektrum der Probenstrahlung, das in bezug auf Streustrahlung korrigiert ist, repräsentativ ist.
- Eine Vorrichtung zum Erzeugen eines Spektrums, das in bezug auf Streustrahlung korrigiert ist, umfassend:ein spektrometrisches Instrument, das einen Wellenlängenanalysator zum Erzeugen spektraler Daten, die für Spektralintensitäten in Wellenlängeninkrementen bei geordneten Wellenlängen über einen Spektralbereich repräsentativ sind, wobei das Instrument mit Strahlung von einer Probenquelle betreibbar ist, so daß Probenspektraldaten für Wellenlängeninkremente und entsprechend für die geordneten Wellenlängen erhalten werden;eine Quelle monochromatischer Strahlung, die so wirksam angeordnet ist, daß sie im wesentlichen monochromatische Strahlung auf den Analysator bei jeder einer vorausgewählten Mehrzahl von Kalibrationswellenlängen, die über den spektralen Bereich verteilt sind, richtet, derart, daß für jede Kalibrationswellenlänge ein Anfangsmuster von spektralen Daten für die Wellenlängeninkremente erzeugt wird, wobei das Anfangsmuster ein Peakprofil bei der Kalibrationswellenlänge aufweist und in vom Peakprofil entfernten Bereichen für Streustrahlung repräsentativ ist;eine Einrichtung zum Normalisieren des Anfangsmusters, so daß ein normalisiertes Muster mit einem normalisierten Peakprofil erzeugt wird;eine Einrichtung zum Entfernen des normalisierten Peakprofils aus dem normalisierten Muster, so daß ein Restmuster für jede Kalibrationswellenlänge erhalten wird;eine Einrichtung zum Ersetzen jedes normalisierten Peakprofils durch ein Ersatzprofil, basierend auf dem Restmuster, so daß ein Muster aus Korrekturdaten, die repräsentativ für die Streustrahlung sind, erzeugt wird, wobei die Korrekturdaten mit einer Kalibrationswellenlänge und entsprechend mit den Wellenlängeninkrementen identifiziert sind, wodurch jedes Wellenlängeninkrement einen assoziierten Satz von Korrekturdaten für die Kalibrationswellenlängen aufweist;eine Einrichtung zum Interpolieren des Satzes der Korrekturdaten für jedes Wellenlängeninkrement aus den Kalibrationswellenlängen für die geordneten Wellenlängen so daß Streustrahlungsverhältnisse, die mit den Wellenlängeninkrementen und entsprechend mit den geordneten Wellenlängen identifiziert sind, erzeugt werden, wodurch die geordneten Wellenlängen Quellenwellenlängen darstellen, die Wellenlängeninkremente als Rezeptorinkremente fungieren und jede geordnete Wellenlänge einen assoziierten Satz von Streustrahlungsverhältnissen, die mit dieser und entsprechend mit den Wellenlängeninkrementen identifiziert sind, umfaßt;eine Einrichtung zum Multiplizieren der Probendaten für jede geordnete Wellenlänge mit jedem Streustrahlungsverhältnis, das mit der geordneten Wellenlänge identifiziert ist, so daß Streustrahlungsanteile, die mit der geordneten Wellenlänge und entsprechend mit den Wellenlängeninkrementen identifiziert sind, erzeugt werden, wodurch jedes Wellenlängeninkrement einen assoziierten Satz von Streustrahlungsanteilen, die mit diesem identifiziert sind, umfaßt;eine Einrichtung zum Summieren der Streustrahlungsanteile, die mit jedem Wellenlängeninkrement identifiziert sind, so daß ein Gesamtanteil an Streustrahlung für das Wellenlängeninkrement erhalten wird; undeine Einrichtung zum Subtrahieren des Gesamtanteils für jedes Wellenlängeninkrement von den entsprechenden Probendaten, so daß korrigierte Daten für jedes Rezeptorinkrement erhalten werden, wodurch ein Satz korrigierter Daten, der für die Wellenlängeninkremente erhalten worden ist, für ein Spektrum der Probenstrahlung, das in bezug auf Streustrahlung korrigiert ist, repräsentativ ist.
- Die Vorrichtung nach Anspruch 18, in welcher die geordneten Wellenlängen eine vorbestimmte Anzahl derselben über den spektralen Bereich verteilt aufweisen, und die vorausgewählte Mehrzahl der Wellenlängen kleiner als die vorbestimmte Anzahl ist.
- Die Vorrichtung nach Anspruch 19, in welcher die vorausgewählte Mehrzahl der Wellenlängen kleiner als die Hälfte der vorbestimmten Anzahl ist.
- Die Vorrichtung nach Anspruch 18, in welcher der Wellenlängenanalysator einen Detektor mit einem Feld fotoempfindlicher Pixel, welche den Wellenlängeninkrementen entsprechen, aufweist.
- Die Vorrichtung nach Anspruch 18, weiter umfassend eine Einrichtung zum Speichern der Streustrahlungsverhältnisse, und in welcher die Einrichtung zum Multiplizieren, Summieren und Subtrahieren eine Einrichtung zum Multiplizieren, Summieren und Subtrahieren auf Realzeitbasis aufweist.
- Die Vorrichtung nach Anspruch 18, weiter umfassend eine Einrichtung zum Fitten bzw. Anpassen des Restmusters an eine Polynomkurve, die repräsentativ für das Restmuster ist, und eine Einrichtung zum Fitten der Spektraldaten des Restmusters in der Nachbarschaft des entfernten Peakprofils an ein weiteres Polynom, das repräsentativ für das Ersatzprofil ist, derart, daß die Polynomparameter, die die Polynomkurve definieren, und das weitere Polynom die Korrekturdaten für jede Kalibrationswellenlänge darstellen, in welcher die Einrichtung zum Interpolieren eine Einrichtung zum Interpolieren der Polynomparameter auf die geordneten Wellenlängen aufweist und weiter eine Einrichtung zum Berechnen der Streustrahlungsverhältnisse aus den Polynomparametern umfaßt.
- Die Vorrichtung nach Anspruch 23, in welcher die Polynomkurve stückweise Polynome über entsprechende Abschnitte des Restmusters aufweist.
- Die Vorrichtung nach Anspruch 23, in welcher die Probendaten einen Datenvektor definieren, die Streustrahlungsverhältnisse eine Primärmatrix bilden, derart, daß ein Multiplikationsprodukt der Primärmatrix und des Datenvektors zu einem Primärvektor führt, der den Gesamtanteil für jede geordnete Wellenlänge darstellt. ein Abschnitt der geordneten Wellenlängen, die über den Spektralbereich verteilt sind, so vorausgewählt wird, daß dadurch ein entsprechender Abschnitt der Probendaten, die einen reduzierten Datenvektor definieren, ausgewählt wird, die Vorrichtung weiter aufweist eine Einrichtung zur Bildung einer Interpolationsmatrix zum Interpolieren von Ersatzprobendaten zwischen dem ausgewählten Teil der Probendaten, und eine Einrichtung zum Erhalt einer reduzierten Matrix, die als Produkt der Interpolationsmatrix und der Primärmatrix gebildet wird, und die Einrichtung zum Multiplizieren und Summieren eine Einrichtung zum Multiplizieren der reduzierten Matrix mit dem reduzierten Datenvektor aufweist, so daß ein Ersatzvektor, der für den Gesamtanteil der Streustrahlung für jedes Wellenlängeninkrement repräsentativ ist, erhalten wird.
- Die Vorrichtung nach Anspruch 25, weiter umfassend eine Einrichtung zum Speichern der reduzierten Matrix, und in welcher die Einrichtung zum Multiplizieren, Summieren und Subtrahieren eine Einrichtung zum Multiplizieren, Summieren und Subtrahieren auf Realzeitbasis aufweist.
- Die Vorrichtung nach Anspruch 18, weiter umfassend eine Einrichtung zum Fitten der spektralen Daten des Anfangsmusters oder des normalisierten Musters an eine Kurve des Typs mit einem Peak, eine Einrichtung zum Bestimmen eines Cutoff-Punkts auf jeder Seite der Kurve, in dem der Datenfehler gegenüber der Kurve eine vorausgewählte Grenze übersteigt, und eine Einrichtung zum Verwenden der Cutoff-Punkte zum entsprechenden Darstellen des Peakprofils oder des normalisierten Peakprofils zwischen beiden.
- Die Vorrichtung nach Anspruch 27, in welcher die Kurve des Typs mit einem Peak eine Gauß'sche Kurve ist.
- Die Vorrichtung nach Anspruch 18, in welcher der Spektralbereich ein beschränkter Bereich mit einer Bereichsgrenze ist, die vorausgewählte Mehrzahl der Kalibrationswellenlängen wenigstens eine Kalibrationswellenlänge außerhalb des beschränkten Bereichs aufweist, die Quelle der monochromatischen Strahlung so betreibbar ist, daß sie im wesentlichen monochromatische Strahlung bei der Wellenlänge außerhalb des Bereichs auf den Wellenlängenanalysator richtet, so daß ein Streustrahlungsmuster der Spektraldaten für die Wellenlängeninkremente erzeugt wird, wobei das Streustrahlungsmuster für die Streustrahlung der Wellenlänge außerhalb des Bereichs, welche durch die Wellenlängeninkremente innerhalb des beschränkten Bereichs detektiert wird, repräsentativ ist, und in Form zusätzlicher Daten in dem Satz der Korrekturdaten eingeschlossen ist, und die Vorrichtung weiter aufweist eine Einrichtung zum Bestimmen eines Normalisierungsfaktors, wenigstens teilweise basierend auf den Korrekturdaten innerhalb des beschränkten Bereichs, und eine Einrichtung zum Verwenden des Normalisierungsfaktors im Schritt der Normalisierung, so daß die zusätzlichen Daten normalisiert werden, wobei die normalisierten Daten in den Streustrahlungsverhältnissen eingeschlossen sind.
- Die Vorrichtung nach Anspruch 29, in welcher der Wellenlängenanalysator weiter eine Strahlungsquelle umfaßt und eine Wellenlängenbreite (W') für die Wellenlängeninkremente aufweist, eine benachbarte Wellenlänge, die innerhalb des beschränkten Bereichs in der Nähe der Grenze liegt, vorausgewählt wird, und die Strahlungsquelle so wirksam angeordnet ist, daß sie Quellenstrahlung, welche die benachbarte Wellenlänge umfaßt, auf den Wellenlängenanalysator des Instruments richtet, so daß ein erster Wert (Pl i) bei der benachbarten Wellenlänge erzeugt wird, und so daß sie Quellenstrahlung, die die benachbarte Wellenlänge umfaßt, auf den Ersatzwellenlängenanalysator richtet, so daß ein zweiter Wert (PS i) bei der benachbarten Wellenlänge erzeugt wird und die Quelle der monochromatischen Strahlung weiter so wirksam angeordnet ist, daß sie im wesentlichen monochromatische Strahlung mit der Wellenlänge außerhalb des Bereichs auf den Ersatzanalysator richtet, so daß das projizierte Muster der Spektraldaten erzeugt wird;die Vorrichtung weiter aufweist einen Ersatzwellenlängenanalysator, um Spektraldaten, die für Spektralintensitäten in Wellenlängenschritten der Breite (WS) über einen verbreiterten Spektralbereich, der wenigstens einen Abschnitt des beschränkten Bereichs und einen erweiterten Bereich außerhalb des beschränkten Bereichs umfaßt, zu erhalten, wobei das Umfassen im wesentlichen ein verbreitertes Muster der Spektraldaten und die Einrichtung zum Bestimmen eines Normalisierungsfaktors (NS) für das verbreiterte Muster einschließt; und eine Einrichtung zum Berechnen eines Normalisierungsfaktors (N) für das Streustrahlungsmuster aus einer Gleichung N=(Wl*PS i*NS) /(WS*Pl i).
- Vorrichtung nach Anspruch 30, in welcher die Quelle der monochromatischen Strahlung weiter so wirksam angeordnet ist, daß sie die im wesentlichen monochromatische Strahlung bei der Kalibrationswellenlänge außerhalb des Bereichs auf den Ersatzanalysator richtet, so daß ein dritter Peakwert (PS o) bei der Kalibrationswellenlänge außerhalb des Bereichs erzeugt wird, und die Vorrichtung weiter aufweist eine Einrichtung zum Identifizieren eines benachbarten Probendatenwerts (Di) aus den Probenspektraldaten für die ausgewählte benachbarte Wellenlänge, zum Berechnen eines Probendatenwerts (Do) außerhalb des Bereichs aus einer Gleichung und eine Einrichtung zum Einschließen des Probendatenwerts außerhalb des Bereichs in den Probenspektraldaten zur Multiplikation.
- Die Vorrichtung nach Anspruch 31, in welcher eine Mehrzahl von Wellenlängen, die Wellenlängen sind, die sich außerhalb der Bereichsgrenze der geordneten Wellenlängen, die innerhalb des beschränkten Bereichs liegen, erstrecken, ausgewählt wird, die Einrichtung zum Interpolieren und Normalisieren jede der erweiterten Wellenlängen zu den geordneten Wellenlängen aufnimmt und weiterhin die Kalibrationswellenlänge außerhalb des Bereichs zu den Kalibrationswellenlängen aufnimmt, und die Vorrichtung weiter aufweist eine Einrichtung zum Richten von im wesentlichen monochromatischer Strahlung auf den Ersatzanalysator bei der Mehrzahl der geordneten Wellenlängen, so daß eine entsprechende Mehrzahl dritter Peakwerte erzeugt wird, eine Einrichtung zum Berechnen einer entsprechenden Mehrzahl von Probendatenwerten außerhalb des Bereichs aus der Gleichung für Do, und eine Einrichtung zum Einschließen der Mehrzahl der Probendatenwerte außerhalb des Bereichs in den Probenspektraldaten für den Schritt des Multiplizierens.
- Die Vorrichtung nach Anspruch 18, in welcher das spektrometrische Instrument eine erste optische Fasereinrichtung zum Richten der Strahlung von der Probenquelle auf den Wellenlängenanalysator aufweist, wobei die erste Fasereinrichtung einen Kerndurchmesser und eine numerische Apertur aufweist, und die Quelle der monochromatischen Strahlung eine zweite optische Fasereinrichtung zum Richten der im wesentlichen monochromatischen Strahlung auf den Analysator aufweist, wobei die zweite Fasereinrichtung im wesentlichen denselben Kerndurchmesser und dieselbe numerische Apertur wie die erste Fasereinrichtung aufweist.
- Eine Vorrichtung zum Erzeugen eines Spektrums, das in bezug auf Streustrahlung korrigiert ist, umfassend:ein spektrometrisches Instrument mit einem Wellenlängenanalysator zum Erzeugen spektraler Daten, die für Spektralintensitäten in Wellenlängeninkrementen bei geordneten Wellenlängen über einen Spektralbereich repräsentativ sind, wobei das Instrument mit Strahlung von einer Probenquelle betreibbar ist, so daß Probenspektraldaten für die Wellenlängeninkremente und entsprechend für die geordneten Wellenlängen erhalten werden;eine Quelle monochromatischer Strahlung, die so wirksam angeordnet ist, daß sie im wesentlichen monochromatische Strahlung auf den Analysator mit jeder geordneten Wellenlänge richtet, derart, daß für jede geordnete Wellenlänge ein Anfangsmuster aus Spektraldaten für die Wellenlängeninkremente erzeugt wird, wobei das Anfangsmuster ein Peakprofil bei der geordneten Wellenlänge aufweist und in vom Peakprofil entfernten Bereichen für die Streustrahlung repräsentativ ist, wodurch die geordneten Wellenlängen Quellenwellenlängen darstellen, und die Wellenlängeninkremente als Rezeptorinkremente fungieren;eine Einrichtung zum Normalisieren des Anfangsmusters, so daß ein normalisiertes Muster mit einem normalisierten Peakprofil erzeugt wird;eine Einrichtung zum Entfernen des normalisierten Peakprofils aus dem normalisierten Muster, so daß ein Restmuster für jede geordnete Wellenlänge erhalten wird;eine Einrichtung zum Summieren eines jeden normalisierten Peakprofils durch ein Ersatzprofil, basierend auf dem Restmuster, so daß ein Muster aus Streustrahlungsverhältnissen erzeugt wird, die für die Streustrahlung repräsentativ sind, wobei die Streustrahlungsverhältnisse mit einer geordneten Wellenlänge und entsprechend mit den Wellenlängeninkrementen identifiziert sind, wodurch jede geordnete Wellenlänge einen assoziierten Satz von Streustrahlungsverhältnissen, die mit dieser und entsprechend mit den Wellenlängeninkrementen identifiziert sind, aufweist;eine Einrichtung zum Multiplizieren der Probendaten für jede geordnete Wellenlänge mit den Streustrahlungsverhältnissen, die mit der geordneten Wellenlänge identifiziert sind, so daß Streustrahlungsanteile, die mit der geordneten Wellenlänge und entsprechend mit den Wellenlängeninkrementen identifiziert sind, erhalten werden, wodurch jedes Wellenlängeninkrement einen assoziierten Satz von Streustrahlungsanteilen, die mit diesem identifiziert sind, aufweist;eine Einrichtung zum Addieren der Streustrahlungsanteile, die mit jedem Wellenlängeninkrement identifiziert sind, so daß ein Gesamtanteil der Streustrahlung für das Wellenlängeninkrement erhalten wird; undeine Einrichtung zum Subtrahieren des Gesamtanteils für jedes Wellenlängeninkrement von den entsprechenden Probendaten, so daß korrigierte Daten für jedes Rezeptorinkrement erhalten werden, wodurch ein Satz korrigierter Daten, der für die Wellenlängeninkremente erhalten wird, für ein Spektrum der Probenstrahlung, das in bezug auf Streustrahlung korrigiert ist, repräsentativ ist.
Applications Claiming Priority (2)
| Application Number | Priority Date | Filing Date | Title |
|---|---|---|---|
| US08/168,800 US5428558A (en) | 1993-12-17 | 1993-12-17 | Correction of spectra for stray radiation |
| US168800 | 1993-12-17 |
Publications (3)
| Publication Number | Publication Date |
|---|---|
| EP0658751A2 EP0658751A2 (de) | 1995-06-21 |
| EP0658751A3 EP0658751A3 (de) | 1995-10-25 |
| EP0658751B1 true EP0658751B1 (de) | 1998-08-05 |
Family
ID=22612976
Family Applications (1)
| Application Number | Title | Priority Date | Filing Date |
|---|---|---|---|
| EP94119876A Expired - Lifetime EP0658751B1 (de) | 1993-12-17 | 1994-12-15 | Korrektur von Spektren bezüglich Streustrahlung |
Country Status (4)
| Country | Link |
|---|---|
| US (1) | US5428558A (de) |
| EP (1) | EP0658751B1 (de) |
| JP (1) | JP3378679B2 (de) |
| DE (1) | DE69412221T2 (de) |
Cited By (1)
| Publication number | Priority date | Publication date | Assignee | Title |
|---|---|---|---|---|
| US6958479B2 (en) | 2000-05-12 | 2005-10-25 | Burling-Claridge Geordie Rober | Method of processing data from a spectrophotometer |
Families Citing this family (20)
| Publication number | Priority date | Publication date | Assignee | Title |
|---|---|---|---|---|
| US5463893A (en) * | 1994-05-16 | 1995-11-07 | General Electric Company | Sensor matching through real-time output compensation |
| US5852681A (en) * | 1995-04-20 | 1998-12-22 | Massachusetts Institute Of Technology | Method and apparatus for eliminating artifacts in data processing and compression systems |
| US5841523A (en) * | 1995-04-20 | 1998-11-24 | Chiron Diagnostics Corporation | Method for performing spectroscopic analysis of inhomogeneous test samples |
| US5668374A (en) * | 1996-05-07 | 1997-09-16 | Core Laboratories N.V. | Method for stabilizing near-infrared models and determining their applicability |
| FR2752457B1 (fr) * | 1996-08-19 | 1998-11-06 | I & T Inf Et Technologies | Dispositif d'etalonnage d'un appareil spectroscopique |
| US6452179B1 (en) | 1998-08-14 | 2002-09-17 | Global Technovations, Inc. | On-site analyzer |
| EP0982583B1 (de) * | 1998-08-28 | 2009-04-15 | Perkin-Elmer Limited | Mesung des Hintergrundrauschenprofils eines Spektrometers |
| US6721694B1 (en) * | 1998-10-13 | 2004-04-13 | Raytheon Company | Method and system for representing the depths of the floors of the oceans |
| US6155489A (en) * | 1998-11-10 | 2000-12-05 | Ncr Corporation | Item checkout device including a bar code data collector and a produce data collector |
| US6332573B1 (en) | 1998-11-10 | 2001-12-25 | Ncr Corporation | Produce data collector and produce recognition system |
| US6431446B1 (en) | 1999-07-28 | 2002-08-13 | Ncr Corporation | Produce recognition system and method |
| EP1309849A2 (de) * | 2000-08-10 | 2003-05-14 | Therma-Wave, Inc. | Verfahren zur interpolation in einer datenbasis zur optischen messung von diffraktiven mikrostrukturen |
| US7092832B2 (en) * | 2003-12-11 | 2006-08-15 | Inlight Solutions, Inc. | Adaptive compensation for measurement distortions in spectroscopy |
| US7420663B2 (en) * | 2005-05-24 | 2008-09-02 | Bwt Property Inc. | Spectroscopic sensor on mobile phone |
| JP5012323B2 (ja) | 2007-08-27 | 2012-08-29 | コニカミノルタオプティクス株式会社 | ポリクロメータおよびその迷光の補正方法 |
| US8945472B2 (en) * | 2008-01-04 | 2015-02-03 | Koninklijke Philips N.V. | Optimized detector readout for biosensor |
| JP5769453B2 (ja) * | 2011-03-10 | 2015-08-26 | 大塚電子株式会社 | 分光特性測定方法および分光特性測定装置 |
| EP3411689B1 (de) * | 2016-02-04 | 2022-07-06 | Nova Biomedical Corporation | System und verfahren zur optischen extinktionsmessung von vollblut |
| JP6683092B2 (ja) * | 2016-09-26 | 2020-04-15 | 株式会社島津製作所 | 分光分析装置およびキャリブレーション方法 |
| CN113703490B (zh) * | 2021-08-30 | 2023-06-23 | 福州大学 | 一种基于粒子群算法的旋转双棱镜指向校正方法 |
Family Cites Families (8)
| Publication number | Priority date | Publication date | Assignee | Title |
|---|---|---|---|---|
| US3646331A (en) * | 1970-09-03 | 1972-02-29 | Kollmorgen Corp | Automatic 100{11 line adjustment of spectrophotometers |
| US3790797A (en) * | 1971-09-07 | 1974-02-05 | S Sternberg | Method and system for the infrared analysis of gases |
| DE3215367A1 (de) * | 1982-04-24 | 1983-11-03 | Bodenseewerk Perkin-Elmer & Co GmbH, 7770 Überlingen | Vorrichtung zur reduzierung falschlichtbedingter messfehler bei spektralphotometern |
| US4820048A (en) * | 1987-11-19 | 1989-04-11 | The Perkin-Elmer Corporation | Detector for a spectrometer |
| US5023804A (en) * | 1989-05-23 | 1991-06-11 | The Perkin-Elmer Corporation | Method and apparatus for comparing spectra |
| US5121337A (en) * | 1990-10-15 | 1992-06-09 | Exxon Research And Engineering Company | Method for correcting spectral data for data due to the spectral measurement process itself and estimating unknown property and/or composition data of a sample using such method |
| US5229838A (en) * | 1992-01-21 | 1993-07-20 | The Perkin-Elmer Corporation | Photodetector amplitude linearity |
| US5341206A (en) * | 1992-12-03 | 1994-08-23 | Hewlett-Packard Company | Method for calibrating a spectrograph for gaseous samples |
-
1993
- 1993-12-17 US US08/168,800 patent/US5428558A/en not_active Expired - Lifetime
-
1994
- 1994-12-15 DE DE69412221T patent/DE69412221T2/de not_active Expired - Lifetime
- 1994-12-15 EP EP94119876A patent/EP0658751B1/de not_active Expired - Lifetime
- 1994-12-16 JP JP31369994A patent/JP3378679B2/ja not_active Expired - Lifetime
Cited By (1)
| Publication number | Priority date | Publication date | Assignee | Title |
|---|---|---|---|---|
| US6958479B2 (en) | 2000-05-12 | 2005-10-25 | Burling-Claridge Geordie Rober | Method of processing data from a spectrophotometer |
Also Published As
| Publication number | Publication date |
|---|---|
| DE69412221D1 (de) | 1998-09-10 |
| JPH07209082A (ja) | 1995-08-11 |
| EP0658751A2 (de) | 1995-06-21 |
| JP3378679B2 (ja) | 2003-02-17 |
| US5428558A (en) | 1995-06-27 |
| EP0658751A3 (de) | 1995-10-25 |
| DE69412221T2 (de) | 1998-12-10 |
Similar Documents
| Publication | Publication Date | Title |
|---|---|---|
| EP0658751B1 (de) | Korrektur von Spektren bezüglich Streustrahlung | |
| EP0800066B1 (de) | Genaue Wellenlängeneichung eines Spektrometers | |
| US6029115A (en) | Analyzing spectrometric data | |
| US7012633B2 (en) | Color calibration method for imaging color measurement device | |
| US6975775B2 (en) | Stray light correction method for imaging light and color measurement system | |
| Stokman et al. | Color measurement by imaging spectrometry | |
| Moiseev | Reduction of CCD observations made with a scanning Fabry–Perot interferometer. III. Wavelength scale refinement | |
| EP0729017B1 (de) | Verfahren zum Messen und Kompensieren von Streulicht in einem Spektrometer | |
| Liu et al. | Standardization of line‐scan NIR imaging systems | |
| JPH09105673A (ja) | 分光装置 | |
| JPH0765331A (ja) | 磁気ヘッドの浮上量測定方法 | |
| Bommier et al. | Search for polarimetric sensitivity in the first observations with THEMIS spectropolarimetric mode MTR (August 1998 campaign) | |
| CN217358748U (zh) | 一种提高光谱成像仪精确度的装置及光谱成像系统 | |
| CA2455136C (en) | Standardizing and calibrating a spectrometric instrument | |
| Ponz et al. | Midas Package For The Reduction Of Echelle Spectra | |
| JPH05322657A (ja) | スキャナ分光測色装置 | |
| US7046288B1 (en) | Image recording apparatus employing a single CCD chip to record two digital optical images | |
| KR101054017B1 (ko) | 분광기의 보정방법 | |
| JP2762775B2 (ja) | 分光測定方法 | |
| EP0463600A2 (de) | Verfahren zur spektralen Messung | |
| Imura et al. | Practical method for correcting heterochromatic stray light in dual‐channel spectrographs for colorimetry | |
| JP3547771B6 (ja) | 分光機器の標準化方法および分光機器 | |
| JPH06147838A (ja) | 膜厚測定方法 | |
| WO2024056713A1 (en) | Method for calibrating a spectrometer device of a batch of spectrometer devices | |
| Osmer et al. | A Comparison of HST and Copernicus Equivalent Width Measurements of Interstellar Absorption Lines Toward Zeta OPH |
Legal Events
| Date | Code | Title | Description |
|---|---|---|---|
| PUAI | Public reference made under article 153(3) epc to a published international application that has entered the european phase |
Free format text: ORIGINAL CODE: 0009012 |
|
| AK | Designated contracting states |
Kind code of ref document: A2 Designated state(s): DE FR GB |
|
| PUAL | Search report despatched |
Free format text: ORIGINAL CODE: 0009013 |
|
| AK | Designated contracting states |
Kind code of ref document: A3 Designated state(s): DE FR GB |
|
| 17P | Request for examination filed |
Effective date: 19960425 |
|
| GRAG | Despatch of communication of intention to grant |
Free format text: ORIGINAL CODE: EPIDOS AGRA |
|
| 17Q | First examination report despatched |
Effective date: 19970714 |
|
| GRAG | Despatch of communication of intention to grant |
Free format text: ORIGINAL CODE: EPIDOS AGRA |
|
| GRAH | Despatch of communication of intention to grant a patent |
Free format text: ORIGINAL CODE: EPIDOS IGRA |
|
| GRAH | Despatch of communication of intention to grant a patent |
Free format text: ORIGINAL CODE: EPIDOS IGRA |
|
| GRAA | (expected) grant |
Free format text: ORIGINAL CODE: 0009210 |
|
| AK | Designated contracting states |
Kind code of ref document: B1 Designated state(s): DE FR GB |
|
| REF | Corresponds to: |
Ref document number: 69412221 Country of ref document: DE Date of ref document: 19980910 |
|
| ET | Fr: translation filed | ||
| PLBE | No opposition filed within time limit |
Free format text: ORIGINAL CODE: 0009261 |
|
| STAA | Information on the status of an ep patent application or granted ep patent |
Free format text: STATUS: NO OPPOSITION FILED WITHIN TIME LIMIT |
|
| 26N | No opposition filed | ||
| REG | Reference to a national code |
Ref country code: GB Ref legal event code: 732E |
|
| REG | Reference to a national code |
Ref country code: GB Ref legal event code: IF02 |
|
| PGFP | Annual fee paid to national office [announced via postgrant information from national office to epo] |
Ref country code: GB Payment date: 20121227 Year of fee payment: 19 |
|
| PGFP | Annual fee paid to national office [announced via postgrant information from national office to epo] |
Ref country code: DE Payment date: 20121231 Year of fee payment: 19 |
|
| PGFP | Annual fee paid to national office [announced via postgrant information from national office to epo] |
Ref country code: FR Payment date: 20131217 Year of fee payment: 20 |
|
| REG | Reference to a national code |
Ref country code: DE Ref legal event code: R119 Ref document number: 69412221 Country of ref document: DE |
|
| GBPC | Gb: european patent ceased through non-payment of renewal fee |
Effective date: 20131215 |
|
| REG | Reference to a national code |
Ref country code: DE Ref legal event code: R119 Ref document number: 69412221 Country of ref document: DE Effective date: 20140701 |
|
| PG25 | Lapsed in a contracting state [announced via postgrant information from national office to epo] |
Ref country code: DE Free format text: LAPSE BECAUSE OF NON-PAYMENT OF DUE FEES Effective date: 20140701 |
|
| PG25 | Lapsed in a contracting state [announced via postgrant information from national office to epo] |
Ref country code: GB Free format text: LAPSE BECAUSE OF NON-PAYMENT OF DUE FEES Effective date: 20131215 |