EP0463600A2 - Verfahren zur spektralen Messung - Google Patents
Verfahren zur spektralen Messung Download PDFInfo
- Publication number
- EP0463600A2 EP0463600A2 EP91110401A EP91110401A EP0463600A2 EP 0463600 A2 EP0463600 A2 EP 0463600A2 EP 91110401 A EP91110401 A EP 91110401A EP 91110401 A EP91110401 A EP 91110401A EP 0463600 A2 EP0463600 A2 EP 0463600A2
- Authority
- EP
- European Patent Office
- Prior art keywords
- wavelength
- address
- elements
- photosensor array
- measured
- Prior art date
- Legal status (The legal status is an assumption and is not a legal conclusion. Google has not performed a legal analysis and makes no representation as to the accuracy of the status listed.)
- Granted
Links
- 230000003595 spectral effect Effects 0.000 title claims abstract description 65
- 238000005259 measurement Methods 0.000 title claims abstract description 32
- 238000000034 method Methods 0.000 title claims description 14
- 238000001228 spectrum Methods 0.000 claims abstract description 59
- 238000005070 sampling Methods 0.000 claims abstract description 56
- 239000006185 dispersion Substances 0.000 claims description 37
- 230000010354 integration Effects 0.000 claims description 22
- 230000003287 optical effect Effects 0.000 claims description 11
- 230000000694 effects Effects 0.000 claims description 10
- 238000012545 processing Methods 0.000 claims description 2
- QSHDDOUJBYECFT-UHFFFAOYSA-N mercury Chemical compound [Hg] QSHDDOUJBYECFT-UHFFFAOYSA-N 0.000 description 12
- 229910052753 mercury Inorganic materials 0.000 description 12
- 238000010586 diagram Methods 0.000 description 8
- 230000008859 change Effects 0.000 description 6
- 238000004737 colorimetric analysis Methods 0.000 description 6
- 238000005375 photometry Methods 0.000 description 4
- 230000008569 process Effects 0.000 description 4
- 230000035945 sensitivity Effects 0.000 description 4
- XUIMIQQOPSSXEZ-UHFFFAOYSA-N Silicon Chemical compound [Si] XUIMIQQOPSSXEZ-UHFFFAOYSA-N 0.000 description 3
- 230000008901 benefit Effects 0.000 description 3
- 230000015572 biosynthetic process Effects 0.000 description 3
- 238000006243 chemical reaction Methods 0.000 description 3
- 230000005855 radiation Effects 0.000 description 3
- 238000009877 rendering Methods 0.000 description 3
- 229910052710 silicon Inorganic materials 0.000 description 3
- 239000010703 silicon Substances 0.000 description 3
- 238000003786 synthesis reaction Methods 0.000 description 3
- 239000003086 colorant Substances 0.000 description 2
- 238000001514 detection method Methods 0.000 description 2
- 238000000295 emission spectrum Methods 0.000 description 2
- 238000012986 modification Methods 0.000 description 2
- 230000004048 modification Effects 0.000 description 2
- 230000002194 synthesizing effect Effects 0.000 description 2
- 230000009466 transformation Effects 0.000 description 2
- 238000004458 analytical method Methods 0.000 description 1
- 230000005540 biological transmission Effects 0.000 description 1
- 238000011156 evaluation Methods 0.000 description 1
- 238000003384 imaging method Methods 0.000 description 1
- 239000000463 material Substances 0.000 description 1
- 230000009347 mechanical transmission Effects 0.000 description 1
- 230000007246 mechanism Effects 0.000 description 1
- 229910052754 neon Inorganic materials 0.000 description 1
- GKAOGPIIYCISHV-UHFFFAOYSA-N neon atom Chemical compound [Ne] GKAOGPIIYCISHV-UHFFFAOYSA-N 0.000 description 1
- 230000009467 reduction Effects 0.000 description 1
- 230000000007 visual effect Effects 0.000 description 1
Images


Classifications
-
- G—PHYSICS
- G01—MEASURING; TESTING
- G01J—MEASUREMENT OF INTENSITY, VELOCITY, SPECTRAL CONTENT, POLARISATION, PHASE OR PULSE CHARACTERISTICS OF INFRARED, VISIBLE OR ULTRAVIOLET LIGHT; COLORIMETRY; RADIATION PYROMETRY
- G01J3/00—Spectrometry; Spectrophotometry; Monochromators; Measuring colours
- G01J3/12—Generating the spectrum; Monochromators
- G01J3/18—Generating the spectrum; Monochromators using diffraction elements, e.g. grating
- G01J3/20—Rowland circle spectrometers
-
- G—PHYSICS
- G01—MEASURING; TESTING
- G01J—MEASUREMENT OF INTENSITY, VELOCITY, SPECTRAL CONTENT, POLARISATION, PHASE OR PULSE CHARACTERISTICS OF INFRARED, VISIBLE OR ULTRAVIOLET LIGHT; COLORIMETRY; RADIATION PYROMETRY
- G01J3/00—Spectrometry; Spectrophotometry; Monochromators; Measuring colours
- G01J3/28—Investigating the spectrum
- G01J3/2803—Investigating the spectrum using photoelectric array detector
-
- G—PHYSICS
- G01—MEASURING; TESTING
- G01J—MEASUREMENT OF INTENSITY, VELOCITY, SPECTRAL CONTENT, POLARISATION, PHASE OR PULSE CHARACTERISTICS OF INFRARED, VISIBLE OR ULTRAVIOLET LIGHT; COLORIMETRY; RADIATION PYROMETRY
- G01J3/00—Spectrometry; Spectrophotometry; Monochromators; Measuring colours
- G01J3/28—Investigating the spectrum
- G01J2003/2866—Markers; Calibrating of scan
-
- G—PHYSICS
- G01—MEASURING; TESTING
- G01J—MEASUREMENT OF INTENSITY, VELOCITY, SPECTRAL CONTENT, POLARISATION, PHASE OR PULSE CHARACTERISTICS OF INFRARED, VISIBLE OR ULTRAVIOLET LIGHT; COLORIMETRY; RADIATION PYROMETRY
- G01J3/00—Spectrometry; Spectrophotometry; Monochromators; Measuring colours
- G01J3/02—Details
- G01J3/027—Control of working procedures of a spectrometer; Failure detection; Bandwidth calculation
Definitions
- the present invention relates to a method and an apparatus therefor for measuring the spectral distribution of a light source color or an object color, which can be used to evaluate an effective quantity for spectra, such as color or color rendering of light source or colorimetry of object color.
- spectral measurement When spectral measurement is used for evaluating the energy of light source, color and color rendering, and for measuring an object light, it is important to improve the precision of an energy integral in the measurement than the wavelength resolution of spectra. In other words, it is a problem how to measure precisely the energy intensity of radiations at suitable wavelength sections than how to measure a detailed shape of wavelength distribution. This can be solved by making the spectral half-bandwidth correspond to the wavelength sampling intervals used for the measurement.
- the dispersion curve agrees with the wavelength scale. Then, the measurement is performed with use of equivalent intervals of a feed of the mechanical width, wherein it is assumed that the differences in dispersion at adjacent wavelength positions to be measured do not change largely each other though the magnitude of linear dispersion varies largely between short and long wavelength portions. Further, in the diffraction grating monochrometer of dispersion element drive type, the dispersion curve is independent of the wavelength scale because a sign bar mechanism is used.
- the dispersion of the diffraction grating monochrometer is rather linear when compared with that of the prism and it is difficult to adjust the slit width mechanically in accordance with a change in dispersion during a spectral measurement. Therefore, spectral measurement is performed by neglecting the change in dispersion.
- wavelength calibration is necessary due to the deviation from the theoretical wavelength in wavelength scale.
- this kind of apparatus only one wavelength around the center of the wavelength range to be measured is calibrated with a line spectrum or the like, and the center-of-gravity wavelengths of each photosensor element are set by assuming that the intervals of each element are equal to each other. Then, the wavelength sampling intervals deviate so that errors of measurement are large to be used for example for colorimetry.
- the mechanical intervals of the photosensor elements which corresponds to measured sampling intervals are independent of the dispersion. Therefore, the nonlinearity of dispersion on the plane of the linear photosensor array is large and the half-bandwidth of responsivity function (slit function) and the measured wavelength sampling interval do not agree with each other.
- the measured center-of-gravity wavelengths deviate from the theoretical center-of-gravity wavelengths to cause mismatching of wavelength. Then, errors are large in a spectral measurement to evaluate the energy, color and color rendering of light source or to measure an object color.
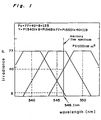
- a mercury line spectrum of 546.1 nm of 100 mW/cm ⁇ 2 is measured when the wavelength half-bandwidths of responsivity function of the monochrometer do not agree with the measured wavelength intervals.
- the responsivity function becomes a trapezoid of 9 nm half-bandwidth if the wavelength width of exit slit is set as 9 nm against 5 nm of the wavelength sampling intervals and 5 nm of the wavelength width of entrance slit.
- the measured values of the mercury line spectra at 546.1 nm wavelength of 100 mW/cm2 are 8, 77 and 40 mW/cm2 at the sampling wavelengths 540, 545 and 550 nm, respectively, and the measured value of irradiance of mercury line spectrum calculated by a weighed integration becomes 119 mW/cm2 or the error is 19 % against the true value.
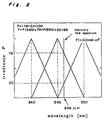
- the responsivity function of monochrometer has a shape of ideal isosceles triangle
- the above-mentioned weighed integration can be performed precisely by making the wavelength half-bandwidths of responsivity function agree with the wavelength sampling intervals.
- a mercury line spectrum at 546.1 nm wavelength is measured when the wave-length half-bandwidth of responsivity function is set as 5 nm.
- Fig. 2 shows a responsivity function when the measured sampling wavelengths are 545 nm and 550 nm. That is, the wavelength half-bandwidths of responsivity function are set to be equal to the wavelength sampling intervals.
- the convolution integration of 80 data and 80 data corresponds that of 512 data and 512 data under 5 nm of wavelength sampling intervals, so that the amount of calculation increases remarkably. For example, if the illuminance of a lamp is evaluated, such an integration has to be repeated at many wavelengths, for example for three primary colors, fifteen comparison colors and a standard wavelength.
- E( ⁇ ) and W( ⁇ ) emission spectrum and the color matching of light source of spectral measurement
- an effective quantity P such as a photometry quantity or tristimulus values is obtained by the following equation: wherein K is a constant.
- the sampling wavelength intervals of E( ⁇ ) have to be values which assure sufficient precision when the integration in Eq. (4) is performed.
- the functions obtained by the Fourier transformation of E( ⁇ ) and W( ⁇ ) are designated as F( ⁇ ) and G( ⁇ ), respectively, and wherein ⁇ is a space frequency of the inverse of ⁇ . If we take that F( ⁇ ) is the conjugate complex number of F( ⁇ ), Eq.
- the wavelength intervals for measurement are narrow, the light for the measurement becomes weak. Still further, if a light source such as a fluorescent lamp having both mercury line spectra and continuous spectra of fluorescent material is measured, the dynamic range of the measurement system has to be made wide. Therefore, these factors also contribute errors.
- the following two methods can be adopted according to the present invention: (1) the spectra of object light is measured and the convolution integral of the obtained data and a spectral effect curve is performed to obtain the effect quantity, the data measured at sampling intervals smaller than the wavelength sampling intervals of the spectral data of an effect curve are changed to data of wavelength sampling interval of spectral effect curve, and further are transformed so as to match the half-bandwidth of wavelength, and (2) if measured half-bandwidth of wavelengths are different from measured wavelength sampling intervals, the spectral data at wavelengths in correspondence with the wavelength sampling intervals are obtained with use of interpolation, and an effective quantity is obtained with a convolution integration with the spectral function, whereby the measurement precision is improved at any part in the whole wavelength range for spectral measurement without causing excess or lack of spectral information (data).
- data measured at intervals smaller than the wavelength sampling intervals of the spectral function are summed by using weight factors determined as the difference of the absolute value of the difference between the measured center-of-gravity wavelength and the center-of-gravity wavelength of the spectral function with the wavelength sampling intervals of the spectral function, and the measured data are converted to data at the wavelength sampling intervals to obtain the effect quantity.
- the measured wavelength half-bandwidths are different from the measured wavelength sampling intervals
- the measured spectral data are interpolated to obtain spectral data at wavelengths at which the measured half-bandwidth corresponds to the wavelength sampling intervals, and the convolution integration with the spectral function is performed to obtain the effective quantity.
- a plurality of line spectra of specified wave-lengths obtained from a light source are introduced into the spectroradiometer, and addresses in correspondence to theoretical positions of the elements of the linear photosensor array at which a maximum photoelectric output can be obtained are determined for each line spectrum.
- an element which outputs a maximum photoelectric signal for a line spectrum is determined among the elements around the address, and the photoelectric outputs with use of the address as a weight factor are integrated as to the elements which belong in a range double the mechanical width of transmission band region of the spectroradiometer around the above-mentioned element of the maximum signal.
- the integrated value is divided by another integrated value obtained similarly except that the weight factor is taken as one.
- the address of the photosensor array for each line spectrum is determined, and the center-of-gravity wavelengths of each element are calculated from the wavelengths of line spectra and the regression curve of the address of the photosensor array in correspondence to the line spectra.
- a spectroradiometer in combination of a concave diffraction grating and a photodiode linear array is explained.
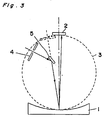
- Fig. 3 shows an optical system of a multi-channel spectoradiometer including a concave diffraction grating 1 of 300 grooves/mm of groove density, 500 nm of blaze wavelength and 200 mm of focal distance (f) and a linear photosensor array 2 of silicon photodiodes (512 elements).
- a concave diffraction grating 1 has combined functions of a planar diffraction grating, a collimator mirror and a focusing mirror.
- a spectroradiometer can be constructed with use of the concave diffraction grating 1 more simply and compactly, and it is possible that a change in linear dispersion can be made relatively smaller.
- a light from a light source or an object is introduced from an entrance slit 4 provided on the Rowland circle 3 at 11.8° of incident angle from the center normal line of the grating 1.
- the detection region is determined to be an angular region wherein the diffraction angle ⁇ between the center normal line and the diffracted light is set between -4.8° and +2°.
- the wavelengths of the dispersion pattern are within 400 to 800 nm of wavelength on the Rowland circle.
- Fig. 4 shows the deviation of the center-of-gravity wavelengths of each sensor element from equal wavelength interval scale in three cases: a case that the photodiode array 2 makes contact with the Rowland circle 3, a case that it is placed 0.5 mm inside from the Rowland circle 3, and a case that it is placed outside from the Rowland circle 3.
- Fig. 4 shows clearly that even when the sensor is tangent to the Rowland circle 3, the center-of-gravity wavelengths of each sensor element are not settled at equal intervals, and the deviations become larger at shorter and longer wavelength regions. This effect is particularly pronounced when sensor elements are positioned away from the Rowland circle 3. Therefore, the center-of-gravity wavelengths of each sensor element have to be individually determined.
- Fig. 5 shows a schematic diagram of wavelength calibration.
- the mechanical width of the entrance slit 4 of 50 ⁇ m is used.
- the wavelength half-bandwidth of an element at the center of the wavelength band of measurement becomes 0.9 nm which is also equal to the measured wavelength interval. Therefore, errors of photometry and of colorimetry decrease.
- the linear photosensor array 2 consists of a silicon photodiode array 2a and a charged-coupled detector 2b. Under these conditions, in an example, the output signals of the silicon photodiode array 2a for dispersion light of mercury line spectrum of wavelength 546.07 nm is displayed in Fig. 6.
- a conventional computer 8 having a central processing unit, a ROM for storing a program for wavelength calibration and a RAM for work area performs wavelength calibration according to the measured data received form the charge-coupled-device 2b to detect the diffracted light.
- linear dispersion is obtained from the constants of the optical system, and the theoretical address of an element at which a maximum photoelectric output is obtained in correspondence to the mercury line spectrum of wavelength 546.07 nm is calculated (block 9). The calculation shows that the output signal is expected to attain maximum around address 200.
- an address at the element is detected by observing the output signals of element addresses between 190 and 210 around the theoretical address (block 10).
- the center-of-gravity wavelength at each address is calculated as explained below.
- the output P(x m ) of an element of address x m is maximum. If the wavelength half-bandwidth of sensitivity is about 0.9 nm, this corresponds with the mechanical width by two elements if we take the tail of responsivity function into account.
- the center address Ad for wavelength 546.07 nm is calculated with use of the following equations in a range between -3 and +3 against the element address x m by taking the distortion of dispersion into account:
- A -3*P(x m -3) - 2*P(x m -2) - 1*P(x m -1) + P(x m ) + P(x m +1) + 2*P(x m +2) + 3*P(x m +3),
- B P(x m -3) + P(x m -2) + P(x m -1) + P(x m ) + P(x m +1) + P(x m +2) + P(x m +3)
- Ad A/B.
- A is obtained by integrating the photoelectric outputs of elements with use of the addresses of element as weight factors, which elements including the element of the maximum photoelectric output as the center and its neighboring elements at least in a range of double the mechanical transmission band width (block 11), while B is obtained by integrating the same photoelectric outputs without use of the addresses of element as weight factors (block 12).
- the address Ad in correspondence with center-of-gravity wavelength of said photosensor array for each line spectrum relative to x m is obtained by dividing the value A of weighed integration with the value B. That is, the obtained center address is equal to x m + Ad (block 13).
- the spectroradiometer according to the present embodiment has a wavelength calibration function that the center-of-gravity wavelengths of each element of the photosensor array 2 are determined from the plurality of line spectrum wavelengths for calibration and the actual addresses of the elements of the linear photosensor array 2 in correspondence with the line spectrum wavelengths.
- Fig. 6 shows the deviations of the measured center-of-gravity wavelengths from the center-of-gravity wavelength calculated by assuming 0.9 nm equal wavelength intervals of the sensor elements. The result shows larger positive deviations at longer wavelengths.
- this measured data is similar to the case where the sensor elements are placed inside the Rowland circle 3.
- the precision of photometry and of colorimetry is improved by using the above-mentioned wavelength calibration which uses line spectrum radiations at a plurality of wavelength to obtain a regression curve of the addresses of each element with wavelength and to set the center-of-gravity wavelengths of each elements.
- wavelength calibration when wavelength is calibrated with use of each line spectrum, erroneous recognition of line spectrum due to stray light and noises of spectroradiometer are prevented and the precision of wavelength calibration is improved.
- a multi-channel spectroradiometer of the above-mentioned type shown in Fig. 3 is used for photometry and for colorimetry, the relation between the center-of-gravity wavelength of spectral responsivity of each photosensor element and the dispersion characteristic and the intervals (wavelength sampling intervals) of each photosensor element affect the precision of measurement.
- the diameter of the circle 3 coincides with the radius of curvature of the concave diffraction grating 1, and the dispersion pattern is focused on the Rowland circle 3.
- all of the photosensor elements of linear photosensor array 2 cannot be positioned on the curved surface of the Rowland circle 3, and they are aligned on a planar surface.
- the responsivity function (band characteristic of sensitivity) and the center-of-gravity wavelengths of each element of the linear photosensor array 2 depend largely on the wavelength, resulting in large errors in colorimetry or the like.
- Fig. 8 shows the measured responsivity function of each element (responsivity function g1, g2, ..., g5) and the synthesized characteristic thereof (synthesized responsivity function g1+g2+g3+g4+g5) around 550 nm wavelength of a multi-channel optical measurement apparatus comprising a concave diffraction grating of 200 mm focal distance and 1/150 mm groove distance and a photodiode linear array 2 of 50 ⁇ m of element distance.
- the entrance slit 4 of the spectral measurement apparatus is set as 50 ⁇ m.
- the intervals between center-of-gravity wavelengths of each element are set about 0.9 nm, and the synthesized characteristic of responsivity functions of each element is found to have a nearly flat characteristic.
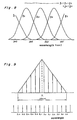
- the energy of a line spectrum can be measured without excess or lack by synthesizing the observed values at two spectral bands including the wavelength of the line spectrum. This is true irrespective of wavelength of line spectrum. That is, the synthesized value lies on a linear line connecting the apexes of the triangular bands, and the line is a locus of the measured value of the line spectrum when wavelength is changed under a constant energy. In other words, if the synthesized value becomes linear as shown in Fig.
- the energy component at any wavelength can be evaluated without excess or lack. Therefore, the linearity of the synthesized value of each spectral band is a necessary condition in order to get a precise measured value with use of the isosceles triangular spectral bands. On the contrary, if the half-bandwidths of responsivity function do not agree with wavelength sampling intervals, the synthesized value does not become flat against wavelength, so that errors arise in a measurement
- Fig. 9 displays a process for conversion to a responsivity function (synthesized responsivity function) W ⁇ of ⁇ nm of the center-of-gravity wavelength and 5 nm of half-bandwidth of wavelength band. Only the elements which exist within the half-bandwidth 5 nm or satisfy the following relation contribute the synthesis of responsivity function:
- the data W j measured at intervals about 0.9 nm smaller than the wavelength sampling intervals 5 nm of the spectral data are summed by using weight factors ( 5 -
- Fig. 10 shows a measured responsivity function when the slit width (wavelength range) is synthesized with the above-mentioned process. It is apparent that the isosceles triangle characteristic of 5 nm wavelength half-bandwidth can be realized.
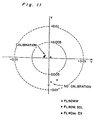
- chromaticities of three types of fluorescent lamps FL40WW, FL40W,SDL and FL40ss.EX are measured.
- Fig. 11 shows the deviations of the measured chromaticities from those measured by an accurate spectroradiometer comprising a mechanical wavelength scanning type double prism monochrometer.
- spectral data at positions having wavelength intervals equal to the wavelength half-bandwidth of responsivity function of each element is obtained by using interpolation from the measured spectral data around the center-of-gravity wavelength positions, for example with use of Lagrange's interpolation method.
- an interpolated value of the next frequency below 555 ⁇ m by the wavelength half-bandwidth does not correspond with 550 ⁇ m of adjacent sampling wavelength.
- the spectral data at the interpolated frequency is obtained by the interpolotion of the data at 555 and 550 ⁇ m. Therefore, spectral data can be matched with the wavelength half-bandwidth of responsivity function with the measured wavelength sampling intervals.
Applications Claiming Priority (4)
| Application Number | Priority Date | Filing Date | Title |
|---|---|---|---|
| JP16470290 | 1990-06-22 | ||
| JP164702/90 | 1990-06-22 | ||
| JP2227058A JP2689707B2 (ja) | 1990-08-28 | 1990-08-28 | 波長校正機能付分光測定装置 |
| JP227058/90 | 1990-08-28 |
Publications (3)
| Publication Number | Publication Date |
|---|---|
| EP0463600A2 true EP0463600A2 (de) | 1992-01-02 |
| EP0463600A3 EP0463600A3 (en) | 1992-07-29 |
| EP0463600B1 EP0463600B1 (de) | 1995-12-20 |
Family
ID=26489705
Family Applications (1)
| Application Number | Title | Priority Date | Filing Date |
|---|---|---|---|
| EP91110401A Expired - Lifetime EP0463600B1 (de) | 1990-06-22 | 1991-06-24 | Verfahren zur spektralen Messung |
Country Status (2)
| Country | Link |
|---|---|
| EP (1) | EP0463600B1 (de) |
| DE (1) | DE69115575T2 (de) |
Cited By (6)
| Publication number | Priority date | Publication date | Assignee | Title |
|---|---|---|---|---|
| EP0560006A3 (en) * | 1992-02-12 | 1993-12-15 | Perkin Elmer Corp | Standardizing and calibrating a spectrometric instrument |
| DE19545178A1 (de) * | 1995-12-04 | 1997-06-05 | Bodenseewerk Perkin Elmer Co | Spektrometervorrichtung |
| WO1999061925A1 (en) * | 1998-05-29 | 1999-12-02 | Cidra Corporation | Method for improving the accuracy in the determination of a waveform center |
| WO2002001222A2 (de) * | 2000-06-29 | 2002-01-03 | Carl Zeiss Jena Gmbh | Verfahren und vorrichtung zur detektion von farbstoffen in der fluoreszenzmikroskopie |
| US6891613B2 (en) | 2000-06-29 | 2005-05-10 | Carl Zeiss Jena Gmbh | Method for the detection of dyes in fluorescence microscopy |
| CN105571716A (zh) * | 2015-12-22 | 2016-05-11 | 哈尔滨工业大学 | 一种基于差分与卷积核的线采样高光谱数据目标探测方法 |
Citations (3)
| Publication number | Priority date | Publication date | Assignee | Title |
|---|---|---|---|---|
| US4669880A (en) * | 1985-02-21 | 1987-06-02 | The Perkin-Elmer Corporation | Apparatus for converting the wavelength resolution of a spectrophotometer |
| US4692883A (en) * | 1985-02-21 | 1987-09-08 | The Perkin-Elmer Corporation | Automatic digital wavelength calibration system for a spectrophotometer |
| JPS6375523A (ja) * | 1986-09-17 | 1988-04-05 | Matsushita Electric Ind Co Ltd | 分光測光器 |
-
1991
- 1991-06-24 EP EP91110401A patent/EP0463600B1/de not_active Expired - Lifetime
- 1991-06-24 DE DE1991615575 patent/DE69115575T2/de not_active Expired - Fee Related
Patent Citations (3)
| Publication number | Priority date | Publication date | Assignee | Title |
|---|---|---|---|---|
| US4669880A (en) * | 1985-02-21 | 1987-06-02 | The Perkin-Elmer Corporation | Apparatus for converting the wavelength resolution of a spectrophotometer |
| US4692883A (en) * | 1985-02-21 | 1987-09-08 | The Perkin-Elmer Corporation | Automatic digital wavelength calibration system for a spectrophotometer |
| JPS6375523A (ja) * | 1986-09-17 | 1988-04-05 | Matsushita Electric Ind Co Ltd | 分光測光器 |
Non-Patent Citations (1)
| Title |
|---|
| PATENT ABSTRACTS OF JAPAN, vol. 12, no. 303 (P-746) (3150), 18 August 1988; & JP-A-63075523 * |
Cited By (19)
| Publication number | Priority date | Publication date | Assignee | Title |
|---|---|---|---|---|
| US5303165A (en) * | 1992-02-12 | 1994-04-12 | The Perkin-Elmer Corporation | Standardizing and calibrating a spectrometric instrument |
| EP0800066A2 (de) * | 1992-02-12 | 1997-10-08 | The Perkin-Elmer Corporation | Genaue Wellenlängeneichung eines Spektrometers |
| EP0800066A3 (de) * | 1992-02-12 | 1998-02-25 | The Perkin-Elmer Corporation | Genaue Wellenlängeneichung eines Spektrometers |
| EP0560006A3 (en) * | 1992-02-12 | 1993-12-15 | Perkin Elmer Corp | Standardizing and calibrating a spectrometric instrument |
| DE19545178B4 (de) * | 1995-12-04 | 2008-04-10 | Berthold Gmbh & Co. Kg | Spektrometervorrichtung |
| DE19545178A1 (de) * | 1995-12-04 | 1997-06-05 | Bodenseewerk Perkin Elmer Co | Spektrometervorrichtung |
| EP0778459A1 (de) * | 1995-12-04 | 1997-06-11 | Bodenseewerk Perkin-Elmer Gmbh | Spektrometervorrichtung |
| US5777733A (en) * | 1995-12-04 | 1998-07-07 | Bodenseewerk Perkin-Elmer Gmbh | Spectrometer with wavelength calibration |
| AU700031B2 (en) * | 1995-12-04 | 1998-12-17 | Perkin Elmer Bodenseewerk Zweigniederlassung Der Berthold Gmbh & Co. Kg | A spectrometer device |
| WO1999061925A1 (en) * | 1998-05-29 | 1999-12-02 | Cidra Corporation | Method for improving the accuracy in the determination of a waveform center |
| GB2356060B (en) * | 1998-05-29 | 2002-10-09 | Cidra Corp | Method for improving the accuracy in the determination of a waveform center |
| US6529923B2 (en) | 1998-05-29 | 2003-03-04 | Cidra Corporation | Method for improving the accuracy in the determination of a waveform center of a waveform signal |
| GB2356060A (en) * | 1998-05-29 | 2001-05-09 | Cidra Corp | Method for improving the accuracy in the determination of a waveform center |
| WO2002001222A2 (de) * | 2000-06-29 | 2002-01-03 | Carl Zeiss Jena Gmbh | Verfahren und vorrichtung zur detektion von farbstoffen in der fluoreszenzmikroskopie |
| WO2002001222A3 (de) * | 2000-06-29 | 2002-10-03 | Zeiss Carl Jena Gmbh | Verfahren und vorrichtung zur detektion von farbstoffen in der fluoreszenzmikroskopie |
| US6891613B2 (en) | 2000-06-29 | 2005-05-10 | Carl Zeiss Jena Gmbh | Method for the detection of dyes in fluorescence microscopy |
| US6958811B2 (en) | 2000-06-29 | 2005-10-25 | Carl Zeiss Jena Gmbh | Method for the detection of dyes in fluorescence microscopy |
| CN105571716A (zh) * | 2015-12-22 | 2016-05-11 | 哈尔滨工业大学 | 一种基于差分与卷积核的线采样高光谱数据目标探测方法 |
| CN105571716B (zh) * | 2015-12-22 | 2018-03-30 | 哈尔滨工业大学 | 一种基于差分与卷积核的线采样高光谱数据目标探测方法 |
Also Published As
| Publication number | Publication date |
|---|---|
| EP0463600B1 (de) | 1995-12-20 |
| EP0463600A3 (en) | 1992-07-29 |
| DE69115575D1 (de) | 1996-02-01 |
| DE69115575T2 (de) | 1996-10-24 |
Similar Documents
| Publication | Publication Date | Title |
|---|---|---|
| US7978324B2 (en) | Multi-channel array spectrometer and method for using the same | |
| US7012633B2 (en) | Color calibration method for imaging color measurement device | |
| US4029419A (en) | Textile color analyzer calibration | |
| EP0570003B1 (de) | Dreidimensionaler automatischer Gonio-Spektrophotometer | |
| AU700031B2 (en) | A spectrometer device | |
| CN101324468B (zh) | 低杂散光快速光谱仪及其测量方法 | |
| EP0422183A4 (en) | Spatial heterodyne spectrometer and method | |
| US4798463A (en) | Spectrofluorophotometer | |
| US5592291A (en) | Spectrophotometer | |
| EP0520463B1 (de) | Hochauflösendes Spektroskopsystem | |
| EP0463600A2 (de) | Verfahren zur spektralen Messung | |
| US6278521B1 (en) | Method of and apparatus for bispectral fluorescence colorimetry | |
| JP2689707B2 (ja) | 波長校正機能付分光測定装置 | |
| Schlemmer et al. | Diode array spectrometer: an optimised design | |
| US4291985A (en) | Dual beam photometer with rotating filter plate | |
| JPH0546885B2 (de) | ||
| JP2762775B2 (ja) | 分光測定方法 | |
| CN115855881A (zh) | 测量目标反射率的光谱设备、方法及可读存储介质 | |
| JP2511902B2 (ja) | 分光測光器 | |
| CN114910416A (zh) | 一种高光谱颜色测量定标系统及定标方法 | |
| JPH0789084B2 (ja) | 分光測定方法 | |
| JPH0626930A (ja) | 分光スペクトル測定器 | |
| KR101054017B1 (ko) | 분광기의 보정방법 | |
| CN217358748U (zh) | 一种提高光谱成像仪精确度的装置及光谱成像系统 | |
| JP3402524B2 (ja) | 三次元分光測色器 |
Legal Events
| Date | Code | Title | Description |
|---|---|---|---|
| PUAI | Public reference made under article 153(3) epc to a published international application that has entered the european phase |
Free format text: ORIGINAL CODE: 0009012 |
|
| 17P | Request for examination filed |
Effective date: 19910626 |
|
| AK | Designated contracting states |
Kind code of ref document: A2 Designated state(s): DE FR GB |
|
| PUAL | Search report despatched |
Free format text: ORIGINAL CODE: 0009013 |
|
| AK | Designated contracting states |
Kind code of ref document: A3 Designated state(s): DE FR GB |
|
| 17Q | First examination report despatched |
Effective date: 19931227 |
|
| RIN1 | Information on inventor provided before grant (corrected) |
Inventor name: OKUBO, KAZUAKI |
|
| GRAA | (expected) grant |
Free format text: ORIGINAL CODE: 0009210 |
|
| AK | Designated contracting states |
Kind code of ref document: B1 Designated state(s): DE FR GB |
|
| PG25 | Lapsed in a contracting state [announced via postgrant information from national office to epo] |
Ref country code: FR Effective date: 19951220 |
|
| REF | Corresponds to: |
Ref document number: 69115575 Country of ref document: DE Date of ref document: 19960201 |
|
| EN | Fr: translation not filed | ||
| PLBE | No opposition filed within time limit |
Free format text: ORIGINAL CODE: 0009261 |
|
| STAA | Information on the status of an ep patent application or granted ep patent |
Free format text: STATUS: NO OPPOSITION FILED WITHIN TIME LIMIT |
|
| 26N | No opposition filed | ||
| REG | Reference to a national code |
Ref country code: GB Ref legal event code: IF02 |
|
| PGFP | Annual fee paid to national office [announced via postgrant information from national office to epo] |
Ref country code: GB Payment date: 20030618 Year of fee payment: 13 |
|
| PGFP | Annual fee paid to national office [announced via postgrant information from national office to epo] |
Ref country code: DE Payment date: 20030707 Year of fee payment: 13 |
|
| PG25 | Lapsed in a contracting state [announced via postgrant information from national office to epo] |
Ref country code: GB Free format text: LAPSE BECAUSE OF NON-PAYMENT OF DUE FEES Effective date: 20040624 |
|
| PG25 | Lapsed in a contracting state [announced via postgrant information from national office to epo] |
Ref country code: DE Free format text: LAPSE BECAUSE OF NON-PAYMENT OF DUE FEES Effective date: 20050101 |
|
| GBPC | Gb: european patent ceased through non-payment of renewal fee |
Effective date: 20040624 |