EP0106580B1 - Détection acoustique des défauts de structures - Google Patents
Détection acoustique des défauts de structures Download PDFInfo
- Publication number
- EP0106580B1 EP0106580B1 EP83305681A EP83305681A EP0106580B1 EP 0106580 B1 EP0106580 B1 EP 0106580B1 EP 83305681 A EP83305681 A EP 83305681A EP 83305681 A EP83305681 A EP 83305681A EP 0106580 B1 EP0106580 B1 EP 0106580B1
- Authority
- EP
- European Patent Office
- Prior art keywords
- received wave
- wave train
- burst
- defect
- acoustic energy
- Prior art date
- Legal status (The legal status is an assumption and is not a legal conclusion. Google has not performed a legal analysis and makes no representation as to the accuracy of the status listed.)
- Expired
Links
- 230000007547 defect Effects 0.000 title claims description 67
- 238000001514 detection method Methods 0.000 title description 9
- 238000000034 method Methods 0.000 claims description 55
- 230000008859 change Effects 0.000 claims description 38
- 230000012010 growth Effects 0.000 claims description 31
- 238000012544 monitoring process Methods 0.000 claims description 21
- 230000015572 biosynthetic process Effects 0.000 claims description 6
- 238000013459 approach Methods 0.000 claims description 4
- 230000008878 coupling Effects 0.000 claims description 4
- 238000010168 coupling process Methods 0.000 claims description 4
- 238000005859 coupling reaction Methods 0.000 claims description 4
- 230000000694 effects Effects 0.000 claims description 3
- 125000004122 cyclic group Chemical group 0.000 claims 1
- 230000005540 biological transmission Effects 0.000 description 8
- 238000004458 analytical method Methods 0.000 description 7
- 238000012360 testing method Methods 0.000 description 6
- 229910000831 Steel Inorganic materials 0.000 description 3
- 238000010586 diagram Methods 0.000 description 3
- 238000007689 inspection Methods 0.000 description 3
- 239000002184 metal Substances 0.000 description 3
- 229910052751 metal Inorganic materials 0.000 description 3
- 230000035945 sensitivity Effects 0.000 description 3
- 239000010959 steel Substances 0.000 description 3
- 230000008901 benefit Effects 0.000 description 2
- 239000003638 chemical reducing agent Substances 0.000 description 2
- 230000007423 decrease Effects 0.000 description 2
- 238000012986 modification Methods 0.000 description 2
- 230000004048 modification Effects 0.000 description 2
- 230000010355 oscillation Effects 0.000 description 2
- 238000012545 processing Methods 0.000 description 2
- 230000004044 response Effects 0.000 description 2
- 238000012795 verification Methods 0.000 description 2
- 230000000007 visual effect Effects 0.000 description 2
- 238000012935 Averaging Methods 0.000 description 1
- 238000005299 abrasion Methods 0.000 description 1
- 230000002238 attenuated effect Effects 0.000 description 1
- 238000010276 construction Methods 0.000 description 1
- 238000005336 cracking Methods 0.000 description 1
- 239000013078 crystal Substances 0.000 description 1
- 230000001934 delay Effects 0.000 description 1
- 238000011161 development Methods 0.000 description 1
- 230000000977 initiatory effect Effects 0.000 description 1
- 238000009434 installation Methods 0.000 description 1
- 230000001788 irregular Effects 0.000 description 1
- 230000007774 longterm Effects 0.000 description 1
- 238000004519 manufacturing process Methods 0.000 description 1
- 239000000463 material Substances 0.000 description 1
- 150000002739 metals Chemical class 0.000 description 1
- 230000003534 oscillatory effect Effects 0.000 description 1
- 238000007619 statistical method Methods 0.000 description 1
- 238000003860 storage Methods 0.000 description 1
- 239000000126 substance Substances 0.000 description 1
Images


Classifications
-
- G—PHYSICS
- G01—MEASURING; TESTING
- G01N—INVESTIGATING OR ANALYSING MATERIALS BY DETERMINING THEIR CHEMICAL OR PHYSICAL PROPERTIES
- G01N29/00—Investigating or analysing materials by the use of ultrasonic, sonic or infrasonic waves; Visualisation of the interior of objects by transmitting ultrasonic or sonic waves through the object
- G01N29/34—Generating the ultrasonic, sonic or infrasonic waves, e.g. electronic circuits specially adapted therefor
- G01N29/341—Generating the ultrasonic, sonic or infrasonic waves, e.g. electronic circuits specially adapted therefor with time characteristics
- G01N29/343—Generating the ultrasonic, sonic or infrasonic waves, e.g. electronic circuits specially adapted therefor with time characteristics pulse waves, e.g. particular sequence of pulses, bursts
-
- G—PHYSICS
- G01—MEASURING; TESTING
- G01N—INVESTIGATING OR ANALYSING MATERIALS BY DETERMINING THEIR CHEMICAL OR PHYSICAL PROPERTIES
- G01N29/00—Investigating or analysing materials by the use of ultrasonic, sonic or infrasonic waves; Visualisation of the interior of objects by transmitting ultrasonic or sonic waves through the object
- G01N29/04—Analysing solids
- G01N29/06—Visualisation of the interior, e.g. acoustic microscopy
- G01N29/0609—Display arrangements, e.g. colour displays
- G01N29/0618—Display arrangements, e.g. colour displays synchronised with scanning, e.g. in real-time
-
- G—PHYSICS
- G01—MEASURING; TESTING
- G01N—INVESTIGATING OR ANALYSING MATERIALS BY DETERMINING THEIR CHEMICAL OR PHYSICAL PROPERTIES
- G01N29/00—Investigating or analysing materials by the use of ultrasonic, sonic or infrasonic waves; Visualisation of the interior of objects by transmitting ultrasonic or sonic waves through the object
- G01N29/04—Analysing solids
- G01N29/11—Analysing solids by measuring attenuation of acoustic waves
-
- G—PHYSICS
- G01—MEASURING; TESTING
- G01N—INVESTIGATING OR ANALYSING MATERIALS BY DETERMINING THEIR CHEMICAL OR PHYSICAL PROPERTIES
- G01N2291/00—Indexing codes associated with group G01N29/00
- G01N2291/02—Indexing codes associated with the analysed material
- G01N2291/028—Material parameters
- G01N2291/0289—Internal structure, e.g. defects, grain size, texture
-
- G—PHYSICS
- G01—MEASURING; TESTING
- G01N—INVESTIGATING OR ANALYSING MATERIALS BY DETERMINING THEIR CHEMICAL OR PHYSICAL PROPERTIES
- G01N2291/00—Indexing codes associated with group G01N29/00
- G01N2291/04—Wave modes and trajectories
- G01N2291/044—Internal reflections (echoes), e.g. on walls or defects
-
- G—PHYSICS
- G01—MEASURING; TESTING
- G01N—INVESTIGATING OR ANALYSING MATERIALS BY DETERMINING THEIR CHEMICAL OR PHYSICAL PROPERTIES
- G01N2291/00—Indexing codes associated with group G01N29/00
- G01N2291/10—Number of transducers
- G01N2291/102—Number of transducers one emitter, one receiver
Definitions
- This invention relates to the monitoring of 'structures' for defect formation and growth, e.g. to locate a defect and to monitor the extent of its growth, by transmitting acoustic pulses through the structure and monitoring them at one or more receiving points.
- the term structure is used herein to cover all manner of fabrication in tubular or non-tubular structural metal work and other load bearing construction e.g. oil rig, bridge, pressure vessel, component, or object that may deteriorate in service e.g. may crack under fatigue loading.
- the term acoustic pulse is used herein to cover an induced elastic wave that for practical purposes would normally have an internal frequency or frequencies in the ultrasonic range e.g. greater than 20 kHz, but could, where acceptable, have an internal frequency or frequencies in the audio range.
- the term acoustic is used here in a similar wide frequency sense (thousands to millions of Hz).
- the essential feature of each structure is that it is acoustically continuous e.g. welded or bonded, between the input and receiving points used for monitoring.
- acoustic emission analysis is a technique based on detecting natural stress waves emitted from defect regions themselves, as a result of deformation, cracking, abrasion etc.
- Vibration analysis techniques use either service or artificially induced vibration. The vibrations in the structure are analysed with respect to frequency content such that major structural changes are detected, or followed, through changes in the frequency and the amplitude of the resonances caused by the vibration. The generation of these resonances involves vibration of whole elements of the structure.
- ultrasonic flaw detection small areas (e.g. less than 0.2 m wide) of the structure are scanned by short (e.g. 1 to 15 cycles), directional ultrasonic pulses using transducers operating at 1 - 10 MHz.
- the transducers are heavily damped and the technique relies on absorbtion or the direct reflection or diffraction of the ultrasonic pulse by a defect in the structure, the leading edge of the returned pulse being detected by the sending or another transducer.
- the delay between the transmission and receipt of the ultrasonic pulse is dependant upon the position of any defect with respect to the geometry of the structure and the positioning of the ultrasonic transducers involved.
- the transducers are generally moved across the surface of the structure being examined, in order to provide a scan.
- Ultrasonic flaw detection is essentially a short range (e.g. less than lm in metals) technique requiring considerable movement of the transducers.
- EP-A2-0,018,215 describes an application of conventional ultrasonic inspection techniques to the monitoring of the integrity of an object such as a closed container.
- portions of the container are ultrasonically scanned to generate a distinctive identity for the container.
- the container is then scanned subsequently and any differences in the subsequently obtained identity from the original identity indicate that the container has been tampered with.
- This method does not permit structures to be monitored on a global basis without using a very large number of transducers. Furthermore each defect indicated by a signal greater than a given threshold would need to be sized each time monitoring was carried out.
- a method of monitoring a structure comprises the steps of
- the present technique uses the information available within a significant duration of the received wave train.
- the received wave train can be observed, and or recorded (manually or automatically), by any suitable means, including photographic or graphical hard copy, oscilloscope or a VDU display or in a digitised data storer.
- the comparison of the wave trains or forms, and the interpretation can be carried out manually or automatically by any suitable technique. Suitable techniques would include cycle by cycle amplitude comparisons, auto and cross correlation techniques etc. For visual assessment various techniques can be used to highlight differences eg. displaying the differences between the two waves being compared or displaying each alternately at suitable visual repetition rate.
- this invention it is possible to monitor a structure and to detect, or locate, any defects, particularly growing cracks or broken welds.
- the defects often form at inaccessable points in the structure. It is particularly relevant to the long term monitoring of complex structures in hostile environments such as off-shore installations, where the technique will enable damage to be detected and give direction for diver inspection whilst also greatly reducing the amount of random diver inspection required.
- Other areas in which this technique may be used are for monitoring pipe work in refineries and chemical plant, and land pipelines.
- acoustic transducers are mounted permanently on the surface of a large metal structure such as an off-shore oil platform. From time to time e.g. once a month, an electronic control unit is coupled to all the. transducers, and the structure is monitored by comparing acoustic wave trains received at the various transducers with the corresponding wave trains stored from previous monitoring sessions. Any difference between each received wave train and the corresponding wave trains received in previous months, which is statistically significant, is indicative of a change in the structure to which the transducers are coupled, providing that the coupling has not altered.
- a first transducer (preferably permanently coupled to the structure) transmits a highly repro- ducable, non-directional, acoustic pulse or burst into the structure.
- the reproducability of the pulse may be checked by detecting it with an adjacent transducer.
- This pulse undergoes a complex series of reflections, refractions, diffractions and interferences within the structure and the wave resulting from the original pulse is detected in a receiving transducer.
- This received wave occurs later in time, and due to multiple reflections etc. is much greater in overall duration than the sending pulse.
- the receiving transducer is also preferably coupled permanently to the structure; it is generally distinct from the transmitting transducer, but with some geometries it is possible to use the same transducer for both transmitting and receiving.
- a further advantage of this technique over conventional ultrasonic techniques is that the power of the applied pulse may lie in the range 0.1 to a few hundred watts depending upon the size of the structure and this enables large areas of the structure to be monitored.
- intertransducer distances may be up to 30 m or more.
- step (a) comprises transmitting a series of bursts of acoustic energy having different forms, step (b) comprising detecting the received wave resulting from each burst.
- each burst of the series of bursts may differ in one or more of its shape, duration, and internal frequency.
- the burst of acoustic energy or each burst of the series of bursts of acoustic energy is repeated between 20 and 200 times, the method further comprising statistically analysing the received waves to minimise the effect of noise.
- Each transmitted pulse is usually of a constant internal frequency typically lying between 50 kHz and 1 MHz.
- the technique may be used outside this range, but difficulties are likely to be encountered which will reduce sensitivity and/or neccessitate modifications to the approach. Below about 50 kHz the method has an increasingly poor spacial discrimination and it is difficult to locate the defect or to detect it at all if it is a small defect. Above about 1 MHz the -ultrasonic wave is attenuated heavily by the medium, such that the maximum usable intertransducer distances become shorter and shorter. Conveniently, the internal frequency of the pulses lies in the range 150-500 kHz.
- the bursts are repeated at a repetition rate of up to about 200 Hz and conveniently step (a) comprises transmitting bursts at intervals longer than the time for each received wave significantly to attentuate.
- step (a) comprises transmitting bursts at intervals longer than the time for each received wave significantly to attentuate. This is advantageous since this allows the received wave to dampen between bursts preferably to less than 1% of its largest common amplitude.
- the number of oscillations in each input pulse can be from 1 to 10 for small structures, a few hundred, or even more than one thousand to suit circumstances depending upon the mass and size of the structure and the usable input power.
- step (c) Since the later cycles of the or each received wave may be excessively sensitive to changes in the acoustic paths, it is preferable to use up to the first 300 cycles of each received wave in the comparison step of step (c).
- the method further comprises determining for each comparison of portions of the or each further received wave train with. corresponding portions of the respective reference received wave train, the point along the received wave trains at which they first begin to differ; determining the corresponding acoustic path length to the or each transducer via the monitored defect; ad determining from at least two such path lengths the location of the monitored defect.
- the time interval between the start of the transmitted pulse and that first change can be used to calculate the locus of possible defect positions.
- the approximate defect position can then be calculated from such loci for the same defect occurrence or growth for three suitably positioned pairs of input and receiving transducers.
- the locus calculated would represent a bound within which lay a defect occurence or growth.
- the fact that the first change had not been detected would be apparent from a wide "triangle of uncertainty" at the intersection of three loci. It is for this reason that, as mentioned above, it is preferable to use a series of input bursts varying in form so that better location accuracy can be obtained and the chances of detecting the first change along the received wave or waves can be enhanced when the changes are small.
- the method comprises monitoring the difference between successive ones of the further received wave or waves and the reference received wave or waves at a point at which they differ.
- the size of the difference between the further received wave or waves and the reference wave or waves is indicative of the degree of change of the defect. Essentially, small defect growths will produce small changes in the received wave or waves and larger growths will produce larger changes.
- the method further comprises determining when the monitored difference approaches or reaches a threshold; and thereupon replacing the reference received wave or waves by the latest received wave or waves to constitute a new reference, and subsequently determining differences between successive ones of the further received wave or waves and the new reference wave or waves.
- the transducers are mounted in the same housing.
- this method is particularly suitable for automatic control using a central control unit.
- a typical procedure for monitoring defects in a structure using several permanently mounted transducers is as follows.
- the transducers are coupled electrically to a central control unit responsible for energising a transmitting transducer and for recording waves from receiving transducers.
- An electronic memory or mass storage device within the control unit stores the wave forms corresponding to the situation at the time of the original test, which may be months or even years previously.
- the control unit is programmed to execute a series of transmissions of the input pulse through the structure, and to store and analyse the received wave forms, and to store data on statistical variations in the initial or subsequent received wave forms.
- the shortest acoustic path lengths to the, or each transducer via any monitored defect are deduced by the control unit, which then uses programmed information concerning the geometry of the structure, and the position of the transducers, to determine the location of the defect.
- the control unit preferably analyses each received wave in detail, and makes a statistical correlation with previously stored waves. This correlation is then used, first to determine whether a defect has formed or grown, and if so to determine the location of the defect and where possible to determine the extent of its growth.
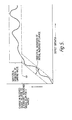
- Figures 6A and 6B illustrate graphically a method of obtaining a continuously increasing change of signal with increasing defect growth.
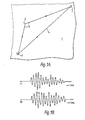
- Figures 1A and 1B The principle of the invention is illustrated in Figures 1A and 1B.
- Figure IA illustrates part of a structure 1 on which are mounted an input transducer 2 and a receiving transducer 3.
- a short burst, e.g. 5 cycles, of ultrasonic energy is transmitted from the input transducer 2 into the structure 1.
- the internal frequency of the burst may be for example 400 kHz.
- the burst of energy will be received by the receiving transducer 3 and a wave form similar to that shown in Figure 1B (i) will result, Due to the fact that the ultrasonic burst will have travelled through many different paths to reach the receiving transducer 3, the number of cycles in the received wave form is greater than that in the input burst.
- Figure 1A illustrates just two acoustic paths, the shortest path 4 and a longer path 5.
- This information can be used simply to indicate that the structure has changed between the two transmissions or the change can be analysed in more detail in order to determine the location of the change and/or the degree of change. This will be explained in more detail below.
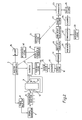
- FIG. 2 An example of apparatus for carrying out the method to provide an output indicating the degree of change in a structure is diagramatically shown by way of a block diagram in Figure 2.
- Figure 2 illustrates part of the structure 1, the input transducer 2 and receiving transducers 3, 3', 3".
- a master controller 7 which may for example be a programmed computer.
- the master controller 7 will control operation of most of the data processing units to be described although in Figure 2, for simplicity, only some connections are illustrated.
- the master controller 7 controls a pulse selector 8 which selects the form of the pulse to be transmitted. As has been previously mentioned, this may involve selection of internal pulse frequency, number of cycles in the pulse, and pulse shape.
- the pulse selector 8 causes a signal generator 9 to output a suitable pulse to a transducer selector 10.
- the transducer selector 10 selects the appropriate input transducer 2 to be energised, only one such connection being shown in Figure 2.
- the input transducer 2 transmits a pulse through the structure 1 which is received by thereceiving transducers 3, 3', 3". Each of these receiving transducers then supplies an appropriate signal to a digitiser 11.
- the output from the transducer selector 10 is fed directly to the digitiser 11 while a check transducer 12, mounted adjacent to the input transducer 2, also outputs a signal to the digitiser 11.
- These latter two signals after digitisation by the digitiser 11, are temporarily stored as Data A in a store 13.
- the output from the received transducers 3, 3', 3" are, after digitisation, also fed to the temporary store 13 as Data B.
- the digital Data A (the input and check signals) are reduced to timings (all timings commencing from the start of the input pulse) of peak amplitudes for each half cycle and timings for each zero crossing in a reducer and converter unit 14.
- the unit 14 determines whether each data point in the reduced Data A sequence falls within prescribed limits (set on the basis of reproducability required or practicable as found by experience in relation to the structure being monitored and including a comparison with initial reference Data A stored in a store 14' resulting from an initial transmission) and if the check is satisfactory the Data B is accepted and fed to a store 15. It is important when carrying out the method that the input signal is as identical as possible to an initial reference input signal since it is changes in the received wave forms which may have been obtained many weeks or months apart that are critical. If the master controller 7 determines that the unit 14 has found the Data A unacceptable, an alarm 16 is activated.
- the data stored in the store 15 is reduced to timings, as previously mentioned in connection with Data A, for each of the "n" received signals by a reducer 17 for the first combination of input signal and input/receiving transducer 2, 3 pair.
- the new data, called Data C is stored in a store 18.
- the "n" data sets within Data C are then compared with each other by a verifier 19 to verify that they are generally the same, allowing for minor digressions, for example where mechanical noise has interfered with a few cycles.
- "n" typically may lie between 20 and 200.
- the alarm 16 will be activated. If, however, the verification is satisfactory then taking the first data set as a reference, the remaining n - 1 data sets are, if necessary, time shifted to obtain the best modulation fit with the first data set by a best fit selector 20. The first data points from each of the "n" adjusted data sets are then compared with each other by a data reject and averaging unit 21 so as to reject those not closer to the mean than a preset limit, and to average the rest. This step is then repeated for each data point in the series and results in a new set of data points "Data D" which is taken as defining the wave form recorded for this monitoring occasion and is stored in a store 22.
- Each new set of Data D is then compared by a comparator 23 with a previous set of Data D stored in a reference store 24.
- the data stored in the reference store 24 may be data from the first monitoring test or a subsequent test where the reference store 24 has been updated.
- the difference between the new data and the reference data is determined by the comparator 23 to derive separate timing and amplitude data, Data E, which is stored by a store 25.
- the stored Data E is scanned by a scanner 26 to determine if and where the most recent Data D differs from the reference by more than a "typical" amount. Typical variations for example for half cycles 35 to 40 could be ⁇ 1% while the variations could be atypical at 2.5 and above.
- the variations determined by the scanner 26 are then compared by comparator 27 with typical and atypical variations previously recorded and stored in a store 28. If the typical or atypical variations are outside the limits previously recorded (or otherwise set) a suitable indication is given by an indicator 29. If the deviations are insufficient to produce this suitable indication then defect growth is deemed not to have been detected (although it may have occurred), and atypical deviations in Data E are noted and stored in the store 28 for later reference.
- the indication given by the indicator 29 thus tells the operator whether a change has been detected and if a change has been detected this will indicate a new defect or the growth of an old defect.
- the Data E can additionally be processed to provide an indication of the location of a defect and/or to provide an indication of the size of the defect or defect growth.
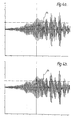
- Figure 3 illustrates the method by which the approximate location of a defect can be determined.
- FIG 3 illustrates a steel plate 30 having dimensions 1 m x 2m x 6mm.
- Transducers 31,32, 33 are mounted adjacent three of the corners of the steel plate 30.
- each transducer 31,32,33 was alternately stimulated to generate an ultrasonic burst and the received wave forms at the transducers 33, 33, and 32 respectively were detected.
- the initial pulse had an internal frequency of 400kHz, and comprised 10 cycles.
- Figure 4A illustrates the received wave form at the transducer 33 in response to the first transmission from the transducer 31.
- the oscillogram illustrated in Figure 4A was then photographically recorded. In a similar way oscillograms corresponding to received wave forms due to pulses generated by transducers 32, 33 were recorded.
- a hole having a depth of 3 mm and a diameter of 2.5 mm was then drilled in the steel plate 30.
- the same input pulse was then transmitted by the transducer 31 and the received wave form was as illustrated in Figure 4B.
- the arrows 34 indicate the occurrence of a first difference between the two received wave forms. This difference is due to the presence of the hole illustrated at 36 in Figure 3.
- the time between initiation of the pulse at transducer 31 and the first change between the two received wave formsat the transducer 32 enables an elliptical locus 37 to be drawn around the transducer pair 31, 32 as loci, along which the defect must be positioned.
- Input pulses were then generated at the transducers 32, 33 in a similar way to the original setting up input pulses enabling further ellipses 38, 39 to be drawn.
- the three ellipses 36, 38, 39 should intersect at the point at which the new defect or growth in defect occurs. In practice, and as is illustrated in Figure 3, this may not happen if the first change in the wave form cannot be detected with certainty. However, location of the defect or defect growth can be narrowed down to a small area.
- the transducers are permanently mounted to the structure.
- the transducers may be bonded or glued onto the structure.
- the transducer comprises a magnetic block with a transducer chip mounted directly on the block.
- Resonant PZT crystals in shielded shrouds as used for acoustic emission detection make suitable transmission and receiving transducers.
- amplifiers must have stable gains over the frequency band concerned, for example tuned amplifiers should have the same gain within 1% for frequency shifts of ⁇ 10% of the internal frequency of the input burst.
- Amplitude digitisers must be at least 8 bit and preferably 10 or 12 bit to maintain accurate discrimination over the range of received amplitudes. Equally for timing, 16 bit accuracy is required to identify zero crossing and instant of peak within a fraction of one micro-second for total time delays of 1 to 10 milliseconds using for example a 5 MHz clock.
Landscapes
- Physics & Mathematics (AREA)
- General Health & Medical Sciences (AREA)
- Life Sciences & Earth Sciences (AREA)
- Chemical & Material Sciences (AREA)
- Analytical Chemistry (AREA)
- Biochemistry (AREA)
- Health & Medical Sciences (AREA)
- General Physics & Mathematics (AREA)
- Immunology (AREA)
- Pathology (AREA)
- Acoustics & Sound (AREA)
- Investigating Or Analyzing Materials By The Use Of Ultrasonic Waves (AREA)
- Examining Or Testing Airtightness (AREA)
- Measurement Of Mechanical Vibrations Or Ultrasonic Waves (AREA)
Claims (14)
Applications Claiming Priority (2)
| Application Number | Priority Date | Filing Date | Title |
|---|---|---|---|
| GB8228521 | 1982-10-06 | ||
| GB8228521 | 1982-10-06 |
Publications (3)
| Publication Number | Publication Date |
|---|---|
| EP0106580A2 EP0106580A2 (fr) | 1984-04-25 |
| EP0106580A3 EP0106580A3 (en) | 1985-05-29 |
| EP0106580B1 true EP0106580B1 (fr) | 1989-12-06 |
Family
ID=10533417
Family Applications (1)
| Application Number | Title | Priority Date | Filing Date |
|---|---|---|---|
| EP83305681A Expired EP0106580B1 (fr) | 1982-10-06 | 1983-09-23 | Détection acoustique des défauts de structures |
Country Status (5)
| Country | Link |
|---|---|
| US (1) | US4603584A (fr) |
| EP (1) | EP0106580B1 (fr) |
| JP (1) | JPS59131161A (fr) |
| DE (1) | DE3380939D1 (fr) |
| NO (1) | NO162358C (fr) |
Families Citing this family (31)
| Publication number | Priority date | Publication date | Assignee | Title |
|---|---|---|---|---|
| JPS62156556A (ja) * | 1985-12-27 | 1987-07-11 | Shunzo Morisane | 航空機の翼などの材料欠陥を発見する方法 |
| GB8626059D0 (en) * | 1986-10-31 | 1986-12-03 | Helitune Ltd | Testing vehicle |
| US4901576A (en) * | 1988-04-08 | 1990-02-20 | Robotic Vision Systems, Inc. | Acoustic leak-detection system |
| US5335184A (en) * | 1990-07-16 | 1994-08-02 | Battelle Memorial Institute | Nondestructive ultrasonic testing of materials |
| JPH04348275A (ja) * | 1990-11-14 | 1992-12-03 | Nkk Corp | 超音波探傷方法 |
| US5600133A (en) * | 1993-03-22 | 1997-02-04 | Simmonds Precision Products, Inc. | Structural analyzer using acousto-optic sensor |
| RU2099698C1 (ru) * | 1996-10-17 | 1997-12-20 | Йелстаун Корпорейшн Н.В. | Ультразвуковой способ измерения характеристик напряженно-деформированного состояния болтовых и шпилечных соединений |
| KR100322031B1 (ko) * | 1996-12-24 | 2002-07-31 | 포항종합제철 주식회사 | 어쿠스틱웨이브를이용한홈탐상방법및장치 |
| JP3666209B2 (ja) * | 1997-10-21 | 2005-06-29 | 株式会社デンソー | 漏れ検査方法およびその検査装置 |
| GB9808668D0 (en) * | 1998-04-24 | 1998-06-24 | Smiths Industries Plc | Monitoring |
| GB2363306B (en) * | 2000-05-05 | 2002-11-13 | Acoustical Tech Sg Pte Ltd | Acoustic microscope |
| US6751560B1 (en) | 2000-08-01 | 2004-06-15 | The Charles Stark Draper Laboratory, Inc. | Non-invasive pipeline inspection system |
| GB2366382A (en) * | 2000-08-23 | 2002-03-06 | Mecon Ltd | Remote monitoring of structure condition |
| US6487909B2 (en) * | 2001-02-05 | 2002-12-03 | Siemens Westinghouse Power Corporation | Acoustic waveguide sensing the condition of components within gas turbines |
| FR2836226B1 (fr) * | 2002-02-18 | 2004-05-14 | Airbus France | Procede d'identification d'une source d'un signal |
| WO2003096007A1 (fr) * | 2002-05-08 | 2003-11-20 | Sekisui Chemical Co., Ltd. | Procede et equipement destines a inspecter une conduite en beton arme |
| DE10353081B3 (de) * | 2003-11-13 | 2005-09-01 | IST Ingenieurdienst für sichere Technik GmbH | Verfahren zur Erfassung von Veränderungen oder Schädigungen an Druckbehältern während oder nach ihrer Druckprüfung |
| US20050145014A1 (en) * | 2003-11-13 | 2005-07-07 | Schmitt-Thomas Karlheinz G. | Method and device for detecting changes or damages to pressure vessels while or after undergoing a hydraulic pressure test |
| GB2427918B (en) * | 2005-07-01 | 2009-01-28 | David Richard Andrews | A monitoring system |
| KR100711937B1 (ko) * | 2005-07-28 | 2007-05-02 | 삼성전자주식회사 | 초음파를 이용한 기판 검사 방법 및 이를 수행하기 위한장치 |
| US7653235B2 (en) * | 2005-10-27 | 2010-01-26 | Honeywell International Inc. | Surface anomaly detection system and method |
| JPWO2008105291A1 (ja) * | 2007-02-28 | 2010-06-03 | 株式会社村田製作所 | 媒体疲労検出装置及び媒体疲労検出方法 |
| EP2315020B1 (fr) * | 2008-07-18 | 2019-07-24 | Tohoku University | Procédé pour former des images d'un défaut de structure et dispositif pour former des images d'un défaut de structure |
| EP2321637A1 (fr) * | 2008-08-08 | 2011-05-18 | A.E.T. International S.R.L. | Procédé pour l'inspection non destructive du fond de structures de réservoir métallique |
| WO2010036934A2 (fr) * | 2008-09-25 | 2010-04-01 | The Regents Of The University Of California | Détection de défauts dans des objets par des approches statistiques |
| TWI431271B (zh) | 2010-07-15 | 2014-03-21 | Ind Tech Res Inst | 瑕疵檢測系統及方法 |
| US9074927B2 (en) | 2012-10-16 | 2015-07-07 | Honeywell International Inc. | Methods for non-destructively evaluating a joined component |
| JP5884993B2 (ja) * | 2013-09-12 | 2016-03-15 | 横河電機株式会社 | 超音波配管測定装置 |
| JP2017096904A (ja) * | 2015-11-25 | 2017-06-01 | 新一 野村 | 積層構造を備える超電導線の機械的欠損検出方法および装置 |
| US10018596B2 (en) | 2016-03-04 | 2018-07-10 | General Electric Company | System and method for monitoring component health using resonance |
| GB2614291A (en) * | 2021-12-23 | 2023-07-05 | Tribosonics Ltd | Process monitoring |
Family Cites Families (10)
| Publication number | Priority date | Publication date | Assignee | Title |
|---|---|---|---|---|
| US4011750A (en) * | 1973-06-06 | 1977-03-15 | The Commonwealth Of Australia Care Of The Secretary Department Of Health | Method and apparatus for ultrasonic examination of objects |
| US4128011A (en) * | 1974-07-16 | 1978-12-05 | Savage Robert J | Investigation of the soundness of structures |
| US3921126A (en) * | 1974-08-21 | 1975-11-18 | Continental Oil Co | Method of seismically delineating the permeable extent of oil-containing formations |
| US3996791A (en) * | 1975-04-24 | 1976-12-14 | Krautkramer-Branson, Incorporated | Ultrasonic test method and apparatus utilizing scattered signals |
| US4160385A (en) * | 1977-06-30 | 1979-07-10 | E. I. Dupont De Nemours And Co. | Pipe quality monitoring mechanism |
| US4530241A (en) * | 1979-04-24 | 1985-07-23 | European Atomic Energy Community (Euratom) | Method of monitoring the identity and integrity of an object particularly a closed container |
| US4428235A (en) * | 1980-06-20 | 1984-01-31 | Hitachi, Ltd. | Non-destructive inspection by frequency spectrum resolution |
| US4400976A (en) * | 1980-07-02 | 1983-08-30 | Purecycle Corporation | Ultrasonic transceiver circuit for level sensing |
| US4342229A (en) * | 1980-08-25 | 1982-08-03 | The Stoneleigh Trust | Apparatus and method for the non-destructive testing of the physical integrity of a structural part |
| FR2490344A1 (fr) * | 1980-09-12 | 1982-03-19 | Syminex Sa | Procede et dispositif pour verifier l'etat mecanique d'une structure |
-
1983
- 1983-09-23 DE DE8383305681T patent/DE3380939D1/de not_active Expired - Fee Related
- 1983-09-23 EP EP83305681A patent/EP0106580B1/fr not_active Expired
- 1983-09-30 NO NO833567A patent/NO162358C/no unknown
- 1983-10-06 JP JP58187670A patent/JPS59131161A/ja active Pending
-
1985
- 1985-05-31 US US06/739,764 patent/US4603584A/en not_active Expired - Fee Related
Also Published As
| Publication number | Publication date |
|---|---|
| EP0106580A3 (en) | 1985-05-29 |
| NO162358B (no) | 1989-09-04 |
| NO162358C (no) | 1989-12-13 |
| DE3380939D1 (de) | 1990-01-11 |
| JPS59131161A (ja) | 1984-07-27 |
| EP0106580A2 (fr) | 1984-04-25 |
| US4603584A (en) | 1986-08-05 |
| NO833567L (no) | 1984-04-09 |
Similar Documents
| Publication | Publication Date | Title |
|---|---|---|
| EP0106580B1 (fr) | Détection acoustique des défauts de structures | |
| Scott | Basic acoustic emission | |
| EP1707956B1 (fr) | Procédé et système d'inspection d'objets utilisant des données de balayage ultrasonore | |
| US10253615B2 (en) | Method and a system for ultrasonic inspection of well bores | |
| US7555954B2 (en) | In-track wheel inspection system | |
| US5383366A (en) | Ultrasonic two probe system for locating and sizing | |
| Carino | Impact echo: The fundamentals | |
| SE518997C2 (sv) | Förfarande och anordning för att detektera skada i material eller föremål | |
| Rummel et al. | The detection of fatigue cracks by nondestructive testing methods | |
| US6581014B2 (en) | Apparatus and method for analysis of guided ultrasonic waves | |
| US6925881B1 (en) | Time shift data analysis for long-range guided wave inspection | |
| Ohtsu et al. | Principles of the acoustic emission (AE) method and signal processing | |
| US20180017533A1 (en) | An apparatus and method for inspecting a pipeline | |
| KR880001290B1 (ko) | 산업플랜트를 음향학적으로 감시하는 방법 및 그 장치 | |
| US20050172720A1 (en) | Method and device for detecting changes or damages to pressure vessels while or after undergoing a hydraulic pressure test | |
| CA2012374C (fr) | Methode de controle aux ultrasons de la fissuration superficielle | |
| JP4410037B2 (ja) | 超音波探傷方法および超音波探傷装置 | |
| JP2009092471A (ja) | 探傷方法及び装置 | |
| Runow | The use of acoustic emission methods as aids to the structural integrity assessment of nuclear power plants | |
| JP2004077292A (ja) | 応力腐食割れ検査方法及び検査装置 | |
| JP4583898B2 (ja) | 超音波探傷装置 | |
| Silk | Defect detection and sizing in metals using ultrasound | |
| RU2714868C1 (ru) | Способ обнаружения питтинговой коррозии | |
| RU2010227C1 (ru) | Способ определения местоположения источников акустической эмиссии в трубопроводах | |
| Vos et al. | Application of Wide-Band Ultrasound for the Detection of Angled Crack Features in Oil and Gas Pipelines |
Legal Events
| Date | Code | Title | Description |
|---|---|---|---|
| PUAI | Public reference made under article 153(3) epc to a published international application that has entered the european phase |
Free format text: ORIGINAL CODE: 0009012 |
|
| AK | Designated contracting states |
Designated state(s): DE FR GB IT NL |
|
| PUAL | Search report despatched |
Free format text: ORIGINAL CODE: 0009013 |
|
| AK | Designated contracting states |
Designated state(s): DE FR GB IT NL |
|
| 17P | Request for examination filed |
Effective date: 19851115 |
|
| 17Q | First examination report despatched |
Effective date: 19870219 |
|
| GRAA | (expected) grant |
Free format text: ORIGINAL CODE: 0009210 |
|
| AK | Designated contracting states |
Kind code of ref document: B1 Designated state(s): DE FR GB IT NL |
|
| ET | Fr: translation filed | ||
| REF | Corresponds to: |
Ref document number: 3380939 Country of ref document: DE Date of ref document: 19900111 |
|
| ITF | It: translation for a ep patent filed | ||
| PGFP | Annual fee paid to national office [announced via postgrant information from national office to epo] |
Ref country code: GB Payment date: 19900831 Year of fee payment: 8 |
|
| PGFP | Annual fee paid to national office [announced via postgrant information from national office to epo] |
Ref country code: FR Payment date: 19900919 Year of fee payment: 8 |
|
| PLBE | No opposition filed within time limit |
Free format text: ORIGINAL CODE: 0009261 |
|
| STAA | Information on the status of an ep patent application or granted ep patent |
Free format text: STATUS: NO OPPOSITION FILED WITHIN TIME LIMIT |
|
| ITTA | It: last paid annual fee | ||
| PGFP | Annual fee paid to national office [announced via postgrant information from national office to epo] |
Ref country code: NL Payment date: 19900930 Year of fee payment: 8 |
|
| PGFP | Annual fee paid to national office [announced via postgrant information from national office to epo] |
Ref country code: DE Payment date: 19901031 Year of fee payment: 8 |
|
| 26N | No opposition filed | ||
| PG25 | Lapsed in a contracting state [announced via postgrant information from national office to epo] |
Ref country code: GB Effective date: 19910923 |
|
| PG25 | Lapsed in a contracting state [announced via postgrant information from national office to epo] |
Ref country code: NL Effective date: 19920401 |
|
| NLV4 | Nl: lapsed or anulled due to non-payment of the annual fee | ||
| GBPC | Gb: european patent ceased through non-payment of renewal fee | ||
| PG25 | Lapsed in a contracting state [announced via postgrant information from national office to epo] |
Ref country code: FR Effective date: 19920529 |
|
| PG25 | Lapsed in a contracting state [announced via postgrant information from national office to epo] |
Ref country code: DE Effective date: 19920602 |
|
| REG | Reference to a national code |
Ref country code: FR Ref legal event code: ST |