WO2023106372A1 - 酵素の測定方法、マイクロチャンバーアレイ、キット、ラマン散乱像の撮影方法、及び目的分子の測定方法 - Google Patents
酵素の測定方法、マイクロチャンバーアレイ、キット、ラマン散乱像の撮影方法、及び目的分子の測定方法 Download PDFInfo
- Publication number
- WO2023106372A1 WO2023106372A1 PCT/JP2022/045297 JP2022045297W WO2023106372A1 WO 2023106372 A1 WO2023106372 A1 WO 2023106372A1 JP 2022045297 W JP2022045297 W JP 2022045297W WO 2023106372 A1 WO2023106372 A1 WO 2023106372A1
- Authority
- WO
- WIPO (PCT)
- Prior art keywords
- enzyme
- selective substrate
- reaction product
- enzymatic reaction
- microchambers
- Prior art date
- Legal status (The legal status is an assumption and is not a legal conclusion. Google has not performed a legal analysis and makes no representation as to the accuracy of the status listed.)
- Ceased
Links
Images






Classifications
-
- G—PHYSICS
- G01—MEASURING; TESTING
- G01N—INVESTIGATING OR ANALYSING MATERIALS BY DETERMINING THEIR CHEMICAL OR PHYSICAL PROPERTIES
- G01N21/00—Investigating or analysing materials by the use of optical means, i.e. using sub-millimetre waves, infrared, visible or ultraviolet light
- G01N21/62—Systems in which the material investigated is excited whereby it emits light or causes a change in wavelength of the incident light
- G01N21/63—Systems in which the material investigated is excited whereby it emits light or causes a change in wavelength of the incident light optically excited
- G01N21/65—Raman scattering
Definitions
- the present invention relates to an enzyme measurement method, a microchamber array, a kit, a Raman scattering image imaging method, and a target molecule measurement method.
- Enzymes change the structure of substrate molecules through reactions such as hydrolysis and transfer. Thousands of types of enzymes exist in living organisms and are responsible for functions such as metabolism, absorption, and signal transduction. Body fluids such as blood, saliva, and urine contain trace amounts of enzymes produced in organs, etc., and when a specific organ malfunctions, the activity levels of related enzymes in the body fluids decrease. Conversely, when intracellular enzymes leak into body fluids such as blood due to organ inflammation or degeneration of nerve cells, the activity of related enzymes is enhanced. Since changes in enzyme activity (enzyme concentration) in body fluids correlate with the progression of various diseases, they are often used as minimally invasive and early disease diagnostic indicators.
- Patent Document 1 describes detection of enzymatic activity at the single-molecule level using a femtoliter-order microchamber.
- a challenge in expanding disease diagnosis based on enzyme activity is the improvement of enzyme activity measurement technology.
- the measurement of enzyme activity in a sample has used a labeled substrate that exhibits a fluorescence or color reaction accompanying an enzyme reaction.
- this is an important method for measuring enzymatic activity with high sensitivity
- enzyme species that are difficult to measure because bulky labels interfere with enzymatic reactions.
- multiple types of enzymes react with labeled substrates, making it difficult to discuss only enzymes that contribute to disease from among mixed enzyme groups.
- Raman scattering spectroscopy especially surface-enhanced Raman scattering (SERS) spectroscopy, which is expected to be highly sensitive, is a promising method for quantifying enzyme activity without labeling.
- SERS is a highly sensitive vibrational spectroscopy that utilizes an optically enhanced field formed in metal nanostructures.
- a metal nanostructure with a size smaller than the wavelength is irradiated with light, localized surface plasmons, which are collective excitations of electrons, are induced.
- the plasmons will interact with each other, and an extremely strong enhanced electric field will be formed between the metal nanostructures.
- SERS spectroscopy in addition to this electric field enhancement effect, chemical effects derived from metal-molecule interactions are also observed.
- SERS spectroscopy is promising for increasing the sensitivity of Raman scattering spectroscopy because the signal light intensity is greatly enhanced by the electric field enhancement effect and the chemical effect.
- the linewidth of the scattering spectrum found in SERS spectroscopy is narrow compared to the fluorescence emission spectrum. Therefore, it is expected that the reaction products of multiple enzymes can be discriminated and the activities of multiple enzymes can be measured at the same time without spectral overlap.
- the present invention has been made in view of the above circumstances, and provides a technique that can measure enzymes in samples without labeling and with excellent sensitivity.
- the present invention includes the following aspects.
- a mixed solution preparation step of preparing a mixed solution containing an enzyme and a selective substrate of the enzyme an array preparation step of preparing a metal nanostructure-immobilized microchamber array having a plurality of microchambers in which metal nanostructures are immobilized; a mixed liquid enclosing step of enclosing the mixed liquid so that the number of molecules of the enzyme is one or less in each of the plurality of microchambers;
- the metal nanostructure-immobilized microchamber array is illuminated with excitation light, the enzymatic reaction product of the selective substrate or the surface-enhanced Raman scattering intensity derived from the selective substrate changes to a preset value or more.
- the enzymatic reaction product exhibits a structure different from that of the selective substrate, and the Raman peak is capable of distinguishing between the enzymatic reaction product and the selective substrate. Enzyme measurement method.
- a mixed solution preparation step of preparing a mixed solution containing an enzyme and a selective substrate of the enzyme an array preparation step of preparing a metal nanostructure-immobilized microchamber array having a plurality of microchambers in which metal nanostructures are immobilized; a mixed liquid enclosing step of enclosing the mixed liquid so that the number of molecules of the enzyme is one or less in each of the plurality of microchambers;
- a chronological measurement step of measuring to The enzymatic reaction product exhibits a structure different from that of the selective substrate, and the Raman peak is capable of distinguishing between the enzymatic reaction product and the selective substrate.
- Enzyme measurement method [3] a mixed solution preparation step of preparing a mixed solution containing multiple types of enzymes and multiple types of selective substrates corresponding to the multiple types of enzymes; an array preparation step of preparing a metal nanostructure-immobilized microchamber array having a plurality of microchambers in which metal nanostructures are immobilized; a mixed solution enclosing step of enclosing the mixed solution in each of the plurality of microchambers so that the number of molecules of at least one of the plurality of types of enzymes is 1 or less; When the metal nanostructure-immobilized microchamber array is illuminated with excitation light, the enzymatic reaction product of the selective substrate or the surface-enhanced Raman scattering intensity derived from the selective substrate changes to a preset value or more,
- a chronological measurement step of measuring to The enzymatic reaction product exhibits a structure different from that of the selective substrate, the Raman peak distinguishes between the enzymatic reaction product and the selective substrate, and the plurality of types of enzymatic reaction products have different structures. and can distinguish between multiple types of the enzymatic reaction products or the selective substrates at the Raman peak, Enzyme measurement method.
- Enzyme measurement method [6] a mixture preparation step of preparing a mixture containing an enzyme, a selective substrate of the enzyme, and a metal nanostructure; a droplet splitting step of splitting the mixed solution into a plurality of droplets containing one or less molecules of the enzyme; A temporal measurement step of illuminating the plurality of droplets with excitation light to measure the enzymatic reaction product of the selective substrate or the surface-enhanced Raman scattering intensity derived from the selective substrate for each of the plurality of droplets over time. and including The enzymatic reaction product exhibits a structure different from that of the selective substrate, and the Raman peak is capable of distinguishing between the enzymatic reaction product and the selective substrate. Enzyme measurement method.
- a mixed solution preparation step of preparing a mixed solution containing multiple types of enzymes, multiple types of selective substrates corresponding to the multiple types of enzymes, and metal nanostructures; a droplet splitting step of splitting the mixed solution into a plurality of droplets containing one or less molecules of at least one of the plurality of types of enzymes; By illuminating the plurality of droplets with excitation light, the surface-enhanced Raman scattering intensity derived from the enzyme reaction product of the selective substrate or the selective substrate has changed to a preset value or more, or has a preset threshold value or more.
- the enzymatic reaction product exhibits a structure different from that of the selective substrate, the Raman peak distinguishes between the enzymatic reaction product and the selective substrate, and the plurality of types of enzymatic reaction products have different structures. and can distinguish between multiple types of the enzymatic reaction products or the selective substrates at the Raman peak, Enzyme measurement method.
- a mixed solution preparation step of preparing a mixed solution containing multiple types of enzymes, multiple types of selective substrates corresponding to the multiple types of enzymes, and metal nanostructures; a droplet splitting step of splitting the mixed solution into a plurality of droplets containing one or less molecules of at least one of the plurality of types of enzymes; A temporal measurement step of illuminating the plurality of droplets with excitation light to measure the enzymatic reaction product of the selective substrate or the surface-enhanced Raman scattering intensity derived from the selective substrate for each of the plurality of droplets over time.
- the enzymatic reaction product exhibits a structure different from that of the selective substrate, the Raman peak distinguishes between the enzymatic reaction product and the selective substrate, and the plurality of types of enzymatic reaction products have different structures. and can distinguish between multiple types of the enzymatic reaction products or the selective substrates at the Raman peak, Enzyme measurement method.
- the metal nanostructure-immobilized microchamber array in which the mixture is enclosed in each microchamber is illuminated with wide-field illumination, and the position of the Raman peak is Acquire a Raman scattering image in the wavelength band of the Raman peak of the enzyme reaction product or the selective substrate using a narrow linewidth bandpass filter that matches the surface-enhanced Raman scattering light intensity and intensity of each microchamber.
- a method for measuring the enzyme according to claim 1 Acquiring Raman scattering images in the top wavelength band of the Raman peak and the bottom wavelength band of the Raman peak of the enzyme reaction product or the selective substrate, and taking the difference between the two to obtain the The method for measuring an enzyme according to [11], which quantifies surface-enhanced Raman scattering light intensity. [13] The method for measuring an enzyme according to any one of [1] to [12], wherein the enzymatic reaction product has a thiol group.
- the selective substrate for acetylcholinesterase is MATP+ and the selective substrate for butyrylcholinesterase is butyrylthiocholine.
- a microchamber array having a plurality of microchambers in which metal nanostructures are immobilized.
- [21] The method for photographing a Raman scattering image according to [20], further comprising matching the transmission wavelength band of the narrow bandpass filter to the bottom of the Raman peak of the target molecule.
- [22] The method of taking a Raman scattering image according to [20] or [21], wherein the target molecule is arranged in the plurality of microchambers of a microchamber array having a plurality of microchambers.
- [23] The method for photographing a Raman scattering image according to [22], wherein metal nanostructures are solid-phased in the plurality of microchambers.
- the transmission wavelength band of the narrow bandpass filter is aligned with the top of the Raman peak of the target molecule, and the sample is irradiated with laser light expanded to the entire field of view. and extracting the concentration distribution of the target molecule from the obtained Raman scattering image;
- a method for measuring a target molecule using Raman scattering [26] The method for measuring a target molecule according to [25], further comprising matching the transmission wavelength band of the narrow bandpass filter to the bottom of the Raman peak of the target molecule.
- Extracting the concentration distribution of the target molecule by taking the difference between the Raman scattering images captured in the top transmission wavelength band and the bottom transmission wavelength band of the Raman peak of the target molecule, [25] or [ 26].
- this invention includes the following aspects. (1) a mixture preparation step of preparing a mixture containing an enzyme and a selective substrate for the enzyme; an array preparation step of preparing a metal nanostructure-immobilized microchamber array having a plurality of microchambers in which metal nanostructures are immobilized; a mixed liquid enclosing step of enclosing the mixed liquid so that the number of molecules of the enzyme is one or less in each of the plurality of microchambers; When the metal nanostructure-immobilized microchamber array is illuminated with excitation light, the enzymatic reaction product of the selective substrate or the surface-enhanced Raman scattering intensity derived from the selective substrate changes to a preset value or more.
- a chronological measurement step of measuring to The enzymatic reaction product exhibits a structure different from that of the selective substrate, and the Raman peak is capable of distinguishing between the enzymatic reaction product and the selective substrate. Enzyme measurement method.
- the mixed solution preparation step preparing a mixed solution containing multiple types of enzymes and multiple types of selective substrates corresponding to the multiple types of enzymes;
- the mixed solution is enclosed in each of the plurality of microchambers so that the number of molecules of at least one of the plurality of types of enzymes is 1 or less, and
- a step of measuring the number of bright spots for measuring the number of droplets below the threshold or A temporal measurement step of illuminating the plurality of droplets with excitation light to measure the enzymatic reaction product of the selective substrate or the surface-enhanced Raman scattering intensity derived from the selective substrate for each of the plurality of droplets over time. and including The enzymatic reaction product exhibits a structure different from that of the selective substrate, and the Raman peak is capable of distinguishing between the enzymatic reaction product and the selective substrate. Enzyme measurement method.
- the mixed solution preparation step preparing a mixed solution containing multiple types of enzymes and multiple types of selective substrates corresponding to the multiple types of enzymes;
- the mixed solution is divided into a plurality of droplets containing one or less molecules of at least one of the plurality of types of enzymes, and
- the metal nanostructure-immobilized microchamber array in which the mixture is enclosed in each microchamber is illuminated with wide-field illumination, and the position of the Raman peak is Acquire a Raman scattering image in the wavelength band of the Raman peak of the enzyme reaction product or the selective substrate using a narrow linewidth bandpass filter that matches the surface-enhanced Raman scattering light intensity and intensity of each microchamber.
- the enzyme is at least one selected from the group consisting of acetylcholinesterase, butyrylcholinesterase, phospholipase, elastase and amylase.
- the transmission wavelength band of the narrow bandpass filter is aligned with the top of the Raman peak of the target molecule, and the sample is irradiated with laser light expanded to the entire field of view.
- the transmission wavelength band of the narrow bandpass filter is adjusted to the top of the Raman peak of the target molecule, and the sample is irradiated with laser light expanded to the entire field of view. and extracting the concentration distribution of the target molecule from the obtained Raman scattering image; A method for measuring a target molecule using Raman scattering.
- FIG. 1 is a schematic configuration diagram of an example of a high-speed Raman imaging apparatus used for measurement of a SERS chip.
- FIG. 2 is an example of rough calculation of the measurement time for each lighting type.
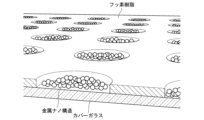
- FIG. 3 is a schematic diagram of an example of a SERS chip in which metal nanostructures are solid-phased.
- FIG. 4 is a schematic cross-sectional view explaining each step of the manufacturing method of the SERS chip.
- FIG. 5 is a scattering image of a SERS chip in which silver nanoparticles are immobilized on a microchamber array used in Examples.
- FIG. 6 is a schematic diagram of an optical system of a wide-field Raman microscope used in Examples. The image shown on the left side of FIG.
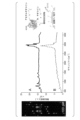
- FIG. 7 is a SERS image of a sample in which a mixed solution of acetylcholinesterase (AChE) and acetylthiocholine was enclosed in a SERS chip in the example.
- the graph shown in the center of FIG. 7 is the SERS spectra in chamber A and chamber B in the SERS image.
- the figure shown on the right side of FIG. 7 is a schematic diagram of decomposition of acetylthiocholine by acetylcholinesterase and SERS measurement of the decomposition products.
- the SERS image and the SERS spectrum were acquired with a slit scanning Raman microscope under the conditions of 100 pM acetylcholinesterase and 2 mM acetylthiocholine.
- FIG. 8 is a graph showing the relationship between the acetylcholinesterase (AChE) concentration and the number of bright spots in Examples. The number of bright spots was obtained with a slit scanning Raman microscope.
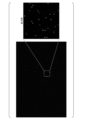
- FIG. 9 is a SERS image of a sample in which a mixed solution of acetylcholinesterase (AChE) and acetylthiocholine was encapsulated in a SERS chip in Example. The SERS image was obtained with a wide-field Raman microscope under the conditions of 10 pM acetylcholinesterase and 2 mM acetylthiocholine.
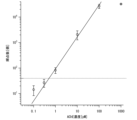
- FIG. 10 is a graph showing the relationship between the acetylcholinesterase (AChE) concentration and the number of bright spots in Examples.
- the number of bright spots was obtained with a wide-field Raman microscope.
- the dotted line in the graph indicates the value obtained by adding three times the standard deviation to the average number of bright spots when acetylcholinesterase is 0M.
- the intersection point of the dotted line and the solid line is regarded as the lower limit of detection.
- the image shown in the upper left of FIG. 11 is a SERS image of a sample in which a mixed solution of acetylcholinesterase (AChE), butyrylcholinesterase (BuChE), MATP+, and butyrylthiocholine was enclosed in a SERS chip in Example.
- the graph shown in the lower left of FIG. 11 is the SERS spectra in chamber A and chamber B in the SERS image.
- the diagrams shown in the upper right of FIG. 11 are schematic diagrams (left) of degradation of MATP + by acetylcholinesterase (AChE) and SERS measurement of degradation products, and degradation and degradation products by butyrylcholinesterase (BuChE) butyrylthiocholine.
- the SERS image and the SERS spectrum were obtained with a slit scanning Raman microscope under the conditions of 100 pM each of acetylcholinesterase and butyrylcholinesterase, and 1 mM each of MATP+ and butyrylthiocholine.
- Raman spectroscopic imaging device An example of a Raman spectroscopic imaging apparatus used for measurement of a SERS chip (a microchamber array in which a metal nanostructure is solid-phased in each microchamber; details will be described later) in the present technology will be described.
- a Raman spectroscopic imaging apparatus 100 whose configuration outline is shown in FIG. 1 has a line illumination system and a wide-field illumination system.
- the laser light (excitation laser) emitted from the laser light source 101 passes through the mirror 103 ⁇ cylindrical lens 104 ⁇ lens 105 ⁇ dichroic filter 109 ⁇ objective lens 112 in order to illuminate the sample 113.
- a laser beam from a laser light source 101 is shaped into a line by a cylindrical lens 104 .
- Raman scattered light from the sample 113 passes through the objective lens 112 ⁇ the dichroic filter 109 ⁇ the lens 111 in this order, and forms an image on the CCD 116 along the slit 114 of the spectroscope 115 .
- Line illumination systems detect the spectrum in parallel to speed it up.
- the laser light emitted from the laser light source 101 passes through the flip mirror 102 ⁇ lens 107, mirror 108, flip mirror 106 ⁇ dichroic filter 109 ⁇ objective lens 112 in order to illuminate the sample 113.
- the Raman light from the sample 113 passes through the objective lens 112 ⁇ dichroic filter 109 ⁇ flip mirror 110 ⁇ lens 117 ⁇ narrow line width bandpass filter 118 in order, and forms an image on the sCMOS of the two-dimensional detector 119.
- a narrow linewidth bandpass filter 118 matched to the position of the Raman peak specific to the degradation products of the substrate is placed in the imaging optics for widefield illumination. Using the angular dependence of the transmission band, scattering images are obtained at the top and tail of the Raman peak of the decomposition product, and the SERS light intensity in each chamber is quantified from the difference.
- Fig. 2 shows an example of approximate measurement time for each lighting type. With wide-field illumination, it is expected to analyze 100 or more per second.
- the scattering intensity derived from the enzymatic reaction product can be selectively extracted by adjusting the angle of the narrow linewidth bandpass filter.
- SERS chip An example of a microchamber array (SERS chip) in which metal nanostructures are solid-phased in microchambers used in the present technology will be described. However, in the present technology, a droplet can be used instead of the microchamber array, but this will be described separately.
- the SERS chip according to this technology can obtain uniform SERS light intensity. Ensuring uniformity is to form metal nanostructures uniformly within each chamber. The reason is that strong SERS light is generated in minute gaps (gaps) in the metal nanostructure. It is possible to control the formation of metal nanostructures in the chamber and form numerous gap structures to stabilize the degree of amplification.
- An example of the microchamber is a cylindrical shape with a glass bottom and a fluororesin periphery. As shown in FIG. 3, it is preferable to chemically modify the glass portion of the bottom surface of the microchamber so that the metal nanostructure covers the entire bottom surface of the chamber. The sensitivity and uniformity can be further improved by optimizing the metal species, shape, size, forming conditions, excitation wavelength, chamber volume, etc. that constitute the metal nanostructure.
- the SERS chip described above can be manufactured, for example, as follows.
- a substrate 510 is prepared.
- Examples of materials for the substrate 510 include glass and resin.
- Glass is not particularly limited. Examples of glass include quartz glass, borosilicate glass, soda-lime glass, and the like.
- resins examples include polyethylene, polypropylene, polystyrene, polycarbonate, cyclic polyolefin, and acrylic.
- polycarbonate is also used as a material for inexpensive mass-producible CDs and DVDs, and is suitable from the viewpoint of low-cost production of microchamber arrays.
- the material of the substrate 510 is preferably glass or polycarbonate, more preferably glass.
- a film 700 is laminated on the surface of the substrate 510. Then, as shown in FIG. 4(b), a film 700 is laminated on the surface of the substrate 510. Then, as shown in FIG. 4(b), a film 700 is laminated on the surface of the substrate 510. Then, as shown in FIG. 4(b), a film 700 is laminated on the surface of the substrate 510. Then, as shown in FIG. 4(b), a film 700 is laminated on the surface of the substrate 510.
- Materials for the film 700 include fluorine-based resins, cyclic polyolefins, silicone-based resins, and the like.
- the thickness of the membrane 700 is not particularly limited, but can be set as appropriate in consideration of the volume of the microchamber.
- a resist film 710 is laminated on the surface of the film 700. Then, as shown in FIG. 4(c), a resist film 710 is laminated on the surface of the film 700. Then, as shown in FIG. Subsequently, using a mask having a microchamber array pattern, the resist film 710 is exposed by irradiating active energy rays with an exposure machine. Subsequently, development is performed with a developer to remove the resist film 710 from the portions where the microchambers are to be formed.
- the film 700 masked with the resist film 710 is etched to form microchambers 530 in the film 700 .
- the substrate is washed to remove the resist film 710 to obtain an array of microchambers 530 .
- a microchamber array having a plurality of microchambers is obtained.
- a metal nanostructure is solid-phased on the bottom surface of the well 530 of the fabricated microchamber array.
- a cationic functional group is introduced to the bottom surface of the microchambers 530 of the microchamber array.
- a dispersion of metal nanoparticles and trifluoroacetic acid, which is an aggregation accelerator, are mixed and dropped into the microchamber to form aggregates of negatively charged metal nanoparticles on the bottom surface of the microchamber.
- microchamber array is obtained in which metal nanostructures, which are aggregates of metal nanoparticles, are solid-phased on the bottom of the microchambers.
- the volume of the microchamber is not particularly limited, but is preferably 1aL to 1nL, more preferably 1fL to 1pL.
- "a" (ato), “f” (femto), “p” (pico) and “n” (nano) represent 10 -18 , 10 -15 , 10 -12 and 10 -9 respectively. is a prefix.
- examples of metal nanostructures include metal nanoparticle aggregates obtained by aggregating metal nanoparticles in the presence of an aggregating agent, and regular array structures of metal nanostructures using the closest-packed array of polystyrene beads as a template. be done.
- Metal nanostructures also include metal nanodot arrays based on anodized porous alumina.
- the metal type of the metal nanostructure is not particularly limited, but at least one selected from the group consisting of silver, gold, copper, platinum, palladium, aluminum and titanium is preferable, and the group consisting of silver, gold, platinum and palladium. At least one selected from is more preferable, silver or gold is more preferable, and silver is still more preferable. Two or more different metals may be used in combination. Also, an alloy of two or more metals may be used. Core-shell type particles of two or more kinds of metals can also be used as the metal nanoparticles.
- the shape of the metal nanoparticles when forming the metal nanostructures using the metal nanoparticles is not particularly limited, but examples thereof include spherical, subspherical, rod-shaped, cubic, elliptical, triangular, bipyramidal, stars, etc. Two or more kinds of metal nanoparticles having different shapes may be used in combination.
- the average particle size of the primary particles of the metal nanoparticles is not particularly limited, but is preferably 1 to 1500 nm, more preferably 1 to 500 nm, even more preferably 10 to 100 nm.
- the volume of the primary particles of the metal nanoparticles is not particularly limited, but is preferably 1 nm 3 to 1 ⁇ m 3 .
- the metal nanoparticles may be metal nanoparticle aggregates in which multiple metal nanoparticles aggregate. Aggregates of metal nanoparticles can be produced, for example, by treating metal nanoparticles (primary particles) with an aggregation promoter such as trifluoroacetic acid to aggregate them.
- an aggregation promoter such as trifluoroacetic acid
- the metal nanoparticles can be produced by a conventionally known method.
- metal nanoparticles as aggregates, a myriad of fine gaps between adjacent particle pairs are formed, and the number of molecules present in the gaps can be increased, so Raman scattering is further enhanced, resulting in increased sensitivity. It becomes easier to improve.
- the number of microchambers per microchamber array is not particularly limited, but is preferably 100 or more, more preferably 1,000 or more, and even more preferably 10,000 or more.
- the upper limit of the number of microchambers per microchamber array is not particularly limited, it is preferably 10,000,000 or less because it is undesirable to take too much time to measure the brightness of the bright spots and count the number.
- the enzymatic reaction of the selective substrate is performed for each microreaction space (microchamber or droplet) enclosing an enzyme of one molecule or less, the selective substrate of the enzyme, and the metal nanostructure.
- the surface-enhanced Raman scattering intensity derived from the product or the selective substrate is measured, and the surface-enhanced Raman scattering intensity changes by a preset value or more, or the number of reaction spaces that is a preset threshold value or more or a threshold value or less.
- the function of the enzyme (decomposition of the substrate) is captured for each molecule using a minute reaction space, and the number of enzyme molecules can be directly calculated from the number of minute reaction spaces in which changes are observed. By counting, the enzyme concentration in the specimen can be measured more quantitatively and with high sensitivity.
- a first embodiment of the enzyme measurement method of the present technology includes a mixed solution preparation step of preparing a mixed solution containing an enzyme and a selective substrate of the enzyme, and a plurality of microchambers in which metal nanostructures are immobilized.
- a step of measuring the number of bright spots for measuring the number of microchambers that are equal to or greater than or equal to or less than a preset threshold the enzymatic reaction product exhibits a structure different from that of the selective substrate, and the Raman peak can distinguish between the enzymatic reaction product and the selective substrate.
- Examples of the enzymes include acetylcholinesterase, butyrylcholinesterase, phospholipase, elastase, amylase, and the like.
- Acetylcholinesterase is present in nerve tissue, red blood cells, etc., and is one of the neurotransmitters of cholinergic nerves (parasympathetic nerves, motor nerves, sympathetic nerve centers to ganglia). decompose into Although AChE itself is acetylated by Ach degradation and deactivated, deacetylation occurs in several milliseconds and it regains activity.
- Butyrylcholinesterase (BuChE) is synthesized in the human liver, is present in serum, etc., and degrades various choline esters including ACh.
- the selective substrate of the enzyme exhibits a structure different from that of the enzymatic reaction product of the selective substrate, and is capable of distinguishing between the enzymatic reaction product and the selective substrate by the Raman peak.
- the enzymatic reaction product has a molecular structure capable of interacting with the metal nanostructure.
- the selective substrate of the enzyme can be appropriately selected according to the type of enzyme.
- -acetylthiomethylpiperidinium The BuChE hydrolysis products of BTC are thiocholine and butyric acid, and the AChE hydrolysis products of MATP+ are 1,1-dimethyl-4-mercaptomethylpiperidinium and acetic acid.
- Thiocholine and 1,1-dimethyl-4-mercaptomethylpiperidinium are preferable because they have a thiol group (mercapto group) in the molecule and are easily trapped on the surface of the metal nanoparticles described below.
- Thiocholine and 1,1-dimethyl-4-mercaptomethylpiperidinium are also preferred because they are a combination of compounds that can be easily distinguished from the Raman scattering spectrum.
- water is preferable as the solvent or dispersion medium for the mixed liquid.
- the water is preferably ultrapure water such as milli-Q water or ultrafiltered water (UF water), but the water in which the enzyme or selective substrate is dissolved or dispersed may be used as the solvent or dispersion medium for the mixed solution. .
- the mixed solution may contain a surfactant in addition to the enzyme, selective substrate and solvent.
- the type of surfactant is not particularly limited as long as it does not inhibit the reaction between the enzyme and its selective substrate.
- examples include Triton X-100 (t-octylphenoxypolyethoxyethanol; Triton X-100). to be
- the concentration of the surfactant is not particularly limited as long as it does not inhibit the reaction between the enzyme and its selective substrate.
- the mixed solution is used so that there is no more than one enzyme molecule per microchamber. If appropriate, the mixture may be diluted and used. Water is preferred as the solvent or dispersion medium used for dilution. As water, ultrapure water such as Milli-Q water and ultrafiltration water (UF water) is preferable.
- Array preparation step In the array preparation step, a metal nanostructure-immobilized microchamber array (SERS chip) having a plurality of microchambers in which metal nanostructures are immobilized is prepared.
- SERS chip metal nanostructure-immobilized microchamber array
- the SERS chip can be manufactured, for example, according to the manufacturing method described above.
- the mixed solution enclosing step In the mixed solution enclosing step, the mixed solution is enclosed in each of the plurality of microchambers of the SERS chip prepared in the array preparation step so that the number of molecules of the enzyme is one or less. That is, the number of molecules of the enzyme contained in one microchamber is one or less.
- the mixed solution prepared in the mixed solution preparation step may be used after being diluted as appropriate.
- the mixed liquid in the SERS chip for example, after distributing the mixed liquid to each microchamber, oil or liquid paraffin is layered and enclosed in the mixed liquid in the microchambers.
- the SERS chip described above has a high water repellency because the upper surface of the SERS chip is coated with a fluororesin.
- a reaction product (enzyme reaction product) is generated between the enzyme and its selective substrate. Since the volume of the mixed solution is small, the enzymatic reaction products are located near the metal nanostructures in the mixed solution.
- LSPR localized surface plasmon resonance
- SERS Surface-enhanced Raman scattering enhances the Raman scattering intensity of molecules in close proximity to the surface of metal nanoparticles by orders of magnitude.
- the enzymatic reaction product may exist in the vicinity of the metal nanostructure, but may be adsorbed or bound to the surface of the metal nanostructure.
- the Raman scattered light can be enhanced and the sensitivity can be further improved.
- a method for enclosing the mixed liquid in the microchamber is, for example, encapsulation with oil.
- Oils include, but are not limited to, inert oils such as fomblin, mineral oil, hexadecane, 3M Fluorinert FC-40, 3M Fluorinert FC-70.
- the surface-enhanced Raman scattering intensity derived from the enzyme reaction product of the selective substrate or the selective substrate has changed by a preset value or more, or is a preset threshold value or more or a threshold value or less. Count the number of chambers.
- a Raman scattering image may be obtained at the bottom of the Raman peak of the enzyme reaction product or the selective substrate, and the surface-enhanced Raman scattering light intensity may be quantified from the difference between the top and bottom.
- the number of microchambers whose surface-enhanced Raman scattering intensity has changed to a preset value or more, or whose surface-enhanced Raman scattering intensity is greater than or equal to a preset threshold or less than a threshold is counted.
- the preset value or threshold is determined, for example, by using a sample containing an enzyme and a selective substrate of the enzyme and a sample that does not contain at least one of the enzyme and the selective substrate of the enzyme.
- the surface-enhanced Raman scattering light intensity derived from the enzymatic reaction product or the selective substrate can be measured and experimentally obtained as a value capable of distinguishing between the two samples.
- a method for determining the preset value or threshold is not particularly limited, and can be determined using a general statistical method, for example. By comparing the predetermined value or threshold value and the surface-enhanced Raman scattering light intensity derived from the selective substrate or the enzymatic reaction product of the selective substrate measured in the step of measuring the number of bright spots, the enzyme is contained in the microchamber. It is possible to judge whether or not
- the narrow linewidth bandpass filter may be composed of a single narrow linewidth bandpass filter, or may be composed of two or more bandpass filters in combination to narrow the transmission band.
- the narrow linewidth bandpass filter may adjust the transmission band by using the angular dependence of the transmission band.
- a first embodiment of an enzyme measurement method of the present technology includes a mixed solution preparation step of preparing a mixed solution containing multiple types of enzymes and multiple types of selective substrates corresponding to the multiple types of enzymes, and a metal nanostructure an array preparation step of preparing a metal nanostructure-immobilized microchamber array having a plurality of microchambers immobilized with a body; a mixed solution encapsulating step of enclosing the mixed solution so that the number of molecules is 1 or less; and measuring the number of microchambers in which the surface-enhanced Raman scattering intensity derived from the selective substrate has changed to a preset value or more, or has a preset threshold value or more or a threshold value or less.
- the enzymatic reaction product exhibits a structure different from that of the selective substrate
- the Raman peak distinguishes the enzymatic reaction product from the selective substrate
- the plurality of types of enzymatic reaction products are different from each other.
- the Raman peaks exhibit different structures and can distinguish multiple types of the enzymatic reaction products or the selective substrates.
- the basic example of the first embodiment described above is that in the mixed solution preparation step, a mixed solution containing multiple types of enzymes and multiple types of selective substrates corresponding to the multiple types of enzymes is prepared; In the step, the mixed solution is enclosed in each of the plurality of microchambers so that the number of molecules of at least one of the plurality of types of enzymes is 1 or less; The difference is in identifying the enzymatic reaction product or the selective substrate, but the other points are substantially the same.
- a second embodiment of the enzyme measurement method of the present technology includes a mixed solution preparation step of preparing a mixed solution containing an enzyme and a selective substrate of the enzyme, and a plurality of microchambers in which metal nanostructures are immobilized.
- the enzymatic reaction product exhibits a structure different from that of the selective substrate, and the Raman peak can distinguish between the enzymatic reaction product and the selective substrate.
- the step of measuring the number of bright points of the first embodiment is temporal measurement in which surface-enhanced Raman scattering intensity derived from an enzyme reaction product or a selective substrate is measured for each of the plurality of microchambers over time. process has been changed. Others are substantially the same as those of the first embodiment.
- Measuring the enzymatic activity as a scattering intensity change per unit time by measuring the surface-enhanced Raman scattering intensity derived from the enzymatic reaction product or the selective substrate over time for each of the plurality of microchambers in the time course measurement step. can be done. By measuring the enzyme activity, it is also possible to obtain information such as what the multimeric enzyme is.
- a second embodiment of the enzyme measurement method of the present technology includes a mixed solution preparation step of preparing a mixed solution containing multiple types of enzymes and multiple types of selective substrates corresponding to the multiple types of enzymes, and a metal nanostructure an array preparation step of preparing a metal nanostructure-immobilized microchamber array having a plurality of microchambers immobilized with a body; a mixed solution encapsulating step of enclosing the mixed solution so that the number of molecules is 1 or less;
- the enzyme measurement method may include a temporal measurement step of temporally measuring the surface-enhanced Raman scattering intensity derived from the selective substrate for each of the plurality of microchambers.
- the Raman peak distinguishes the enzymatic reaction product from the selective substrate, and the plurality of types of enzymatic reaction products are different from each other.
- the Raman peaks exhibit different structures and can distinguish multiple types of the enzymatic reaction products or the selective substrates.
- the basic example of the second embodiment described above is that in the mixed solution preparation step, a mixed solution containing multiple types of enzymes and multiple types of selective substrates corresponding to the multiple types of enzymes is prepared; In the step, the mixed solution is enclosed in each of the plurality of microchambers so that the number of molecules of at least one of the plurality of types of enzymes is 1 or less; The difference is in the identification of the product or the selective substrate, but the rest is substantially the same.
- a third embodiment of the enzyme measurement method of the present technology includes a mixed solution preparation step of preparing a mixed solution containing an enzyme, a selective substrate of the enzyme, and a metal nanostructure; a droplet splitting step of splitting into a plurality of droplets containing no more than one; and measuring the number of droplets whose surface-enhanced Raman scattering intensity has changed to a preset value or more, or whose surface-enhanced Raman scattering intensity is above or below a preset threshold.
- the enzymatic reaction product exhibits a structure different from that of the selective substrate, and the Raman peak can distinguish between the enzymatic reaction product and the selective substrate.
- the first embodiment of the present technology is that a mixed solution containing an enzyme, a selective substrate of the enzyme, and a metal nanostructure is used, and instead of enclosing the mixed solution in a microchamber, one molecule of the enzyme
- the difference is that the droplets are divided into a plurality of droplets containing one or less droplets.
- a method of division a method of emulsifying by injecting the mixed liquid into the oil with a jet, and the like can be mentioned.
- Oils include, but are not limited to, inert oils such as fomblin, mineral oil, hexadecane, 3M Fluorinert FC-40, and 3M Fluorinert FC-70.
- the Raman scattering intensity of each droplet may be measured two-dimensionally by spreading the droplet on a plane, or one-dimensionally measuring the droplet one by one.
- a third embodiment of the enzyme measurement method of the present technology includes a mixed solution preparation step of preparing a mixed solution containing a plurality of types of enzymes and a plurality of types of selective substrates corresponding to the plurality of types of enzymes; a droplet splitting step of splitting into a plurality of droplets containing at least one molecule of at least one of the plurality of types of enzymes, and illuminating the plurality of droplets with excitation light to illuminate the
- the surface-enhanced Raman scattering intensity derived from the enzyme reaction product of the selective substrate or the selective substrate has changed to a preset value or more, or the number of droplets whose intensity is a preset threshold value or more or a threshold value or less is measured.
- It may be a measuring method of an enzyme including a scoring step. wherein the enzymatic reaction product exhibits a structure different from that of the selective substrate, the Raman peak distinguishes the enzymatic reaction product from the selective substrate, and the plurality of types of enzymatic reaction products are different from each other.
- the Raman peaks exhibit different structures and can distinguish multiple types of the enzymatic reaction products or the selective substrates.
- the third embodiment is adapted to multiple types of enzymes and substrates.
- a fourth embodiment of the enzyme measurement method of the present technology includes a mixed solution preparation step of preparing a mixed solution containing an enzyme, a selective substrate of the enzyme, and a metal nanostructure; a droplet splitting step of splitting into a plurality of droplets containing no more than one; and a temporal measurement step of temporally measuring the surface-enhanced Raman scattering intensity for each of the plurality of droplets.
- the enzymatic reaction product exhibits a structure different from that of the selective substrate, and the Raman peak can distinguish between the enzymatic reaction product and the selective substrate.
- the step of measuring the number of bright spots in the third embodiment is changed to a temporal measurement step of temporally measuring the surface-enhanced Raman scattering intensity derived from the enzymatic reaction product for each of the plurality of droplets. ing. Others are substantially the same as those of the third embodiment.
- the enzyme activity can be measured as a change in scattering intensity per unit time. By measuring the enzyme activity, it is also possible to obtain information such as what the multimeric enzyme is.
- a fourth embodiment of the enzyme measurement method of the present technology includes a mixed solution preparation step of preparing a mixed solution containing a plurality of types of enzymes and a plurality of types of selective substrates corresponding to the plurality of types of enzymes; a droplet splitting step of splitting into a plurality of droplets containing at least one molecule of at least one of the plurality of types of enzymes, and illuminating the plurality of droplets with excitation light to illuminate the a temporal measurement step of temporally measuring an enzymatic reaction product of a selective substrate or surface-enhanced Raman scattering intensity derived from the selective substrate for each of the plurality of droplets. .
- the Raman peak distinguishes the enzymatic reaction product from the selective substrate, and the plurality of types of enzymatic reaction products are different from each other.
- the Raman peaks exhibit different structures and can distinguish multiple types of the enzymatic reaction products or the selective substrates.
- the fourth embodiment is adapted to multiple types of enzymes and substrates.
- kits The present technology also includes the above-described SERS chip (a metal nanostructure-immobilized microchamber array having a plurality of microchambers in which metal nanostructures are immobilized), and the above-described first or second embodiment. Also provided are kits containing a protocol describing the procedure for measuring the enzyme. The kit may contain standard reagents and other components in addition to the SERS chip and protocol.
- One embodiment of the Raman scattering image capturing method of the present technology is to align the transmission wavelength band of a narrow linewidth bandpass filter with the top of the Raman peak of the target molecule, irradiate the sample with a laser beam expanded to the entire field of view, and This is a Raman scattering image capturing method for capturing a Raman scattering image with a two-dimensional photodetector during irradiation.
- the transmission wavelength band of the narrow linewidth bandpass filter may be matched with the bottom of the Raman peak of the target molecule.
- the target molecules are arranged in the plurality of microchambers of a microchamber array having a plurality of microchambers.
- the microchamber array preferably has metal nanostructures immobilized in the plurality of microchambers.
- the microchamber array for example, the microchamber array of the present technology described above is preferably used, and the target molecule is arranged in each microchamber.
- the target molecule is preferably arranged on the metal nanostructure.
- the Raman scattering image capturing method of the present embodiment can be implemented, for example, in the same manner as the enzyme measurement method of the present technology described above.
- narrow linewidth bandpass filter for example, the same one as that used in the method for measuring the enzyme of the present technology described above can be used.
- target molecule examples include, but are not limited to, the enzymes described above.
- One embodiment of the method for measuring a target molecule of the present technology is to align the transmission wavelength band of a narrow linewidth bandpass filter with the top of the Raman peak of the target molecule, irradiate the sample with a laser beam expanded to the entire field of view, and perform laser irradiation.
- a method for measuring a target molecule using Raman scattering in which a Raman scattering image is captured by a two-dimensional photodetector and the concentration distribution of the target molecule is extracted from the obtained Raman scattering image.
- the transmission wavelength band of the narrow linewidth bandpass filter may be adjusted to the bottom of the Raman peak of the target molecule.
- the concentration distribution of the target molecule is obtained by taking the difference between the Raman scattering images photographed in the top transmission wavelength band and the bottom transmission wavelength band of the Raman peak of the target molecule. Extraction is preferred.
- the target molecule is preferably arranged in the plurality of microchambers of a microchamber array having a plurality of microchambers.
- the microchamber array preferably has metal nanostructures immobilized in the plurality of microchambers.
- the microchamber array for example, the microchamber array of the present technology described above is preferably used, and the target molecule is arranged in each microchamber.
- the target molecule In the method for measuring the target molecule of the present embodiment, it is preferable to dispose the target molecule on the metal nanostructure.
- the method for measuring the target molecule of the present embodiment can be implemented, for example, in the same manner as the method for measuring the enzyme of the present technology described above.
- narrow linewidth bandpass filter for example, the same one as that used in the method for measuring the enzyme of the present technology described above can be used.
- target molecule examples include, but are not limited to, the enzymes described above.
- This technology can be suitably applied to liquid biopsy. Specifically, for example, by measuring enzymes in liquid components such as blood, detailed information on human cancer can be obtained more quickly and with less invasiveness.
- cancer-related enzymes include thymidine kinase, galactosyltransferase, and the like.
- This technique introduces the concept of digital detection into SERS spectroscopy, and is an ultra-sensitive enzyme concentration measurement technique in which the number of enzyme molecules is plotted on the vertical axis.
- concentration quantification of target molecules has been performed with scattered light intensity as the vertical axis.
- This technology is unique in that it fuses spectroscopic measurement technology and bio-single-molecule measurement technology.
- a fluorescent substrate has been used to measure the activity of a single enzyme molecule.
- This technology captures the Raman scattering light of the enzymatic reaction product itself of the substrate, and can simultaneously quantify multiple substrate degradation reactions of one molecule of enzyme by utilizing the unlabeled and narrow linewidth spectrum.
- this technology removes the barrier of activity inhibition by fluorescently labeled substrates, broadens the types of enzymes that can be measured, and has the unprecedented advantage of being able to identify enzyme types. .
- Step S1 A cover glass of 24 mm x 32 mm was placed on a glass stand and immersed in an 8N potassium hydroxide aqueous solution.
- Step S2 Ultrasonic treatment (90 minutes) was performed.
- - Process S3 It left still (1 day).
- - Step S4 Rinse with pure water.
- Step S5 Water droplets on the glass were removed by an air blow.
- Step S6 A fluororesin (9% Cytop (fluororesin, manufactured by AGC)) was dropped onto the glass.
- Step S7 Spin coating was performed at a rotation speed of 1000 rpm for 30 seconds.
- Step S8 Bake at 80°C for 10 minutes and at 180°C for 1 hour.
- Step S9 A positive photoresist (AZ P4620 (manufactured by AZ Electronic Materials)) was dropped on the Cytop-coated glass.
- - Step S10 Spin coating was performed at a rotation speed of 7500 rpm for 30 seconds.
- - Step S11 Bake at 100°C for 5 minutes.
- - Step S12 Allowed to stand (5 minutes or more, humidity of 60% or more).
- Step S13 A chromium mask (holes with a diameter of 1.8 ⁇ m arranged in an array at a pitch of 8 ⁇ m) was brought into close contact with the resist-coated glass.
- - Step S14 UV exposure for 20 seconds.
- Step S15 The exposed cover glass was placed on a glass stand and immersed in a developer (AZ300 MIF (manufactured by AZ Electronic Materials)) for 90 seconds.
- - Step S16 Rinse with pure water.
- Step S17 Dry etching was performed by a reactive ion etching (RIE) apparatus using oxygen gas (the exposed Cytop without resist protection was removed on the glass).
- RIE reactive ion etching
- Step S18 The cover glass was placed on a glass stand and immersed in acetone (to remove the resist).
- - Step S19 Ultrasonic treatment (90 seconds) was performed.
- - Step S20 Immerse in isopropanol.
- - Process S21 It left still (90 seconds).
- - Step S22 Rinse with pure water.
- Step S23 Water droplets on the glass were removed by an air blow.
- - Step S24 The diameter and depth of the Cytop hole were confirmed with a laser microscope.
- step S7 The rotation speed of step S7 was adjusted between 1000 and 7500 rpm
- step S10 The rotation speed in step S10 was adjusted between 1000 and 7500 rpm.
- the diameter and pitch of the photomask in step S13 are not limited to those described above.
- the chamber in step S24 is assumed to have a diameter of 0.1 to 100 ⁇ m and a depth of 0.01 to 100 ⁇ m.
- the volume in this case is roughly 1aL to 1nL.
- the microchamber array had a diameter of 3.2 ⁇ m, a depth of 1.6 ⁇ m, and a pitch of 8 ⁇ m.
- the microchamber volume was approximately 13 fL.
- microchamber array produced by the above procedure may be referred to as a "device”.
- Step 1 Glass hydrophilic treatment
- Step 2 Ultrasonic treatment (20 minutes) was performed.
- Process 3 It left still (20 minutes).
- Step 4 Rinse with Milli-Q water.
- Step 16 Water droplets on the device were removed by an air blow.
- Step 17 20 ⁇ L of 40 nm silver nanoparticle dispersion and 20 ⁇ L of 0.03% trifluoroacetic acid (TFA) were mixed and dropped onto the device (TFA was added to promote the formation of aggregates of silver fine particles. rice field).
- Step 18 Placed on an aluminum block cooled on ice while the liquid droplets were placed thereon.
- - Process 19 It left still (1 minute).
- Step 20 While the liquid droplets were placed, it was housed in a high-humidity/light-shielding box and stored in a refrigerator (4°C).
- - Process 21 It left still (1 day or more). The fabrication of the SERS chip has been completed.
- the silver nanoparticle dispersion in step 17 is assumed to have a diameter of 1 to 1500 nm.
- Gold, copper, platinum, palladium, aluminum, titanium, etc. can also be used as other metal species. Alloys of these, core-shell structures, and the like can also be used. Various shapes such as spheres, rods, ellipses, triangles, cubes, bipyramids, and stars can be used for the metal nanoparticles.
- Fig. 5 is a scattering image of a SERS chip in which aggregates of silver nanoparticles are immobilized on a microchamber array.
- the surfactant in step 23 was 100 ⁇ M Triton-X in this example.
- Other surfactants can also be used without particular limitation.
- the oil in step 24 was Fomblin in this example.
- Other oils are not particularly limited and can be used.
- other than Fomblin mineral oil, hexadecane, 3M Fluorinert FC-40 (manufactured by 3M), 3M Fluorinert FC-70 (manufactured by 3M) and the like can be used as the oil.
- step 25 in addition to absorption by filter paper, a method of sucking the solution with a pipette, a method of flushing with oil using a flow path, etc. can be used without particular limitation.
- Step 32 The irradiation of the laser light and the exposure of the two-dimensional photodetector were stopped.
- Step 33 The angle of the narrow linewidth bandpass filter was adjusted to match the transmission wavelength band with the bottom (tail) of the Raman peak of the reaction product.
- Step 34 The sample was irradiated with laser light expanded to the entire field of view (the irradiation time was the same as in step 30).
- Step 35 During laser irradiation, a scattered image of the SERS chip was taken with a two-dimensional photodetector (CMOS camera, CCD camera, etc.) (same exposure time as step 31).
- Step 36 The irradiation of the laser light and the exposure of the two-dimensional photodetector were stopped.
- Step 37 The sample stage of the microscope was moved.
- Step 38 Steps 29 to 37 were repeated (in step 37, the sample table was moved in a tiled manner).
- the exposure time of the detector in steps 31 and 34 is preferably 1 millisecond to 100 seconds. In this example, it was 2 seconds.
- step 37 scanning was performed 30 times at a vertical pitch of 60 ⁇ m and 9 times at a horizontal pitch of 135 ⁇ m, and a total of 270 points were imaged.
- FIG. 6 is a schematic diagram of the optical system of a wide-field Raman microscope.
- Step 39 The difference between the images captured in step 30 (peak top) and step 32 (beak bottom) was obtained for each position of the sample stage.
- Step 40 The differential images obtained in step 39 were arranged in tiles according to the movement order of the sample stage.
- Step 41 The number of microchambers (bright spots) brighter than the set threshold was counted.
- Step 27-s The SERS chip was placed on the sample stage of the microscope. • Step 28-s: The objective lens was focused on the bottom surface of the microchamber. Step 29-s: The sample was irradiated with a linear (y-direction) laser beam (several milliseconds to several tens of seconds).
- Step 29-s The sample was irradiated with a linear (y-direction) laser beam (several milliseconds to several tens of seconds).
- Step 29-s The sample was irradiated with a linear (y-direction) laser beam (several milliseconds to several tens of seconds).
- CMOS camera, CCD camera, etc.) connected to the spectrometer captured a scattered spectral image (y- ⁇ ) of the SERS chip (exposure time: several milliseconds to tens of seconds).
- Step 31-s The irradiation of the laser light and the exposure of the two-dimensional photodetector were stopped.
- Step 32-s The sample stage of the microscope was moved in a direction (x direction) perpendicular to the laser line.
- Step 33-s Steps 29-s to 32-s were repeated.
- Step 34-s The scattering spectroscopic image (y- ⁇ ) acquired while scanning in the x-direction was reconstructed into xy- ⁇ data.
- Step 35-s xy- ⁇ 1 and xy- ⁇ 3 were extracted with the ⁇ direction aligned with the top ( ⁇ 1) and bottom ( ⁇ 3) of the Raman peak of the reaction product, respectively.
- Step 36-s The difference between xy- ⁇ 1 and xy- ⁇ 3 was taken.
- Step 37-s The number of microchambers (bright spots) brighter than the set threshold was counted.
- the scanning pitch (x direction) in step 32-s is 0.5 ⁇ m in this example.
- the length (y-direction) of the linear laser was 140 ⁇ m in this example.
- the SERS spectra derived from 1,1-dimethyl-4-mercaptomethylpiperidinium, which is an enzymatic reaction product by acetylcholinesterase, and thiocholine, which is an enzymatic reaction product by butyrylcholinesterase, are shown. observed in different microchambers.
- the enzyme concentration in the sample can be quantified with high sensitivity, the function of the enzyme (substrate decomposition) can be detected more quantitatively for each molecule. Furthermore, substrates with different reactivities can be used to simultaneously identify and quantify a plurality of enzymatic activities. INDUSTRIAL APPLICABILITY According to the present invention, it becomes possible to quantify the concentration of an enzyme in a sample, which has been impossible due to lack of sensitivity and discriminative ability, and can widely contribute to medical and biological research.
- DESCRIPTION OF SYMBOLS 100 High-speed Raman spectral imaging apparatus 101... Laser light source 102, 106, 110... Flip mirror for optical path switching 103, 108... Mirror, 104... Cylindrical lens, 105, 107, 111, 117... Lens, 109... Dichroic filter , 114... Slit, 115... Spectroscope, 116... CCD, 118... Narrow line width bandpass filter, 119... sCMOS, 112... Objective lens, 113... Sample, 510... Substrate, 530... Well, 700... Film, 710... resist film
Landscapes
- Health & Medical Sciences (AREA)
- Nuclear Medicine, Radiotherapy & Molecular Imaging (AREA)
- Physics & Mathematics (AREA)
- Life Sciences & Earth Sciences (AREA)
- Chemical & Material Sciences (AREA)
- Analytical Chemistry (AREA)
- Biochemistry (AREA)
- General Health & Medical Sciences (AREA)
- General Physics & Mathematics (AREA)
- Immunology (AREA)
- Pathology (AREA)
- Investigating, Analyzing Materials By Fluorescence Or Luminescence (AREA)
Priority Applications (1)
| Application Number | Priority Date | Filing Date | Title |
|---|---|---|---|
| JP2023566364A JPWO2023106372A1 (https=) | 2021-12-08 | 2022-12-08 |
Applications Claiming Priority (2)
| Application Number | Priority Date | Filing Date | Title |
|---|---|---|---|
| JP2021199642 | 2021-12-08 | ||
| JP2021-199642 | 2021-12-08 |
Publications (1)
| Publication Number | Publication Date |
|---|---|
| WO2023106372A1 true WO2023106372A1 (ja) | 2023-06-15 |
Family
ID=86730458
Family Applications (1)
| Application Number | Title | Priority Date | Filing Date |
|---|---|---|---|
| PCT/JP2022/045297 Ceased WO2023106372A1 (ja) | 2021-12-08 | 2022-12-08 | 酵素の測定方法、マイクロチャンバーアレイ、キット、ラマン散乱像の撮影方法、及び目的分子の測定方法 |
Country Status (2)
| Country | Link |
|---|---|
| JP (1) | JPWO2023106372A1 (https=) |
| WO (1) | WO2023106372A1 (https=) |
Citations (3)
| Publication number | Priority date | Publication date | Assignee | Title |
|---|---|---|---|---|
| WO2010016267A1 (ja) * | 2008-08-08 | 2010-02-11 | 独立行政法人科学技術振興機構 | 粒子プローブ近傍に存在する物質の分布を検出する方法、粒子プローブを用いた画像化方法およびその利用 |
| JP2011511933A (ja) * | 2008-01-07 | 2011-04-14 | ダイナミック スループット インコーポレイテッド | 一体型マイクロ流体バイオマーカー光学検出アレイデバイスを用いた発見ツールおよび使用方法 |
| JP2021120646A (ja) * | 2020-01-30 | 2021-08-19 | 国立大学法人秋田大学 | 表面増強ラマン散乱の測定方法及び表面増強ラマン散乱ユニット |
-
2022
- 2022-12-08 JP JP2023566364A patent/JPWO2023106372A1/ja active Pending
- 2022-12-08 WO PCT/JP2022/045297 patent/WO2023106372A1/ja not_active Ceased
Patent Citations (3)
| Publication number | Priority date | Publication date | Assignee | Title |
|---|---|---|---|---|
| JP2011511933A (ja) * | 2008-01-07 | 2011-04-14 | ダイナミック スループット インコーポレイテッド | 一体型マイクロ流体バイオマーカー光学検出アレイデバイスを用いた発見ツールおよび使用方法 |
| WO2010016267A1 (ja) * | 2008-08-08 | 2010-02-11 | 独立行政法人科学技術振興機構 | 粒子プローブ近傍に存在する物質の分布を検出する方法、粒子プローブを用いた画像化方法およびその利用 |
| JP2021120646A (ja) * | 2020-01-30 | 2021-08-19 | 国立大学法人秋田大学 | 表面増強ラマン散乱の測定方法及び表面増強ラマン散乱ユニット |
Non-Patent Citations (1)
| Title |
|---|
| LI ET AL.: "A practical wide-field Raman imaging method with high spectral and spatial resolution", REVIEW OF SCIENTIFIC INSTRUMENTS, vol. 89, 2018, pages 083103 - 1-083103-5, XP012230541, DOI: 10.1063/1.5041529 * |
Also Published As
| Publication number | Publication date |
|---|---|
| JPWO2023106372A1 (https=) | 2023-06-15 |
Similar Documents
| Publication | Publication Date | Title |
|---|---|---|
| Miao et al. | High-sensitivity nanophotonic sensors with passive trapping of analyte molecules in hot spots | |
| US8325339B2 (en) | Applications of laser-processed substrate for molecular diagnostics | |
| US8184284B2 (en) | Laser-processed substrate for molecular diagnostics | |
| Vo‐Dinh et al. | Plasmonic nanoprobes for SERS biosensing and bioimaging | |
| Park et al. | Plasmonic schirmer strip for human tear-based gouty arthritis diagnosis using surface-enhanced Raman scattering | |
| Gilboa et al. | Optically-monitored nanopore fabrication using a focused laser beam | |
| JP4607127B2 (ja) | 多孔性バイオセンサーおよびラマン分光法を用いる生体分子の検出 | |
| Chang et al. | Large-scale plasmonic microarrays for label-free high-throughput screening | |
| EP2993460B1 (en) | Target-substance detection apparatus and method | |
| Mehta et al. | Dark‐field hyperspectral imaging for label free detection of nano‐bio‐materials | |
| Shi et al. | A scattering nanopore for single nanoentity sensing | |
| US20090213369A1 (en) | Metallic Nanostructures Adapted for Electromagnetic Field Enhancement | |
| CN103926231B (zh) | 光学感测芯片 | |
| KR20160138059A (ko) | 향상된 검정 감도를 위한 디지털 lspr | |
| Navratil et al. | Chemical microscopy applied to biological systems | |
| US12078595B2 (en) | Nanoplasmonic devices and applications thereof | |
| EP4446727A1 (en) | Method for generating spectral data pertaining to microparticle sample, method for analyzing microparticles, method for distinguishing microparticles, method for assessing whether cancer-cell-derived exosomes are present, substrate for measuring spectrum of microparticles, device for measuring spectrum of microparticles, and apparatus for measuring spectrum of microparticles | |
| Luo et al. | Laser-textured High-throughput Hydrophobic/Superhydrophobic SERS platform for fish drugs residue detection | |
| KR101878214B1 (ko) | 최소세제곱 알고리즘을 기반으로 하는 암시야 조명을 이용한 비형광 나노 입자의 3차원 초고분해 영상 이미지의 획득 방법 및 시스템 | |
| Liu et al. | Label-free single-vesicle based surface enhanced Raman spectroscopy: A robust approach for investigating the biomolecular composition of small extracellular vesicles | |
| Zhao et al. | A SERS sensor based on 3D nanocone forests capable of intelligent classification of aquatic product dyes | |
| Chen et al. | Glass‐embedded silver nanoparticle patterns by masked ion‐exchange process for surface‐enhanced Raman scattering | |
| US20150308960A1 (en) | Method of stamping surface-enhance raman spectroscopy for label-free, multiplexed, molecular sensing and imaging | |
| WO2023106372A1 (ja) | 酵素の測定方法、マイクロチャンバーアレイ、キット、ラマン散乱像の撮影方法、及び目的分子の測定方法 | |
| US12005448B2 (en) | Systems and methods of using anisotropic nanostructures in microfluidic devices for binding and optional release of molecules and cells |
Legal Events
| Date | Code | Title | Description |
|---|---|---|---|
| 121 | Ep: the epo has been informed by wipo that ep was designated in this application |
Ref document number: 22904299 Country of ref document: EP Kind code of ref document: A1 |
|
| WWE | Wipo information: entry into national phase |
Ref document number: 2023566364 Country of ref document: JP |
|
| WWE | Wipo information: entry into national phase |
Ref document number: 18716886 Country of ref document: US |
|
| NENP | Non-entry into the national phase |
Ref country code: DE |
|
| 122 | Ep: pct application non-entry in european phase |
Ref document number: 22904299 Country of ref document: EP Kind code of ref document: A1 |