WO2022254989A1 - 固体電解質およびガスセンサ - Google Patents
固体電解質およびガスセンサ Download PDFInfo
- Publication number
- WO2022254989A1 WO2022254989A1 PCT/JP2022/018401 JP2022018401W WO2022254989A1 WO 2022254989 A1 WO2022254989 A1 WO 2022254989A1 JP 2022018401 W JP2022018401 W JP 2022018401W WO 2022254989 A1 WO2022254989 A1 WO 2022254989A1
- Authority
- WO
- WIPO (PCT)
- Prior art keywords
- phase
- solid electrolyte
- plane
- diffraction intensity
- gas sensor
- Prior art date
- Legal status (The legal status is an assumption and is not a legal conclusion. Google has not performed a legal analysis and makes no representation as to the accuracy of the status listed.)
- Ceased
Links
Images





Classifications
-
- C—CHEMISTRY; METALLURGY
- C04—CEMENTS; CONCRETE; ARTIFICIAL STONE; CERAMICS; REFRACTORIES
- C04B—LIME, MAGNESIA; SLAG; CEMENTS; COMPOSITIONS THEREOF, e.g. MORTARS, CONCRETE OR LIKE BUILDING MATERIALS; ARTIFICIAL STONE; CERAMICS; REFRACTORIES; TREATMENT OF NATURAL STONE
- C04B35/00—Shaped ceramic products characterised by their composition; Ceramics compositions; Processing powders of inorganic compounds preparatory to the manufacturing of ceramic products
- C04B35/01—Shaped ceramic products characterised by their composition; Ceramics compositions; Processing powders of inorganic compounds preparatory to the manufacturing of ceramic products based on oxide ceramics
- C04B35/48—Shaped ceramic products characterised by their composition; Ceramics compositions; Processing powders of inorganic compounds preparatory to the manufacturing of ceramic products based on oxide ceramics based on zirconium or hafnium oxides, zirconates, zircon or hafnates
- C04B35/486—Fine ceramics
-
- G—PHYSICS
- G01—MEASURING; TESTING
- G01N—INVESTIGATING OR ANALYSING MATERIALS BY DETERMINING THEIR CHEMICAL OR PHYSICAL PROPERTIES
- G01N27/00—Investigating or analysing materials by the use of electric, electrochemical, or magnetic means
- G01N27/26—Investigating or analysing materials by the use of electric, electrochemical, or magnetic means by investigating electrochemical variables; by using electrolysis or electrophoresis
- G01N27/403—Cells and electrode assemblies
- G01N27/406—Cells and probes with solid electrolytes
- G01N27/407—Cells and probes with solid electrolytes for investigating or analysing gases
-
- H—ELECTRICITY
- H01—ELECTRIC ELEMENTS
- H01B—CABLES; CONDUCTORS; INSULATORS; SELECTION OF MATERIALS FOR THEIR CONDUCTIVE, INSULATING OR DIELECTRIC PROPERTIES
- H01B1/00—Conductors or conductive bodies characterised by the conductive materials; Selection of materials as conductors
- H01B1/06—Conductors or conductive bodies characterised by the conductive materials; Selection of materials as conductors mainly consisting of other non-metallic substances
- H01B1/08—Conductors or conductive bodies characterised by the conductive materials; Selection of materials as conductors mainly consisting of other non-metallic substances oxides
Definitions
- the present disclosure relates to solid electrolytes and gas sensors.
- solid electrolytes made of partially stabilized zirconia in which a stabilizer such as yttria is dissolved in zirconia are known.
- This type of solid electrolyte is sometimes used with a metal layer formed on its surface.
- gas sensors are known in which electrodes and lead wires made of Pt or the like are formed on the surface of a solid electrolyte made of yttria partially stabilized zirconia.
- Patent Document 1 describes a gas sensor composed of a solid electrolyte and an alumina substrate provided integrally with the solid electrolyte.
- the solid electrolyte is made of partially stabilized zirconia in which C phase, M phase, and T phase are mixed.
- the thermal expansion difference between the alumina substrate and partially stabilized zirconia is in the range of 0% to 0.2%.
- I(11-1)/I(111) which is the diffraction intensity ratio of the X-ray diffraction intensity of the (11-1) plane of the M phase to the X-ray diffraction intensity of the (111) plane of the C phase in partially stabilized zirconia is 0.05 or more and 0.4 or less.
- the change in the diffraction intensity ratio after heating the solid electrolyte at 200° C. for 1000 hours is in the range of ⁇ 0.05 to +0.10.
- the present disclosure aims to provide a solid electrolyte that can suppress peeling of the metal layer even when exposed to a thermal cycle that is more severe than before with a metal layer formed on the surface, and a gas sensor using the same. aim.
- One aspect of the present disclosure is a solid electrolyte composed of partially stabilized zirconia in which a stabilizer is dissolved in zirconia, It is a solid electrolyte that satisfies the relationships of formulas 1 and 2 below.
- 0.05 ⁇ IM1 / ICT1 ⁇ 0.4 Equation 1 ⁇ 0.5 ⁇ (I M3 ⁇ I CT2 )/(I M2 ⁇ I CT3 ) ⁇ 1 ⁇ 0.1 Equation 2
- I M1 X-ray diffraction intensity of the (11-1) plane of the M phase at 27°C I CT1 : X-ray diffraction intensity of the total of the (111) plane of the C phase and the (101) plane of the T phase at 27°C I M2 : X-ray diffraction intensity of the (11-1) plane of the M phase at 500°C I CT2 : X-ray diffraction intensity of the total of the (111) plane of the C phase and the (101) plane of the T
- Another aspect of the present disclosure is a gas sensor having the above solid electrolyte.
- the solid electrolyte has the above configuration. Therefore, even when the solid electrolyte with a metal layer formed on its surface is exposed to a thermal cycle that is more severe than before, the solid electrolyte and the metal layer are bonded together during use due to the volume change accompanying the phase transition. The strength is maintained, and peeling of the metal layer can be suppressed.
- the gas sensor has the solid electrolyte. Therefore, even if the number of repetitions of the cooling/heating cycle between the low temperature when the engine is stopped/started (including the restart of a hybrid vehicle or a vehicle equipped with an idling stop function) and the high sensor temperature is increased, It is possible to suppress peeling of electrodes and lead wires made of a metal layer. Therefore, according to the above gas sensor, resistance fluctuation is suppressed, and a gas sensor having high sensor accuracy can be obtained.
- FIG. 1 is an explanatory diagram schematically showing the microstructure of the solid electrolyte (temperature 27° C.) of Embodiment 1
- 2 is an explanatory diagram showing an example of the XRD pattern (temperature of 850° C.) of the solid electrolyte of Embodiment 1
- FIG. 3 is an explanatory diagram schematically showing the relationship between the temperature and the I M /I CT value for the solid electrolyte of Embodiment 1 and a conventional solid electrolyte;
- FIG. 1 is an explanatory diagram schematically showing the microstructure of the solid electrolyte (temperature 27° C.) of Embodiment 1
- 2 is an explanatory diagram showing an example of the XRD pattern (temperature of 850° C.) of the solid electrolyte of Embodiment 1
- FIG. 3 is an explanatory diagram schematically showing the relationship between the temperature and the I M /I CT value for the solid electrolyte of Embodiment 1 and a conventional solid electro
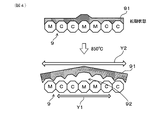
- FIG. 4 is an explanatory diagram schematically showing the behavior of a conventional solid electrolyte having a metal layer formed on its surface when the temperature changes from the initial state to 850° C.
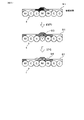
- FIG. 5 is an explanatory diagram schematically showing the behavior of the solid electrolyte of Embodiment 1 having a metal layer formed on the surface when the temperature changes from the initial state to 850° C. to 27° C.
- FIG. 6 is an explanatory diagram schematically showing the outline of the solid electrolyte manufacturing method of Embodiment 1
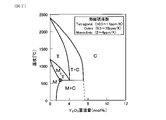
- FIG. 7 is an explanatory diagram showing a part of the phase diagram of zirconia in which Y 2 O 3 is dissolved, FIG.
- FIG. 8 is an explanatory diagram schematically showing a specific example of the method for producing a solid electrolyte of Embodiment 1
- 9 is an explanatory diagram schematically showing an example of the crystal phase ratio in the solid electrolyte of Embodiment 1
- 10 is an explanatory diagram of how to determine the average particle size of the M phase in the solid electrolyte of Embodiment 1
- FIG. 11 is a cross-sectional view of a gas sensor (cup type) according to Embodiment 2
- 12 is a cross-sectional view showing an enlarged part of a gas sensor element included in the gas sensor of FIG. 11
- 13 is a cross-sectional view of a gas sensor (laminated type) according to Embodiment 3
- 14 is a cross-sectional view showing an enlarged gas sensor element included in the gas sensor of FIG. 13.
- FIG. 13 is a cross-sectional view of a gas sensor (cup type) according to Embodiment 2
- 12 is a cross-section
- Embodiment 1 A solid electrolyte of Embodiment 1 will be described with reference to FIGS. 1 to 10.
- FIG. 1 the reference numerals except for the solid electrolyte 1 of the first embodiment will be given only in the description part that particularly refers to the drawings.
- the solid electrolyte 1 of the present embodiment is composed of partially stabilized zirconia in which a stabilizer is dissolved in zirconia.
- stabilizers examples include yttria (Y 2 O 3 ), calcia (CaO), magnesia (MgO), scandia (Sc 2 O 3 ), ytterbia (Yb 2 O 3 ), and the like. These can be used alone or in combination of two or more.
- the content of the stabilizer can be, for example, 3 mol % or more and 11 mol % or less.
- the content of the stabilizer means the amount of stabilizer contained in the entire solid electrolyte 1 (the amount of stabilizer doped in the solid electrolyte 1). From the viewpoint of chemical stability and the like, the stabilizer preferably contains yttria, more preferably yttria.
- the content of yttria is 3 mol % or more and 11 mol % or less from the viewpoint of the strength of the solid electrolyte 1 and suppression of peeling of the metal layer by reducing the difference in thermal expansion coefficient from the metal layer formed on the surface of the solid electrolyte 1. be able to.
- the solid electrolyte 1 of this embodiment satisfies the relationships of Formulas 1 and 2 below.
- 0.05 ⁇ IM1 / ICT1 ⁇ 0.4 Equation 1 ⁇ 0.5 ⁇ (I M3 ⁇ I CT2 )/(I M2 ⁇ I CT3 ) ⁇ 1 ⁇ 0.1 Equation 2
- I M1 X-ray diffraction intensity of the (11-1) plane of the M phase at 27°C
- I CT1 X-ray diffraction intensity of the total of the (111) plane of the C phase and the (101) plane of the T phase at 27°C I M2 : X-ray diffraction intensity of the (11-1) plane of the M phase at 500°C I CT2 : X-ray diffraction intensity of the total of the (111) plane of the C phase and the (101) plane of the T phase at 500°C I M3 : 850 X-ray diffraction intensity of the (11-1) plane of the M phase at ° C.
- I M1
- C phase, M phase, and T phase are crystal phases
- C phase is cubic phase (Cubic phase)
- M phase is monoclinic phase (Monoclinic phase)
- T The phase is a tetragonal phase (Tetragonal phase).
- the Miller index which indicates a crystal plane in a crystal structure, is generally indicated by adding a bar above the number when a minus (-) is attached, but in this specification, a minus (- ) (for example, -1 in (11-1) of the M phase).
- Formulas 1 and 2 have the following technical significance.
- C phase, M phase and T phase, or C phase and M phase can coexist at 27°C.
- 27 ° C. is a low temperature and 850 ° C. is a high temperature, depending on the amount of solid solution of the stabilizer in the M phase
- the M phase undergoes a phase transition to the T phase and volume shrinks.
- the temperature changes from a high temperature to a low temperature it is possible that the T phase transitions to the M phase and expands in volume.
- the temperature of phase transformation between M phase and T phase is about 600°C.
- the present inventors found that the M phase exists at a specific abundance at a low temperature of 27 ° C., and considering variations, 500 ° C., which is a temperature lower than the phase transition temperature.
- the M ⁇ T phase change rate which indicates how much the abundance ratio of the M phase decreased due to a temperature change from 500° C. to a high temperature of 850° C. with respect to the abundance ratio of the M phase at 500° C., is given as a reference temperature.
- the present inventors have found that, within a specific range, peeling of the metal layer can be suppressed even when exposed to a thermal cycle that is more severe than in the past.
- the ratio be I M1 /I CT1 .
- I M1 /I CT1 means the abundance of M phase at 27° C. (300 K).
- I M2 /I CT2 means the abundance of M phase at 500° C. (773 K).
- I M3 /I CT3 means the abundance of M phase at 850° C. (1123 K).
- the diffraction intensity ratio of the X-ray diffraction intensity of the (11-1) plane of the M phase at a predetermined temperature to the total X-ray diffraction intensity of the (111) plane of the C phase and the (101) plane of the T phase at a predetermined temperature Let I M /I CT .
- I M /I CT means the abundance of M phase at a given temperature.
- the X-ray diffraction intensity of the specific crystal plane of the predetermined crystal phase at each temperature was obtained by X-ray diffraction method (X-ray source: CuK ⁇ , 2 ⁇ / ⁇ measurement) on the surface of the solid electrolyte polished with #1500.
- FIG. 2 shows an example of the X-ray diffraction pattern of the solid electrolyte 1 at 850.degree.
- 1M is the peak of the M phase (11-1) plane
- 1CT is the total peak of the (111) plane of the C phase and the (101) plane of the T phase.
- I M1 /I CT1 is set to 0.05 or more and 0.4 or less.
- the solid electrolyte 1 is applied to, for example, a gas sensor, a metal layer made of Pt or the like is formed on the surface of the solid electrolyte 1 for electrodes, lead wires, and the like.
- the solid electrolyte 1 may be used not only with the metal layer but also with other members (dissimilar materials) such as alumina.
- I M1 /I CT1 is less than 0.05, the amount of the M phase in the entire solid electrolyte 1 becomes too small, and the thermal expansion coefficient of the solid electrolyte 1 in the temperature range of 400° C. to 600° C. increases, making it different from other members.
- the solid electrolyte 1 is preferably 0.07 ⁇ I M1 /I CT1 ⁇ 0.38, more preferably 0.09 ⁇ I M1 from the viewpoint of thermal expansion coefficient matching with the metal layer and other members.
- the thermal expansion coefficient of the solid electrolyte 1 can be specifically set to 7.0 ppm/° C. or more and 9.5 ppm/° C. or less. A method for measuring the thermal expansion coefficient of the solid electrolyte 1 will be described later in Experimental Examples.
- (I M3 ⁇ I CT2 )/(I M2 ⁇ I CT3 )-1 is -0.5 or more and -0.1 or less.
- (I M3 ⁇ I CT2 )/(I M2 ⁇ I CT3 ) ⁇ 1 is specifically derived as follows. M indicating how much the abundance of M phase decreased due to temperature change from 500 ° C to 850 ° C with respect to the abundance of M phase at 500 ° C (how much M phase changed to T phase) ⁇ T phase change rate can be calculated from the following formula.
- a solid electrolyte made of partially stabilized zirconia containing a stabilizing agent such as yttria in an amount of about 3 mol % to 11 mol % in the entire solid electrolyte is known.
- This conventional solid electrolyte is generally made by mixing, granulating, molding, and sintering ZrO 2 and a predetermined amount of stabilizer.
- a conventional solid electrolyte manufactured in this manner has at least a mixture of the C phase and the M phase at 27°C.
- the M phase hardly contains a stabilizer and does not transition to the T phase unless the temperature exceeds the operating temperature of the gas sensor.
- the conventional solid electrolyte 9 has a metal layer 91 (in the example of a gas sensor, Pt plating or the like forming electrodes and lead wires) on the surface of the solid electrolyte 9 in a low-temperature initial state.
- the metal layer 91 separates from the solid electrolyte 9 due to the difference in coefficient of thermal expansion between the solid electrolyte 9 and the metal layer 91 , producing a separation portion 92 .
- the linear thermal expansion coefficient of yttria partially stabilized zirconia is approximately 8 ppm/K
- the linear thermal expansion coefficient of Pt is approximately 10 ppm/K.
- the double-ended arrow Y1 shown in FIG. 4 schematically illustrates the magnitude of the linear thermal expansion coefficient of yttria partially stabilized zirconia
- the double-ended arrow Y2 shown in FIG. 4 indicates the linear thermal expansion coefficient of Pt. The size is shown schematically.
- the coefficient of linear thermal expansion of the metal forming the metal layer is greater than the coefficient of linear thermal expansion of the solid electrolyte.
- the resistance fluctuation increases and the sensor accuracy decreases.
- the sensor function may be impaired due to breakage of the lead wire.
- the M phase exists within a range that satisfies the formula (1).
- the diffraction intensity ratio I M /I CT that indicates the existence ratio of the M phase changes greatly in the temperature range from 500° C. to 850° C., as indicated by L2 in FIG.
- the M phase when the temperature is changed from 500° C. to a high temperature of 850° C., the M phase can undergo phase transition to the T phase within the range that satisfies Equation 2. Therefore, in the solid electrolyte 1 of the present embodiment, as shown in FIG.
- a metal layer 91 (in the example of the gas sensor, Pt plating or the like forming electrodes and lead wires) is bonded to the surface of the solid electrolyte 1.
- part of the M phase contained in the solid electrolyte 1 undergoes a phase transition to the T phase, causing a volume reduction, and a gap is formed around it. 93 occurs. A portion of the metal layer 91 softened at a high temperature enters the gap.
- the solid electrolyte 1 is preferably -0.48 ⁇ (I M3 ⁇ I CT2 )/(I M2 ⁇ I CT3 ) ⁇ 1 ⁇ ⁇ 0.12, more preferably ⁇ 0.45 ⁇ (I M3 ⁇ I CT2 )/(I M2 ⁇ I CT3 ) ⁇ 1 ⁇ 0.15, more preferably ⁇ 0.43 ⁇ (I M3 ⁇ I CT2 )/(I M2 ⁇ I CT3 ) ⁇ 1 ⁇ 0.17, still more preferably ⁇ 0.4 ⁇ (I M3 ⁇ I CT2 )/(I M2 ⁇ I CT3 ) ⁇ 1 ⁇ 0. 2 can be satisfied.
- the solid electrolyte 1 of this embodiment can be manufactured, for example, as follows.
- a stabilizer such as O3 and ZrO2 are mixed, granulated, molded and fired to produce a solid electrolyte.
- a phase-stable M phase 102 (which may be hereinafter referred to as a phase-stable M phase 102) containing a stabilizer of is prepared separately.
- the amount of the stabilizer contained in the easy transition M phase 102 is y mol %, 0 ⁇ y ⁇ x is satisfied.
- part of the partially stabilized zirconia raw material is first converted to the easy phase transition M phase 102 .
- the mixed raw material containing the stabilizer 103 and ZrO 2 104 is subjected to an easy phase transition M Phase 102 is added and granulated to give granulated powder 105 .
- the granulated powder 105 is molded into a compact.
- the compact is fired to obtain a fired body.
- the solid electrolyte 1 of this embodiment can be manufactured.
- FIG. 7 shows part of the phase diagram of zirconia in which Y 2 O 3 is dissolved.
- the horizontal axis is the Y 2 O 3 solid solution amount (mol %)
- the vertical axis is the temperature (° C.). According to the phase diagram, it can be seen that the M phase does not undergo a phase transition to the T phase in the temperature range from 500° C. to 850° C. when Y 2 O 3 is not dissolved.
- the easy phase transition M phase is preferably composed of ZrO 2 in which 1 mol % or more and 2 mol % or less of Y 2 O 3 is solid-dissolved.
- the case where Y 2 O 3 is selected as the stabilizer is shown, but other stabilizers can also form the easy phase transition M phase based on the same concept based on each phase diagram. is.
- FIG. 8 shows a specific example of the method for producing the solid electrolyte 1 of this embodiment.
- the phase-stable M phase 102 made of ZrO 2 in which 1 mol % of Y 2 O 3 is solid-dissolved, for example, 7 mol % of Y 2 O 3 is solid-dissolved in a solid state made of partially stabilized zirconia as a whole.
- the electrolyte 1 is produced will be described, the present invention is not limited to this.
- Y 2 O 3 103y powder and ZrO 2 104 powder are prepared as starting materials.
- a powder of the easy phase transition M phase 102 is produced through a first pulverization step, a first firing step, and a second pulverization step.
- powder of Y 2 O 3 103y as a stabilizer is added to the powder of ZrO 2 104 so as to be 1 mol %, and pulverized and mixed in a dry process to obtain an easy phase transition M
- a raw material for the phase is prepared.
- the average particle diameter of the raw material for the easy phase transition M phase can be 0.1 ⁇ m or more and 1 ⁇ m or less.
- the average particle size of the raw material for the easy phase transition M phase is 0.1 ⁇ m or more, the solid electrolyte 1 that easily changes to the M phase at 27° C. can be obtained.
- the average particle diameter of the raw material for the phase-easy transition M phase is 1 ⁇ m or less, the solid electrolyte 1 in which the particles of the phase-easy transition M phase 102 are difficult to localize can be obtained.
- the average particle size of the material for the easy phase transition M phase is the particle size (diameter) d50 when the volume-based cumulative frequency distribution measured by the laser diffraction/scattering method shows 50%.
- the raw material for the easy phase transition M phase prepared in the first pulverizing step is fired to dissolve Y 2 O 3 103y in the M phase.
- the sintering temperature can be lower than or equal to the sintering temperature of the second sintering step described below and 1200° C. or higher and 1400° C. or lower.
- the agglomeration of the raw material obtained in the first firing process is loosened.
- the powder of the easy phase transition M phase 102 can be produced.
- a solid electrolyte 1 is produced through a third pulverization process, a mixing process, a granulation process, a molding process, and a second firing process.
- the powder of Y 2 O 3 103y as a stabilizer is added to the powder of ZrO 2 104 , and the mixture is dry-pulverized and mixed to produce mixed raw material powder 106 .
- the final Y 2 O 3 solid solution amount (here, 7 mol%
- the amount of Y 2 O 3 103y powder added can be adjusted so as to obtain partially stabilized zirconia in which the Y 2 O 3 103y of ) is solid-dissolved.
- the mixing step the mixed raw material powder 106 obtained in the third pulverization step, the powder of the easy phase transition M phase 102 obtained in the second pulverization step, and water are mixed to prepare a slurry.
- a granular granulated powder 105 having fluidity is produced from the slurry obtained in the mixing step.
- the granulated powder 105 contains particles of ZrO 2 104 , particles of Y 2 O 3 103y and particles of phase-easy M phase 102 .
- Granulated powder 105 can be, for example, a spray-dried powder suitable for compaction.
- the granulated powder 105 is molded, for example, into an arbitrary shape to produce a compact.
- the compact can be shaped, for example, into the shape of the solid electrolyte 1 used in the gas sensor element. Further, the molded body can be appropriately subjected to grinding or the like.
- the molded body obtained in the molding process is fired to produce a fired body.
- the firing temperature can be 1300°C to 1500°C.
- the solid electrolyte 1 of the present embodiment can be manufactured.
- the value of I M1 /I CT1 in the formula 1 in the solid electrolyte 1 is adjusted by adjusting the final Y 2 O 3 solid solution amount, the firing temperature in the second firing step, and the like. can do. Specifically, the value of I M1 /I CT1 can be decreased by increasing the final Y 2 O 3 solid solution amount. Also, the value of I M1 /I CT1 can be reduced by increasing the firing temperature in the second firing step. In addition, by adjusting the addition amount of the easy phase transition M phase powder among the entire solid electrolyte raw materials in the mixing step, (I M3 ⁇ I CT2 )/(I M2 ⁇ I CT3 ) ⁇ A value of 1 can be adjusted. Specifically, the value of (I M3 ⁇ I CT2 )/(I M2 ⁇ I CT3 ) ⁇ 1 can be reduced by increasing the amount of powder of phase-easy transition M phase added.
- the solid electrolyte 1 obtained by the manufacturing method described above contains at least the C phase 11 and the M phase 10 at 27° C., as illustrated in FIGS. Furthermore, the M phase 10 specifically includes a normal M phase 101 that contains almost no yttria and does not transition to the T phase, and a normal M phase 101 that contains yttria and changes from the M phase to the T phase at a temperature change from 500 ° C. to 850 ° C. and a phase-easily transitional M phase 102 that can be transitioned.
- the C phase 11 is a phase that mainly contributes to the oxygen ion conductivity of the solid electrolyte 1 .
- the easy phase transition M phase 102 is a phase that contributes to the development of the effect of suppressing the peeling of the metal layer by the presumed mechanism described above.
- the C phase 11 and the normal M phase 101 are mainly formed from the mixed raw material powder 106 produced in the third pulverization step described above.
- the phase-easy transition M phase 102 is mainly formed from the powder of the phase-easy transition M phase 102 produced in the second pulverization step described above.
- 1 and 6 more specifically illustrate the solid electrolyte 1 including C phase 11 particles and M phase 10 particles.
- the particles of the M phase 10 usually contain particles of the M phase 101 and particles of the phase-stable M phase 102 . As illustrated in FIGS. 1 and 6, the solid electrolyte 1 may contain pores 13 (voids).
- one or more additives such as silica and alumina can be added in the steps up to the mixing step (including the mixing step).
- a solid electrolyte 1 composed of partially stabilized zirconia containing one or more additives such as silica and alumina is obtained.
- the solid electrolyte 1 may contain a small amount of the T phase in addition to the C and M phases described above. This T phase was pushed by the surrounding particles during the cooling process in the second firing step and could not expand and return to the M phase.
- silica may exist at grain boundaries in the solid electrolyte 1 . In this case, by performing an etching treatment on the surface of the solid electrolyte 1, the silica at the grain boundaries is dissolved and the grain boundaries are cut (the grain boundaries are widened), so that the T phase can be returned to the M phase.
- this M phase is an M phase in which yttria is dissolved, and can exist as a T phase even at low temperatures, and can exhibit the action and effect of the presumed mechanism described above. Therefore, when the solid electrolyte 1 contains silica, the effect of suppressing peeling of the metal layer can be enhanced by providing the grain boundaries from which the silica is removed on the surface of the solid electrolyte 1 .
- the content of silica is, for example, 0.01 parts by mass or more and 1 part by mass or less, preferably 0.01 parts by mass or more and 0.6 parts by mass or less with respect to 100 parts by mass of the solid electrolyte 1. .
- the grain size of the solid electrolyte 1 can be made finer to increase the grain boundary area for exhibiting the above-described anchor effect. Therefore, in this case, the effect of suppressing peeling of the metal layer can be enhanced.
- the content of alumina can be, for example, 0.1 parts by mass or more and 10 parts by mass or less, preferably 0.5 parts by mass or more and 10 parts by mass or less with respect to 100 parts by mass of the solid electrolyte 1 .
- the average particle size of the M phase can be 0.1 ⁇ m or more from the viewpoint of easiness to form the M phase at 27°C.
- the average particle size of the M phase can be set to 1 ⁇ m or less from the viewpoint of suppressing localization of the M phase particles and facilitating the obtaining of the above-described effects.
- a value measured as follows is used.
- a measurement sample is cut out from the solid electrolyte 1 .
- the size of the measurement sample can be, for example, 5 mm wide, 20 mm long, and 2 mm thick.
- a thermal etching process is performed. The thermal etching process is performed by heating the measurement sample at a temperature of 1200° C. for 1 hour.
- composition analysis is performed by SEM/EDX analysis, and elemental mapping is performed on five regions for specific elements derived from the stabilizer. For example, if the stabilizer is yttria, elemental mapping can be done for the Y element.
- the M phase is specified from the specific element concentration at the center of the particle, and the particle size of the M phase is measured.
- the specific element concentration specified as the M phase can be determined from the phase diagram of zirconia in which the specific element is dissolved.
- the maximum amount of Y 2 O 3 in the M phase is 4.7 mol% or less at the yttrium concentration at the boundaries of the M phase, M phase-T phase, and M phase-C phase.
- a certain particle (having a Y 2 O 3 concentration of 2.35 mol % or less in terms of Y 2 O 3 ) can be the M phase.
- the circled point is the point where the Y 2 O 3 concentration (solid solution amount) is 2.35 mol %.
- the center of the particle is the centroid of the rectangle covered by the maximum width of the particle P in the horizontal and vertical directions, as shown in FIG.
- Observation conditions of the SEM can be acceleration voltage: 5 kV, WD setting: 8.0 mm, current: 10 mA, and magnification: 20000 times.
- SU8220 manufactured by Hitachi High-Technologies Corporation can be used.
- the measurement conditions by EDX can be acceleration voltage: 5 kV, WD setting: 14 mm, current: 5 to 15 mA, and magnification: 50000 times.
- the current is adjusted so that the detected amount is 40-55 kcps.
- EDX for example, Xflash6160 manufactured by Bruker can be used.
- the average grain size of the M phase is the arithmetic mean of the horizontal length T1 and the vertical length T2 in a rectangle covered by the maximum width of the grain P in the horizontal and vertical directions, as shown in FIG. is the arithmetic mean of the M-phase particle size measurements expressed in values.
- Embodiment 2 A gas sensor according to Embodiment 2 will be described with reference to FIGS. 11 and 12.
- FIG. It should be noted that, of the reference numerals used in the second and subsequent embodiments, the same reference numerals as those used in the previously described embodiments represent the same components and the like as those in the previously described embodiments, unless otherwise specified.
- the gas sensor of this embodiment has a solid electrolyte 1A to which the solid electrolyte 1 of Embodiment 1 is applied.
- the gas sensor 2 includes a gas sensor element 3 having a solid electrolyte 1A, a housing 4 that holds the gas sensor element 3 by inserting it inside, a cover 5 that protects the tip of the gas sensor element 3, and a gas sensor element 3.
- a gas sensor element 3 can be configured to have a heater 6 that heats the
- the gas sensor 2 can be configured, for example, as a cup-shaped gas sensor 2 as illustrated in FIG.
- the gas sensor element 3 includes a solid electrolyte 1A formed in a bottomed tubular shape (a so-called cup shape) with one end closed and the other open.
- a reference electrode 31 provided on the inner surface of the cylinder of the solid electrolyte 1A for contacting the reference gas such as the atmosphere, and a measurement electrode 32 provided on the outer surface of the cylinder of the solid electrolyte 1A for contacting the exhaust gas to be measured. can be done.
- a lead wire (not shown) formed on the inner surface of the cylinder of the solid electrolyte 1A is connected to the reference electrode 31 .
- a lead wire (not shown) provided on the outer surface of the solid electrolyte 1A is connected to the measurement electrode 32 .
- the reference electrode 31, the measurement electrode 32, and each lead wire can be made of, for example, Pt, Pt alloy, or the like.
- the surface of the measurement electrode 32 may be covered with one or more protective layers 33 .
- the surface of the measuring electrode 32 is covered with a first protective layer 331, the surface of the first protective layer 331 is covered with a second protective layer 332, and the surface of the second protective layer 332 is covered with a third protective layer.
- the configuration covered at 333 is illustrated.
- the protective layer 33 protects the measurement electrode 32 from sulfur (S), phosphorus (P), glass-like poisoning substances, etc. contained in the exhaust gas, and adjusts the amount of gas reaching the measurement electrode 32. It can be configured to be porous.
- the material, porosity, thickness, etc. of each protective layer 33 can be appropriately changed according to the purpose. For other configurations of the gas sensor 2, known techniques can be applied as appropriate.
- the gas sensor 2 of the present embodiment has a solid electrolyte 1A to which the solid electrolyte 1 of the first embodiment is applied. Therefore, in the gas sensor 2 of the present embodiment, the number of repetitions of the cooling/heating cycle between the low temperature when the engine is stopped/started (including the restart of a hybrid vehicle or a vehicle equipped with an idling stop function) and the high sensor operating temperature is increased. However, it is possible to suppress peeling of electrodes (reference electrode 31 and measurement electrode 32) made of a metal layer and lead wires. Therefore, according to the gas sensor 2 of the present embodiment, a cup-shaped gas sensor 2 having high sensor accuracy with suppressed resistance variation can be obtained.
- FIG. 3 A gas sensor according to Embodiment 3 will be described with reference to FIGS. 13 and 14.
- FIG. 1B As illustrated in FIGS. 13 and 14, the gas sensor 2 of the present embodiment has a solid electrolyte 1B to which the solid electrolyte 1 of the first embodiment is applied.
- the gas sensor 2 is configured as a laminated gas sensor 2 .
- the gas sensor element 3 includes a layered solid electrolyte 1B, a reference electrode 31 provided on one side of the solid electrolyte 1B for contact with a reference gas such as the air, and a solid electrolyte.
- a measurement electrode 32 is provided on the other side of the electrolyte 1B and is brought into contact with the exhaust gas to be measured.
- a lead wire (not shown) formed on one surface of the solid electrolyte 1B is connected to the reference electrode 31 .
- a lead wire (not shown) provided on the other surface of the solid electrolyte 1B is connected to the measurement electrode 32 .
- an exhaust gas introduction section (not shown) arranged for introducing exhaust gas is formed.
- a reference gas space 310 through which a reference gas flows is provided on one side of the solid electrolyte 1B, and a reference electrode 31 is arranged on the side of the reference gas space 310 .
- An exhaust gas space 320 through which exhaust gas flows is provided on the other surface of the solid electrolyte 1B, and the measurement electrode 32 is arranged on the exhaust gas space 320 side.
- the other surface side of the solid electrolyte 1B is held by an insulating holding layer 34 .
- a heater 6 for heating the gas sensor element 3 is built in the holding layer 34 .
- a protective layer 33 is formed on the outer peripheral surface of the gas sensor element 3 to protect the gas sensor element 3 from poisoning, water exposure, and the like. For other configurations of the gas sensor 2, known techniques can be applied as appropriate.
- the gas sensor 2 of the present embodiment has a solid electrolyte 1B to which the solid electrolyte 1 of the first embodiment is applied. Therefore, in the gas sensor 2 of the present embodiment, the number of repetitions of the cooling/heating cycle between the low temperature when the engine is stopped/started (including the restart of a hybrid vehicle or a vehicle equipped with an idling stop function) and the high sensor operating temperature is increased. However, it is possible to suppress peeling of electrodes (reference electrode 31 and measurement electrode 32) made of a metal layer and lead wires. Therefore, according to the gas sensor 2 of the present embodiment, the resistance variation is suppressed, and the laminated gas sensor 2 having high sensor accuracy is obtained.
- Example 1 Solid electrolytes of Samples 1-1 to 1-7 were produced according to the manufacturing method described above.
- the type of the solid electrolyte was yttria partially stabilized zirconia having a yttria content in the range of 3 mol % or more and 11 mol % or less.
- the X-ray diffraction intensity was measured, and the value of I M1 /I CT1 in Equation 1 was determined. Also, the coefficient of thermal expansion was measured for each solid electrolyte.
- Thermal expansion coefficient of solid electrolyte Each solid electrolyte was cut into pieces having a width of about 5 mm and a length of about 45 mm. The thermal expansion behavior between 27° C. and 1050° C. was measured for this sample by thermomechanical analysis (TMA). At this time, an alumina sintered body was used as a standard sample. The measurement was performed five times for each sample. The slope of the linear section from 400° C. to 600° C. in the thermal expansion behavior was defined as the coefficient of thermal expansion, and the arithmetic mean value of the measured values of the coefficient of thermal expansion was obtained as the coefficient of thermal expansion of each sample. From the viewpoint of consistency of the coefficient of thermal expansion with different materials, the case where the coefficient of thermal expansion was 7.0 ppm/°C or more and 9.5 ppm/°C or less was regarded as acceptable.
- Table 1 shows the following.
- the solid electrolytes of Samples 1-2 to 1-6 satisfy Formula 1. Therefore, the solid electrolytes of Samples 1-2 to 1-6 can ensure consistency in thermal expansion coefficient with other members such as metal layers and alumina.
- I M1 /I CT1 shown in Equation 1 is less than 0.05, so it is difficult to ensure consistency in thermal expansion coefficient with other members. This is because the amount of M phase in the entire solid electrolyte became too small, and the thermal expansion coefficient of the solid electrolyte in the temperature range of 400°C to 600°C increased.
- Example 2 Solid electrolytes of Samples 2-1 to 2-10 were produced according to the manufacturing method described above.
- the type of the solid electrolyte was yttria partially stabilized zirconia having a yttria content in the range of 3 mol % or more and 11 mol % or less.
- the X-ray diffraction intensity was measured in the same manner as in Experimental Example 1, and I M1 /I CT1 (X-ray diffraction intensity ratio) in Equation 1 and (I M3 ⁇ I CT2 )/( in Equation 2) I M2 ⁇ I CT3 )-1 (M ⁇ T phase change ratio) was obtained.
- the resistance change rate and bending strength of each solid electrolyte were measured by the following test methods.
- ⁇ Resistance change rate of solid electrolyte> A metal layer was formed on the surface of each solid electrolyte, and the resistance change rate was measured. Specifically, a cup-shaped solid electrolyte with Pt-plated electrodes formed thereon assuming a gas sensor element was used for the measurement of the electrical resistance of the solid electrolyte.
- the granulated powder was molded into a cup shape by a rubber press method in the molding step in the method for producing a solid electrolyte described above, and ground to obtain a cup-shaped compact. This cup-shaped compact was fired in the second firing step to form a cup-shaped solid electrolyte, and then a Pt-plated electrode (average film thickness: 1 ⁇ m) was formed on the surface.
- the electrical resistance of the solid electrolyte body was measured at the initial stage and after thermal cycling using the following measuring device and software.
- Solartron Analytical's impedance/gain-phase analyzer "1260” and Solartron Analytical's potentiostat/galvanostat “SI1287” are used, and as the measurement software, Solartron Analytical's "Z Plot” was used.
- the measurement conditions are Initial Frequency (Hz): 0.1, Final Frequency (Hz): 10 6 , DC Potential (Volts): 0, AC Amplitude (mV): 20, VS Reference, Logarithmic, steps/Decade: 10. did. Note that VS Reference applies a voltage based on 0 V, Logarthimic sets output in logarithm, steps/Decade: 10 sets the measurement point to 10 each time the logarithm frequency digit increases. means to separate.
- a cooling/heating cycle from 27°C to 1100°C was repeated 1000 times at a temperature raising/lowering rate of ⁇ 300°C/h. If the rate of change in electrical resistance in the initial period of durability is 30% or less, the peeling of the electrodes can be suppressed even when exposed to severe thermal cycles, and the output function as a gas sensor element can be maintained. and On the other hand, when the rate of change in electrical resistance with respect to the initial endurance period exceeded 30%, the electrode peeled off due to severe cooling and heating cycles, and the peeling of the electrode could not be suppressed.
- Each solid electrolyte was cut into pieces having a width of about 5 mm and a length of about 45 mm.
- a cooling/heating cycle from 27° C. to 1100° C. was repeated 1000 times at a temperature raising/lowering rate of ⁇ 300° C./h.
- a test piece for strength evaluation was prepared from this sample and subjected to a four-point bending test to measure the four-point bending strength of each solid electrolyte.
- Table 2 shows the following.
- the solid electrolytes of samples 2-1 to 2-9 are composed of partially stabilized zirconia and satisfy the relationships of formulas (1) and (2). Therefore, even when the solid electrolytes of Samples 2-1 to 2-10 with a metal layer formed on the surface are exposed to a thermal cycle more severe than before, the volume change accompanying the phase transition causes the solid electrolyte to remain solid during use. It can be seen that the bonding strength at the interface between the electrolyte and the metal layer is maintained, and peeling of the metal layer can be suppressed.
- Embodiments 2 and 3 an example in which the solid electrolyte of Embodiment 1 is applied to a gas sensor is shown, but the solid electrolyte of Embodiment 1 can also be applied to other solid oxide fuel cells (SOFC), etc. It is also possible to apply
- SOFC solid oxide fuel cells
Landscapes
- Chemical & Material Sciences (AREA)
- Engineering & Computer Science (AREA)
- Health & Medical Sciences (AREA)
- Life Sciences & Earth Sciences (AREA)
- Ceramic Engineering (AREA)
- General Physics & Mathematics (AREA)
- Pathology (AREA)
- Analytical Chemistry (AREA)
- Biochemistry (AREA)
- General Health & Medical Sciences (AREA)
- Electrochemistry (AREA)
- Immunology (AREA)
- Physics & Mathematics (AREA)
- Composite Materials (AREA)
- Chemical Kinetics & Catalysis (AREA)
- Manufacturing & Machinery (AREA)
- Molecular Biology (AREA)
- Materials Engineering (AREA)
- Structural Engineering (AREA)
- Organic Chemistry (AREA)
- Measuring Oxygen Concentration In Cells (AREA)
Priority Applications (1)
| Application Number | Priority Date | Filing Date | Title |
|---|---|---|---|
| JP2023525657A JP7593493B2 (ja) | 2021-06-01 | 2022-04-21 | 固体電解質およびガスセンサ |
Applications Claiming Priority (2)
| Application Number | Priority Date | Filing Date | Title |
|---|---|---|---|
| JP2021092313 | 2021-06-01 | ||
| JP2021-092313 | 2021-06-01 |
Publications (1)
| Publication Number | Publication Date |
|---|---|
| WO2022254989A1 true WO2022254989A1 (ja) | 2022-12-08 |
Family
ID=84323116
Family Applications (1)
| Application Number | Title | Priority Date | Filing Date |
|---|---|---|---|
| PCT/JP2022/018401 Ceased WO2022254989A1 (ja) | 2021-06-01 | 2022-04-21 | 固体電解質およびガスセンサ |
Country Status (2)
| Country | Link |
|---|---|
| JP (1) | JP7593493B2 (https=) |
| WO (1) | WO2022254989A1 (https=) |
Cited By (3)
| Publication number | Priority date | Publication date | Assignee | Title |
|---|---|---|---|---|
| US11643365B2 (en) | 2017-11-03 | 2023-05-09 | Denso Corporation | Solid electrolyte, producing method thereof, and gas sensor |
| US20240328900A1 (en) * | 2023-03-31 | 2024-10-03 | Ngk Insulators, Ltd. | Sensor element and gas sensor |
| WO2025230009A1 (ja) * | 2024-05-01 | 2025-11-06 | クラレノリタケデンタル株式会社 | ジルコニア組成物及びジルコニア仮焼体並びにその製造方法 |
Citations (5)
| Publication number | Priority date | Publication date | Assignee | Title |
|---|---|---|---|---|
| JPS56111455A (en) * | 1980-02-07 | 1981-09-03 | Nippon Denso Co Ltd | Solid electrolyte body for oxygen sensor |
| JPS63210063A (ja) * | 1987-02-25 | 1988-08-31 | 株式会社日立製作所 | ジルコニア酸素センサ素子 |
| JPH0926409A (ja) * | 1995-07-13 | 1997-01-28 | Nippondenso Co Ltd | 積層型酸素センサ素子 |
| WO2019087735A1 (ja) * | 2017-11-03 | 2019-05-09 | 株式会社デンソー | 固体電解質、その製造方法、ガスセンサ |
| WO2019087736A1 (ja) * | 2017-11-03 | 2019-05-09 | 株式会社デンソー | 固体電解質、その製造方法、ガスセンサ |
-
2022
- 2022-04-21 WO PCT/JP2022/018401 patent/WO2022254989A1/ja not_active Ceased
- 2022-04-21 JP JP2023525657A patent/JP7593493B2/ja active Active
Patent Citations (5)
| Publication number | Priority date | Publication date | Assignee | Title |
|---|---|---|---|---|
| JPS56111455A (en) * | 1980-02-07 | 1981-09-03 | Nippon Denso Co Ltd | Solid electrolyte body for oxygen sensor |
| JPS63210063A (ja) * | 1987-02-25 | 1988-08-31 | 株式会社日立製作所 | ジルコニア酸素センサ素子 |
| JPH0926409A (ja) * | 1995-07-13 | 1997-01-28 | Nippondenso Co Ltd | 積層型酸素センサ素子 |
| WO2019087735A1 (ja) * | 2017-11-03 | 2019-05-09 | 株式会社デンソー | 固体電解質、その製造方法、ガスセンサ |
| WO2019087736A1 (ja) * | 2017-11-03 | 2019-05-09 | 株式会社デンソー | 固体電解質、その製造方法、ガスセンサ |
Cited By (3)
| Publication number | Priority date | Publication date | Assignee | Title |
|---|---|---|---|---|
| US11643365B2 (en) | 2017-11-03 | 2023-05-09 | Denso Corporation | Solid electrolyte, producing method thereof, and gas sensor |
| US20240328900A1 (en) * | 2023-03-31 | 2024-10-03 | Ngk Insulators, Ltd. | Sensor element and gas sensor |
| WO2025230009A1 (ja) * | 2024-05-01 | 2025-11-06 | クラレノリタケデンタル株式会社 | ジルコニア組成物及びジルコニア仮焼体並びにその製造方法 |
Also Published As
| Publication number | Publication date |
|---|---|
| JP7593493B2 (ja) | 2024-12-03 |
| JPWO2022254989A1 (https=) | 2022-12-08 |
Similar Documents
| Publication | Publication Date | Title |
|---|---|---|
| WO2022254989A1 (ja) | 固体電解質およびガスセンサ | |
| KR20090087839A (ko) | 산화이트륨 재료, 반도체 제조 장치용 부재 및 산화이트륨 재료의 제조 방법 | |
| JP6577408B2 (ja) | ガスセンサ素子およびガスセンサ | |
| US11592418B2 (en) | Solid electrolyte, manufacturing method thereof, and gas sensor | |
| JP2019091703A (ja) | 固体電解質及び固体電解質の製造方法 | |
| JPWO2018235432A1 (ja) | サーミスタ焼結体及びサーミスタ素子 | |
| US12111282B2 (en) | Solid electrolyte and gas sensor with thermal shock resistance | |
| CN111315707B (zh) | 固体电解质、其制造方法、气体传感器 | |
| US11656196B2 (en) | Solid electrolyte, manufacturing method thereof, and gas sensor | |
| JP4062768B2 (ja) | 酸素センサ素子の製造方法 | |
| KR101806441B1 (ko) | 지르코니아-비스무스 산화물 소결체 및 이의 제조방법 | |
| JP6118679B2 (ja) | ガスセンサ素子およびガスセンサ | |
| KR101925215B1 (ko) | 다결정체 지르코니아 화합물 및 이의 제조 방법 | |
| JPH0510918A (ja) | 酸素濃度検出素子およびその製造方法 | |
| JPH10213563A (ja) | 固体電解質素子および酸素濃度測定装置 | |
| WO2019087737A1 (ja) | ガスセンサ用固体電解質、ガスセンサ | |
| JP2003321274A (ja) | 固体電解質素子 | |
| KR101857618B1 (ko) | 입방정 구조의 완전 안정화 지르코니아 제조방법 | |
| WO2024180832A1 (ja) | 誘電体セラミックスおよびそれを用いたセラミックコンデンサ | |
| Kumar et al. | Ionic conductivity of scandia stabilized zirconia and alumina composites | |
| Ball et al. | Characterisation of Ce0. 8Gd0. 2O1. 9/3Y-TZP composite electrolytes—effects of weight% 3Y-TZP particles | |
| Ugorek | A Comparison of Microstructure and Electrical Properties of 8 Mol% Yttria Stabilized Zirconia Processed Under Conventional, Microwave, and Fast-Fire Sintering Techniques | |
| Pétigny et al. | Material Selection Impact on Cell Performances | |
| Wolfenstine et al. | Hot-Pressed versus Sintered LiTi2 (PO4) 3 | |
| JPS61250549A (ja) | 酸素センサ用固体電解質の製造方法 |
Legal Events
| Date | Code | Title | Description |
|---|---|---|---|
| 121 | Ep: the epo has been informed by wipo that ep was designated in this application |
Ref document number: 22815745 Country of ref document: EP Kind code of ref document: A1 |
|
| ENP | Entry into the national phase |
Ref document number: 2023525657 Country of ref document: JP Kind code of ref document: A |
|
| NENP | Non-entry into the national phase |
Ref country code: DE |
|
| 122 | Ep: pct application non-entry in european phase |
Ref document number: 22815745 Country of ref document: EP Kind code of ref document: A1 |