WO2022239188A1 - 蓄電池診断装置および蓄電池システム - Google Patents
蓄電池診断装置および蓄電池システム Download PDFInfo
- Publication number
- WO2022239188A1 WO2022239188A1 PCT/JP2021/018216 JP2021018216W WO2022239188A1 WO 2022239188 A1 WO2022239188 A1 WO 2022239188A1 JP 2021018216 W JP2021018216 W JP 2021018216W WO 2022239188 A1 WO2022239188 A1 WO 2022239188A1
- Authority
- WO
- WIPO (PCT)
- Prior art keywords
- storage battery
- electrode
- curve
- point
- point group
- Prior art date
- Legal status (The legal status is an assumption and is not a legal conclusion. Google has not performed a legal analysis and makes no representation as to the accuracy of the status listed.)
- Ceased
Links
Images









Classifications
-
- G—PHYSICS
- G01—MEASURING; TESTING
- G01R—MEASURING ELECTRIC VARIABLES; MEASURING MAGNETIC VARIABLES
- G01R31/00—Arrangements for testing electric properties; Arrangements for locating electric faults; Arrangements for electrical testing characterised by what is being tested not provided for elsewhere
- G01R31/36—Arrangements for testing, measuring or monitoring the electrical condition of accumulators or electric batteries, e.g. capacity or state of charge [SoC]
- G01R31/367—Software therefor, e.g. for battery testing using modelling or look-up tables
-
- G—PHYSICS
- G01—MEASURING; TESTING
- G01R—MEASURING ELECTRIC VARIABLES; MEASURING MAGNETIC VARIABLES
- G01R31/00—Arrangements for testing electric properties; Arrangements for locating electric faults; Arrangements for electrical testing characterised by what is being tested not provided for elsewhere
- G01R31/36—Arrangements for testing, measuring or monitoring the electrical condition of accumulators or electric batteries, e.g. capacity or state of charge [SoC]
- G01R31/382—Arrangements for monitoring battery or accumulator variables, e.g. SoC
- G01R31/3842—Arrangements for monitoring battery or accumulator variables, e.g. SoC combining voltage and current measurements
-
- G—PHYSICS
- G01—MEASURING; TESTING
- G01R—MEASURING ELECTRIC VARIABLES; MEASURING MAGNETIC VARIABLES
- G01R31/00—Arrangements for testing electric properties; Arrangements for locating electric faults; Arrangements for electrical testing characterised by what is being tested not provided for elsewhere
- G01R31/36—Arrangements for testing, measuring or monitoring the electrical condition of accumulators or electric batteries, e.g. capacity or state of charge [SoC]
- G01R31/392—Determining battery ageing or deterioration, e.g. state of health
-
- G—PHYSICS
- G01—MEASURING; TESTING
- G01R—MEASURING ELECTRIC VARIABLES; MEASURING MAGNETIC VARIABLES
- G01R31/00—Arrangements for testing electric properties; Arrangements for locating electric faults; Arrangements for electrical testing characterised by what is being tested not provided for elsewhere
- G01R31/36—Arrangements for testing, measuring or monitoring the electrical condition of accumulators or electric batteries, e.g. capacity or state of charge [SoC]
- G01R31/389—Measuring internal impedance, internal conductance or related variables
-
- H—ELECTRICITY
- H01—ELECTRIC ELEMENTS
- H01M—PROCESSES OR MEANS, e.g. BATTERIES, FOR THE DIRECT CONVERSION OF CHEMICAL ENERGY INTO ELECTRICAL ENERGY
- H01M10/00—Secondary cells; Manufacture thereof
- H01M10/42—Methods or arrangements for servicing or maintenance of secondary cells or secondary half-cells
- H01M10/48—Accumulators combined with arrangements for measuring, testing or indicating the condition of cells, e.g. the level or density of the electrolyte
-
- Y—GENERAL TAGGING OF NEW TECHNOLOGICAL DEVELOPMENTS; GENERAL TAGGING OF CROSS-SECTIONAL TECHNOLOGIES SPANNING OVER SEVERAL SECTIONS OF THE IPC; TECHNICAL SUBJECTS COVERED BY FORMER USPC CROSS-REFERENCE ART COLLECTIONS [XRACs] AND DIGESTS
- Y02—TECHNOLOGIES OR APPLICATIONS FOR MITIGATION OR ADAPTATION AGAINST CLIMATE CHANGE
- Y02E—REDUCTION OF GREENHOUSE GAS [GHG] EMISSIONS, RELATED TO ENERGY GENERATION, TRANSMISSION OR DISTRIBUTION
- Y02E60/00—Enabling technologies; Technologies with a potential or indirect contribution to GHG emissions mitigation
- Y02E60/10—Energy storage using batteries
Definitions
- This application relates to a storage battery diagnostic device and a storage battery system.
- Electric vehicles such as EVs (Electric Vehicles), HEVs (Hybrid Electric Vehicles), and PHVs (Plug-in Hybrid Vehicles) are being put into practical use in order to reduce environmental impact. Furthermore, the development of electric aircraft is also progressing. Stationary power storage systems for utilizing renewable energy are also widespread.
- Storage batteries such as lithium-ion batteries are used in these devices. It is known that storage batteries deteriorate as they are used, and their performance declines. For this reason, it is necessary to perform deterioration diagnosis of the storage battery in order to grasp the performance of the storage battery, or to grasp the replacement timing and predict the life of the storage battery.
- a differential curve analysis method uses a differential voltage obtained by differentiating voltage with respect to capacity, or a differential capacity obtained by differentiating capacity with respect to voltage.
- This method of diagnosing deterioration utilizes the property that the voltage of a storage battery is represented by the combination of the potentials of the positive electrode and the negative electrode. It attempts to diagnose various deterioration modes based on the height, position, positional relationship, etc. of points, etc.). In general, the height, position, positional relationship, etc. of the characteristic points on the differential voltage curves of the positive electrode and the negative electrode change as the storage battery is used and deteriorated. Therefore, it is possible to diagnose deterioration of a storage battery by comparing characteristic points of certain reference data and acquired data (see, for example, Patent Document 1).
- diagnosis is performed such as correcting the reference value based on the estimated value regarding the difference in the amount of charge between two feature points.
- the reason for this is that the feature points on the voltage curve and differential voltage curve of the storage battery change in position and height as they deteriorate. It is known that, in many cases, when the electrode deteriorates, the peak shape of the differential voltage curve becomes gentle due to reasons such as the distribution of the lithium ion concentration becoming large inside the electrode. As the deterioration progresses, the feature points on the differential voltage curve may disappear.
- the position and height of the feature point may vary even if the degree of deterioration is the same.
- the current SOC of the target storage battery itself often contains an estimation error, so if the SOC is used as a reference to determine whether or not the detected feature point is a feature point, it may fail.
- the present application was made in order to solve the above-mentioned problems, and is a storage battery diagnosis that can accurately grasp the correspondence relationship between the feature points of the reference data and the acquired data, and can perform highly accurate deterioration diagnosis of the storage battery.
- the purpose is to provide an apparatus.
- the storage battery diagnosis device disclosed in the present application is Based on the current of the storage battery detected by the current detection device and the voltage of the storage battery detected by the voltage detection device, a data point sequence including a Z-order calculus curve represented by a Z-order calculus voltage or a Z-order calculus capacity by a real number Z is generated.
- a data point sequence generator to generate, a reference data providing unit that provides a reference data point sequence of a reference storage battery or electrode; a point cloud alignment unit that performs point cloud alignment between the data point sequence generated by the data point sequence generation unit and the reference data point sequence; a diagnostic unit that estimates a parameter indicating the state of deterioration of the storage battery or electrode based on the result of the point cloud registration unit; It has
- the storage battery diagnosis apparatus by performing point group alignment, it is possible to accurately establish the correspondence relationship between the generated data point sequence and the reference data, and highly accurate deterioration diagnosis of the storage battery can be performed. It is possible.
- FIG. 1 is a configuration diagram of a storage battery diagnosis device according to Embodiment 1;
- FIG. 3 is a hardware configuration diagram of a controller of the storage battery diagnosis device according to Embodiment 1.
- FIG. It is a figure explaining the classification
- FIG. 2 is a characteristic diagram showing an example of a potential curve and a differential potential curve of a positive electrode in a lithium ion battery having an NMC positive electrode and a graphite negative electrode.
- FIG. 2 is a characteristic diagram showing an example of a negative electrode potential curve and a differential potential curve in a lithium ion battery having an NMC positive electrode and a graphite negative electrode.
- FIG. 4 is a diagnosis flowchart when ICP is used in the storage battery diagnosis device according to Embodiment 1.
- FIG. FIG. 4 is a diagram showing characteristic points of a deteriorated cell voltage, a first-order differential voltage, and a second-order differential voltage; It is a figure which shows the feature point of a sigmoid curve, its 1st-order differential curve, and a 2nd-order differential curve. It is a figure which shows the characteristic point of the voltage of a new cell, a 1st-order differential voltage, and a 2nd-order differential voltage.
- 4 is a flowchart of one-dimensional ICP according to Embodiment 1; FIG.
- FIG. 10 is a diagram showing transition of RMSE of a result of point group alignment by one-dimensional ICP;
- FIG. 10 is a diagram showing a comparison of reference data and estimated parameters; It is a figure which shows the result of having estimated the positive parameter by iterative calculation of the nonlinear optimization method.
- FIG. 4 is a diagram showing estimation results of a new cell, a deteriorated cell, a positive electrode, a negative electrode, and a cell when fully charged by the storage battery diagnosis device according to Embodiment 1;
- FIG. 3 is a diagram showing characteristic points of partial charge data of a storage battery, a first derivative curve, and a second derivative curve; It is a figure explaining the result of having performed point-group registration by one-dimensional ICP.
- FIG. 4 is a diagram showing estimation results of a new cell, a deteriorated cell, a positive electrode, a negative electrode, and a cell when fully charged by the storage battery diagnosis device according to Embodiment 1
- FIG. 3 is a
- FIG. 4 is a diagram showing estimation results of a new cell, a deteriorated cell, a positive electrode, a negative electrode, and a cell during partial charging by the storage battery diagnosis device according to Embodiment 1; 4 is a flow chart showing an example of a processing procedure by a storage battery diagnosis method according to Embodiment 1; 1 is a conceptual diagram of a storage battery system using a storage battery diagnosis device according to an embodiment; FIG.
- FIG. 1 is a diagram showing a configuration example of a storage battery diagnosis system 100 including a storage battery diagnosis device 1 according to Embodiment 1. As shown in FIG.
- the storage battery diagnosis system 100 includes a storage battery diagnosis device 1, a storage battery 2, a current detection device 3, and a voltage detection device 4, as shown in FIG.
- the storage battery diagnostic device 1 is a device for diagnosing the storage battery 2 .
- the diagnosis includes diagnosis of the performance, internal state, or deterioration state of the storage battery 2, including the SOC of the storage battery 2, the degree of capacity or deterioration, the progress, the degree of decrease in the full charge capacity of the storage battery 2, and the degree of deterioration of the storage battery 2.
- This concept also includes the estimation of degradation parameters, which are indicators of
- the storage battery 2 to be diagnosed may be a lead-acid battery, a nickel-hydrogen storage battery, an all-solid-state storage battery, etc., in addition to the lithium-ion battery.
- the storage battery 2 to be diagnosed may be a storage battery module in which a plurality of cells are connected in series or a storage battery module in which a plurality of cells are connected in parallel, in addition to a single-cell storage battery.
- lithium-ion battery to be diagnosed is a lithium-ion battery that uses NMC (Nickel-Manganese-Cobalt) material for the positive electrode and graphite for the negative electrode.
- NMC Nickel-Manganese-Cobalt
- general storage batteries that have a positive electrode and a negative electrode and can be charged and discharged may also be included.
- FIG. 2 is a block diagram showing an example of the hardware configuration of the storage battery diagnosis device 1 according to Embodiment 1. As shown in FIG.
- the storage battery diagnosis device 1 includes a data point sequence generation unit 5, a feature point group extraction unit 6, a reference data provision unit 7, a point group alignment unit 8, and a diagnosis unit 9. .
- FIG. 2 shows an example of the hardware configuration of the storage battery diagnosis device 1.
- the storage battery diagnosis device 1 has a controller 20 .
- the controller 20 comprises a processor 20a and a storage device 20b.
- the functions of each unit constituting the storage battery diagnosis device 1, that is, the functions of the data point sequence generation unit 5, the feature point group extraction unit 6, the reference data provision unit 7, and the point group alignment unit 8 are software, firmware, or a combination thereof. It is realized by
- the software and firmware are written as programs and stored in the storage device 20b.
- the processor 20a reads out the program stored in the storage device 20b and executes the program, thereby realizing the function of each part of the storage battery diagnosis device 1.
- FIG. 1 A block diagram illustrating an exemplary computing environment in accordance with the present disclosure.
- the current detection device 3 detects the current of the storage battery 2 and outputs the detected current I to the data point sequence generator 5 .
- the voltage detection device 4 detects the voltage of the storage battery 2 and outputs the detected voltage V to the data point sequence generator 5 .
- the sampling period of the time-series data is ts seconds.
- the sampling period need not be fixed at ts seconds and may be variable.
- the storage battery 2 to be diagnosed is a single storage battery cell
- the single storage battery cell is a single cell lithium ion battery.
- the current detection device 3 and the voltage detection device 4 may detect the current and voltage for each unit storage battery, respectively. In that case, the following units perform the same operation as many times as the number of target storage batteries 2 .
- the unit storage battery may be a storage battery cell, or may be a storage battery module formed by a combination of series connection or parallel connection of storage battery cells.
- the update formula It can be calculated by
- the initial capacity q0 may be zero .
- the SOC estimated value can be obtained, the following calculation may be performed, for example, from the initial SOC estimated value S0 and the predetermined full charge capacity qmax .
- the relationship between the SOC and OCV (open circuit voltage) of the storage battery 2 is known, it may be calculated as follows from the initial voltage V0 and the predetermined full charge capacity qmax .
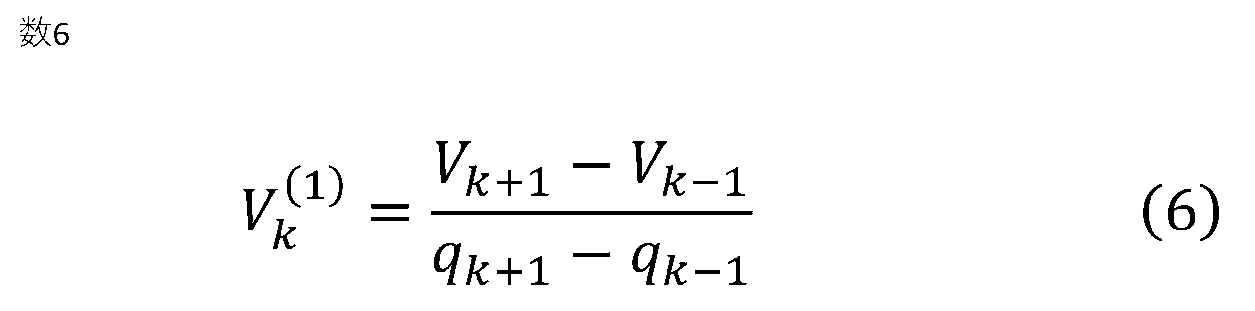
- V (j) k is defined as follows.
- the differential voltage at time k can be calculated as follows.
- noise may be removed from the acquired current and/or voltage by smoothing or the like.
- a low-pass filter, Fourier analysis, wavelet analysis, or the like can be used as a noise removal method.
- filters such as a moving average filter, a Gaussian filter, a Kolomogorov-Zurbenko filter, a Savitzky-Golay filter, and an active filter are known as low-pass filters.
- the time-series data output by the data point sequence generation unit 5 may include not only time-series data for one charge/discharge, but also time-series data for past charge/discharge.
- time-series data of the differential voltage is used for explanation, but the time-series data of the differential capacity q (1) k , which is the differential of the capacity q with respect to the voltage V, may be used.
- time series data may be calculated by second-order or higher-order differentiation instead of first-order differentiation.
- time-series data may be calculated by fractional differential including non-integer differential.
- time-series data may be calculated by different types of differentiation (for example, differential capacitance and differential voltage) and/or different orders of differentiation.
- a feature point is a point that well represents the shape feature of a data point sequence, such as an inflection point, an extremum point, and a zero crossing point.
- the feature points are not limited to this.
- a known technique can be used to detect the feature points.
- the zero cross point of the second derivative of the data point sequence is detected.
- the method described in Non-Patent Document 1 below can be used.
- detecting an inflection point typically, a concave inflection point when a data point sequence switches from convex (downward convex) to concave (upward convex), and a data point sequence from concave (upward convex) to It is detected by distinguishing it from the convex inflection point when switching to convex (convex downward).
- Non-Patent Document 1 A. Pikaz and I. Dinstein, "Using simple decomposition for smoothing and feature point detection of noisy digital curves," in IEEE Transactions on Pattern Analysis and Machine Intelligence, vol. 16, no. 8, pp. 808 -813, Aug. 1994
- the zero-crossing point of the first derivative of the data point sequence is detected to detect the extreme points of the data point sequence.
- various algorithms known as so-called peak detection techniques can be used to detect extrema directly from the original data point sequence. In detecting extreme points, maximum points and minimum points are detected separately.
- the zero-crossing point of the data point sequence is detected by, for example, finding two points where the positive and negative of the data point are switched. In the detection of zero-crossing points, positive zero-crossing points when data points switch from negative to positive and negative zero-crossing points when data points switch from positive to negative are detected separately.
- differentiating an inflection point of a curve yields an extremum point
- differentiating an extremum point yields an inflection point
- these properties can be used to detect feature points.
- feature point groups may be detected for a plurality of data point sequences of different ranks.
- the reference data providing unit 7 provides reference feature point group data to be compared with the feature point group extracted by the feature point group extraction unit 6 .
- reference storage battery data that serves as a reference when the diagnosis unit 9 diagnoses the storage battery 2 may be further provided.
- the reference feature point group is, for example, a feature point group acquired from a data point sequence of a new storage battery of the same type as the storage battery 2, with capacity on the horizontal axis and charge/discharge voltage on the vertical axis.
- the reference storage battery data is, for example, a data point sequence in which the horizontal axis is the capacity and the vertical axis is the charge / discharge voltage during the single electrode test of the same electrode as the storage battery 2, and / or the horizontal axis of the new storage battery of the same type as the storage battery 2 It is a data point sequence in which the axis is capacity and the vertical axis is charge/discharge voltage and/or charge/discharge OCV.
- the reference data (reference feature point group data and/or reference storage battery data) provided by the reference data providing unit 7 may be supplied externally, to other parts in the storage battery mounting system in which the storage battery diagnosis device 1 is mounted, and/or to a data center, and / Or it may be acquired from the cloud or the like, or may be stored inside the reference data providing unit 7 .
- the acquisition source of the reference data provided by the reference data providing unit 7 is not limited to a specific acquisition source.
- the point group registration unit 8 performs point group registration (Point set registration).
- Performing point cloud registration means that while performing correct correspondence between points in two point clouds, one point cloud is transformed by a certain transformation parameter, and an evaluation function based on the error between corresponding points This corresponds to finding a transformation parameter that minimizes .
- Transformation here means applying linear transformation, affine transformation, nonlinear transformation, rigid transformation, non-rigid transformation, etc. to one point group.
- Linear transformations include rotation, scaling, reflection, and shear transformations.
- Affine transformations include translational transformations in addition to linear transformations.
- Nonlinear transformations include affine transformations as well as arbitrary transformations that allow local shape changes and the like.
- Rigid transformation includes rotation and translation, and may also refer to mirroring and/or scaling.
- Non-rigid transformations include affine transformations and, in the context of point cloud registration, often refer to non-linear transformations.
- the error here is defined by the Euclidean distance between corresponding points, but it is not limited to this definition.
- the distance between points may be defined by p-norm, which is an arbitrary real number p greater than or equal to 0, or a self-defined distance may be used.
- the evaluation function here is defined by the sum of the squares of Euclidean distances between points, but is not limited to this definition. For example, it is possible to define a sum of p-norms by any real number p greater than or equal to 0, a penalty term added, and various evaluation functions based on defined errors.
- ICP Intelligent closest point
- Non-Patent Document 2 Various methods can be used to align the point groups.
- ICP is a method of performing point group registration by alternately repeating a search step for point-to-point correspondence and a transformation parameter estimation step for registration.
- Non-Patent Document 2 Ken Masuda, "ICP Algorithm (Pattern Recognition/Media Understanding).” Institute of Electronics, Information and Communication Engineers Technical Research Report 109.182 (2009): 151-158.
- CPD Coherent point drift
- CPD treats each point of one point cloud as the central point cloud of the Gaussian mixture model, and while maintaining the topological structure of the point cloud, maximizes the posterior probability of the Gaussian mixture model by the EM algorithm, and the other point Correspondence and registration with groups are performed.
- Non-Patent Document 3 Myronenko, Andriy, and Xubo Song. "Point set registration: Coherent point drift.” IEEE transactions on pattern analysis and machine intelligence 32.12 (2010): 2262-2275.
- the scaling conversion reflects the reduction due to deterioration of the storage battery voltage and/or the electrode potential curve
- the translation conversion reflects the estimation error of the capacity (or SOC) and/or the capacity balance between the positive electrode potential and the negative electrode potential. reflect deviations.
- the diagnosis unit 9 diagnoses the storage battery 2 based on the result of the point group alignment performed by the point cloud alignment unit 8 .
- the output of the data point sequence generator 5 may be used.
- the feature point group extraction unit 6 may be used.
- the storage battery 2 may be diagnosed based on the reference data acquired by the reference data providing unit 7 . For example, the degree of deterioration of the storage battery 2 or the positive or negative electrode of the storage battery 2 is calculated based on the scaling parameter obtained as a result of the point group alignment, and the capacity of the storage battery 2 or the positive or negative electrode of the storage battery 2 is calculated based on the translation parameter. and/or estimate the SOC.
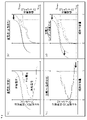
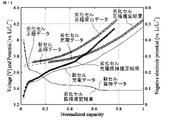
- FIG. 3 shows a classification image of storage battery deterioration modes when the vertical axis is voltage or potential and the horizontal axis is normalized capacity.
- 3(a) (upper left)
- FIG. 3(b) (upper right) shows positive electrode deterioration
- FIG. 3(c) (lower left) shows negative electrode deterioration
- FIG. 3(d) (lower right) shows It shows the variation of the cell voltage curve and the electrode potential curve when lithium ion consumption deterioration occurs.
- the dashed line represents the voltage curve or potential curve when new.
- the full charge capacity of the cell is defined by the upper limit voltage Vmax and the lower limit voltage Vmin. Since the cell voltage is represented by the difference between the positive electrode potential and the negative electrode potential, when the positive electrode potential curve or the negative electrode potential curve deteriorates and shrinks, the cell voltage curve is also affected.
- the potential curve of one electrode shifts horizontally when the potential curve of the other electrode is used as a reference, as shown in the lower right figure.
- the cell voltage curve is also affected by this, and the full charge capacity decreases.
- This shift in the electrode potential curve is mainly caused by the growth of SEI (Solid Electrolyte Interface) during negative electrode charging (that is, cell charging) and the consumption of Li ions in the process of lithium deposition.
- SEI Solid Electrolyte Interface
- the reference cell voltage model is expressed as follows.
- q is the capacity of the storage battery
- Up is the positive electrode potential
- Un is the negative electrode potential
- R is the internal resistance of the storage battery.
- a capacity (normalized capacity) that is standardized according to how data is handled may be used.
- ⁇ p is the positive electrode capacity retention rate
- ⁇ p is the positive electrode side capacity imbalance
- ⁇ n is the negative electrode capacity retention rate
- ⁇ n is the negative electrode side capacity imbalance
- ⁇ r is the parameter related to the resistance increase rate.
- the storage battery capacity q can be expressed as follows.
- q e,0 is the initial capacity of the electrode (electrode capacity when the storage battery capacity q is 0)
- q e,max is the full charge capacity of the electrode.
- FIG. 4 is a characteristic diagram showing the potential curve and the differential potential curve of the positive electrode in a lithium ion battery having a NMC (Nickel-Manganese-Cobalt) positive electrode and a graphite negative electrode.
- NMC Nickel-Manganese-Cobalt
- the horizontal axis is the normalized capacity of the positive electrode
- the left vertical axis is the potential
- the right vertical axis is the differential potential.
- Solid lines represent potential curves
- dashed lines represent differential potential curves.
- the positive electrode potential curve of many materials including NMC has a shape in which the potential changes gently.
- FIG. 5 is a characteristic diagram showing the potential curve and differential potential curve of a negative electrode in a general lithium ion battery having an NMC positive electrode and a graphite negative electrode.
- the horizontal axis is the normalized capacity of the negative electrode
- the left vertical axis is the potential
- the right vertical axis is the differential potential with the sign reversed.
- Solid lines represent potential curves
- dashed lines represent differential potential curves.
- the potential curve of graphite has a flat region and a sharply varying region, and looking at the differential potential curve, there are a plurality of steep peak shapes as indicated by arrows.
- the shape characteristics of the potential curve of the electrode differ depending on the electrode material.
- Such a stepwise (sigmoidal) potential change in the potential curve in other words, the peak shape in the differential potential is considered to be derived from the phase change phenomenon inside the electrode particles.
- the potential of the positive electrode also fluctuates, albeit slowly, and this is also attributed to the phase change phenomenon.
- FIG. 6 is an example of a diagnostic flow chart when ICP is used in the storage battery diagnostic device 1 .
- data points related to new cells are marked with an asterisk (*).
- time-series data of capacity and voltage ⁇ (q 0 , V 0 ), . . . , (q m , V m ) ⁇ (step S1).
- time-series data of capacity and voltage are input, data smoothing is performed (step S2), and time-series data of first-order differentiation and second-order differentiation are created (step S3).
- a feature point z d ⁇ S d is extracted (step S4).
- Sd represents an ordered set of feature point types d
- zd is a vertical vector of feature points belonging to Sd .
- each element of zd and Sd is a value corresponding to the horizontal axis position of each feature point of type d .
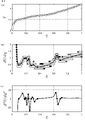
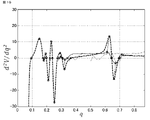
- Fig. 7 shows a diagram in which the voltage of the degraded cell (Fig. 7(a)), the first derivative voltage (Fig. 7(b)), and the second derivative voltage (Fig. 7(c)) are plotted.
- q on the horizontal axis is the normalized capacity with the full charge capacity of the new battery set to 1.
- Raw data and smoothed data are plotted in FIGS. 7A and 7B, and only smoothed data are plotted in FIG. 7C.
- the raw data of the second-order differential in FIG. 7(c) is omitted because the values are so discontinuous that the rough shape cannot be grasped due to the influence of the measurement error and the quantization error.
- Four characteristic points, ie, local maximum points, local minimum points, positive zero cross points, and negative zero cross points, are plotted on the smoothed curves of FIGS. 7(a) and 7(b).
- FIG. 8 shows a diagram illustrating the sigmoid curve y (FIG. 8(a)), its first-order differential curve dy/dx (FIG. 8(b)), and second-order differential curve d2y/dx2 (FIG. 8(c)). show.
- the inflection point on the sigmoid curve in FIG. 8(a) corresponds to the maximum point on the first-order differential curve in FIG. 8(b) and the negative zero crossing point on the second-order differential curve in FIG. 8(c).
- the concave inflection point and the convex inflection point on the first-order differential curve in FIG. 8(b) respectively correspond to the maximum and minimum points on the second-order differential curve in FIG. 8(c).
- FIG. 7 it can be confirmed that the extreme points of the first-order differential curve in FIG. 7(b) and the zero-crossing points of the second-order differential curve in FIG. 7(c) are aligned on the horizontal axis.
- the electrode potential curve of the storage battery changes in potential stepwise due to the phase change, so it can be expressed by a function including the sum of sigmoid functions. Therefore, if FIG. 8 is regarded as the relationship between differentiation and feature points on the sigmoid curve, and the order of the types of feature points extracted from the target data is regarded as the sum of the sigmoid functions according to the order of differentiation, the order is consistent. It is also possible to improve robustness by checking whether the
- a feature point z * d ⁇ Td of the new cell data that serves as a reference is extracted (step S5 in FIG. 6).
- Td represents a set of feature point types d in the new cell data
- z *d is a vertical vector of feature points belonging to the feature point type d in the new cell data.
- Fig. 9 shows a plot of the voltage of the new cell (Fig. 9(a)), the first derivative voltage (Fig. 9(b)), and the second derivative voltage (Fig. 9(c)). Description of the figure is omitted because it is the same as that of FIG. Compared to the deteriorated cell in FIG. 7, the shape characteristics of the smoothed first-order differential curve (FIG. 9(b)) and second-order differential curve (FIG. 9(c)) are clearer, and more feature points are extracted. From a different point of view, some characteristic points on the curve have disappeared due to deterioration in the deteriorated cell data. This is probably because the lithium ion concentration distribution inside the electrode increased due to deterioration of the electrode, as described in the subject.
- the characteristic points of the first-order differential curve and the second-order differential curve extracted as described above are considered to be derived from graphite. This can be seen by comparing FIGS. 7 and 9 with the shapes of the differential potential curve of ternary NMC in FIG. 4 and the differential potential curve of graphite in FIG.
- the gentle positive differential potential curve as shown in FIG. 4 and the steep negative differential potential curve as shown in FIG. 5 are synthesized. ing. Furthermore, looking at the second-order differential potential curves of FIGS. 7(c) and 9(c), the low-frequency component derived from the positive electrode in the first-order differential potential curves of FIGS. 7(b) and 9(b) is It can be considered that a curve in which the characteristic shape derived from the negative electrode is dominant is extracted because the high frequency component derived from the negative electrode is emphasized by the differentiation. 5, 7, and 9, it can be determined that all the characteristic points are derived from the negative electrode, although there are some vertical and horizontal deviations due to the influence of the positive electrode curve.
- FIG. 10 is a flow chart of one-dimensional ICP. Assume that u d ⁇ U d is given as a feature point of input data (step S61 in FIG. 10), and z d ⁇ Z d is given as a feature point of reference data (step S62). In the examples so far, the feature points of the degraded cell correspond to the feature points of the input data, and the feature points of the new cell correspond to the feature points of the reference data.
- each feature point u d ⁇ U d of the input data is transformed as follows using the estimated parameter p k (step S64).
- step S65 the nearest neighbor feature point group W d k is obtained as follows.
- C(x, y) is, for example, a partial order of the ordered set x that minimizes the sum of squares of errors in the Euclidean distance to each element of the ordered set y, for the ordered sets x and y. It is a function that finds a set.
- the method of measuring the error may be other than the Euclidean distance, and it is not necessarily the sum of squares.
- point groups are associated with each other.
- the n-th order differential voltage curve of the storage battery becomes gentler as it deteriorates, and the number of characteristic points decreases.
- the total number of feature points tends to be smaller than that of the reference cell data (reference data here).
- the operation of obtaining the partial ordered set Wd of the reference data Zd in the above equation naturally reflects such characteristics of the storage battery. Note that a full search or an existing algorithm may be used to obtain the nearest neighbor point group.
- Equation (8) is a linear least squares problem, a solution that minimizes the sum of squared errors can be obtained, and the estimated value p k+1 is
- step S66 is calculated (step S66). It is known that when each element of ⁇ is independent of each other and follows some normal distribution with mean 0, the derived solution is equal to the maximum likelihood estimate. Since the proposed method uses the linear least-squares method, it has the advantage that iterative calculations are not required for parameter estimation in each step, and the optimal solution can be obtained uniquely without depending on the initial values.
- step S67 convergence is determined by comparing whether the estimated parameters pk+1 and pk are the same value. As a result of the comparison, if the values are the same, the process ends. If the values are different, the calculations up to this point are repeated with k ⁇ k+1 until the same value is obtained (step S68). Both the nearest neighbor feature point group and the linear least-squares solution calculated on the way minimize the sum-of-squares error between the point groups. Therefore, the sum-of-squares error is monotonically non-increasing in any calculation step, and it is guaranteed to converge to a minimum value by repeated calculations.
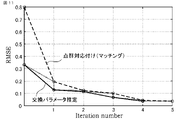
- FIG. 11 shows transition of RMSE (Root Mean Square Error) as a result of point group registration by one-dimensional ICP.
- the horizontal axis represents the number of iterations, and the RMSE of both the result of the point cloud matching step and the result of the transformation parameter estimation step are plotted.
- the RMSE of the transformation parameter estimation is obtained when p k+1 calculated in the kth step is used as the transformation parameter.
- the RMSE is small without monotonically increasing as indicated by the dashed line.
- the feature point group markers are plotted only in the reference data and the conversion result of the input data by p5, and the associated feature points are connected by solid lines.
- the negative electrode capacity retention rate was 98.0%, and the error of the normalized capacity was -0.38%.
- the estimation result of the negative electrode capacity retention ratio being close to 100% is consistent with the visual observation result that the distances between the corresponding feature points of the first-order differential curves and the second-order differential curves in FIGS. 7 and 9 are almost unchanged.
- the estimation result that the error of the normalized capacity was close to 0% was as expected.
- the above is the calculation process when the one-dimensional ICP is used as an example, and point group alignment is performed with respect to the feature point group of the second-order differential voltage data of the reference cell and the deteriorated cell.
- the internal resistance R is estimated (step S7).
- the internal resistance R may be estimated as one of the parameters when estimating the positive electrode parameter, which will be described later.
- the internal resistance R is obtained independently.
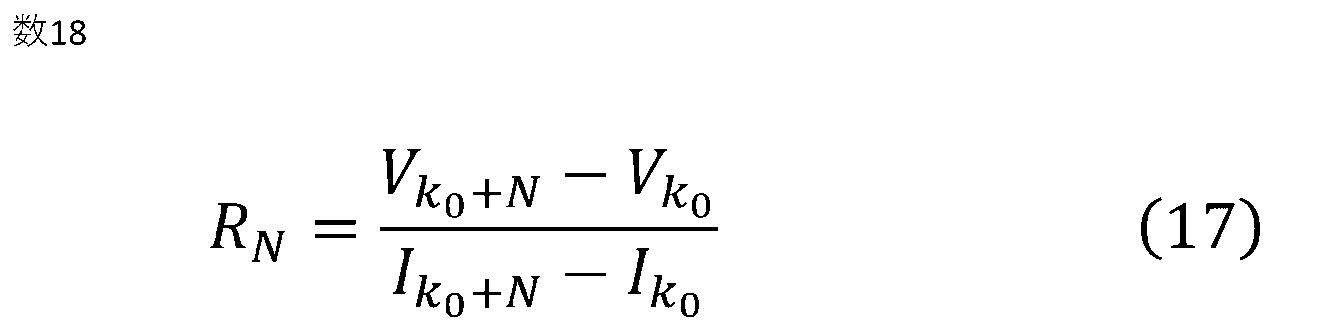
- the internal resistance at N seconds is calculated as follows.
- N Ideally, use constant current charge or constant current discharge data for N seconds.
- the value of N is preferably about 60 to 300 seconds so that the internal resistance includes diffusion resistance having a long time constant of several seconds to several hundreds of seconds. However, if the number of seconds is too long, the error due to OCV fluctuation will increase, so be careful.
- an equivalent circuit model may be constructed by dividing the internal resistance into elements such as DC component electrolyte resistance, charge transfer resistance, diffusion resistance, etc., and the parameters of each element may be estimated. If the storage battery system in which the storage battery 2 is installed separately acquires the internal resistance, that value may be used.
- step S9 a method for estimating the positive (deteriorated) parameter of the degraded cell will be described (step S9).
- the positive electrode potential curve first, based on the data point sequence of the deteriorated cell, the negative electrode parameter and the internal resistance that have already been obtained, from the storage battery voltage curve equation (9), the negative electrode potential curve and the overvoltage component due to the internal resistance from the storage battery voltage is subtracted to calculate the positive electrode potential curve of the deteriorated cell (step S10).
- information on the negative electrode potential held in advance is used (step S8).
- the new cell positive electrode potential curve is calculated (step S10).
- the positive parameter is estimated so as to reduce the error between the new cell positive electrode potential curve and the deteriorated cell positive electrode potential curve calculated in this way.
- ⁇ p and ⁇ p in equation (9) are estimated as positive parameters, but if the internal resistance R is not obtained and subtracted in the previous stage, the resistance parameter ⁇ r is also included in the estimated parameters. presume.
- the positive electrode potential curve near the capacity of 0 is not calculated because the negative electrode potential curve fluctuates greatly in the vicinity of the capacity of 0, and the calculated positive electrode potential curve is likely to include errors due to its influence.
- the positive potential curve of the new cell and/or the deteriorated cell is a data point sequence, for example, by interpolating each data, the value of the vertical axis is calculated for each fixed width of the horizontal axis, and the error is evaluated. .
- Various methods such as linear interpolation or spline interpolation can be used for interpolation.
- the positive electrode potential curve of the new cell and/or the deteriorated cell is a function model
- the value of the vertical axis can be calculated according to the function model for each fixed horizontal axis step size.
- An error-based evaluation function is used in the positive parameter estimation, and as already described, various definitions can be used for the evaluation function. Here, the sum of squares of errors for each point is used.
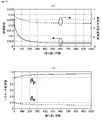
- FIG. 13 shows the result of estimating the positive parameter by iterative calculation of a certain nonlinear optimization method.
- the left axis of FIG. 13(a) is the evaluation function
- the right axis is the base 10 logarithm of the evaluation function
- the vertical axis of FIG. 13(b) is the estimated value of the positive parameter
- FIG. In both b) the horizontal axis is the number of repetitions.
- the parameter estimated value converges to a constant value in the process of repeated calculation, and the evaluation function also converges to a constant value accordingly. Looking at the logarithm of the evaluation function, it certainly converges to a constant value.
- the positive electrode capacity retention rate was 88.6%
- the capacity deviation was 11.9%.
- Fig. 14 shows the positive electrode, negative electrode, cell data and estimation results of the new cell and the deteriorated cell. Ultimately, it can be seen that the charge data of the deteriorated cell and the charge curve reconstructed by estimating each deterioration parameter of the deteriorated cell substantially match.
- Fig. 15 shows the results of smoothing partial charging data of the same storage battery and extracting feature points. Description of FIG. 15 is omitted because it is the same as that of FIGS. 7 and 9 . While only three feature points are obtained from the first-order differential voltage curve of FIG. 15(b), nine feature points are obtained from the second-order differential voltage curve of FIG. Abundant information can be obtained from the slight shape features of the voltage curve of and.
- Fig. 16 shows the result of performing point group alignment by one-dimensional ICP between the new cell and the deteriorated cell. Description of FIG. 16 is omitted because it is the same as that of FIG. The positions of the feature points are aligned by comprehensively judging from the abundant feature points extracted from the second-order differential voltage curve of FIG. 15(c).
- the estimation results of the negative electrode parameters were a negative electrode capacity retention rate of 98.8% and an SOC error of 0.07%, which were in good agreement with the previous estimation results for the full charge data.
- Fig. 17 shows the positive electrode, negative electrode, cell data and estimation results of the new cell and the deteriorated cell, as in Fig. 14 when fully charged.
- the positive electrode capacity retention rate was 91.6% and the capacity deviation was 14.3%, which were also close to the estimation results for the full charge data.
- the reconstructed cell OCV curve had a similar shape. The above is an application example of the storage battery diagnosis device 1 according to the present embodiment.
- FIG. 18 is a flow chart showing an example of a processing procedure by the storage battery diagnosis method according to Embodiment 1.
- the data point sequence generator 5 acquires time-series data of current and voltage based on the detected current acquired from the current detector 3 and the detected voltage acquired from the voltage detector 4 (step S1051).
- the data point sequence generation unit 5 uses the acquired data to calculate time-series data of capacitance and voltage.
- One piece of time-series data of the Z-order differential voltage curve by a real number Z greater than 0 or a plurality of pieces for different Zs is calculated (step S1052).
- the feature point group extraction unit 6 extracts a feature point group from the data point sequence of the voltage and/or the Z-order differential voltage acquired in step S1052 (step S1061).
- the feature point group is the inflection point, the extremum point, and the zero crossing point as described above, but it is not limited to this, and depending on the case, it may be all the data points of the data point sequence acquired in the previous step. may
- the reference data providing unit 7 acquires and transmits reference data (step S1071). However, the reference data may have already been acquired.
- the point group registration unit 8 performs point group registration for the extracted feature point groups so as to match the transmitted reference data, associates the point groups with each other, and estimates transformation parameters (step S1081).
- the diagnosis unit 9 estimates the deterioration parameter of the storage battery 2 based on at least the transformation parameter estimated by the point group alignment (step S1091). Moreover, the deterioration parameter may be further estimated in the diagnostic unit 9 by using the reference data.
- the negative parameter corresponds to the deterioration parameter of storage battery 2 estimated based on the conversion parameter
- the positive parameter and the resistance parameter correspond to deterioration parameters further estimated using the reference data. Note that the order of processing shown in FIG. 18 is an example, and is not limited to this order.
- the point clouds are matched and the transformation parameters are estimated.
- storage battery parameters for diagnosing the performance of the storage battery and/or estimating the internal state such as capacity are calculated.
- the capacity may be standardized based on the full charge capacity of a certain storage battery at a certain point in time, and the capacity standardized based on the full charge capacity of the storage battery itself at that time is the charging rate. Or called state of charge.
- Z is an arbitrary real number
- the fractional order integral from a is the following Cauchy formula, can be calculated more efficiently by The same formula can be used to calculate ordinary integer-order integrals.
- the use of the Cauchy's formula is efficient in the sense that even in the numerical calculation of the n-th order integral, the value can be obtained by performing the integral calculation once according to the Cauchy's formula without repeating the integral calculation n times.
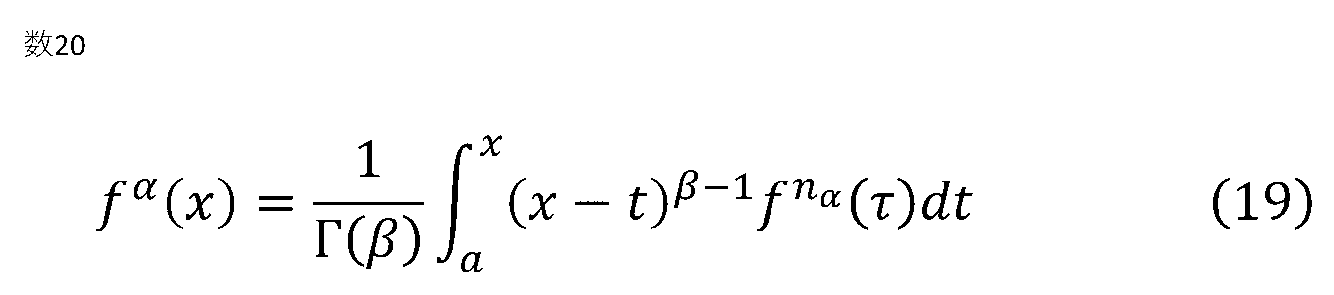
- ⁇ -order differentiation There are several definitions in the case of ⁇ -order differentiation . which is called the Caputo derivative.
- the curve obtained by n ⁇ -order integer-order differentiation may be subjected to ⁇ -order integration.
- the Z-th order calculus curve may be either a Z-th order calculus voltage curve by capacity differentiation of voltage or a Z-th order calculus capacity curve by voltage differentiation of capacity.
- the horizontal axis may be capacity, voltage, or time.
- the horizontal axis of the Z-order calculus voltage curve is capacitance, and the horizontal axis of the Z-order capacitance calculus curve is voltage, but the present invention is not limited to these.
- the voltage curve of the storage battery is a curve obtained by combining the positive electrode potential curve and the negative electrode potential curve. ing.
- the deterioration of one electrode may appear predominantly in the voltage curve, or the influence of deterioration of both electrodes may appear in the same way.
- the influence of the potential curve of one electrode may appear predominantly. In such a case, even if only the point cloud alignment is performed between the voltage curves of the storage battery, the conversion parameters obtained there and the values calculated therefrom will be parameters that accurately represent the deterioration of the storage battery. sell.
- the advantage of solving the point cloud registration problem is that existing proven technologies such as ICP and CPD can be applied.
- the point cloud to point comparison approach also eliminates, in whole or in part, the acquisition or construction of battery and/or electrode models. If there is a process of building a model in diagnosis, there is a risk that modeling will fail or the diagnosis result will be uncertain due to errors between the model and data. On the other hand, the present approach can be applied as it is as long as the given data point clouds are appropriately resampled.
- Z_D and Z_I are separate variables, real numbers greater than 0).
- differentiation attenuates low-frequency components and amplifies high-frequency components
- integration attenuates high-frequency components and amplifies low-frequency components. This tendency becomes more pronounced as the order of calculus increases. Therefore, in estimating the storage battery parameter, the easiness of estimation also differs between the Z_D-th order differential curve and the Z_I-th order integral curve according to the type of the storage battery parameter.
- the reference data point sequence to be used may be the data point sequence of the storage battery or the data point sequence of the electrode.
- the differential curve and the integral curve are each represented by the Zth order (Z is a real number greater than 0).
- One electrode parameter is estimated from the point group registration result of the Z_D order differential curves, and the other electrode parameter is estimated from the point group registration result of the Z_I order integral curves.
- the dominant frequency component of the potential curve becomes high frequency or low frequency depending on the electrode material. For this reason, if it is interpreted that the potential curves of different electrodes are emphasized and extracted by the ZD-order differential curve and the Z_I-order integral curve, respectively, it is possible to estimate the corresponding electrode parameters from the results of each point group alignment. be. By taking such an approach, it is possible to estimate the parameters separately for each electrode, so that more battery parameters can be estimated and the storage battery parameters can be estimated with higher accuracy.
- ⁇ Feature 4> Rather than using the data point sequence as it is, a feature point group of the data point sequence is extracted, and point group registration is performed between the feature point groups. Using feature point clouds reduces the computational cost of point cloud registration. Also, by appropriately extracting the feature point group, the robustness of the point group registration is improved. Furthermore, compared with the conventional differential voltage analysis method, by using point group registration, some feature points disappear, or even if the position and / or height of the feature points are changed, multiple or By performing comprehensive registration using all feature points, it is possible to automatically perform robust and highly accurate point cloud registration that is not affected by the disappearance and/or fluctuation of some feature points. be.
- ⁇ Feature 5> It is characterized by extracting a feature point group including at least two of a concave inflection point, a convex inflection point, a local maximum point, a local minimum point, a positive zero crossing point, and a negative zero crossing point.
- deterioration diagnosis is performed from the distance between two peaks (maximum points) on the differential voltage curve. Perform group alignment. Therefore, even in a data point sequence during partial charging in which two or more local maximum points do not exist, a slight change in curve shape can be extracted as a feature point group, and diagnosis can be performed by aligning the point group.
- ⁇ Feature 7> By comparing feature point groups extracted on each of two or more differential curves and confirming their consistency, the robustness of feature point extraction is improved, and as a result, the accuracy of point group registration and diagnosis is improved. .
- the positions of the concave inflection points/convex inflection points on the ZD-th order differential curve correspond to the positions of the maximum/minimum points on the ZD+1st-order differential curve. A relationship is available.
- ⁇ Feature 8> Similar to feature 7, the matching between feature point groups extracted on two or more different Z-order differential curves is confirmed and corrected, but at that time, the electrode potential curve of the storage battery changes in potential in a sigmoidal manner due to the phase change.
- a sigmoid curve becomes a peak curve when differentiated, and when further differentiated, it becomes a curve with one maximum point and one minimum point. , the point of inflection increases by two.
- the number of feature points for each type when the sigmoid curve is differentiated N times by an integer N greater than or equal to 0 is known. Even when the actual electrode potential curve and the storage battery voltage curve represented by its synthesis have a plurality of phase changes, they can be represented by superposition of sigmoid curves. Considering this, from the voltage curve of the storage battery, among the feature point types described in the embodiments, there is a concave inflection point at the phase change center position, and between one phase change and another phase change It is considered that there is a convex inflection point at . In this way, it is possible to confirm the consistency of the feature point extraction result based on the fact that the storage battery voltage curve is represented by the sum of the sigmoid curves and the number and type of feature points on the sigmoid curve and its differential curve. be.
- the reference data providing unit 7 does not provide the reference data point sequence as it is, but provides a smoothed reference data point sequence. Normally, smoothing for the purpose of reducing measurement error and quantization error is kept to a necessary minimum, and is done so as to preserve the original curve shape other than the error as much as possible.
- the curve shape of the reference data point sequence is moderated by increasing the smoothing strength, thereby bringing the curve shape closer to the data point sequence of the deteriorated storage battery to be diagnosed. As a result, the number of feature points to be extracted also decreases, and approaches the number of feature points to be extracted from the data point sequence of the storage battery to be diagnosed.
- the reason why the electrode potential curve becomes gradual due to deterioration is that the degree of deterioration differs among the large number of particles in the electrode, or the resistance increases due to deterioration. It is thought that this is because the distribution tends to occur in If a distribution occurs between particles, the timing of the potential change due to the phase change of each particle is shifted, so the electrode potential is considered to be a value that is the average of these different potential distributions. Although it is difficult to strictly reproduce the difference in the degree of deterioration inside and the ion distribution, it is possible to express them approximately by smoothing the curve of the time when new as a reference. By smoothing with an appropriate intensity and method, feature points derived from slight shape changes that were detected only from the reference data point sequence are no longer detected, and feature points common to the curve of the deteriorated cell are selected from the curve of the reference battery. expected to be extracted effectively.
- the method described as the noise removal method can be used.
- the smoothing intensity can usually be adjusted by setting hyperparameters in each method. For example, when using a moving average filter, the number of smoothing points should be increased in order to increase the smoothing strength. Also, for example, when using a Gaussian filter, it is possible to adjust not only the number of smoothing points but also the dispersion parameter in order to increase the smoothing strength.
- Characteristic 9 is made more specific.
- the smoothing strength is adjusted so that the number of feature points extracted by smoothing the reference data point sequence is reduced. Whether or not the curve shape has become sufficiently gentle can be confirmed as an index by whether or not the number of points in the extracted feature point group has decreased or by how much.
- point group registration for a feature point group since it means reducing the unnecessary feature points described above, it is effective in performing point group registration with high accuracy.
- the transformation parameters used in the point group alignment include the scaling parameter and the translation parameter, from the transformation parameters estimated as the result of the point group alignment, the full charge capacity retention rate of at least one electrode and , to estimate electrode parameters including the electrode capacity deviation or the battery capacity error.
- ⁇ Feature 12> The content of feature 11 is made more specific. It is assumed that one of the electrodes is negative and graphite, and that the Z-order calculus curve includes a second-order differential voltage curve.
- the potential curve has a sharper fluctuation than most positive electrode materials, and on the second differential voltage curve, the component derived from the positive electrode attenuates, and the component derived from the negative electrode is dominant. Therefore, the second-order differential curve and the feature point group extracted therefrom are mainly derived from the negative electrode. Therefore, the transformation parameters including the scaling parameter and the translation parameter estimated as a result of the point group registration there correspond to the full charge capacity retention rate and the capacity deviation of the negative electrode graphite.
- a battery diagnostic device estimates both electrode parameters. Specifically, first, a potential curve for one electrode is generated based on a reference electrode potential curve for one electrode and one electrode parameter calculated based on the result of point group registration. Then, by subtracting the electrode potential curve of one electrode from the voltage curve of the storage battery, the potential curve of the other electrode is calculated. Therefore, as described in the above-described embodiment, by comparing the potential curve of the other electrode with the reference potential curve of the other electrode and estimating the electrode parameter so as to reduce (minimize) the error, , the electrode parameters of the other electrode can also be calculated. Even if the reference electrode potential curve of the other electrode is not available, it can be calculated by subtracting the reference potential curve of one electrode from the reference voltage curve of the storage battery.
- the electrode parameters of both electrodes it is possible to estimate the electrode parameters of both electrodes and perform more detailed deterioration diagnosis.
- the parameters for each electrode are estimated separately, so the number of parameters can be reduced. It is expected that computational robustness and accuracy will improve.
- ICP is used for point cloud registration.
- the concept of ICP is easy to understand, and it is a highly reliable technology that is used in various fields.
- the feature 15 is made more concrete, and one-dimensional ICP is used for the feature point group in consideration of only the error on the horizontal axis.
- the details of the one-dimensional ICP are as described in Embodiment 1. It is less susceptible to the storage battery voltage curve becoming gentler due to deterioration, the transformation parameter estimation can be reduced to the linear least squares method, and other advantages. Reducing to the linear least squares method eliminates the need for repeated calculations required in nonlinear optimization, and obtains a unique solution that does not depend on initial values at that step. Therefore, parameter tuning becomes unnecessary, and calculation processing is speeded up.
- CPD is used for point cloud registration.
- CPD can flexibly perform nonlinear transformation such as distorting the positional relationship of point groups. In this sense, there is an advantage that point group registration can be flexibly performed even for data point sequences of storage batteries whose curves become gentle due to deterioration.
- the difference between the feature point group and the reference feature point group is reduced, and parallel to the scaling parameter.
- estimating an electrode parameter for at least one electrode by estimating a parameter including a movement parameter; By doing so, it is possible to obtain scaling and translation parameters even if the CPD does not use them or involves non-linear transformations.
- scaling parameters and translation parameters It is sufficient to estimate the parameters including
- FIG. 19 shows an example of a storage battery system 200 in which the storage battery diagnosis device 1 having the features 1 to 17 described above is used for stationary applications such as a vehicle using the storage battery 2 or a residence.
- a display device 10 for displaying the diagnostic result of the storage battery diagnostic device 1 described above and a control unit 11 for controlling the storage battery 2 based on the diagnostic result are provided.
- the control unit 11 predicts the performance and life of the storage battery 2 and displays the replacement timing of the storage battery 2 on the display device 10 .
- a display may be provided to prompt the driver to drive the vehicle in accordance with the life or performance of the storage battery.
- the control unit 11 is composed of a processor and a storage device, and the storage device includes a volatile storage device such as a random access memory and a non-volatile auxiliary storage device such as a flash memory. equip. Also, an auxiliary storage device such as a hard disk may be provided instead of the flash memory.
- the processor performs the above-described control based on the result of the storage battery diagnosis device 1 by executing the program input from the storage device. In this case, the program is input from the auxiliary storage device to the processor via the volatile storage device. Further, the processor may output data such as calculation results to the volatile storage device of the storage device, or may store the data in the auxiliary storage device via the volatile storage device.
- 1 storage battery diagnosis device
- 2 storage battery
- 3 current detection device
- 4 voltage detection device
- 5 data point sequence generation unit
- 6 feature point group extraction unit
- 7 reference data provision unit
- 8 point group position
- diagnosis unit 20 controller 20a: processor 20b: storage device 100: storage battery diagnosis system 200: storage battery system.
Landscapes
- Physics & Mathematics (AREA)
- General Physics & Mathematics (AREA)
- Secondary Cells (AREA)
- Tests Of Electric Status Of Batteries (AREA)
- Charge And Discharge Circuits For Batteries Or The Like (AREA)
Abstract
Description
電流検出装置が検出する蓄電池の電流と電圧検出装置が検出する蓄電池の電圧とに基づいて、実数ZによるZ階微積分電圧またはZ階微積分容量で表されるZ階微積分曲線を含むデータ点列を生成するデータ点列生成部、
基準となる蓄電池または電極の基準データ点列を提供する基準データ提供部、
データ点列生成部で生成されたデータ点列と基準データ点列との間で、点群位置合わせを行なう点群位置合わせ部、
点群位置合わせ部の結果に基づいて、蓄電池または電極の劣化の状態を示すパラメータを推定する診断部、
を備えている。
〈全体構成の概略説明〉
図1は、実施の形態1に係る蓄電池診断装置1を含む蓄電池診断システム100の構成例を示す図である。蓄電池診断システム100は、図1に示すように、蓄電池診断装置1と、蓄電池2と、電流検出装置3と、電圧検出装置4とを備える。
次に、実施の形態1に係る蓄電池診断装置1の構成について、図1及び図2を参照して説明する。図2は、実施の形態1に係る蓄電池診断装置1のハードウェア構成の一例を示すブロック図である。






以下、蓄電池の劣化および劣化を反映するモデルと、上述の蓄電池診断装置1による診断の一例を、数式および図を用いて説明する。まず、蓄電池の劣化および劣化を反映するモデルについて数式および図を用いて説明する。



次に、上述の蓄電池診断装置1による診断の一例を、数式および図を用いて説明する。
図6は、蓄電池診断装置1において、ICPを用いたときの診断フローチャートの一例である。なお、新セルと劣化セルの区別のため、新セルのデータに関する点は右肩にアスタリスク(*)を付している。






以上が、一例として一次元ICPを用い、基準セルと劣化セルの二階微分電圧データの特徴点群に対する点群位置合わせを行なったときの計算過程である。
内部抵抗Rを取得するには、一例として、入力された充放電データ点列のうち、充放電を開始する直前の休止中の第k0秒と、充放電開始後N秒間経過後の第k0+N秒での電流と電圧に基づき、N秒間での内部抵抗を以下のように計算する。
新セル及び/又は劣化セルの正極電位曲線がデータ点列の場合、たとえば、各データを補間することで、一定の横軸の刻み幅毎に、縦軸の値を算出のうえ誤差を評価する。補間には、線形補間またはスプライン補間など、さまざまな方法を用いることができる。
次に、実施の形態1に係る蓄電池診断方法による処理手順について、図18を参照して説明する。図18は、実施の形態1に係る蓄電池診断方法による処理手順の一例を示すフローチャートである。
なお、図18に示す処理の順序は一例であり、この順序に限定されない。
上述した実施の形態の説明に追加して、本願の特徴ごとに、その他の実施の形態および効果を補足的に説明する。
〈特徴1〉
上述した実施の形態1では、微分曲線に基づいて説明したが、実数Zによる微積分(微分または積分)によって算出されるZ階微積分電圧曲線またはZ階微積分容量曲線であるようなZ階微積分曲線を対象に、蓄電池の性能診断及び/又は容量などの内部状態推定の問題の少なくとも一部を、点群位置合わせの問題に帰着させてもよい。そして、点群位置合わせ技術により対象蓄電池のデータ点列を参照(基準)データ点列に合わせ、データ点列同士で点群位置合わせを行うことで、点群同士の対応付けと変換パラメータの推定を行なう。そして、推定された変換パラメータに基づき、蓄電池の性能診断及び/又は容量などの内部状態推定のための蓄電池パラメータを計算する。

点群位置合わせ技術により対象蓄電池のデータ点列を基準データ点列に合わせる際に、点群位置合わせZ_D階微分曲線同士の点群位置合わせ、またはZ_I階積分曲線同士の点群位置合わせを行なってもよい(Z_DとZ_Iは別の変数で、0より大きい実数)。一般的に微分すると低周波成分が減衰され高周波成分が増幅されるのに対し、積分すると高周波成分が減衰され低周波成分が増幅される。そして、微積分の階数が大きくなるほどにその傾向は顕著となる。したがって、蓄電池パラメータを推定するうえでもまた、Z_D階微分曲線とZ_I階積分曲線それぞれで蓄電池パラメータの種類に応じた推定しやすさが異なってくる。それゆえ、対象蓄電池のデータ点列のZ_D階微分曲線と基準データ点列の基準Z_D階微分曲線、あるいは、対象蓄電池のデータ点列のZ_D階積分曲線と基準データ点列の基準Z_I階積分曲線、で点群位置合わせを行ない、それぞれの点群位置合わせ結果から、推定パラメータを取得すれば、より多くの蓄電池パラメータを推定でき、より精度よく蓄電池パラメータを推定することが可能となる。
なお、用いる基準データ点列は、蓄電池のデータ点列でもよいし、電極のデータ点列でもよい。
なお、上述で、Z_D階、Z_I階の表記を使用するのは、Z階で表記すると、微分曲線も積分曲線も同じ回数(たとえば、Z=3.2なら3.2階微分曲線かつ3.2階積分曲線)という意味に解釈されないように別の変数であることを明記するためである。別の変数であることを明記する必要がない場合は、微分曲線および積分曲線をそれぞれ、Z階(Zは0より大きい実数)で表記することとする。
Z_D階微分曲線同士の点群位置合わせ結果から一方の電極パラメータを推定し、Z_I階積分曲線同士の点群位置合わせの結果から他方の電極パラメータを推定する。図4,5にあるとおり、電極材料により、電位曲線の支配的な周波数成分が高周波、または、低周波となる。このため、Z_D階微分曲線とZ_I階積分曲線それぞれで異なる電極の電位曲線が強調され、抽出されたと解釈すれば、それぞれの点群位置合わせの結果から対応する電極パラメータを推定することが可能である。このようなアプローチをとることで、電極毎に別々にパラメータを推定することが可能となり、より多くの蓄電池パラメータを推定でき、より精度よく蓄電池パラメータを推定することが可能となる。
データ点列をそのまま用いるのではなく、データ点列の特徴点群を抽出し、特徴点群同士で点群位置合わせを行なう。特徴点群を用いることで、点群位置合わせの計算コストが低下する。また、適切に特徴点群を抽出することで、点群位置合わせのロバスト性が向上する。さらに、従来の微分電圧解析法と比較しても、点群位置合わせを用いることで、一部の特徴点が消失する、あるいは特徴点の位置及び/又は高さを変えたとしても、複数または全ての特徴点を用いて総合的に位置合わせを行なうことで、一部の特徴点の消失及び/又は変動の影響を受けにくいロバストで高精度な点群位置合わせを自動で行なうことが可能である。
凹変曲点、凸変曲点、極大点、極小点、正ゼロクロス点、負ゼロクロス点のうち少なくとも2つを含む特徴点群を抽出することを特徴としている。微分電圧解析法においては、微分電圧曲線上の2つのピーク(極大点)間の距離から劣化診断を行なうが、極大点以外も含む計6種類の特徴点から少なくとも2つを利用して、点群位置合わせを行なう。このため、2つ以上の極大点が存在しない部分充電時のデータ点列であっても、わずかな曲線形状の変化を特徴点群として抽出し、点群位置合わせによる診断が可能となる。
特徴5をより具体的にすると、2つ以上の相異なるZ階微分曲線を利用して一括で点群位置合わせを行なう。このようにすることで、点群位置合わせのロバスト性が向上する。たとえば、1階微分曲線上で一部の特徴点が検出されず、逆に本来存在しないところで誤差の影響で誤検出してしまった場合にも、2階微分曲線上でその特徴点を正しく抽出できていれば、両方の曲線を利用している分、検出失敗の影響を受けにくくなる。また、点群の誤った対応付けをしている場合、2つの曲線の両方で誤差が発生することから、偶然誤差が小さくなったために誤った点群の対応付けに収束した、というような失敗が起こりにくくなると考えられる。
2つ以上の各微分曲線上で抽出される特徴点群同士を比較して、整合性を確認することで、特徴点抽出のロバスト性を上げ、結果として点群位置合わせおよび診断の精度を上げる。具体的には、例えば、図8のとおり、Z_D階微分曲線上の凹変曲点/凸変曲点の位置は、Z_D+1階微分曲線上の極大点/極小点の位置に対応しているという関係が利用可能である。
特徴7と同様に2つ以上の相異なるZ階微分曲線上で抽出した特徴点群同士の整合性を確認し補正するが、その際に蓄電池の電極電位曲線が相変化によりシグモイド状に電位変化する性質を利用する。図8のように、一般にシグモイド曲線は、微分するとピーク曲線となり、さらに微分すると極大点と極小点を1点ずつもつような曲線となり、以下、微分するごとに極値点が1ずつ増えていき、変曲点が2ずつ増えていくような性質を有する。
基準データ提供部7が、基準データ点列をそのまま提供するのではなく、平滑化した基準データ点列を提供する。通常、計測誤差および量子化誤差を低減する目的での平滑化は必要最小限に留められ、誤差以外のもとの曲線形状をなるべく保存するように為される。しかしながら、本特徴は、平滑化強度を上げることで基準データ点列の曲線形状をあえて緩やかにすることで、診断対象の劣化した蓄電池のデータ点列の曲線形状に近づける。またその結果、抽出される特徴点数も減り、診断対象の蓄電池のデータ点列から抽出される特徴点数に近づく。
特徴9をより具体化する。基準データ点列を平滑化することで抽出される特徴点群の点数が少なくなるように、平滑化強度を調整する。曲線形状が十分に緩やかになったかどうかは、抽出される特徴点群の点数が少なくなったかどうか、あるいはどれだけ少なくなったかを指標として確認することができる。とくに、特徴点群に対する点群位置合わせを行なう場合は、上述の不要な特徴点を削減するという意味をもつため、点群位置合わせを高精度に行なううえでも効果を有する。
点群位置合わせで用いる変換パラメータとして、拡大縮小パラメータと平行移動パラメータを含むと指定したうえで、点群位置合わせの結果として推定された変換パラメータから、少なくとも一方の電極の満充電容量維持率と、該電極の容量ずれまたは蓄電池の容量誤差とを含む電極パラメータを推定する。
特徴11の内容をより具体化する。一方の電極が負極でかつグラファイトであり、かつZ階微積分曲線として2階微分電圧曲線を含むとされる。負極がグラファイトである場合、多くの正極材料と比較して急峻な変動を有する電位曲線となっており、二階微分電圧曲線上では正極に由来する成分は減衰し、負極に由来する成分が支配的となることから、二階微分曲線およびそこから抽出される特徴点群はおもに負極由来のものとなる。それゆえ、そこでの点群位置合わせの結果推定される拡大縮小パラメータと平行移動パラメータを含む変換パラメータは、負極グラファイトの満充電容量維持率および容量ずれに対応したものとなる。
蓄電池診断装置が、両方の電極パラメータを推定するものとなっている。具体的には、まず、一方の電極に関する基準電極電位曲線と、点群位置合わせの結果に基づき算出された一方の電極パラメータと、に基づき、一方の電極の電位曲線を生成する。そして、蓄電池の電圧曲線から一方の電極の電極電位曲線を差し引けば、他方の電極の電位曲線が算出される。よって、上述した実施の形態で説明したように、他方の電極の電位曲線と他方の電極の基準電位曲線とを比較し、誤差が小さく(最小に)なるようにして電極パラメータを推定することで、他方の電極の電極パラメータも算出することができる。他方の電極の基準電極電位曲線を保有していない場合でも、蓄電池の基準電圧曲線から一方の電極の基準電位曲線を差し引くことで算出可能である。
点群位置合わせにICPを用いる。ICPは考え方が分かりやすいうえに様々な分野で用いられている信頼性の高い技術である。
ICPにおいて、特徴点の種類毎に別々に点群対応付けを行なう。このようにすることで、点群対応付けをよりロバストに行なうことが可能である。
特徴15をより具体化し、特徴点群を対象に、横軸の誤差のみを考慮した一次元ICPを用いる。一次元ICPの詳細は実施の形態1で説明したとおりであり、蓄電池電圧曲線が劣化により緩やかになっていくことの影響を受けにくい点、変換パラメータの推定を線形最小二乗法に帰着できる点、などの利点を有する。線形最小二乗法に帰着されることで、非線形最適化で必要であった繰り返し計算が不要となり、かつ、そのステップにおいて初期値に依存しない一意の解が得られる。ゆえに、パラメータチューニング不要となり、また、計算処理も高速化される。
点群位置合わせにCPDを用いる。CPDは、点群の位置関係を歪ませるなどの非線形な変換も柔軟に行なうことが可能である。この意味では、劣化により曲線が緩やかになっていく蓄電池のデータ点列同士であっても、柔軟に点群位置合わせを行なうことができるという利点を有する。
上述した特徴1から17を有する蓄電池診断装置1を、蓄電池2を使用する車両、あるいは住居などの定置用途に使用した蓄電池システム200の一例を図19に示す。上述した蓄電池診断装置1の診断結果を表示する表示装置10および診断結果に基づいて蓄電池2を制御する制御部11を備える。蓄電池診断装置1により推定される蓄電池2の劣化情報に基づいて、制御部11は、蓄電池2の性能および寿命予測を行い、蓄電池2の交換時期を表示装置10に表示する。また、車両であれば、蓄電池の寿命または性能に応じた車両の運転の仕方を運転者に促すような表示を行っても良い。
従って、例示されていない無数の変形例が、本願明細書に開示される技術の範囲内において想定される。例えば、少なくとも1つの構成要素を変形する場合、追加する場合または省略する場合が含まれるものとする。
Claims (18)
- 電流検出装置が検出する蓄電池の電流と電圧検出装置が検出する前記蓄電池の電圧とに基づいて、実数ZによるZ階微積分電圧またはZ階微積分容量で表されるZ階微積分曲線を含むデータ点列を生成するデータ点列生成部、
基準となる蓄電池または電極の基準データ点列を提供する基準データ提供部、
前記データ点列生成部で生成されたデータ点列と前記基準データ点列との間で、点群位置合わせを行なう点群位置合わせ部、
前記点群位置合わせ部の結果に基づいて、前記蓄電池または前記電極の劣化の状態を示すパラメータを推定する診断部、
を備える蓄電池診断装置。 - 前記データ点列生成部で生成される前記Z階微積分曲線は、Z_D階微分曲線とZ_I階積分曲線とを含み、
前記基準データ提供部の前記基準データ点列は、基準Z_D階微分曲線および基準Z_I階積分曲線の少なくとも一部を含み、
前記点群位置合わせ部は、前記Z_D階微分曲線と前記基準Z_D階微分曲線のデータ点列同士で点群位置合わせを行ない、前記Z_I階積分曲線と前記基準Z_I階積分曲線のデータ点列同士で点群位置合わせを行うことを特徴とする請求項1に記載の蓄電池装置、ただし、Z_D、Z_Iは0より大きい実数である。 - 前記電極の劣化の状態を示すパラメータを推定する場合に、前記診断部は、前記Z_D階微分曲線と前記基準Z_D階微分曲線のデータ点列同士の点群位置合わせの結果から前記蓄電池の負極および正極の内の一方の電極の劣化の状態を示す電極パラメータを推定し、前記Z_I階積分曲線と前記基準Z_I階積分曲線のデータ点列同士の点群位置合わせの結果から他方の電極の劣化の状態を示すパラメータを推定することを特徴とする請求項2に記載の蓄電池診断装置。
- 前記データ点列から特徴点群を抽出し、前記基準データ点列から基準特徴点群を抽出する、特徴点群抽出部をさらに備え、
前記点群位置合わせ部は、前記特徴点群と前記基準特徴点群との間で点群位置合わせを行なうことを特徴とする請求項1から3のいずれか1項に記載の蓄電池診断装置。 - 前記特徴点群抽出部が抽出する前記特徴点群および前記基準特徴点群は、凹変曲点、凸変曲点、極大点、極小点、正ゼロクロス点、負ゼロクロス点の特徴点のうち少なくとも2つを含むことを特徴とする請求項4に記載の蓄電池診断装置。
- Z_D階微分曲線を含むデータ点列を生成する場合、2つ以上の相異なる階数の微分曲線を含むことを特徴とする請求項5に記載の蓄電池診断装置。
- Z_D階微分曲線を含むデータ点列を生成する場合、前記特徴点群抽出部で抽出された前記特徴点群または前記基準特徴点群は、2つ以上の相異なる階数の微分曲線の間で、前記特徴点群または前記基準特徴点群の位置が整合することを特徴とする請求項5に記載の蓄電池診断装置。
- Z_D階微分曲線を含むデータ点列を生成する場合、前記特徴点群抽出部で抽出された前記特徴点群または前記基準特徴点群における、2つ以上の異なるZ_D階微分曲線の間で、前記蓄電池の電極電位曲線の相変化によるシグモイド状の電位変化に基づき前記特徴点群または前記基準特徴点群の位置を整合することを特徴とする請求項5に記載の蓄電池診断装置。
- 前記基準データ提供部は、前記基準データ点列を平滑化することを特徴とする請求項1から5のいずれか1項に記載の蓄電池診断装置。
- 前記基準データ提供部は、前記基準データ点列を平滑化し、平滑化における平滑化強度を調整し、前記特徴点群抽出部において、基準データ点列から抽出される基準特徴点群よりも、平滑化された基準データ点列から抽出される基準特徴点群のほうが特徴点の数が少なくなるようにすることを特徴とする請求項4に記載の蓄電池診断装置。
- 前記点群位置合わせ部は、拡大縮小パラメータと平行移動パラメータとを含む変換パラメータを算出し、前記診断部は、前記変換パラメータに基づき、前記電極の満充電容量維持率と、前記電極の容量ずれまたは前記蓄電池の容量誤差とを含む電極パラメータを算出することを特徴とする請求項1から5のいずれか1項に記載の蓄電池診断装置。
- 前記点群位置合わせ部は、拡大縮小パラメータと平行移動パラメータとを含む変換パラメータを算出し、前記診断部は、前記変換パラメータに基づき、前記電極の満充電容量維持率と、前記電極の容量ずれまたは前記蓄電池の容量誤差とを含む電極パラメータを算出し、前記Z_D階微分曲線を含むデータ点列を生成する場合、前記Z_D階微分曲線は二階微分曲線であり、前記電極のうち、負極はグラファイトであることを特徴とする請求項2または3に記載の蓄電池診断装置。
- 前記基準データ提供部は、前記蓄電池の基準データ点列および前記蓄電池の正負の電極のうち少なくとも一方の電極の基準データ点列を提供し、
前記診断部は、前記一方の電極の電極パラメータと前記基準データ点列とに基づき、前記一方の電極の電極電位曲線を生成し、前記蓄電池の基準データ点列から減算することで、他方の電極の電極電位曲線を生成し、前記他方の電極電位曲線と前記他方の電極の基準データ点列との比較にして、該他方の電極の電極パラメータを求め、
前記診断部は、該他方の電極の基準データ点列が前記基準データ提供部から提供されない場合は、該蓄電池の基準データ点列と該電極の基準データ点列との差分に基づき、該他方の電極の基準データ点列を算出することを特徴とする請求項11または12に記載の蓄電池診断装置。 - 前記点群位置合わせ部は、ICPにより点群位置合わせを行なうことを特徴とする請求項1から13のいずれか1項に記載の蓄電池診断装置。
- 前記点群位置合わせ部は、ICPにより点群位置合わせを行ない、特徴点群内の特徴点の種類毎に別々に前記ICPによる点群対応付けを行なうことを特徴とする請求項4または5に記載の蓄電池診断装置。
- 前記ICPは、特徴点群に対する一次元ICPであることを特徴とする請求項14または15に記載の蓄電池診断装置。
- 前記点群位置合わせ部は、CPDにより点群位置合わせを行うことを特徴とする請求項1から13のいずれか1項に記載の蓄電池診断装置。
- 請求項1から17のいずれか1項に記載の蓄電池診断装置と、前記蓄電池診断装置の出力を表示する表示装置と、前記蓄電池診断装置の出力に基づいて前記蓄電池を制御する制御部と、を備えた蓄電池システム。
Priority Applications (4)
| Application Number | Priority Date | Filing Date | Title |
|---|---|---|---|
| DE112021007656.6T DE112021007656T5 (de) | 2021-05-13 | 2021-05-13 | Akkumulatorbatterie-diagnoseeinrichtung und akkumulatorbatterie-system |
| JP2023520685A JP7531699B2 (ja) | 2021-05-13 | 2021-05-13 | 蓄電池診断装置および蓄電池システム |
| US18/289,897 US20240288498A1 (en) | 2021-05-13 | 2021-05-13 | Storage battery diagnosis device and storage battery system |
| PCT/JP2021/018216 WO2022239188A1 (ja) | 2021-05-13 | 2021-05-13 | 蓄電池診断装置および蓄電池システム |
Applications Claiming Priority (1)
| Application Number | Priority Date | Filing Date | Title |
|---|---|---|---|
| PCT/JP2021/018216 WO2022239188A1 (ja) | 2021-05-13 | 2021-05-13 | 蓄電池診断装置および蓄電池システム |
Publications (1)
| Publication Number | Publication Date |
|---|---|
| WO2022239188A1 true WO2022239188A1 (ja) | 2022-11-17 |
Family
ID=84028026
Family Applications (1)
| Application Number | Title | Priority Date | Filing Date |
|---|---|---|---|
| PCT/JP2021/018216 Ceased WO2022239188A1 (ja) | 2021-05-13 | 2021-05-13 | 蓄電池診断装置および蓄電池システム |
Country Status (4)
| Country | Link |
|---|---|
| US (1) | US20240288498A1 (ja) |
| JP (1) | JP7531699B2 (ja) |
| DE (1) | DE112021007656T5 (ja) |
| WO (1) | WO2022239188A1 (ja) |
Cited By (6)
| Publication number | Priority date | Publication date | Assignee | Title |
|---|---|---|---|---|
| CN116500447A (zh) * | 2023-04-21 | 2023-07-28 | 国电南瑞南京控制系统有限公司 | 一种变电站蓄电池组运维方法及装置 |
| JP2023146374A (ja) * | 2022-03-29 | 2023-10-12 | 本田技研工業株式会社 | 抵抗算出装置、抵抗算出方法及びプログラム |
| CN118226313A (zh) * | 2024-05-16 | 2024-06-21 | 深圳戴普森新能源技术有限公司 | 一种基于数据分析的蓄电池剩余寿命评估方法及系统 |
| WO2025154207A1 (ja) * | 2024-01-17 | 2025-07-24 | 三菱電機株式会社 | 対象システムのパラメータを推定するための方法、プログラム、装置、およびシステム |
| WO2025165005A1 (ko) * | 2024-02-02 | 2025-08-07 | 주식회사 엘지에너지솔루션 | 배터리 진단 장치 및 그것의 동작 방법 |
| US12455325B1 (en) | 2024-01-04 | 2025-10-28 | Lg Energy Solution, Ltd. | Battery managing apparatus and method thereof |
Families Citing this family (3)
| Publication number | Priority date | Publication date | Assignee | Title |
|---|---|---|---|---|
| US12296714B2 (en) * | 2019-06-12 | 2025-05-13 | Mitsubishi Electric Corporation | Charge and discharge control device and charge and discharge control method including first, second, and third charge level ranges |
| KR20250097416A (ko) * | 2023-12-21 | 2025-06-30 | 삼성에스디아이 주식회사 | 배터리 진단 장치 및 방법, 컴퓨터 프로그램 |
| CN119644149B (zh) * | 2024-11-01 | 2025-11-14 | 温州大学大数据与信息技术研究院 | 一种面向随机使用数据的锂电池包络特征提取方法 |
Citations (6)
| Publication number | Priority date | Publication date | Assignee | Title |
|---|---|---|---|---|
| JP2012212513A (ja) * | 2011-03-30 | 2012-11-01 | Toyota Motor Corp | リチウム二次電池の状態検出方法 |
| JP2013247003A (ja) * | 2012-05-28 | 2013-12-09 | Sony Corp | 二次電池の充電制御装置、二次電池の充電制御方法、二次電池の充電状態推定装置、二次電池の充電状態推定方法、二次電池の劣化度推定装置、二次電池の劣化度推定方法、及び、二次電池装置 |
| US20150002162A1 (en) * | 2011-09-16 | 2015-01-01 | Blackberry Limited | Diagnostic use of physical and electrical battery parameters and storing relative condition data |
| WO2016203655A1 (ja) * | 2015-06-19 | 2016-12-22 | 株式会社日立製作所 | 蓄電池アレーの故障診断装置および故障診断方法 |
| JP2017129493A (ja) * | 2016-01-21 | 2017-07-27 | 横河電機株式会社 | 二次電池容量測定システム及び二次電池容量測定方法 |
| WO2019069435A1 (ja) * | 2017-10-05 | 2019-04-11 | 三菱電機株式会社 | 組電池の管理装置および組電池システム |
Family Cites Families (1)
| Publication number | Priority date | Publication date | Assignee | Title |
|---|---|---|---|---|
| JP4561859B2 (ja) | 2008-04-01 | 2010-10-13 | トヨタ自動車株式会社 | 二次電池システム |
-
2021
- 2021-05-13 US US18/289,897 patent/US20240288498A1/en active Pending
- 2021-05-13 WO PCT/JP2021/018216 patent/WO2022239188A1/ja not_active Ceased
- 2021-05-13 DE DE112021007656.6T patent/DE112021007656T5/de active Pending
- 2021-05-13 JP JP2023520685A patent/JP7531699B2/ja active Active
Patent Citations (6)
| Publication number | Priority date | Publication date | Assignee | Title |
|---|---|---|---|---|
| JP2012212513A (ja) * | 2011-03-30 | 2012-11-01 | Toyota Motor Corp | リチウム二次電池の状態検出方法 |
| US20150002162A1 (en) * | 2011-09-16 | 2015-01-01 | Blackberry Limited | Diagnostic use of physical and electrical battery parameters and storing relative condition data |
| JP2013247003A (ja) * | 2012-05-28 | 2013-12-09 | Sony Corp | 二次電池の充電制御装置、二次電池の充電制御方法、二次電池の充電状態推定装置、二次電池の充電状態推定方法、二次電池の劣化度推定装置、二次電池の劣化度推定方法、及び、二次電池装置 |
| WO2016203655A1 (ja) * | 2015-06-19 | 2016-12-22 | 株式会社日立製作所 | 蓄電池アレーの故障診断装置および故障診断方法 |
| JP2017129493A (ja) * | 2016-01-21 | 2017-07-27 | 横河電機株式会社 | 二次電池容量測定システム及び二次電池容量測定方法 |
| WO2019069435A1 (ja) * | 2017-10-05 | 2019-04-11 | 三菱電機株式会社 | 組電池の管理装置および組電池システム |
Cited By (8)
| Publication number | Priority date | Publication date | Assignee | Title |
|---|---|---|---|---|
| JP2023146374A (ja) * | 2022-03-29 | 2023-10-12 | 本田技研工業株式会社 | 抵抗算出装置、抵抗算出方法及びプログラム |
| JP7408711B2 (ja) | 2022-03-29 | 2024-01-05 | 本田技研工業株式会社 | 抵抗算出装置、抵抗算出方法及びプログラム |
| US12591018B2 (en) | 2022-03-29 | 2026-03-31 | Honda Motor Co., Ltd. | Resistance calculation device, resistance calculation method, and program |
| CN116500447A (zh) * | 2023-04-21 | 2023-07-28 | 国电南瑞南京控制系统有限公司 | 一种变电站蓄电池组运维方法及装置 |
| US12455325B1 (en) | 2024-01-04 | 2025-10-28 | Lg Energy Solution, Ltd. | Battery managing apparatus and method thereof |
| WO2025154207A1 (ja) * | 2024-01-17 | 2025-07-24 | 三菱電機株式会社 | 対象システムのパラメータを推定するための方法、プログラム、装置、およびシステム |
| WO2025165005A1 (ko) * | 2024-02-02 | 2025-08-07 | 주식회사 엘지에너지솔루션 | 배터리 진단 장치 및 그것의 동작 방법 |
| CN118226313A (zh) * | 2024-05-16 | 2024-06-21 | 深圳戴普森新能源技术有限公司 | 一种基于数据分析的蓄电池剩余寿命评估方法及系统 |
Also Published As
| Publication number | Publication date |
|---|---|
| DE112021007656T5 (de) | 2024-02-29 |
| JPWO2022239188A1 (ja) | 2022-11-17 |
| JP7531699B2 (ja) | 2024-08-09 |
| US20240288498A1 (en) | 2024-08-29 |
Similar Documents
| Publication | Publication Date | Title |
|---|---|---|
| WO2022239188A1 (ja) | 蓄電池診断装置および蓄電池システム | |
| Xuan et al. | Real-time estimation of state-of-charge in lithium-ion batteries using improved central difference transform method | |
| CN111954823B (zh) | 蓄电池诊断装置及蓄电池诊断方法以及蓄电池控制系统 | |
| US20230176130A1 (en) | Battery management apparatus and method | |
| CN111581904A (zh) | 考虑循环次数影响的锂电池soc及soh协同估算方法 | |
| JP6818947B1 (ja) | 蓄電池状態推定装置および蓄電池状態推定方法 | |
| CN105093114B (zh) | 一种电池在线建模与荷电状态的联合估计方法及系统 | |
| CN110068774A (zh) | 锂电池健康状态的估计方法、装置及存储介质 | |
| CN105203963B (zh) | 一种基于开路电压滞回特性的荷电状态的估计方法 | |
| CN116577686A (zh) | 一种基于局部阶段充电数据的多工况soh估计方法和系统 | |
| CN113761726A (zh) | 一种锂电池参数辨识方法及系统 | |
| JP6490882B1 (ja) | 蓄電池診断装置および蓄電池診断方法、並びに蓄電池制御システム | |
| Sandoval-Chileño et al. | Robust State of Charge estimation for Li-ion batteries based on Extended State Observers | |
| CN111781503A (zh) | 一种锂离子储能电池soc在线估算方法 | |
| CN114545262A (zh) | 一种针对损失数据的锂离子电池参数辨识及soc估计方法 | |
| CN117129898A (zh) | 基于阻抗谱数据和r-gpr的健康状态估计方法和系统 | |
| JP2020101399A (ja) | 電池容量の推定方法および電池容量の推定装置 | |
| CN108646199A (zh) | 一种动力电池soc估算方法和系统 | |
| CN109633470B (zh) | 基于ekf-gpr和日常片段数据的电池实时全充时间的估算方法 | |
| CN112379270B (zh) | 一种电动汽车动力电池荷电状态滚动时域估计方法 | |
| CN111914485B (zh) | 一种基于分数阶技术的自适应动力电池soc估计方法及系统 | |
| CN111413620A (zh) | 一种基于集员滤波的锂电池电荷状态估计方法 | |
| WO2025078168A1 (en) | Determining parameters of a model of a battery | |
| CN118100187A (zh) | 数据-物理混合驱动的交直流配电网拓扑识别方法 | |
| CN117148162A (zh) | 一种基于数据与模型融合的动力电池soc和soh估计方法 |
Legal Events
| Date | Code | Title | Description |
|---|---|---|---|
| 121 | Ep: the epo has been informed by wipo that ep was designated in this application |
Ref document number: 21941921 Country of ref document: EP Kind code of ref document: A1 |
|
| WWE | Wipo information: entry into national phase |
Ref document number: 2023520685 Country of ref document: JP |
|
| WWE | Wipo information: entry into national phase |
Ref document number: 18289897 Country of ref document: US |
|
| WWE | Wipo information: entry into national phase |
Ref document number: 112021007656 Country of ref document: DE |
|
| 122 | Ep: pct application non-entry in european phase |
Ref document number: 21941921 Country of ref document: EP Kind code of ref document: A1 |