WO2022224005A1 - 異常部品検出装置、異常部品検出方法、及び異常部品検出システム - Google Patents
異常部品検出装置、異常部品検出方法、及び異常部品検出システム Download PDFInfo
- Publication number
- WO2022224005A1 WO2022224005A1 PCT/IB2021/000302 IB2021000302W WO2022224005A1 WO 2022224005 A1 WO2022224005 A1 WO 2022224005A1 IB 2021000302 W IB2021000302 W IB 2021000302W WO 2022224005 A1 WO2022224005 A1 WO 2022224005A1
- Authority
- WO
- WIPO (PCT)
- Prior art keywords
- sound
- abnormal
- component
- sound data
- storage device
- Prior art date
- Legal status (The legal status is an assumption and is not a legal conclusion. Google has not performed a legal analysis and makes no representation as to the accuracy of the status listed.)
- Ceased
Links
Images





Classifications
-
- G—PHYSICS
- G01—MEASURING; TESTING
- G01H—MEASUREMENT OF MECHANICAL VIBRATIONS OR ULTRASONIC, SONIC OR INFRASONIC WAVES
- G01H3/00—Measuring characteristics of vibrations by using a detector in a fluid
-
- G—PHYSICS
- G01—MEASURING; TESTING
- G01M—TESTING STATIC OR DYNAMIC BALANCE OF MACHINES OR STRUCTURES; TESTING OF STRUCTURES OR APPARATUS, NOT OTHERWISE PROVIDED FOR
- G01M17/00—Testing of vehicles
-
- G—PHYSICS
- G01—MEASURING; TESTING
- G01M—TESTING STATIC OR DYNAMIC BALANCE OF MACHINES OR STRUCTURES; TESTING OF STRUCTURES OR APPARATUS, NOT OTHERWISE PROVIDED FOR
- G01M99/00—Subject matter not provided for in other groups of this subclass
Definitions
- the present invention relates to an abnormal component detection device, an abnormal component detection method, and an abnormal component detection system.
- Patent Document 1 Conventionally, there has been known an invention that detects sound and locates the sound source (Patent Document 1).
- the invention described in Patent Document 1 converts information about a sound source, including the position of the sound source, into visual information and displays it on a display.
- Patent Document 1 does not mention this.
- the present invention has been made in view of the above problems, and its object is to provide an abnormal component detection device, an abnormal component detection method, and an abnormal component detection capable of accurately specifying the position of a component that emits an abnormal sound. It is to provide a system.
- An abnormal component detection device acquires sound data emitted by a vehicle, identifies a component that generates sound based on the obtained sound data, and determines sound characteristics corresponding to the identified component. If the sound data is determined to be abnormal, information indicating that an abnormality has occurred is output.
- FIG. 1 is a schematic diagram of an abnormal component detection system according to a first embodiment of the present invention.
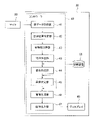
- FIG. 2 is a configuration example of the abnormal component detection device according to the first embodiment of the present invention.
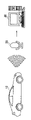
- FIG. 3 is a diagram for explaining an example of characteristics of sound data caused by the shape, size, material, etc. of an object.
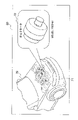
- FIG. 4 is an image showing the positions of the parts.
- FIG. 5 is a flow chart explaining an operation example of the abnormal component detection device according to the first embodiment of the present invention.
- FIG. 6 is a configuration example of an abnormal component detection device according to the second embodiment of the present invention.
- FIG. 7 is an image showing the positions of the parts.
- FIG. 8 is a flow chart illustrating an operation example of the abnormal component detection device according to the second embodiment of the present invention.
- the abnormal component detection system includes a vehicle 10 , a microphone 20 that acquires sounds emitted from the vehicle 10 , and a computer 30 . Sound emitted from the vehicle 10 by the microphone 20 is converted into an electric signal and treated as "sound data”. Sound data is output from the microphone 20 to the computer 30 as shown in FIG.
- the computer 30 is a terminal that processes sound data acquired from the microphone 20 .
- the computer 30 includes, for example, a CPU (controller 40), a memory (not shown), a storage device 50, and a display 60.
- the controller 40 reads various programs stored in the storage device 50 into memory and executes various instructions included in the programs.
- the storage device 50 is a storage medium such as SSD (Solid State Drive) and HDD (Hard Disk Drive).
- the controller 40 includes, as a plurality of information processing functions, a sound data acquisition unit 41, a sound source location identification unit 42, a sound characteristic acquisition unit 43, a component identification unit 44, an abnormality determination unit 45, an image generation unit 46, and an image output unit 47 .
- the installation location of the computer 30 is not particularly limited, but as an example, the computer 30 is installed in a repair shop.
- the sound data acquisition unit 41 acquires sound data from the microphone 20 .
- the sounds emitted from the vehicle 10 include sounds during inspection, sounds during test driving, sounds during normal driving, and the like. Inspections include horn inspections, brake inspections, lamp inspections, and the like.
- the sound source position specifying unit 42 uses the sound data acquired from the microphone 20 to specify the sound source position. If there are a plurality of microphones 20, the position of the sound source can be specified by a method called a so-called microphone array. As an example of the method, there is a method of specifying the sound source position from the difference in arrival times of a plurality of sound data. Various algorithms are well known and not limited to this method. Also, even if there is only one microphone 20, the position of the sound source can be specified. Therefore, the number of microphones 20 may be one or plural.
- the specified sound source position is given as three-dimensional coordinates. Here, the three-dimensional coordinates of the specified sound source are assumed to be (X0, Y0, Z0).
- the sound characteristic acquisition unit 43 analyzes the sound data acquired from the microphone 20 and acquires the characteristics of the sound data.
- Sound data characteristics include sound pressure (dB) and frequency (Hz).
- An example of the analysis technique is FFT (Fast Fourier Transform).
- the frequencies include the fundamental frequency and harmonics corresponding to the fundamental frequency.
- the fundamental frequency means the frequency of the lowest frequency component when the sound data converted into an electric signal is expressed by synthesizing sine waves.
- the definition of the fundamental frequency is not limited to this.
- the fundamental frequency may also be called a fundamental wave. Harmonics are high-order frequency components that are integral multiples of the fundamental frequency. Harmonics are sometimes called overtones.
- the characteristics of sound data differ depending on the shape, size, material, etc. of the object. FIG.
- the shape of the object includes rod-like, plate-like, and the like. Even if the shape is similar, the sound emitted by the part differs depending on the size and material (iron, aluminum, etc.).
- the part identification unit 44 identifies the part that emits the sound. An example of a method for identifying parts will be described. First, the component identification unit 44 acquires characteristics of sound data analyzed by the sound characteristics acquisition unit 43 . The characteristics of the acquired sound data are called “characteristics A”. Next, the component identification unit 44 refers to the storage device 50 to search for a component having a characteristic of sound data similar to "characteristic A”.
- the data stored in the storage device 50 will be explained here.
- the parts mounted on the vehicle and the characteristics of the sound data of the parts are stored in association with each other.
- the characteristics of the sound data are associated with each part.
- Such linking is performed in advance.
- each part is also associated with information indicating the position where it is arranged.
- the characteristics of the sound data and the position information are linked to the component, and the linked data is stored in the storage device 50 .
- the characteristics of the sound data include the fundamental frequency based on the shape, size and material of the parts, and the overtone characteristics of the fundamental frequency.
- the part identification unit 44 compares "characteristic A” and "characteristic A1". Also, the component identification unit 44 compares "characteristic A” and "characteristic A2".
- the object of comparison is location information. A root-mean-square error is used as a comparison of position information. Assuming that the error between the “characteristic A” and the “characteristic A1” is P1, the error P1 is expressed by Equation (1).
- the part identification unit 44 identifies the part with the higher degree of matching between the degrees of matching P2 and Q2 as the part that emitted the sound. If P2>Q2, the part that made the sound is specified as "part A1". If P2 ⁇ Q2, the part that made the sound is specified as "Part A2". Note that when three or more characteristics similar to “characteristic A” are retrieved instead of two, the part with the highest degree of matching is specified as the part that emitted the sound. As another identification method, it is possible to identify the sound source position using the sound data acquired from the microphone 20 as described above. You may identify the parts that
- the abnormality determination unit 45 determines whether the sound data of the component identified by the component identification unit 44 is abnormal.
- "Abnormal” means not normal.
- "Abnormality” is a concept that includes not only failures that prevent parts from performing their original functions, but also defects that do not lead to failures and signs of failures.
- An example of an abnormality determination method will be described. Here, it is assumed that P2>Q2 and that the component that emitted the sound is identified as “component A1".
- the characteristic of the sound data acquired from the microphone 20 is “characteristic A”
- the characteristic of the "component A1" stored in the storage device 50 is “characteristic A1". This "characteristic A1" indicates the characteristic of the sound data when the "component A1" is normal.
- the abnormality determination unit 45 compares "characteristic A” and "characteristic A1" and calculates the similarity as a numerical value. If the calculated numerical value is equal to or less than the threshold value (if the similarity is small), the sound data of "part A1" is determined to be abnormal. On the other hand, if the calculated similarity is greater than the threshold (if the similarity is large), it is determined that the sound data of "part A1" is normal. Cluster analysis, for example, is used to calculate the degree of similarity. Note that the abnormality determination method is not limited to one using the degree of similarity. There is also a method of evaluating the degree of similarity between two data based on the closeness of the distance.
- the abnormality determination unit 45 determines whether or not the sound data of the component is abnormal using the characteristics of the sound data.
- the abnormality determination unit 45 outputs a signal indicating that the sound data of “component A” is abnormal to the image generation unit 46 .
- the image generation unit 46 generates an image showing the position of "part A” when the abnormality determination unit 45 determines that the sound data of "part A” is abnormal.
- An example of an image generated by the image generator 46 is shown in FIG.
- Reference numeral 80 shown in FIG. 4 denotes an image generated by the image generation unit 46 .
- image 80 it will be called image 80 .
- "part A” indicates an alternator.
- Reference numeral 70 is an image imitating the vehicle body.
- Reference numeral 71 is an image that simulates the arrangement structure of many parts mounted on the vehicle. If the arrangement structure is designed by three-dimensional CAD, the reference numeral 71 may be a CAD drawing. Here, reference numeral 71 is explained as a CAD drawing. As shown in FIG.
- an image 72 showing an alternator is drawn from a CAD drawing 71 and enlarged.
- an image 70 simulating a vehicle body is subjected to transparency processing, so that a user (for example, a repair person) can see a CAD drawing 71 .
- the image 72 showing the alternator is pulled out from the CAD drawing 71 and enlarged, the user can grasp at a glance the part in which the abnormality has occurred (the alternator in this case) and the position of the part. .
- the image generator 46 may add sound pressure information and frequency information to the image 72 showing the alternator.
- the sound pressure is 86 (dB) and the fundamental frequency is 150 (Hz).
- the image generator 46 may display the presence or absence of overtones in FIG. 4 as well.
- the storage device 50 stores an image 70 simulating a vehicle body, a CAD drawing 71, and an image 72 showing an alternator.
- the image generator 46 refers to the storage device 50 to generate the image 80 shown in FIG. Of course, the storage device 50 stores not only the alternator but also images showing other parts.
- the image generation section 46 outputs the generated image 80 to the image output section 47 .
- the image 70 simulating the vehicle body is subjected to transparency processing
- portions other than the CAD drawing 71 do not have to be transparentized.
- Information necessary for the user is the component in which the abnormality has occurred and its position. If these two pieces of information can be grasped, the other information can be said to be unnecessary information. Therefore, the transparency processing may be applied only to the location of the CAD drawing 71 . This eliminates giving the user unnecessary information.
- the image output unit 47 outputs the image 80 generated by the image generation unit 46 to the display 60 .
- the user can grasp at a glance the part in which the abnormality has occurred and the position of the part.
- the sound data acquisition unit 41 acquires sound data from the microphone 20 in step S101.
- the sound data acquisition unit 41 outputs the acquired sound data to the sound source position specifying unit 42 and the sound characteristic acquisition unit 43 .
- the process proceeds to step S ⁇ b>103 , and the sound source position specifying unit 42 specifies the sound source position using the sound data acquired from the sound data acquiring unit 41 .
- the sound source position specifying unit 42 outputs the specified sound source position information to the component specifying unit 44 .
- the process proceeds to step S105, and the sound characteristic acquisition unit 43 analyzes the sound data acquired from the sound data acquisition unit 41 and acquires the characteristics of the sound data.
- the sound characteristic acquisition section 43 outputs the characteristic of the sound data to the component identification section 44 .
- step S107 the part specifying unit 44 determines based on the sound source position information acquired from the sound source position specifying unit 42, the characteristics of the sound data acquired from the sound characteristic acquiring unit 43, and the data stored in the storage device 50. , to identify the part that emitted the sound.
- the component identification unit 44 outputs information (name, position) related to the identified component to the abnormality determination unit 45 .
- step S109 the abnormality determination unit 45 determines whether the sound data of the component identified by the component identification unit 44 is abnormal. If the sound data of the component is abnormal (YES in step S109), the process proceeds to step S111. On the other hand, if the component is normal (NO in step S109), the series of processing ends.
- step S111 the image generator 46 generates an image 80 (see FIG. 4) indicating the position of the component determined to be abnormal.
- the image generation section 46 outputs the generated image 80 to the image output section 47 .
- step S ⁇ b>113 the image output unit 47 outputs the image 80 generated by the image generation unit 46 to the display 60 .
- the abnormal part detection device includes a storage device 50 and a controller 40 that store the installation positions of the parts mounted on the vehicle 10 and the sound characteristics of the parts in association with each other.
- the controller 40 acquires sound data emitted by the vehicle 10 .
- the controller 40 identifies the sound source position where the sound related to the acquired sound data is generated.
- the controller 40 identifies the component that generates the sound based on the identified sound source position and the installation position stored in the storage device 50 .
- the controller 40 determines whether the sound data is abnormal based on the sound characteristics corresponding to the identified parts. When the controller 40 determines that the sound data is abnormal, it outputs information indicating that an abnormality has occurred.
- the information indicating that an abnormality has occurred is information indicating the part in which an abnormality has occurred (the name of the part and the image of the part) and the position of the part, as described with reference to the image 80 .
- the display 60 is taken up as an output destination of the image 80, it is not limited to this.
- Information indicating that an abnormality has occurred may be output via a speaker, or may be output by lighting a lamp. According to the abnormal part detection device, even if a large number of parts are densely mounted on the vehicle 10, it is possible to precisely identify the position of the part that emits the abnormal sound.
- the sound characteristics of the parts stored in the storage device 50 are the characteristics when the parts are normal.
- the controller 40 compares the sound characteristics of the component stored in the storage device 50 with the sound characteristics of the acquired sound data, and determines whether the sound data is abnormal according to the degree of matching based on the comparison result. This makes it possible to accurately identify the position of the component that emits the abnormal sound.
- the sound characteristics of the parts stored in the storage device 50 include the fundamental frequency based on the shape, size, and material of the part, and the overtone characteristics of the fundamental frequency. This makes it possible to accurately identify the position of the component that emits the abnormal sound.
- the abnormal component detection device further includes a display device (display 60).
- a display device display 60.
- the controller 40 determines that the sound data is abnormal, the controller 40 stores the part that emitted the sound (the name of the part and the image of the part) related to the sound data and the information indicating the installation position of the part stored in the storage device 50. Output to a display device. As a result, the user can grasp at a glance the part in which an abnormality has occurred and the position of the part (see FIG. 4).
- the part with the higher degree of matching is identified as the part that emitted the sound.
- the degree of matching does not necessarily differ.
- the part that emitted the sound is "part A1" or "part A2”, and the part cannot be specified because there is no difference in the degree of matching.
- the probability calculation unit 48 calculates the probability of whether the part that made the sound is "part A1" or "part A2". An example of the probability calculation method will be described.
- the probability calculation unit 48 calculates the probability based on past identification results.
- the "past identification result” is the result of identifying a part that has emitted a sound so far.
- the “past identification result” is stored in the storage device 50 .
- the probability calculation unit 48 creates a learning model by linking the past positional coordinates, frequency, sound pressure, and each piece of information (shape, size, material) about the part with the name of the part that generated the sound at that time. Generate a machine learning model using the learning model. For example, Naive Bayes is used as a machine learning algorithm. However, it is not limited to this, and any algorithm may be used as long as it is capable of supervised learning.
- the probability calculation unit 48 inputs information such as position coordinates, sound pressure, frequency, etc., and information such as shape, dimensions, material, etc. when multiple parts with similar degrees of matching are extracted into the generated machine learning model. and calculate the probability.
- the probability calculation unit 48 outputs the calculated probability to the component identification unit 44 .
- the component identification unit 44 identifies the component with the highest calculated probability as the component that emitted the sound.
- the image generation unit 46 may add the probability calculated by the probability calculation unit 48 to the image 80.
- the calculated probability (95%) is indicated at 73 .
- the image generator 46 may also add a graph of the fundamental frequency and the overtone frequency to the image 80, as indicated by reference numeral 74 in FIG. A graph that visualizes sound information such as a spectrogram may be added instead of the frequency graph.
- steps S201-205 and 211-215 is the same as the processing of steps S101-105 and 109-113 shown in FIG.
- step S207 the probability calculation unit 48 calculates the probability of whether the part that emitted the sound is "part A1" or "part A2".
- the probability calculation unit 48 outputs the calculated probability to the component identification unit 44 .
- the process proceeds to step S209, and the component identification unit 44 identifies the component with the highest calculated probability as the component that emitted the sound.
- the abnormal component detection device calculates probabilities based on machine learning models. As a result, even if there is no difference in the degree of matching, it is possible to accurately identify the position of the component that emits the abnormal sound.
- Processing circuitry includes programmed processing devices, such as processing devices that include electrical circuitry. Processing circuitry also includes devices such as application specific integrated circuits (ASICs) and circuit components arranged to perform the described functions.
- ASICs application specific integrated circuits
- the computer 30 was explained as being different from the vehicle 10, but it is not limited to this.
- the functions of the computer 30 may be installed in the vehicle 10.
- the microphone 20 may or may not be mounted on the vehicle 10 . If the vehicle 10 is not equipped with the microphone 20 , the vehicle 10 only needs to have a receiver for receiving sound data transmitted from the microphone 20 . That is, the vehicle 10 can also function as an abnormal part detection device.
- the display 60 is a display of a navigation device, a meter display, a HUD (Head-Up Display), or the like.
- the normal sound of the component stored in the storage device 50 is compared with the acquired sound data, and it is determined whether or not the acquired sound data is abnormal.
- the characteristic of the sound data of the part stored in the storage device 50 may be the characteristic of the sound data when the part is abnormal. That is, abnormal sounds may be compared. As a result of the comparison, if the degree of matching is greater than the threshold, the sound data is determined to be abnormal, and if the degree of matching is equal to or less than the threshold, the sound data is determined to be normal.
- the abnormal component detection system also includes a vehicle 10, a sound collector (microphone 20), a storage device 50 and a controller 40 that associate and store installation positions of components mounted on the vehicle 10 and component sound characteristics.
- a faulty component detector (computer 30) may also be included.
- Vehicle 20 Microphone 30 Computer 40 Controller 41 Sound Data Acquisition Unit 42 Sound Source Position Identification Unit 43 Sound Characteristic Acquisition Unit 44 Part Identification Unit 45 Abnormality Judgment Unit 46 Image Generation Unit 47 Image Output Unit 48 Probability Calculation Unit 50 Storage Device 60 Display
Landscapes
- Physics & Mathematics (AREA)
- General Physics & Mathematics (AREA)
- Measurement Of Mechanical Vibrations Or Ultrasonic Waves (AREA)
- Testing Of Devices, Machine Parts, Or Other Structures Thereof (AREA)
Abstract
異常部品検出装置は、車両(10)が発する音データを取得する音データ取得部(41)と、音データに基づいて音を発生する部品を特定する部品特定部(44)と、部品に対応する音特性に基づいて音データが異常か否かを判定する異常判定部(45)と、音データが異常であると判定された場合、異常が発生したことを示す情報を出力する画像出力部(47)とを備える。
Description
本発明は、異常部品検出装置、異常部品検出方法、及び異常部品検出システムに関する。
従来より、音を検知して音源の位置を突き止める発明が知られている(特許文献1)。特許文献1に記載された発明は、音源の位置を含む音源に関する情報を可視情報に変換し、ディスプレイに表示する。
車両には多数の部品が緻密に搭載されている。部品から異常音が発せられている場合、その部品の位置は精度よく特定されることが求められるが、特許文献1にはその旨の記載はない。
本発明は、上記問題に鑑みて成されたものであり、その目的は、異常音を発する部品の位置を精度よく特定することが可能な異常部品検出装置、異常部品検出方法、及び異常部品検出システムを提供することである。
本発明の一態様に係る異常部品検出装置は、車両が発する音データを取得し、取得された音データに基づいて音を発生する部品を特定し、特定された部品に対応する音特性に基づいて音データが異常か否かを判定し、音データが異常であると判定された場合、異常が発生したことを示す情報を出力する。
本発明によれば、異常音を発する部品の位置を精度よく特定することが可能となる。
以下、本発明の実施形態について、図面を参照して説明する。図面の記載において同一部分には同一符号を付して説明を省略する。
(第1実施形態)
図1~2を参照して、第1実施形態に係る異常部品検出システムの構成例を説明する。図1に示すように、異常部品検出システムは、車両10と、車両10から発せられる音を取得するマイク20と、コンピュータ30とから構成される。マイク20によって車両10から発せられる音は電気信号に変換され、「音データ」として扱われる。図1に示すように音データはマイク20からコンピュータ30に出力される。
図1~2を参照して、第1実施形態に係る異常部品検出システムの構成例を説明する。図1に示すように、異常部品検出システムは、車両10と、車両10から発せられる音を取得するマイク20と、コンピュータ30とから構成される。マイク20によって車両10から発せられる音は電気信号に変換され、「音データ」として扱われる。図1に示すように音データはマイク20からコンピュータ30に出力される。
コンピュータ30の詳細を図2を参照して説明する。コンピュータ30はマイク20から取得した音データを処理する端末である。コンピュータ30は、一例として、CPU(コントローラ40)と、メモリ(不図示)と、記憶装置50と、ディスプレイ60と、を備える。コントローラ40は、記憶装置50に記憶されている様々なプログラムをメモリに読み込んで、プログラムに含まれる各種の命令を実行する。記憶装置50は、SSD(Solid State Drive)、HDD(Hard Disk Drive)などの記憶媒体である。コントローラ40は、複数の情報処理機能として、音データ取得部41と、音源位置特定部42と、音特性取得部43と、部品特定部44と、異常判定部45と、画像生成部46と、画像出力部47とを備える。コンピュータ30の設置場所は特に限定されないが、一例としてコンピュータ30は修理工場に設置される。
音データ取得部41はマイク20から音データを取得する。車両10から発せられる音には、検査時の音、テスト走行時の音、通常走行時の音などが含まれる。検査にはホーン検査、ブレーキ検査、ランプ検査などが含まれる。
音源位置特定部42はマイク20から取得した音データを用いて音源位置を特定する。マイク20が複数あれば、いわゆるマイクアレイと呼ばれる方法で音源位置の特定が可能となる。方法の一例として、複数の音データの到達時間の差異から音源位置を特定する方法が挙げられる。この方法に限定されず、様々なアルゴリズムが周知である。また、マイク20が1つのみであっても音源位置の特定は可能である。したがってマイク20の数は1つであっても複数であっても構わない。特定された音源位置は、3次元座標として与えられる。ここでは特定された音源の3次元座標は(X0,Y0,Z0)とする。
音特性取得部43はマイク20から取得した音データを解析して音データの特性を取得する。音データの特性には音圧(dB)、周波数(Hz)が含まれる。解析手法の一例としてFFT(Fast Fourier Transform)が挙げられる。周波数には基本周波数及び基本周波数に対応する高調波が含まれる。基本周波数とは、電気信号に変換された音データを正弦波の合成で表したときの最も低い周波数成分の周波数を意味する。ただし基本周波数の定義はこれに限定されない。なお基本周波数は基本波と呼ばれる場合もある。高調波とは、基本周波数を基準とした整数倍の高次の周波数成分のことである。高調波は、倍音と呼ばれることもある。音データの特性は、物体の形状、寸法、材質などにより異なる。物体の形状、寸法、材質などに起因する音データの特性の一例を図3に示す。物体の形状には棒状、板状などが含まれる。類似する形状であっても、寸法、材質(鉄、アルミニウムなど)によって、その部品が発する音は異なる。
部品特定部44は、音を発している部品を特定する。部品特定方法の一例を説明する。まず、部品特定部44は、音特性取得部43によって解析された音データの特性を取得する。取得された音データの特性を「特性A」と呼ぶ。次に部品特定部44は、記憶装置50を参照して、「特性A」に類似する音データの特性を有する部品を検索する。
ここで記憶装置50に記憶されているデータについて説明する。記憶装置50には、車両に搭載される部品と、その部品の音データの特性が紐付けられて記憶されている。つまり部品ごとに音データの特性が紐付けられている。このような紐付けは予め実施されている。また、それぞれの部品には配置された位置を示す情報も合わせて紐付けられている。つまり、部品には音データの特性と位置情報とが紐付けられており、紐付けられたデータが記憶装置50に記憶されている。また音データの特性には部品の形状、寸法、材質に基づく基本周波数、及び基本周波数の倍音特性が含まれる。
部品特定部44が記憶装置50を参照した結果、「特性A」に類似する特性が2つ、検出されたとする。「特性A」に類似する2つの特性を「特性A1」、「特性A2」と呼ぶ。「特性A1」に紐付けられている部品を「部品A1」、「特性A2」に紐付けられている部品を「部品A2」とする。「部品A1」に紐付けられている位置情報を「X1,Y1,Z1」とする。「部品A2」に紐付けられている位置情報を「X2,Y2,Z2」とする。
部品特定部44は「特性A」と「特性A1」とを比較する。また部品特定部44は「特性A」と「特性A2」とを比較する。比較対象は位置情報である。位置情報の比較として、二乗平均誤差が用いられる。「特性A」と「特性A1」との誤差をP1とした場合、誤差P1は式1で表現される。

「特性A」と「特性A1」との一致度をP2とした場合、一致度P2は式2で表現される。

同様に「特性A」と「特性A2」との誤差をQ1とした場合、誤差Q1は式3で表現される。

「特性A」と「特性A2」との一致度をQ2とした場合、一致度Q2は式4で表現される。

部品特定部44は、一致度P2,Q2のうち、一致度が高い方を音を発した部品として特定する。P2>Q2であれば、音を発した部品は「部品A1」として特定される。P2<Q2であれば、音を発した部品は「部品A2」として特定される。なお、「特性A」に類似する特性が2つではなく3つ以上検索された場合、最も一致度が高い部品が音を発した部品として特定される。他の特定方法として、上述したようにマイク20から取得した音データを用いて音源位置を特定することは可能であるから、部品特定部44はマイク20から取得した音データを用いて音を発した部品を特定してもよい。
異常判定部45は、部品特定部44によって特定された部品の音データが異常か否かを判定する。「異常」とは正常ではないことを意味する。「異常」とは部品が本来備える機能を発揮できなくなる故障のみならず、故障には至らない不具合及び故障の前兆を含む概念である。異常判定方法の一例を説明する。ここではP2>Q2であり、音を発した部品は「部品A1」として特定されたものとする。マイク20から取得された音データの特性は「特性A」であり、記憶装置50に記憶されている「部品A1」の特性は「特性A1」である。この「特性A1」は、「部品A1」が正常であるときの音データの特性を示す。
異常判定部45は、「特性A」と「特性A1」とを比較し、類似度を数値として算出する。算出された数値が閾値以下であれば(類似度が小さければ)、「部品A1」の音データは異常と判定される。一方、算出された類似度が閾値より大きければ(類似度が大きければ)、「部品A1」の音データは正常と判定される。類似度の算出には例えばクラスタ分析が用いられる。なお異常判定方法は類似度を用いるものに限定されない。2つのデータが似ている度合いを距離の近さで評価する方法もある。
このように異常判定部45は音データの特性を用いて部品の音データが異常か否かを判定する。異常判定部45は「部品A」の音データが異常であることを示す信号を画像生成部46に出力する。
画像生成部46は、異常判定部45によって「部品A」の音データは異常であると判定されたとき、「部品A」の位置を示す画像を生成する。画像生成部46によって生成された画像の一例を図4に示す。図4に示す符号80は、画像生成部46によって生成された画像である。以下、画像80と呼ぶ。図4において「部品A」はオルタネータを示す。符号70は車体を模した画像である。符号71は車両に搭載される多数の部品の配置構造を模した画像である。配置構造が3次元CADで設計される場合、符号71はCAD図面でもよい。ここでは符号71はCAD図面として説明する。図4に示すように、CAD図面71からオルタネータを示す画像72が引き出されて拡大されている。図4に示すように車体を模した画像70には透明化処理が施されており、ユーザ(例えば修理を行う者)はCAD図面71を目視できる。さらにCAD図面71からオルタネータを示す画像72が引き出されて拡大されているため、ユーザは異常が発生している部品(ここではオルタネータ)、及びその部品の位置を一目で把握することが可能となる。なお、画像生成部46はオルタネータを示す画像72に音圧情報、周波数情報を加えてもよい。図4に示す例では音圧は86(dB)であり、基本周波数は150(Hz)である。なお後述する図7のように、図4においても画像生成部46は倍音の有無を表示してもよい。
記憶装置50には、車体を模した画像70、CAD図面71、及びオルタネータを示す画像72が記憶されている。画像生成部46は記憶装置50を参照して、図4に示す画像80を生成する。もちろん記憶装置50にはオルタネータだけでなく、他の部品を示す画像も記憶されている。画像生成部46は生成した画像80を画像出力部47に出力する。
車体を模した画像70には透明化処理が施されていると説明したが、画像70のすべてに透明化処理が施されている必要はない。例えば、CAD図面71以外の部分では透明化処理は施されていなくてもよい。ユーザにとって必要な情報は、異常が発生している部品と、その位置である。この2つの情報が把握できるのであれば、その他の情報は不要な情報といえる。よって、透明化処理はCAD図面71の場所にだけ施されてもよい。これによりユーザに余計な情報を与えることがなくなる。
画像出力部47は、画像生成部46によって生成された画像80をディスプレイ60に出力する。ユーザはディスプレイ60に表示された画像80を見ることにより、異常が発生している部品、及びその部品の位置を一目で把握することが可能となる。
次に、図5のフローチャートを参照して、第1実施形態に係る異常部品検出装置(コンピュータ30)の一動作例を説明する。
ステップS101において音データ取得部41はマイク20から音データを取得する。音データ取得部41は取得した音データを音源位置特定部42、及び音特性取得部43に出力する。処理はステップS103に進み、音源位置特定部42は音データ取得部41から取得した音データを用いて音源位置を特定する。音源位置特定部42は特定した音源位置情報を部品特定部44に出力する。処理はステップS105に進み、音特性取得部43は音データ取得部41から取得した音データを解析して音データの特性を取得する。音特性取得部43は音データの特性を部品特定部44に出力する。処理はステップS107に進み、部品特定部44は音源位置特定部42から取得した音源位置情報、音特性取得部43から取得した音データの特性、及び記憶装置50に記憶されているデータに基づいて、音を発した部品を特定する。部品特定部44は特定した部品に係る情報(名称、位置)を異常判定部45に出力する。
処理はステップS109に進み、異常判定部45は部品特定部44によって特定された部品の音データが異常か否かを判定する。部品の音データが異常である場合(ステップS109でYES)、処理はステップS111に進む。一方、部品が正常である場合(ステップS109でNO)、一連の処理は終了する。ステップS111において画像生成部46は異常と判定された部品の位置を示す画像80(図4参照)を生成する。画像生成部46は生成した画像80を画像出力部47に出力する。処理はステップS113に進み、画像出力部47は画像生成部46によって生成された画像80をディスプレイ60に出力する。
(作用効果)
以上説明したように、第1実施形態に係る異常部品検出装置によれば、以下の作用効果が得られる。
以上説明したように、第1実施形態に係る異常部品検出装置によれば、以下の作用効果が得られる。
異常部品検出装置は、車両10に搭載される部品の設置位置と部品の音特性とを関連づけて記憶する記憶装置50とコントローラ40とを備える。コントローラ40は車両10が発する音データを取得する。コントローラ40は取得された音データに関する音が発生している音源位置を特定する。コントローラ40は特定された音源位置と、記憶装置50に記憶された設置位置とに基づいて音を発生する部品を特定する。コントローラ40は特定された部品に対応する音特性に基づいて音データが異常か否かを判定する。コントローラ40は音データが異常であると判定された場合、異常が発生したことを示す情報を出力する。異常が発生したことを示す情報とは、画像80で説明したように異常が発生している部品(部品の名称及び部品の画像)、及びその部品の位置を示す情報である。画像80の出力先としてディスプレイ60を取り上げたがこれに限定されない。異常が発生したことを示す情報は、スピーカを介して出力されてもよく、ランプの点灯により出力されてもよい。異常部品検出装置によれば、車両10に多数の部品が緻密に搭載されていても、異常音を発する部品の位置を精度よく特定することが可能となる。
また、記憶装置50に記憶された部品の音特性は、部品が正常であるときの特性である。コントローラ40は、記憶装置50に記憶された部品の音特性と、取得された音データの音特性とを比較し、比較結果に基づく一致度に応じて音データが異常か否かを判定する。これにより異常音を発する部品の位置を精度よく特定することが可能となる。
また、記憶装置50に記憶された部品の音特性には、部品の形状、寸法、材質に基づく基本周波数、及び基本周波数の倍音特性が含まれる。これにより異常音を発する部品の位置を精度よく特定することが可能となる。
異常部品検出装置は、表示装置(ディスプレイ60)をさらに備える。コントローラ40は、音データが異常であると判定された場合、音データに関する音を発した部品(部品の名称及び部品の画像)、及び記憶装置50に記憶された部品の設置位置を示す情報を表示装置に出力する。これによりユーザは異常が発生している部品、及びその部品の位置を一目で把握することが可能となる(図4参照)。
(第2実施形態)
次に図6~8を参照して第2実施形態に係る異常部品検出システムについて説明する。第2実施形態が第1実施形態と異なるのは、図6に示すようにコンピュータ30が確率算出部48を備えることである。第1実施形態と重複する構成については符号を引用してその説明は省略する。以下、相違点を中心に説明する。
次に図6~8を参照して第2実施形態に係る異常部品検出システムについて説明する。第2実施形態が第1実施形態と異なるのは、図6に示すようにコンピュータ30が確率算出部48を備えることである。第1実施形態と重複する構成については符号を引用してその説明は省略する。以下、相違点を中心に説明する。
第1実施形態では、一致度が高い方を音を発した部品として特定する、と説明した。しかしながら、必ずしも一致度に差が見られないケースもありうる。第1実施形態の例でいえば、音を発した部品が「部品A1」なのか「部品A2」なのか、一致度に差が見られないため部品を特定できない、といったケースがありうる。
そこで、確率算出部48は音を発した部品が「部品A1」なのか「部品A2」なのか、その確率を算出する。確率算出方法の一例を説明する。確率算出部48は過去の特定結果に基づいて確率を算出する。「過去の特定結果」とは、今までに音を発した部品を特定した結果である。「過去の特定結果」は記憶装置50に記憶されている。確率算出部48は、過去の位置座標、周波数、音圧、部品に関する各情報(形状、寸法、材質)に、その時に音を発生した部品の名称を紐付けて学習モデルを作成し、作成した学習モデルを用いて機械学習モデルを生成する。機械学習アルゴリズムとして、例えばナイーブベイズが用いられる。ただし、これに限定されず、教師あり学習が可能なアルゴリズムであればどのようなものを用いてもよい。
確率算出部48は、生成された機械学習モデルに、同じような一致度の部品が複数抽出されたときの位置座標、音圧、周波数などの情報、及び形状、寸法、材質などの情報を入力し、確率を算出する。確率算出部48は、算出された確率を部品特定部44に出力する。部品特定部44は算出された確率が最も高い部品を音を発した部品として特定する。
図7に示すように、画像生成部46は確率算出部48によって算出された確率を画像80に追加してもよい。算出された確率(95%)は符号73で示される。また、図7の符号74で示すように、画像生成部46は基本周波数、倍音周波数のグラフを画像80に追加してもよい。なお周波数グラフではなく、スペクトログラムのような音情報を可視化したグラフが追加されてもよい。
次に、図8のフローチャートを参照して、第2実施形態に係る異常部品検出装置(コンピュータ30)の一動作例を説明する。ただし、ステップS201~205、211~215の処理は、図5に示すステップS101~105、109~113の処理と同様であるため、説明を省略する。
ステップS207において、確率算出部48は音を発した部品が「部品A1」なのか「部品A2」なのか、その確率を算出する。確率算出部48は算出された確率を部品特定部44に出力する。処理はステップS209に進み、部品特定部44は算出された確率が最も高い部品を音を発した部品として特定する。
(作用効果)
このように第2実施形態に係る異常部品検出装置は、機械学習モデルに基づく確率を算出する。これにより一致度に差が見られない場合であっても異常音を発する部品の位置を精度よく特定することが可能となる。
このように第2実施形態に係る異常部品検出装置は、機械学習モデルに基づく確率を算出する。これにより一致度に差が見られない場合であっても異常音を発する部品の位置を精度よく特定することが可能となる。
上述の実施形態に記載される各機能は、1または複数の処理回路により実装され得る。処理回路は、電気回路を含む処理装置等のプログラムされた処理装置を含む。処理回路は、また、記載された機能を実行するようにアレンジされた特定用途向け集積回路(ASIC)や回路部品等の装置を含む。
上記のように、本発明の実施形態を記載したが、この開示の一部をなす論述及び図面はこの発明を限定するものであると理解すべきではない。この開示から当業者には様々な代替実施の形態、実施例及び運用技術が明らかとなろう。
上述の実施形態ではコンピュータ30は、車両10とは異なるものとして説明したが、これに限定されない。例えばコンピュータ30の機能(例えば符号41~47で示される機能)は車両10に搭載されてもよい。マイク20は車両10に搭載されてもよく、搭載されていなくてもよい。車両10にマイク20が搭載されていない場合、車両10はマイク20から送信される音データを受信する受信機を有していれば足りる。つまり車両10は異常部品検出装置として機能することも可能である。車両10が異常部品検出装置として機能する場合、ディスプレイ60はナビゲーション装置のディスプレイ、メータディスプレイ、HUD(Head−Up Display)などである。
上述の実施形態では、記憶装置50に記憶されている部品の正常音と、取得された音データとを比較し、取得された音データが異常か否かを判定すると説明した。ただし異常判定方法はこれに限定されない。記憶装置50に記憶されている部品の音データの特性は、部品が異常であるときの音データの特性であってもよい。つまり異常音同士が比較されてもよい。比較の結果、一致度が閾値より大きければ音データは異常と判定され、一致度が閾値以下であれば音データは正常と判定される。
また、異常部品検出システムは、車両10と、集音器(マイク20)と、車両10に搭載される部品の設置位置と部品の音特性とを関連づけて記憶する記憶装置50及びコントローラ40を備える異常部品検出装置(コンピュータ30)を含んでもよい。
10 車両
20 マイク
30 コンピュータ
40 コントローラ
41 音データ取得部
42 音源位置特定部
43 音特性取得部
44 部品特定部
45 異常判定部
46 画像生成部
47 画像出力部
48 確率算出部
50 記憶装置
60 ディスプレイ
20 マイク
30 コンピュータ
40 コントローラ
41 音データ取得部
42 音源位置特定部
43 音特性取得部
44 部品特定部
45 異常判定部
46 画像生成部
47 画像出力部
48 確率算出部
50 記憶装置
60 ディスプレイ
Claims (8)
- 車両に搭載される部品の設置位置と前記部品の音特性とを関連づけて記憶する記憶装置と、
コントローラとを備え、
前記コントローラは、
前記車両が発する音データを取得し、
取得された前記音データに基づいて音を発生する部品を特定し、
特定された前記部品に対応する音特性に基づいて前記音データが異常か否かを判定し、
前記音データが異常であると判定された場合、異常が発生したことを示す情報を出力する
ことを特徴とする異常部品検出装置。 - 前記コントローラは、
取得された前記音データに関する音が発生している音源位置を特定し、
特定された前記音源位置と、前記記憶装置に記憶された前記設置位置とに基づいて、前記音を発生する部品を特定する
ことを特徴とする請求項1に記載の異常部品検出装置。 - 前記記憶装置に記憶された前記部品の音特性は、前記部品が正常であるときの特性であり、
前記コントローラは、前記記憶装置に記憶された前記部品の音特性と、取得された前記音データの音特性とを比較し、比較結果に基づく一致度に応じて前記音データが異常か否かを判定する
ことを特徴とする請求項1または2に記載の異常部品検出装置。 - 前記記憶装置に記憶された前記部品の音特性には、前記部品の形状、寸法、材質に基づく基本周波数、及び前記基本周波数の倍音特性が含まれる
ことを特徴とする請求項1~3のいずれか1項に記載の異常部品検出装置。 - 表示装置をさらに備え、
前記コントローラは、前記音データが異常であると判定された場合、前記音データに関する音を発した部品、及び前記記憶装置に記憶された前記部品の設置位置を示す情報を前記表示装置に出力する
ことを特徴とする請求項1~4のいずれか1項に記載の異常部品検出装置。 - 前記記憶装置に記憶された前記部品の音特性は、前記部品が異常であるときの特性であり、
前記コントローラは、前記記憶装置に記憶された前記部品の音特性と、取得された前記音データの音特性とを比較し、比較結果に基づく一致度に応じて前記音データが異常か否かを判定する
ことを特徴とする請求項1に記載の異常部品検出装置。 - 車両に搭載される部品の設置位置と前記部品の音特性とを関連づけて記憶する記憶装置と、コントローラとを備える異常部品検出装置の異常部品検出方法であって、
前記コントローラは、
前記車両が発する音データを取得し、
取得された前記音データに基づいて音を発生する部品を特定し、
特定された前記部品に対応する音特性に基づいて前記音データが異常か否かを判定し、
前記音データが異常であると判定された場合、異常が発生したことを示す情報を出力する
ことを特徴とする異常部品検出方法。 - 車両と、集音器と、車両に搭載される部品の設置位置と前記部品の音特性とを関連づけて記憶する記憶装置及びコントローラを備える異常部品検出装置を含む異常部品検出システムであって、
前記コントローラは、
前記集音器から前記車両が発する音データを取得し、
取得された前記音データに基づいて音を発生する部品を特定し、
特定された前記部品に対応する音特性に基づいて前記音データが異常か否かを判定し、
前記音データが異常であると判定された場合、異常が発生したことを示す情報を出力する
ことを特徴とする異常部品検出システム。
Priority Applications (2)
| Application Number | Priority Date | Filing Date | Title |
|---|---|---|---|
| JP2023515407A JP7563582B2 (ja) | 2021-04-22 | 2021-04-22 | 異常部品検出装置、異常部品検出方法、及び異常部品検出システム |
| PCT/IB2021/000302 WO2022224005A1 (ja) | 2021-04-22 | 2021-04-22 | 異常部品検出装置、異常部品検出方法、及び異常部品検出システム |
Applications Claiming Priority (1)
| Application Number | Priority Date | Filing Date | Title |
|---|---|---|---|
| PCT/IB2021/000302 WO2022224005A1 (ja) | 2021-04-22 | 2021-04-22 | 異常部品検出装置、異常部品検出方法、及び異常部品検出システム |
Publications (1)
| Publication Number | Publication Date |
|---|---|
| WO2022224005A1 true WO2022224005A1 (ja) | 2022-10-27 |
Family
ID=83721976
Family Applications (1)
| Application Number | Title | Priority Date | Filing Date |
|---|---|---|---|
| PCT/IB2021/000302 Ceased WO2022224005A1 (ja) | 2021-04-22 | 2021-04-22 | 異常部品検出装置、異常部品検出方法、及び異常部品検出システム |
Country Status (2)
| Country | Link |
|---|---|
| JP (1) | JP7563582B2 (ja) |
| WO (1) | WO2022224005A1 (ja) |
Cited By (3)
| Publication number | Priority date | Publication date | Assignee | Title |
|---|---|---|---|---|
| JP2024074350A (ja) * | 2022-11-21 | 2024-05-31 | トヨタ自動車株式会社 | 車両の異常検知システム |
| JP2024109377A (ja) * | 2023-02-01 | 2024-08-14 | トヨタ自動車株式会社 | 車両診断システム |
| JP2024109376A (ja) * | 2023-02-01 | 2024-08-14 | トヨタ自動車株式会社 | 車両評価システム |
Citations (8)
| Publication number | Priority date | Publication date | Assignee | Title |
|---|---|---|---|---|
| JP2004257836A (ja) * | 2003-02-25 | 2004-09-16 | Nsk Ltd | 機械装置の異常診断装置 |
| JP2005188501A (ja) * | 2003-12-03 | 2005-07-14 | Toyota Motor Corp | 車両の故障診断システム |
| JP2006023208A (ja) * | 2004-07-08 | 2006-01-26 | Fuji Heavy Ind Ltd | 車体の異常検出装置 |
| US20100082274A1 (en) * | 2008-09-26 | 2010-04-01 | Hyundai Motor Company | Noise and Vibration Diagnosis Device for Vehicle and Control Method Thereof |
| JP2011203146A (ja) * | 2010-03-26 | 2011-10-13 | Fujitsu Fsas Inc | 音の監視方法及びシステム |
| JP2011203116A (ja) * | 2010-03-25 | 2011-10-13 | Toyota Motor Corp | 車両用異常予測装置及び方法 |
| JP2012018066A (ja) * | 2010-07-07 | 2012-01-26 | Panasonic Electric Works Sunx Co Ltd | 異常検査装置 |
| JP2017058351A (ja) * | 2015-09-18 | 2017-03-23 | トヨタ自動車株式会社 | 異常診断システム |
Family Cites Families (2)
| Publication number | Priority date | Publication date | Assignee | Title |
|---|---|---|---|---|
| JP2550757Y2 (ja) * | 1991-09-20 | 1997-10-15 | 津田駒工業株式会社 | 織機用表示装置 |
| JP2002140797A (ja) * | 2000-11-01 | 2002-05-17 | Technosoft Kk | 車両状態監視装置及び車両管理用情報処理システム |
-
2021
- 2021-04-22 JP JP2023515407A patent/JP7563582B2/ja active Active
- 2021-04-22 WO PCT/IB2021/000302 patent/WO2022224005A1/ja not_active Ceased
Patent Citations (8)
| Publication number | Priority date | Publication date | Assignee | Title |
|---|---|---|---|---|
| JP2004257836A (ja) * | 2003-02-25 | 2004-09-16 | Nsk Ltd | 機械装置の異常診断装置 |
| JP2005188501A (ja) * | 2003-12-03 | 2005-07-14 | Toyota Motor Corp | 車両の故障診断システム |
| JP2006023208A (ja) * | 2004-07-08 | 2006-01-26 | Fuji Heavy Ind Ltd | 車体の異常検出装置 |
| US20100082274A1 (en) * | 2008-09-26 | 2010-04-01 | Hyundai Motor Company | Noise and Vibration Diagnosis Device for Vehicle and Control Method Thereof |
| JP2011203116A (ja) * | 2010-03-25 | 2011-10-13 | Toyota Motor Corp | 車両用異常予測装置及び方法 |
| JP2011203146A (ja) * | 2010-03-26 | 2011-10-13 | Fujitsu Fsas Inc | 音の監視方法及びシステム |
| JP2012018066A (ja) * | 2010-07-07 | 2012-01-26 | Panasonic Electric Works Sunx Co Ltd | 異常検査装置 |
| JP2017058351A (ja) * | 2015-09-18 | 2017-03-23 | トヨタ自動車株式会社 | 異常診断システム |
Cited By (5)
| Publication number | Priority date | Publication date | Assignee | Title |
|---|---|---|---|---|
| JP2024074350A (ja) * | 2022-11-21 | 2024-05-31 | トヨタ自動車株式会社 | 車両の異常検知システム |
| JP2024109377A (ja) * | 2023-02-01 | 2024-08-14 | トヨタ自動車株式会社 | 車両診断システム |
| JP2024109376A (ja) * | 2023-02-01 | 2024-08-14 | トヨタ自動車株式会社 | 車両評価システム |
| JP7715169B2 (ja) | 2023-02-01 | 2025-07-30 | トヨタ自動車株式会社 | 車両診断システム |
| JP7800471B2 (ja) | 2023-02-01 | 2026-01-16 | トヨタ自動車株式会社 | 車両評価システム |
Also Published As
| Publication number | Publication date |
|---|---|
| JP7563582B2 (ja) | 2024-10-08 |
| JPWO2022224005A1 (ja) | 2022-10-27 |
Similar Documents
| Publication | Publication Date | Title |
|---|---|---|
| JP7563582B2 (ja) | 異常部品検出装置、異常部品検出方法、及び異常部品検出システム | |
| US20060204019A1 (en) | Acoustic signal processing apparatus, acoustic signal processing method, acoustic signal processing program, and computer-readable recording medium recording acoustic signal processing program | |
| US11480461B2 (en) | Compact system and method for vibration and noise mapping | |
| US11579012B1 (en) | Abnormal sound detection method and apparatus | |
| US8831233B2 (en) | Monitoring apparatus and method | |
| Zhang et al. | Range-based equal error rate for spoof localization | |
| JP2012018066A (ja) | 異常検査装置 | |
| JP2019066339A (ja) | 音による診断装置、診断方法、および診断システム | |
| JPWO2022224005A5 (ja) | ||
| JP2020173220A (ja) | 識別装置、識別方法、識別処理プログラム、生成装置、生成方法、および生成処理プログラム | |
| JP7397801B2 (ja) | 呼吸障害を有する被験者を検出する装置及び呼吸障害を有する被験者を検出する装置の作動方法 | |
| JP7516685B1 (ja) | 漏液検査支援装置、漏液検査支援方法、及び判別モデル作成装置 | |
| US12182909B2 (en) | Image processing apparatus and image processing method for generating a sound image | |
| CN114215703B (zh) | 适用于风机偏航系统辐射噪声的检测方法及装置 | |
| US12216024B2 (en) | Signal analysis device, signal analysis method, and recording medium | |
| US10810986B2 (en) | Audio analysis method and audio analysis device | |
| JP7196504B2 (ja) | 音響特性計測システム、音響特性計測方法、およびプログラム | |
| JP2008097360A (ja) | 異常監視装置 | |
| CN114169224A (zh) | 获取光栅结构数据的方法、装置及可读存储介质 | |
| JP6033718B2 (ja) | 音検査方法 | |
| US20240344933A1 (en) | Method of identifying abnormal sound and abnormal sound identification device | |
| JP7771696B2 (ja) | 車両の検査表示方法および装置 | |
| US20260126335A1 (en) | Method and system for monitoring and predicting leak in liquid cooling system of electronic device | |
| US8040958B2 (en) | Method for measuring correlation between frequency response functions | |
| JP2009501361A (ja) | 雑音および音響伝搬のスナップショット |
Legal Events
| Date | Code | Title | Description |
|---|---|---|---|
| 121 | Ep: the epo has been informed by wipo that ep was designated in this application |
Ref document number: 21937215 Country of ref document: EP Kind code of ref document: A1 |
|
| WWE | Wipo information: entry into national phase |
Ref document number: 2023515407 Country of ref document: JP |
|
| NENP | Non-entry into the national phase |
Ref country code: DE |
|
| 122 | Ep: pct application non-entry in european phase |
Ref document number: 21937215 Country of ref document: EP Kind code of ref document: A1 |