WO2022220196A1 - Dispositif de correction, instrument de mesure, procédé de correction et programme - Google Patents
Dispositif de correction, instrument de mesure, procédé de correction et programme Download PDFInfo
- Publication number
- WO2022220196A1 WO2022220196A1 PCT/JP2022/017345 JP2022017345W WO2022220196A1 WO 2022220196 A1 WO2022220196 A1 WO 2022220196A1 JP 2022017345 W JP2022017345 W JP 2022017345W WO 2022220196 A1 WO2022220196 A1 WO 2022220196A1
- Authority
- WO
- WIPO (PCT)
- Prior art keywords
- spectral sensitivity
- measured
- light
- sensor
- error
- Prior art date
Links
- 238000000034 method Methods 0.000 title claims description 38
- 230000003595 spectral effect Effects 0.000 claims abstract description 257
- 230000035945 sensitivity Effects 0.000 claims abstract description 196
- 238000009826 distribution Methods 0.000 claims abstract description 61
- 238000012937 correction Methods 0.000 claims description 76
- 238000005259 measurement Methods 0.000 claims description 42
- 238000001228 spectrum Methods 0.000 claims description 12
- 238000001514 detection method Methods 0.000 claims 1
- 235000019557 luminance Nutrition 0.000 description 26
- 239000011295 pitch Substances 0.000 description 12
- 238000010586 diagram Methods 0.000 description 9
- 239000000835 fiber Substances 0.000 description 8
- 239000011159 matrix material Substances 0.000 description 8
- 239000011347 resin Substances 0.000 description 8
- 229920005989 resin Polymers 0.000 description 8
- 239000000654 additive Substances 0.000 description 5
- 230000000996 additive effect Effects 0.000 description 5
- 239000000203 mixture Substances 0.000 description 5
- 230000000694 effects Effects 0.000 description 4
- 239000013307 optical fiber Substances 0.000 description 4
- 230000005855 radiation Effects 0.000 description 4
- 230000003287 optical effect Effects 0.000 description 3
- 238000003860 storage Methods 0.000 description 3
- 238000004364 calculation method Methods 0.000 description 2
- 239000003086 colorant Substances 0.000 description 2
- 238000009792 diffusion process Methods 0.000 description 2
- 230000004907 flux Effects 0.000 description 2
- 238000004904 shortening Methods 0.000 description 2
- 238000004737 colorimetric analysis Methods 0.000 description 1
- 238000007796 conventional method Methods 0.000 description 1
- 230000002596 correlated effect Effects 0.000 description 1
- 230000001419 dependent effect Effects 0.000 description 1
- 238000005516 engineering process Methods 0.000 description 1
- 238000011156 evaluation Methods 0.000 description 1
- 238000010438 heat treatment Methods 0.000 description 1
- 239000004973 liquid crystal related substance Substances 0.000 description 1
- 238000004519 manufacturing process Methods 0.000 description 1
- 238000012545 processing Methods 0.000 description 1
- 238000013441 quality evaluation Methods 0.000 description 1
- 230000003252 repetitive effect Effects 0.000 description 1
- 238000005549 size reduction Methods 0.000 description 1
- 238000004611 spectroscopical analysis Methods 0.000 description 1
- 230000005469 synchrotron radiation Effects 0.000 description 1
Images


Classifications
-
- G—PHYSICS
- G01—MEASURING; TESTING
- G01J—MEASUREMENT OF INTENSITY, VELOCITY, SPECTRAL CONTENT, POLARISATION, PHASE OR PULSE CHARACTERISTICS OF INFRARED, VISIBLE OR ULTRAVIOLET LIGHT; COLORIMETRY; RADIATION PYROMETRY
- G01J3/00—Spectrometry; Spectrophotometry; Monochromators; Measuring colours
- G01J3/46—Measurement of colour; Colour measuring devices, e.g. colorimeters
- G01J3/52—Measurement of colour; Colour measuring devices, e.g. colorimeters using colour charts
- G01J3/524—Calibration of colorimeters
-
- G—PHYSICS
- G01—MEASURING; TESTING
- G01J—MEASUREMENT OF INTENSITY, VELOCITY, SPECTRAL CONTENT, POLARISATION, PHASE OR PULSE CHARACTERISTICS OF INFRARED, VISIBLE OR ULTRAVIOLET LIGHT; COLORIMETRY; RADIATION PYROMETRY
- G01J1/00—Photometry, e.g. photographic exposure meter
- G01J1/42—Photometry, e.g. photographic exposure meter using electric radiation detectors
-
- G—PHYSICS
- G01—MEASURING; TESTING
- G01J—MEASUREMENT OF INTENSITY, VELOCITY, SPECTRAL CONTENT, POLARISATION, PHASE OR PULSE CHARACTERISTICS OF INFRARED, VISIBLE OR ULTRAVIOLET LIGHT; COLORIMETRY; RADIATION PYROMETRY
- G01J3/00—Spectrometry; Spectrophotometry; Monochromators; Measuring colours
- G01J3/02—Details
-
- G—PHYSICS
- G01—MEASURING; TESTING
- G01J—MEASUREMENT OF INTENSITY, VELOCITY, SPECTRAL CONTENT, POLARISATION, PHASE OR PULSE CHARACTERISTICS OF INFRARED, VISIBLE OR ULTRAVIOLET LIGHT; COLORIMETRY; RADIATION PYROMETRY
- G01J3/00—Spectrometry; Spectrophotometry; Monochromators; Measuring colours
- G01J3/28—Investigating the spectrum
-
- G—PHYSICS
- G01—MEASURING; TESTING
- G01J—MEASUREMENT OF INTENSITY, VELOCITY, SPECTRAL CONTENT, POLARISATION, PHASE OR PULSE CHARACTERISTICS OF INFRARED, VISIBLE OR ULTRAVIOLET LIGHT; COLORIMETRY; RADIATION PYROMETRY
- G01J3/00—Spectrometry; Spectrophotometry; Monochromators; Measuring colours
- G01J3/46—Measurement of colour; Colour measuring devices, e.g. colorimeters
- G01J3/50—Measurement of colour; Colour measuring devices, e.g. colorimeters using electric radiation detectors
- G01J3/51—Measurement of colour; Colour measuring devices, e.g. colorimeters using electric radiation detectors using colour filters
-
- G—PHYSICS
- G01—MEASURING; TESTING
- G01M—TESTING STATIC OR DYNAMIC BALANCE OF MACHINES OR STRUCTURES; TESTING OF STRUCTURES OR APPARATUS, NOT OTHERWISE PROVIDED FOR
- G01M11/00—Testing of optical apparatus; Testing structures by optical methods not otherwise provided for
-
- G—PHYSICS
- G01—MEASURING; TESTING
- G01J—MEASUREMENT OF INTENSITY, VELOCITY, SPECTRAL CONTENT, POLARISATION, PHASE OR PULSE CHARACTERISTICS OF INFRARED, VISIBLE OR ULTRAVIOLET LIGHT; COLORIMETRY; RADIATION PYROMETRY
- G01J1/00—Photometry, e.g. photographic exposure meter
- G01J1/42—Photometry, e.g. photographic exposure meter using electric radiation detectors
- G01J1/44—Electric circuits
- G01J2001/444—Compensating; Calibrating, e.g. dark current, temperature drift, noise reduction or baseline correction; Adjusting
Definitions
- the present invention provides a correction device, a measurement device, a correction method, and a correction device for correcting an output error caused by a spectral sensitivity error of a sensor used in a filter-type measurement device for measuring the luminance, chromaticity, etc. of radiated light of a display or the like.
- a correction device for correcting an output error caused by a spectral sensitivity error of a sensor used in a filter-type measurement device for measuring the luminance, chromaticity, etc. of radiated light of a display or the like.
- Measuring instruments that measure the luminance, chromaticity, etc. of radiated light from displays, etc. come in spectral and filter types, both of which obtain the tristimulus values of the light to be measured and convert them into luminance, chromaticity, etc.
- a spectroscopic measuring instrument obtains tristimulus values by multiplying the spectral distribution of the measured light measured by a spectrograph composed of a diffraction grating and a high-sensitivity sensor array, and theoretical color matching functions.
- This spectroscopic type is in principle excellent in spectral sensitivity accuracy, but has disadvantages such as long measurement time, high cost, and large size.
- a filter-type measuring instrument which is also called a stimulus value direct reading type, receives the light to be measured with a sensor having a spectral sensitivity that approximates the color matching function, and directly obtains an output correlated with the tristimulus value.
- This filter-type measuring instrument surpasses spectroscopic-type measuring instruments in terms of measurement speed, and is superior in terms of size and cost.
- a disadvantage is that the application area is limited.
- the quality evaluation of displays involves colorimetric measurements of many colored lights. For example, in gamma measurement (EOTF measurement), at least 25 levels of measurement are performed for the four colors B (blue), G (green), R (red), and W (white). As the performance of displays improves, the number of measurements per unit is increasing, and there is a demand for shortening the measurement time.
- EOTF measurement gamma measurement
- Patent Document 1 using a calibration matrix of tristimulus values obtained by using the primary lights (three lights of B, G, and R) of the display as the calibration reference lights, arbitrary colors synthesized by additive color mixture of the primary lights Techniques have been disclosed for improving the accuracy of the tristimulus values of the light to be measured.
- the tristimulus values are obtained by numerical calculation by combining the color matching function and the pre-measured sensor spectral sensitivity of the filter-type luminance meter with the pre-obtained spectral distribution of the primary light of each type of display.
- a technique is disclosed that eliminates the need to actually measure color values for each type.
- Patent Document 4 a specific position of the measurement area is measured by both the filter type and the spectrophotometer in the filter type two-dimensional colorimeter, and the correction coefficient obtained from the tristimulus values of both is applied to the entire measurement area.
- a technique has been proposed that aims to improve the accuracy of two-dimensional colorimetry by doing so.
- JP-A-06-323910 JP 2012-215570 A Japanese Patent Application No. 2019-39795 JP-A-6-201472
- Patent Documents 1 to 3 are basically matrix calibration using the color values of the calibration reference light, and high accuracy is achieved only when the light to be measured can be synthesized with the calibration reference light (when additive color mixture is established). cannot be obtained, and there is a limit to suppressing the color value error that is caused by the sensor spectral sensitivity error and depends on the spectral distribution of the light to be measured.
- the present invention has been made in view of such a technical background.
- the purpose is to provide a correction device, a measuring device, a correction method, and a program that enable a filter type measuring device to measure any light to be measured with high accuracy and high speed by correcting based on the spectral distribution of and
- a measuring instrument that receives light to be measured by one or more sensors having spectral sensitivities close to a target spectral sensitivity and a spectrograph, and obtains the characteristics of the light to be measured based on the output of the sensors. , the error in the sensor output due to the spectral sensitivity error from the target spectral sensitivity of the sensor, the target spectral sensitivity; a pre-measured and stored spectral sensitivity of the sensor; a spectral distribution of the light to be measured measured by the spectrograph; A correction device that estimates and corrects from (2) The correction device according to (1) above, wherein the spectrograph has a wavelength pitch and a half width of 4 nm or more.
- a simulated sensor output S' n,sim is obtained from the spectral distribution I'( ⁇ ) of the light I to be measured measured by the spectrograph and the spectral sensitivity s' n ( ⁇ ) of the sensor n.
- the light to be measured consists of one or more monochromatic lights or ultra-narrow band lights
- the correcting device according to item 5, citing item 4, in which the simulated sensor output S' n,sim is estimated by S' n,sim A ⁇ s' n ( ⁇ c ).
- the correcting device according to (5) or (6) above, further comprising detecting means for detecting whether the light to be measured is composed of one or more of monochromatic light and ultra-narrow band light.
- the correcting device according to any one of the preceding items 1 to 7, wherein the target spectral sensitivity is standard luminosity, and the measuring device is a luminance meter or an illuminance meter for measuring luminance or illuminance of the object to be measured.
- the target spectral sensitivity is a color matching function, and the measuring device is a color luminance meter or a color luminance meter for measuring the color characteristics of the object to be measured.
- a measuring instrument that receives light to be measured by one or more sensors having spectral sensitivities close to a target spectral sensitivity and a spectrograph, and obtains the characteristics of the light to be measured based on the output of the sensors.
- a measuring instrument comprising the correction device according to any one of the preceding items 1 to 9.
- (11) A measuring instrument that receives light to be measured by one or more sensors having spectral sensitivities close to a target spectral sensitivity and a spectrograph, and obtains the characteristics of the light to be measured based on the output of the sensors.
- the spectrograph has a wavelength pitch and a half width of 4 nm or more.
- the permissible repeatability of the spectrograph is 10 times or more the permissible repeatability of the measuring instrument.
- a simulated sensor output S' n,sim is obtained from the spectral distribution I'( ⁇ ) of the light I to be measured measured by the spectrograph and the spectral sensitivity s' n ( ⁇ ) of the sensor n.
- the correction method according to any one of the preceding items 11 to 13, wherein the sensor output S' n is corrected to the corrected sensor output S' n,corr by S' n,corr S' n ⁇ (1 ⁇ R err,n ). .
- the light to be measured consists of one or more monochromatic lights or ultra-narrow band lights
- the correction method according to item 15, which quotes item 14, in which the simulated sensor output S' n,sim is estimated by S' n,sim A ⁇ s' n ( ⁇ c ).
- the correction method according to (15) or (16) above, which comprises detecting means for detecting whether the light to be measured is composed of one or more of monochromatic light and ultra-narrow band light.
- a measuring instrument that receives light to be measured by one or more sensors having spectral sensitivities close to a target spectral sensitivity and a spectrograph, and obtains characteristics of the light to be measured based on outputs of the sensors. There is The sensor resulting from a spectral sensitivity error of the spectral sensitivity of the sensor from the target spectral sensitivity based on the spectral distribution of the light to be measured measured by the spectrograph, the target spectral sensitivity, and the sensor spectral sensitivity measured in advance.
- a measuring instrument that estimates and corrects for errors in the output of (22) The measuring instrument according to (21) above, wherein the spectrograph has a wavelength pitch and a half width of 4 nm or more.
- the error in the sensor output due to the spectral sensitivity error from the target spectral sensitivity of the sensor of the filter type measuring device is corrected to the target without depending on matrix calibration.
- the spectral sensitivity, the sensor spectral sensitivity measured and stored in advance, and the spectral distribution of the light to be measured measured by the spectrograph are estimated and corrected, so that the light to be measured is synthesized by additive color mixture of the calibration reference light. Even if it is not possible, it is possible to perform highly accurate measurement using a filter-type measuring instrument. Moreover, high-speed measurement is possible without the need to use a highly accurate spectrograph.
- the wavelength pitch and the half width of the spectrograph are 4 nm or more, so a high-precision spectrograph is unnecessary, and the cost of the spectrograph and the measurement equipment The cost can be reduced and high-speed measurement becomes possible.
- the allowable repeatable error of the spectrograph is 10 times or more the allowable repeatable error of the measuring instrument, so a highly accurate spectrograph is unnecessary. and the cost of the measuring instrument can be reduced, and high-speed measurement becomes possible.
- the sensor output error caused by the spectral sensitivity error from the target spectral sensitivity of the sensor of the filter-type measuring device is reliably estimated and corrected. be able to.
- the error in the output due to the spectral sensitivity error of the sensor can be estimated and corrected.
- the light to be measured consists of one or more of monochromatic light and ultra-narrow band light.
- the target spectral sensitivity is the standard luminosity factor, and in the luminance meter or illuminance meter for measuring the luminance or illuminance of the measurement target, the target spectral sensitivity of the sensor Errors in the sensor output due to spectral sensitivity errors from can be estimated and corrected.
- the target spectral sensitivity is a color-matching function
- the target spectral sensitivity of the sensor is Errors in sensor output due to spectral sensitivity error from sensitivity can be estimated and corrected.
- the error in the sensor output due to the spectral sensitivity error from the target spectral sensitivity of the sensor of the filter-type measuring device is combined with the target spectral sensitivity and is measured and stored in advance.
- a computer can be caused to perform a process of estimating and correcting from the spectral sensitivity of the sensor and the spectral distribution of the light to be measured measured by the spectrograph.
- the error in the sensor output due to the spectral sensitivity error from the target spectral sensitivity of one or more sensors having spectral sensitivities close to the target spectral sensitivity is reduced.
- Spectroscopic distributions used in computations to estimate and correct can be measured at high speed with less accurate, less costly spectrographs.
- FIG. 1 is a schematic configuration diagram of a filter-type measuring instrument according to one embodiment of the present invention
- FIG. Spectral sensitivities s' x ( ⁇ ), s' y ( ⁇ ), s' z ( ⁇ ) and color matching functions s x ( ⁇ ), s y ( ⁇ ), s z ( ⁇ ) and , spectral sensitivity errors e x ( ⁇ ), e y ( ⁇ ), and e z ( ⁇ ).
- 2 is a flow chart showing a correction procedure performed by the filter-type measuring instrument of FIG.
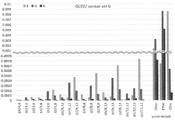
- FIG. 5 is a graph showing errors in tristimulus values before and after correction of primary light of LCD (Liquid Crystal Display) simulated and measured using sensor set b in FIG. 4 ;
- FIG. FIG. 5 is a graph showing errors in tristimulus values before and after correction of primary light of LCD (Liquid Crystal Display) simulated and measured using sensor set b in FIG. 4 ;
- FIG. 5 is a graph showing errors in tristimulus values before and after correction of the primary light of an LCD simulated using sensor set c of FIG. 4;
- FIG. 5 is a graph showing errors in tristimulus values before and after correction of primary light of an OLED (Organic Light Emitting Diode) simulated and measured using the sensor set b of FIG. 4;
- FIG. 5 is a graph showing errors in tristimulus values before and after correction of OLED primary light simulated using sensor set c of FIG. 4;
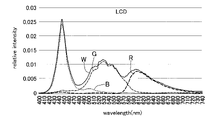
- FIG. 4 is a graph showing spectral distributions of primary light and white light of a typical LCD.
- FIG. 4 is a graph showing the spectral distribution of primary light and white light of a typical OLED; 1 is a graph showing the spectral distribution of a typical LD (Laser Display) emitted light. 2 is a graph showing the output of a spectrograph with a wavelength pitch and a half width of 4 nm for the spectral distribution of typical LD radiation.
- FIG. 10 is a schematic configuration diagram of a filter-type measuring instrument according to another embodiment of the present invention;
- FIG. 4 is a schematic configuration diagram of a filter-type measuring instrument according to still another embodiment of the present invention, where (A) is a side view and (B) is a view of FIG. A viewed from the right.
- FIG. 10 is a schematic configuration diagram of a filter-type measuring instrument according to another embodiment of the present invention.
- FIG. 4 is a schematic configuration diagram of a filter-type measuring instrument according to still another embodiment of the present invention, where (A) is a side view and (B) is a view
- FIG. 10 which shows still another embodiment of the present invention, is a schematic configuration diagram when the spectrograph is a spectrophotometer independent of the filter-type measuring instrument.
- FIG. 10 showing still another embodiment of the present invention is a configuration diagram in which a filter-type measuring instrument, a spectrometer as a spectrograph, and a personal computer (PC) as a correction device are independent of each other.
- FIG. 10, showing still another embodiment of the present invention is a schematic configuration diagram in which the correction device is a PC independent of the filter-type measuring device.
- FIG. 1 is a schematic configuration diagram of a filter-type color luminance meter, which is an example of a filter-type measuring instrument 100 according to one embodiment of the present invention.
- a correction device is built into the filter type colorimeter.
- the filter-type measuring instrument 100 shown in FIG. and the light to be measured 6 (light to be measured I) emitted from the light source 5 to be measured enters the incident end of the four-branch optical fiber bundle 2 via the lens system 1 .
- the three filtered sensors n are also referred to as sensors x, y, z.
- the 4-branch optical fiber bundle 2 is branched into 4 from the middle portion in the length direction, and distributes the light incident from the incident end to the 4 branch portions 21 .
- the sensors x, y, and z having spectral sensitivities s' x ( ⁇ ), s' y ( ⁇ ), and s' z ( ⁇ ) are provided at the output ends of the three branch portions 21 of the four-branch optical fiber bundle 2, respectively.
- the light emitted from the emitting end of each branching portion 21 is received by the sensors x, y, and z with filters. Light from the exit end of the remaining one branching portion 21 enters the spectrograph 3 .
- the spectrograph 3 splits the incident light into wavelengths, and receives the split light at each pixel of the sensor array for each wavelength.
- Arithmetic control unit 4 controls the entire measuring instrument and estimates and corrects the output error caused by the spectral sensitivity error from the target spectral sensitivity of each of the three sensors x, y, and z. Also functions as a device. The estimation and correction of the output error are performed as described below by the arithmetic control unit 4 operating according to the correction program.
- sensor outputs S'x , S'y, and S'z are obtained from three types of sensors x, y , and z , and pixel signals pi ( i : pixel number) of the sensor array obtained from the spectrograph 3 are converted into obtained spectral distribution I'( ⁇ ).
- pixel signals pi i : pixel number
- the sensor spectral sensitivities s' x ( ⁇ ), s' y ( ⁇ ), s' z ( ⁇ ) and color matching functions s x ( ⁇ ), s y ( ⁇ ), s z ( ⁇ ) may be a storage unit (not shown) in the filter-type measuring instrument 100 or an external storage device. If it is stored in an external storage device, the sensor spectral sensitivity s' x ( ⁇ ), s' y ( ⁇ ), s' z ( ⁇ ) or color matching function s x ( ⁇ ), s y ( ⁇ ), s z ( ⁇ ).
- Correction algorithm 1 This correction algorithm 1 is a basic algorithm for performing correction.
- the stored color matching functions s x ( ⁇ ), s y ( ⁇ ), s z ( ⁇ ) and the stored spectral sensitivities s' x ( ⁇ ), s' y ( ⁇ ), s' z ( ⁇ ), the spectral sensitivity errors e x ( ⁇ ), e y ( ⁇ ), and e z ( ⁇ ) are calculated using (Equation 4) to (Equation 6).
- the spectral sensitivity errors e x ( ⁇ ), e y ( ⁇ ), and e z ( ⁇ ) may be calculated and stored in advance.
- R err,x E x /S' x,sim (equation 10)
- Rerr,y Ey / S'y,sim (Formula 11)
- Rerr,z Ez / S'z,sim (equation 12)
- Correction of sensor output The sensor outputs S' x , S' y , and S' z measured by the three types of sensors x , y, and z are corrected using (Equation 13) to (Equation 15). ,corr , S' y,corr , S' z,corr .
- the corrected sensor output is converted into corrected tristimulus values by known arithmetic processing and output from the filter-type measuring instrument 100 .
- s' x ( ⁇ ), s' y ( ⁇ ), s z ( ⁇ ) are theoretical values, there is no error, and the spectral sensitivities s' x ( ⁇ ), s' y ( ⁇ ) of the sensor measured during manufacturing , s' z ( ⁇ ) can be obtained with the required accuracy by allocating necessary equipment (such as an irradiation monochromator) and time, so that it substantially depends on the accuracy of the spectral distribution I'( ⁇ ).
- the corrected sensor output S' x,corr , S ' y,corr , S' has limited effect on z,corr and therefore limited effect on the corrected tristimulus values.
- Accuracy required for spectrograph 3 (concrete example) As described above, the spectral distribution I'( ⁇ ) of the light to be measured 6 measured by the spectrograph 3 is used only for estimating the error to be corrected. The effect on the corrected tristimulus values is limited even if there are measurement repetition errors and absolute value errors.
- E rep,ttl is the allowable repeatability of the measuring instrument, and R err,max is the maximum value of the output error rate (the ratio of the sensor output error due to the spectral sensitivity error to the sensor output). Then, if other error factors can be ignored, the repeat error E rep,spe of the spectrograph 3 should satisfy E rep,spe ⁇ E rep,ttl /R err,max .
- E rep,spe is allowed up to 20%.
- the repeatability error E rep,spe of the spectrograph 3 is at least 10 times the allowable repeatability error E rep,ttl of the measuring instrument ( 1/0.1) is acceptable.
- the time required for measuring the spectral distribution by the spectrograph 3 can be shortened. At least 10 times the permissible repeatability of stimulus value output means that, in principle, the measurement time is less than 1/10 2 of the time required to obtain tristimulus values from the spectral distribution like a spectrophotometer. do.
- the optical brightness (NA) and sensitivity of the spectrograph 3 can be lowered, resulting in cost and size reductions.
- the arithmetic control unit 4 converts the pixel output p i into the spectral distribution I'( ⁇ ) (step #3). Further, the sensor output error E n is estimated from the spectral distribution I′( ⁇ ) and the spectral sensitivity error e n ( ⁇ ) using (Equation 1) to (Equation 12), and the output error rate R err,n is obtained (step #4).
- the output error rate R err,n is applied to the sensor output S' n according to (Equation 13) to (Equation 15) to obtain the corrected sensor output S' n,corr , which is converted to the corrected tristimulus value and output. (Step #5).
- the measurement time T spe of the spectrograph 3 in step #2 is obtained from the sensors x, y, ttl in step #1.
- the measurement time for z is much longer than T fil (typically 2 s versus 0.05 s), in the present embodiment, which allows for large repeatability errors in the spectrograph 3, the measurement time is reduced to T' spe ⁇ T fil .
- the total measurement time E rep,ttl can be set to the level of the filter-type colorimeter (Since the calculation time of steps #3 to #5 can be ignored, the total measurement time T ttl ⁇ T' spe ⁇ T fil ). .
- the repeatable error E rep,spe is magnified to 20 times (1/0.05) the allowable repeatability E rep,ttl of the measuring instrument.
- spectrograph 3 still has a margin of more than 3 times (20 times/6.3 times) in the allowable repeatability error E rep,spe , so trade it with spectrograph 3's optical brightness (NA) and sensitivity. As a result, the size and cost of the spectrograph 3 can be reduced.
- Wavelength pitch and half width of spectrograph 3 The accuracy of correction according to this embodiment depends on the accuracy of spectral distribution I'( ⁇ ), and therefore the wavelength pitch of spectrograph 3 that measures I'( ⁇ ) and Although it depends on the half-value width, below we will confirm their influence by simulated measurement of LCD and OLED.
- 4(a), 4(b), and 4(c) show the spectral sensitivities s' of the sensors x, y, and z of the sensor set a with a small spectral sensitivity error and the sensor sets b and c with a large spectral sensitivity error.
- x ( ⁇ ), s' y ( ⁇ ), s' z ( ⁇ ) and spectral sensitivity errors e x ( ⁇ ), e y ( ⁇ ), e z ( ⁇ ) are converted into color matching functions s x ( ⁇ ), It is a graph shown with s y ( ⁇ ) and s z ( ⁇ ).
- the left vertical axis is the spectral sensitivity s' x ( ⁇ ), s' y ( ⁇ ), s' z ( ⁇ ) and the color matching function s Values of x ( ⁇ ), s y ( ⁇ ), and s z ( ⁇ ) are shown, and the right vertical axis represents values of spectral sensitivity errors e x ( ⁇ ), e y ( ⁇ ), and e z ( ⁇ ).
- Tristimulus values of LCD primary lights B, G, and R (spectral distribution is shown in FIG. 9) simulated and measured according to formulas (1) to (12) using sensor set b and sensor set c. 5 and 6 show the errors (absolute values)
- FIGS. 7 and 8 show errors (absolute values) before and after correction of the tristimulus values of the OLED primary light (the spectral distribution is shown in FIG. 10) simulated and measured. The three bars for each error are the B, G, and R values from left to right.
- the spectral distribution used for correction in the simulated measurement was measured with an isosceles triangular slit function and six types of spectrographs 3 having wavelength pitches and half-value widths shown in Table 1.
- are improved from the errors
- the correction effect is remarkable at 4 to 8 nm, and the spectral sensitivity accuracy is set to the level of a spectral radiance meter, and the amount of light incident on each pixel of the spectrograph 3 is approximately 4 2 to 8 2 times that when both the wavelength pitch and the half value width are 1 nm.
- correction algorithm 2 This correction algorithm is for the emitted light of a laser display (LD).
- the finite half-value width of the spectrograph 3 does not cause a large error in the radiant light from LCDs and OLEDs, which have broad spectral distributions as shown in FIGS. ) into the narrowband spectrum shown in FIG. 12, resulting in non-negligible errors.
- the actual sensor outputs S' x , S' y , S' z from the laser light include the spectral sensitivities s' x ( ⁇ L ), s' y ( ⁇ L ) , s' z ( ⁇ L ), but simulated sensor outputs S′ x,sim , S′ y,sim , which are simulated and measured by (Equation 1) to (Equation 3) using the spectral distribution I′( ⁇ ) of FIG.
- the spectral sensitivity at wavelengths around the laser wavelength ⁇ L also contributes to S' z,sim , resulting in an error.
- the measured spectral distribution I'( ⁇ ) of each primary light is narrow as shown in FIG. It has a band spectrum.
- the centroid wavelengths ⁇ b , ⁇ g , ⁇ r and the integrated intensities A b , Ag , Ar of each narrowband spectrum are obtained in the same manner as described above, and the spectral sensitivities s' x ( ⁇ ), s' y ( ⁇ ), s' z ( ⁇ ) to obtain sensor spectral sensitivities s' x ( ⁇ b ), s' y ( ⁇ g ), s' z ( ⁇ r ) at centroid wavelengths ⁇ p , ⁇ g , and ⁇ r , ... , s' z ( ⁇ b ), s' z ( ⁇ g ), s' z ( ⁇ r ) are obtained, and simulated sensor outputs S
- the above process can be applied not only to laser light but also to ultra-narrow band light. ) is used. Whether or not the light to be measured is laser light or ultra-narrow band light can be determined by the operator, or can be automatically determined by the arithmetic control unit from the spectral distribution I'( ⁇ ).
- T(16) 0.00 in the spectral distributions of FIGS. 9 (LCD) and 10 (OLED). 0.80 and 0.72. If T is smaller than a threshold value (for example, 0.1), the arithmetic control unit 4 determines that the light is laser light or ultra-narrow band light.
- a threshold value for example, 0.1
- FIG. 13 is a schematic configuration diagram of a filter-type measuring instrument 100 according to another embodiment of the invention. This embodiment differs from the filter-type measuring instrument shown in FIG.
- the filter-type measuring instrument 100 of FIG. 13 includes a light pipe 22 into which light 6 to be measured from a light source 5 to be measured is incident via a lens system 1 consisting of a plurality of lenses, and a light pipe 22 connected to the output end face of the light pipe 22 . It is equipped with the resin fiber 23 of this. Sensors x, y, and z are arranged at the emission ends of three resin fibers 23 among the four resin fibers 23, and the spectrograph 3 is arranged at the emission end of one resin fiber 23.
- the luminous flux incident on the light pipe 22 is distributed to four resin fibers 23 at the output end face, and the luminous flux distributed to the three resin fibers 23 is received by each sensor x, y, z, and one resin
- the spectrograph 3 receives the beam distributed to the fiber 23 .
- FIGS. 14A and 14B are schematic configuration diagrams of a filter-type measuring instrument 100 according to still another embodiment of the present invention, where (A) is a side view and (B) is a view of (A) viewed from the right.
- the light 6 to be measured from the light source 5 to be measured is diffused by a dome-shaped diffusion plate 7, and the diffused light is received by three sensors x, y, and z arranged around a central lens 8. At the same time, the diffused light converged by the lens 8 is received by the spectrograph 3 .
- FIG. 15 shows yet another embodiment of the invention.
- the filter-type measuring instrument 100 of FIGS. 1, 13 and 14 incorporates three sensors x, y, z, a spectrograph 3, and an arithmetic control section 4 functioning as a correction device.
- a filter type measuring instrument 100 of FIG. 15 incorporates three sensors x, y, z and an arithmetic control unit 4, and is connected to an independent spectrophotometer 31 as a spectrograph 3 and the like.
- the light 6 to be measured is measured by three sensors x, y, z and an independent spectrophotometer 31, and these outputs are input to the arithmetic control unit 4, and the three sensors x, y , Estimate and correct the error in the output of z.
- a filter type color luminance meter etc. as sensors x, y, z, a spectral luminance meter 31 etc. as a spectrograph 3, and a personal computer (PC) 41 etc. as a correction device are respectively may be independent.
- the PC 41 receives the output of each sensor x, y, z of the filter-type luminance meter 100 and the output of the spectral luminance meter 31 via a network or the like, and Estimate and correct the errors in the outputs of the sensors x, y, z.
- the three sensors x, y, z and the spectrograph 3 are incorporated in the filter-type measuring instrument 100, and the correction device is configured by an external PC 41 or the like.
- An external PC 41 may receive the output of each sensor x, y, z and the output of the spectrograph 3 via a network or the like to correct the sensor output.
- the technique of this embodiment can Using an inexpensive spectrograph with a wavelength pitch and a half-value width of 4 nm or more, preferably 4 to 8 nm, and a permissible repeatability error of 10 times or more than the permissible repeatability error of a measuring instrument, correction can be performed at high speed and with high accuracy.
- the number of sensors is not limited to three.
- colorimeters generally have three types of sensors for the color matching functions x , y, and z. or a luminance meter with one type of sensor that approximates the standard luminous efficiency V( ⁇ ).
- the target spectral sensitivities s' x ( ⁇ ), s' y ( ⁇ ), s' z ( ⁇ ) of the sensors x, y, and z of the filter type measuring instrument 100 are
- the error of the sensor output due to the spectral sensitivity error from s x ( ⁇ ), s y ( ⁇ ), s z ( ⁇ ) is defined as the target spectral sensitivity s x ( ⁇ ), s y ( ⁇ ), s z ( ⁇ ), sensor spectral sensitivities s' x ( ⁇ ), s' y ( ⁇ ), s' z ( ⁇ ) measured and stored in advance, and spectral distribution I' ( ⁇ ) and corrected.
- highly accurate measurement is possible even with light to be measured that cannot be synthesized with calibration reference light.
- high-speed measurement is possible without the need to use a highly accurate spectrograph.
- the present invention can be used as a correction device that corrects output errors caused by spectral sensitivity errors of sensors used in filter-type measuring instruments that measure the luminance, chromaticity, etc. of radiated light such as displays.
Landscapes
- Physics & Mathematics (AREA)
- Spectroscopy & Molecular Physics (AREA)
- General Physics & Mathematics (AREA)
- Chemical & Material Sciences (AREA)
- Analytical Chemistry (AREA)
- Spectrometry And Color Measurement (AREA)
Abstract
Priority Applications (3)
| Application Number | Priority Date | Filing Date | Title |
|---|---|---|---|
| KR1020237034736A KR20230154273A (ko) | 2021-04-12 | 2022-04-08 | 보정 장치, 측정기, 보정 방법 및 프로그램 |
| CN202280027008.XA CN117157510A (zh) | 2021-04-12 | 2022-04-08 | 校正装置、测定器、校正方法以及程序 |
| JP2023514630A JPWO2022220196A1 (fr) | 2021-04-12 | 2022-04-08 |
Applications Claiming Priority (2)
| Application Number | Priority Date | Filing Date | Title |
|---|---|---|---|
| JP2021067207 | 2021-04-12 | ||
| JP2021-067207 | 2021-04-12 |
Publications (1)
| Publication Number | Publication Date |
|---|---|
| WO2022220196A1 true WO2022220196A1 (fr) | 2022-10-20 |
Family
ID=83640059
Family Applications (1)
| Application Number | Title | Priority Date | Filing Date |
|---|---|---|---|
| PCT/JP2022/017345 WO2022220196A1 (fr) | 2021-04-12 | 2022-04-08 | Dispositif de correction, instrument de mesure, procédé de correction et programme |
Country Status (4)
| Country | Link |
|---|---|
| JP (1) | JPWO2022220196A1 (fr) |
| KR (1) | KR20230154273A (fr) |
| CN (1) | CN117157510A (fr) |
| WO (1) | WO2022220196A1 (fr) |
Citations (7)
| Publication number | Priority date | Publication date | Assignee | Title |
|---|---|---|---|---|
| JPH06201472A (ja) * | 1993-01-06 | 1994-07-19 | Minolta Camera Co Ltd | 二次元測色計 |
| JPH09329497A (ja) * | 1996-04-11 | 1997-12-22 | Olympus Optical Co Ltd | 測色装置及び測色方法 |
| JP2005065601A (ja) * | 2003-08-25 | 2005-03-17 | Matsushita Electric Works Ltd | 光放射評価方法 |
| JP2007271567A (ja) * | 2006-03-31 | 2007-10-18 | National Univ Corp Shizuoka Univ | カラーフィルタの色差安定波長特定方法及びプログラム |
| WO2010021258A1 (fr) * | 2008-08-22 | 2010-02-25 | コニカミノルタセンシング株式会社 | Dispositif photométrique/colorimétrique |
| WO2015182571A1 (fr) * | 2014-05-29 | 2015-12-03 | コニカミノルタ株式会社 | Dispositif de mesure de caractéristique optique et procédé de mesure de caractéristique optique |
| US20180082659A1 (en) * | 2016-09-22 | 2018-03-22 | Apple Inc. | Light Sensor With Spectral Sensing and Color Matching Function Channels |
Family Cites Families (3)
| Publication number | Priority date | Publication date | Assignee | Title |
|---|---|---|---|---|
| JPH06323910A (ja) | 1993-05-13 | 1994-11-25 | Minolta Camera Co Ltd | 光源色測色計 |
| US9163990B2 (en) | 2011-04-01 | 2015-10-20 | X-Rite Switzerland GmbH | Color measuring device calibration |
| JP6963936B2 (ja) | 2017-08-25 | 2021-11-10 | 株式会社トプコン | 測量システム |
-
2022
- 2022-04-08 KR KR1020237034736A patent/KR20230154273A/ko unknown
- 2022-04-08 WO PCT/JP2022/017345 patent/WO2022220196A1/fr active Application Filing
- 2022-04-08 CN CN202280027008.XA patent/CN117157510A/zh active Pending
- 2022-04-08 JP JP2023514630A patent/JPWO2022220196A1/ja active Pending
Patent Citations (7)
| Publication number | Priority date | Publication date | Assignee | Title |
|---|---|---|---|---|
| JPH06201472A (ja) * | 1993-01-06 | 1994-07-19 | Minolta Camera Co Ltd | 二次元測色計 |
| JPH09329497A (ja) * | 1996-04-11 | 1997-12-22 | Olympus Optical Co Ltd | 測色装置及び測色方法 |
| JP2005065601A (ja) * | 2003-08-25 | 2005-03-17 | Matsushita Electric Works Ltd | 光放射評価方法 |
| JP2007271567A (ja) * | 2006-03-31 | 2007-10-18 | National Univ Corp Shizuoka Univ | カラーフィルタの色差安定波長特定方法及びプログラム |
| WO2010021258A1 (fr) * | 2008-08-22 | 2010-02-25 | コニカミノルタセンシング株式会社 | Dispositif photométrique/colorimétrique |
| WO2015182571A1 (fr) * | 2014-05-29 | 2015-12-03 | コニカミノルタ株式会社 | Dispositif de mesure de caractéristique optique et procédé de mesure de caractéristique optique |
| US20180082659A1 (en) * | 2016-09-22 | 2018-03-22 | Apple Inc. | Light Sensor With Spectral Sensing and Color Matching Function Channels |
Also Published As
| Publication number | Publication date |
|---|---|
| KR20230154273A (ko) | 2023-11-07 |
| CN117157510A (zh) | 2023-12-01 |
| JPWO2022220196A1 (fr) | 2022-10-20 |
Similar Documents
| Publication | Publication Date | Title |
|---|---|---|
| JP6676398B2 (ja) | ディスプレイ検査のための測色システム | |
| US8144322B2 (en) | Spectral characteristic measuring apparatus, method for calibrating spectral characteristic measuring apparatus, and spectral characteristic measuring system | |
| JP4660694B2 (ja) | 分光装置の波長校正方法及び分光装置 | |
| JP5534046B2 (ja) | 分光特性測定装置、分光特性測定装置の補正方法、およびプログラム | |
| US20030133117A1 (en) | Method of extended color sense and estimation for rgb led illuminants | |
| US7116417B2 (en) | Spectrometer and method for correcting wavelength displacement of spectrometer | |
| Ohno | Spectral colour measurement | |
| JP6733667B2 (ja) | 分光測色装置、および分光反射率の算出方法 | |
| JP2699688B2 (ja) | 誤差自己補正式色彩計 | |
| WO2022220196A1 (fr) | Dispositif de correction, instrument de mesure, procédé de correction et programme | |
| US9347823B2 (en) | Absolute measurement method and apparatus thereof for non-linear error | |
| JP2010203825A (ja) | モニタの分光分布測定方法 | |
| JP6555276B2 (ja) | 刺激値直読型の測色測光計 | |
| WO2021208349A1 (fr) | Procédé et système de mesure de réponse spectrale de photomètre à sphère d'intégration | |
| JP6631001B2 (ja) | 刺激値直読型の測色計 | |
| JP2015178995A (ja) | 色調校正装置、撮像装置及び色調検査装置 | |
| Eppeldauer et al. | Improved accuracy photometric and tristimulus-color scales based on spectral irradiance responsivity | |
| JP6565174B2 (ja) | 刺激値直読型の測色計 | |
| US10514300B2 (en) | Spectrocolorimetric device and conversation rule setting method | |
| CN217358748U (zh) | 一种提高光谱成像仪精确度的装置及光谱成像系统 | |
| US11976974B2 (en) | Spectrometer and computer program | |
| CN112014069B (zh) | 一种成像测量装置 | |
| Wang et al. | Fast and high-accuracy spectral measurements of LED by linear CCD sensor and software calibration | |
| Manoocheri et al. | 21.3: NIST Colorimetric Calibration Facility for Displays—Part 2 | |
| Brown et al. | NIST display colorimeter calibration facility |
Legal Events
| Date | Code | Title | Description |
|---|---|---|---|
| 121 | Ep: the epo has been informed by wipo that ep was designated in this application |
Ref document number: 22788121 Country of ref document: EP Kind code of ref document: A1 |
|
| ENP | Entry into the national phase |
Ref document number: 2023514630 Country of ref document: JP Kind code of ref document: A |
|
| ENP | Entry into the national phase |
Ref document number: 20237034736 Country of ref document: KR Kind code of ref document: A |
|
| WWE | Wipo information: entry into national phase |
Ref document number: 1020237034736 Country of ref document: KR |
|
| NENP | Non-entry into the national phase |
Ref country code: DE |
|
| 122 | Ep: pct application non-entry in european phase |
Ref document number: 22788121 Country of ref document: EP Kind code of ref document: A1 |