WO2021172042A1 - 制御装置 - Google Patents
制御装置 Download PDFInfo
- Publication number
- WO2021172042A1 WO2021172042A1 PCT/JP2021/005171 JP2021005171W WO2021172042A1 WO 2021172042 A1 WO2021172042 A1 WO 2021172042A1 JP 2021005171 W JP2021005171 W JP 2021005171W WO 2021172042 A1 WO2021172042 A1 WO 2021172042A1
- Authority
- WO
- WIPO (PCT)
- Prior art keywords
- deterioration rate
- cell
- deterioration
- value
- control device
- Prior art date
- Legal status (The legal status is an assumption and is not a legal conclusion. Google has not performed a legal analysis and makes no representation as to the accuracy of the status listed.)
- Ceased
Links
Images


Classifications
-
- G—PHYSICS
- G01—MEASURING; TESTING
- G01N—INVESTIGATING OR ANALYSING MATERIALS BY DETERMINING THEIR CHEMICAL OR PHYSICAL PROPERTIES
- G01N27/00—Investigating or analysing materials by the use of electric, electrochemical, or magnetic means
- G01N27/26—Investigating or analysing materials by the use of electric, electrochemical, or magnetic means by investigating electrochemical variables; by using electrolysis or electrophoresis
- G01N27/416—Systems
-
- G—PHYSICS
- G01—MEASURING; TESTING
- G01N—INVESTIGATING OR ANALYSING MATERIALS BY DETERMINING THEIR CHEMICAL OR PHYSICAL PROPERTIES
- G01N33/00—Investigating or analysing materials by specific methods not covered by groups G01N1/00 - G01N31/00
Definitions
- This disclosure relates to a control device for an exhaust gas sensor.
- An exhaust gas sensor for measuring the concentration of a specific gas contained in the exhaust gas is provided in the exhaust pipe of a vehicle having an internal combustion engine.
- the "specific gas” is, for example, a nitrogen oxide.
- an exhaust gas sensor one having a plurality of cells in which electrodes are formed on both sides of a solid electrolyte layer is known. In the cell, a current having a magnitude corresponding to the concentration of the component to be measured flows in a state where a voltage is applied between the electrodes. The exhaust gas sensor measures the concentration of the component to be measured based on the value of the current.
- an exhaust gas sensor having a configuration having a first cell and a second cell is known.
- oxygen contained in the exhaust gas is discharged in advance by the first cell arranged on the upstream side.
- a current flows according to the concentration of residual oxygen and nitrogen oxides contained in the exhaust gas after the oxygen is discharged.
- the current is also referred to as “output current”.
- the concentration of nitrogen oxides can be measured accurately by discharging oxygen in a larger amount than the nitrogen oxides from the exhaust gas in advance.
- the relationship between the concentration of the component to be measured and the output current may change due to cell deterioration. Therefore, in the gas sensor control device described in Patent Document 1 below, it is possible to calculate the deterioration rate, which is an index indicating the degree of deterioration occurring in the exhaust gas sensor. Specifically, after reducing the voltage applied to the first cell (pump cell) and temporarily increasing the amount of oxygen reaching the second cell (sensor cell), the second cell at that time The deterioration rate is calculated based on the slope of the change in output current.
- the slope of the change in output current from the second cell tends to decrease according to the degree of deterioration of the second cell. Therefore, when the slope of the change in the output current from the second cell becomes smaller than in the normal state, it can be determined that the second cell has deteriorated, that is, the deterioration rate of the exhaust gas sensor has increased.
- the deterioration of the second cell is caused by the components of the electrodes of the first cell on the upstream side evaporating and adhering to the electrodes of the second cell, and also by agglomeration of the electrodes of the second sensor due to the influence of temperature. Also occurs.
- the former deterioration is also referred to as “poisonous deterioration” below, and the latter deterioration is also referred to as “aggregation deterioration” below.
- the amount of decrease in the slope of the change in the output current from the second cell differs between the case of poisoning deterioration and the case of cohesive deterioration. ing. That is, the slope of the change in the output current from the second cell changes not only according to the degree of deterioration but also depending on the cause of deterioration.
- An object of the present disclosure is to provide a control device capable of accurately calculating the deterioration rate of an exhaust gas sensor.
- the control device is a control device for an exhaust gas sensor.
- the exhaust gas sensor to be controlled has a size corresponding to the first cell that discharges oxygen from the exhaust gas generated by the internal combustion engine and the concentration of residual oxygen contained in the exhaust gas after the oxygen is discharged by the first cell. It has a second cell that outputs a gas current.
- This control device is output from the first cell control unit that controls the discharge of oxygen by the first cell, the first acquisition unit that acquires the slope of the change in the current output from the second cell, and the second cell. Deterioration occurring in the exhaust gas sensor based on both the second acquisition unit that acquires the current convergence value, the slope acquired by the first acquisition unit, and the convergence value acquired by the second acquisition unit. It is provided with a deterioration rate calculation unit for calculating the deterioration rate, which is an index indicating the degree.
- the present inventors have found that the convergence value of the current output from the second cell after a certain period of time has passed since the oxygen discharge by the first cell is suppressed is the case where poisoning deterioration occurs and the cohesive deterioration. We have also obtained the finding that they are different from each other when Therefore, in the control device having the above configuration, the deterioration rate calculation unit deteriorates based on two parameters, the slope of the change in the current output from the second cell and the convergence value of the current output from the second cell. The rate is to be calculated. This makes it possible to accurately calculate the deterioration rate regardless of the cause of deterioration occurring in the exhaust gas sensor.
- a control device capable of accurately calculating the deterioration rate of the exhaust gas sensor is provided.
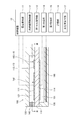
- FIG. 1 is a diagram schematically showing a configuration of a vehicle exhaust system provided with a control device and an exhaust gas sensor according to the first embodiment.
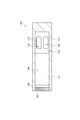
- FIG. 2 is a diagram schematically showing the configuration of the control device and the exhaust gas sensor according to the first embodiment.
- FIG. 3 is a cross-sectional view showing a section III-III of FIG.
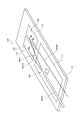
- FIG. 4 is a diagram for explaining the measurement principle of the exhaust gas sensor.
- FIG. 5 is a diagram showing an example of time change of the pump cell voltage and the like.
- FIG. 6 is a graph showing the time change of the sensor cell current.
- FIG. 7 is a graph showing the time change of the sensor cell current.
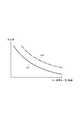
- FIG. 8 is a diagram showing a correspondence relationship between the first index and the first deterioration rate.
- FIG. 9 is a diagram showing a correspondence relationship between the second index and the second deterioration rate.
- FIG. 10 is a flowchart showing a flow of processing executed by the control device according to the first embodiment.
- FIG. 11 is a flowchart showing a flow of processing executed by the control device according to the second embodiment.
- FIG. 12 is a flowchart showing a flow of processing executed by the control device according to the third embodiment.
- FIG. 13 is a diagram showing a correspondence relationship between the first index and the deterioration rate.
- FIG. 14 is a flowchart showing a flow of processing executed by the control device according to the fourth embodiment.
- the control device 10 is configured as a device for controlling the exhaust gas sensor 100.
- FIG. 1 schematically shows an exhaust system of a vehicle provided with an exhaust gas sensor 100.
- an exhaust pipe 20 for guiding the exhaust gas discharged from the internal combustion engine EG to the outside is connected to the internal combustion engine EG of the vehicle.
- the exhaust gas sensor 100 is for measuring the concentration of nitrogen oxides contained in the exhaust gas, and is provided at a position in the middle of the exhaust pipe 20.
- the component to be detected by the exhaust gas sensor 100 is nitrogen oxide as described above, but a component other than nitrogen oxide may be used, for example, ammonia.
- an oxidation catalyst converter 22 is provided in the middle of the exhaust pipe 20.
- the oxidation catalyst converter 22 purifies harmful substances contained in the exhaust gas.
- An oxidation catalyst (not shown) is housed inside the oxidation catalyst converter 22.
- the oxidation catalyst is mainly composed of a ceramic carrier, an oxide mixture containing aluminum oxide, cerium dioxide and zirconium dioxide as components, and a noble metal catalyst such as platinum, palladium and rhodium.
- the oxidation catalyst oxidizes and purifies hydrocarbons, carbon monoxide, nitrogen oxides, etc. contained in the exhaust gas.
- a particulate filter for capturing fine particles may be contained inside the oxidation catalyst converter 22.
- the exhaust gas sensor 100 which is the control target of the control device 10, is provided at a position on the downstream side of the oxidation catalyst converter 22 in the exhaust pipe 20, and measures the concentration of nitrogen oxides in the exhaust gas at that position. It has become.
- the concentration of nitrogen oxides measured by the exhaust gas sensor 100 is transmitted to the control device 10.
- the control device 10 performs various controls on the internal combustion engine EG based on the measured concentration of nitrogen oxides.
- the control includes, for example, control for adjusting the ignition timing in the internal combustion engine EG.
- the control device 10 is configured as a device that controls the internal combustion engine EG in addition to the control of the exhaust gas sensor 100 described later. That is, the control device 10 also has a function as a so-called "engine ECU". Instead of such a mode, even if the control device 10 is configured as a dedicated device for controlling the exhaust gas sensor 100 and is a control device different from the engine ECU. good. In this case, the control device 10 contributes to the control of the internal combustion engine EG performed by the engine ECU by communicating with the engine ECU.
- FIG. 2 schematically shows a cross section of a portion of the exhaust gas sensor 100 that is arranged inside the exhaust pipe 20.
- the left side in FIG. 2, that is, the end on the side where the diffusion resistor 140 is arranged corresponds to the tip of the exhaust gas sensor 100 protruding inside the exhaust pipe 20.
- the exhaust gas sensor 100 includes a solid electrolyte body 110 and main bodies 120 and 130.
- the solid electrolyte body 110 is a plate-shaped member, and is made of a solid electrolyte material such as zirconia oxide.
- the solid electrolyte body 110 becomes oxygen ion conductive when it is in an active state of a predetermined temperature or higher.
- a pump cell 150, a sensor cell 160, and a monitor cell 170 are formed in the solid electrolyte body 110, respectively, and these plurality of cells will be described later.
- the main body portions 120 and 130 are both plate-shaped members, and are made of an insulator material containing alumina as a main component.
- the main bodies 120 and 130 are arranged so as to sandwich the above-mentioned solid electrolyte body 110 in between.
- a part of the surface on the solid electrolyte 110 side is recessed toward the side opposite to the solid electrolyte 110.
- the space is a space in which the exhaust gas to be measured is introduced.
- the space is also referred to as “measurement chamber 121”.
- a diffusion resistor 140 is arranged at the tip of the exhaust gas sensor 100.
- the measurement chamber 121 is open to the outside (that is, inside the exhaust pipe 20) via the diffusion resistor 140.
- the diffusion resistor 140 is made of a ceramic material such as alumina in which porous or pores are formed. By the action of the diffusion resistor 140, the flow rate of the exhaust gas drawn into the measuring chamber 121 is regulated.
- the exhaust gas that has flowed into the measurement chamber 121 through the diffusion resistor 140 is supplied to the pump cell 150, the sensor cell 160, and the monitor cell 170, which will be described later.
- the space is also referred to as "atmosphere chamber 131".
- a pump electrode 111, a sensor electrode 112, and a monitor electrode 113 are formed on the surface of the solid electrolyte body 110 that is in contact with the measurement chamber 121, respectively.
- the pump electrode 111 is formed at a position closer to the diffusion resistor 140 in the solid electrolyte 110.
- the sensor electrode 112 and the monitor electrode 113 are formed at positions of the solid electrolyte body 110 opposite to the diffusion resistor 140 with the pump electrode 111 sandwiched between them.
- the sensor electrode 112 and the monitor electrode 113 are arranged so as to be arranged along the depth direction of the paper surface in FIG. 2 (see FIG. 3).
- the pump electrode 111 and the monitor electrode 113 are formed of a Pt-Au alloy (platinum-gold alloy). All of these are electrodes that are active with respect to oxygen and inactive with respect to nitrogen oxides.
- the sensor electrode 112 is formed of a noble metal such as Pt (platinum) or Rh (rhodium), and is an electrode that is active against oxygen and also active against nitrogen oxides.
- a common electrode 114 is formed on the surface of the solid electrolyte body 110 that is in contact with the air chamber 131.
- the common electrode 114 is formed in a range that overlaps all of the pump electrode 111, the sensor electrode 112, and the monitor electrode 113 when viewed along the direction perpendicular to the solid electrolyte body 110 as shown in FIG. There is.
- the common electrode 114 is formed of a material containing Pt (platinum) as a main component.
- the portion of the pump electrode 111, the common electrode 114, and the solid electrolyte 110 sandwiched between the pump electrode 111 and the common electrode 114 is a portion that functions as a pump cell 150 for discharging oxygen from the exhaust gas. It has become.
- the pump cell 150 corresponds to the "first cell" in this embodiment.
- a current flows between the pump electrode 111 and the common electrode 114.
- the value of the current is a value proportional to the amount of oxygen discharged from the exhaust gas and a value proportional to the oxygen concentration of the exhaust gas. That is, it can be said that the pump cell 150 outputs a current having a magnitude corresponding to the oxygen concentration of the exhaust gas.
- the control device 10 can acquire the oxygen concentration of the exhaust gas existing in the measuring chamber 121 based on the value of the current.
- the voltage applied between the pump electrode 111 and the common electrode 114 is also referred to as “pump cell voltage” below.
- the current flowing between the pump electrode 111 and the common electrode 114 when the pump cell voltage is applied is also referred to as “pump cell current” below.
- the portion of the sensor electrode 112, the common electrode 114, and the solid electrolyte 110 sandwiched between the sensor electrode 112 and the common electrode 114 corresponds to the concentration of residual oxygen and nitrogen oxides contained in the exhaust gas. It is a part that functions as a sensor cell 160 that outputs a large amount of current in a state where a voltage is applied.
- the exhaust gas whose concentration of nitrogen oxides and residual oxygen is measured by the sensor cell 160 is the exhaust gas after the oxygen is discharged in the pump cell 150.
- the sensor cell 160 corresponds to the "second cell" in this embodiment.
- the voltage applied between the sensor electrode 112 and the common electrode 114 is also referred to as “sensor cell voltage” below. Further, the current flowing between the sensor electrode 112 and the common electrode 114 when the sensor cell voltage is applied is also hereinafter referred to as “sensor cell current”.
- the portion of the monitor electrode 113, the common electrode 114, and the solid electrolyte 110 sandwiched between the monitor electrode 113 and the common electrode 114 has a current having a magnitude corresponding to the concentration of residual oxygen contained in the exhaust gas. It is a part that functions as a monitor cell 170 that outputs.
- the exhaust gas whose residual oxygen concentration is measured by the monitor cell 170 is the exhaust gas after the oxygen is discharged in the pump cell 150.
- monitor cell voltage The voltage applied between the monitor electrode 113 and the common electrode 114 is also referred to as “monitor cell voltage” below. Further, the current flowing between the monitor electrode 113 and the common electrode 114 when the monitor cell voltage is applied is also hereinafter referred to as “monitor cell current”.
- a monitor cell 170 that outputs a current having a magnitude corresponding to the concentration of residual oxygen contained in the exhaust gas after oxygen is discharged by the pump cell 150, and a pump cell.
- a sensor cell 160 that outputs a current having a magnitude corresponding to the concentration of residual oxygen and nitrogen oxides contained in the exhaust gas after oxygen is discharged by 150 is arranged.
- the exhaust gas that has flowed into the measurement chamber 121 through the diffusion resistor 140 flows along the pump cell 150 and then is supplied to each of the sensor cell 160 and the monitor cell 170.
- FIG. 4 such an exhaust gas flow is schematically shown by a plurality of arrows.
- the arrow AR10 indicates the flow of oxygen discharged by the pump cell 150 after flowing into the measuring chamber 121 through the diffusion resistor 140.
- the arrow AR11 indicates the flow of oxygen reaching the sensor cell 160
- the arrow AR12 indicates the flow of oxygen reaching the monitor cell 170.
- the pump electrode 111 and the monitor electrode 113 are both electrodes that are inactive with respect to nitrogen oxides. Therefore, the nitrogen oxide contained in the exhaust gas flowing into the measurement chamber 121 is not discharged by the pump cell 150 or the monitor cell 170, and reaches the sensor electrode 112 of the sensor cell 160 as it is.
- the arrow AR20 indicates the flow of nitrogen oxides thus reaching the sensor cell 160.
- both the nitrogen oxide (arrow AR20) and the residual oxygen (arrow AR11) reach the sensor cell 160. Therefore, the magnitude of the sensor cell current indicates the concentration of nitrogen oxides and oxygen contained in the exhaust gas.
- the magnitude of the monitor cell current indicates the concentration of oxygen contained in the exhaust gas. Therefore, the current value obtained by subtracting the monitor cell current value from the sensor cell current value indicates the concentration of nitrogen oxides only. With such an exhaust gas sensor 100, it is possible to suppress the influence of oxygen contained in the exhaust gas and accurately measure the concentration of nitrogen oxides.
- a heater 180 is embedded in the main body 130.
- the heater 180 generates heat inside the main body 130 to heat each of the pump cell 150, the sensor cell 160, and the monitor cell 170.
- the heater 180 keeps the solid electrolyte 110 at a temperature at which it becomes active.
- the output of the heater 180 is adjusted by the control device 10.
- the configuration of the control device 10 will be described with reference to FIG.
- the control device 10 is configured as a computer system having a CPU, ROM, RAM, and the like.
- the control device 10 has a concentration detection unit 11, an internal combustion engine control unit 12, a first cell control unit 13, a first acquisition unit 14, a second acquisition unit 15, and a storage unit as block elements representing its functions. 16 and a deterioration rate calculation unit 17 are provided.
- the concentration detection unit 11 is a part that detects the concentration of nitrogen oxides contained in the exhaust gas based on each of the monitor cell current and the sensor cell current. As described above, the concentration detection unit 11 detects the concentration of nitrogen oxides based on the current value obtained by subtracting the value of the monitor cell current from the value of the sensor cell current.
- the internal combustion engine control unit 12 is a part that controls the internal combustion engine EG based on the concentration of nitrogen oxides detected by the concentration detection unit 11.
- the internal combustion engine control unit 12 adjusts the fuel injection amount of the internal combustion engine EG and the like so that the concentration of nitrogen oxides detected by the exhaust gas sensor 100 approaches zero.
- the control device 10 may be configured as a dedicated device for controlling the exhaust gas sensor 100, and may be a control device different from the engine ECU. In this case, the internal combustion engine control unit 12 is configured as a part of the engine ECU.
- the first cell control unit 13 is a part that controls the discharge of oxygen by the pump cell 150, which is the first cell, by changing the pump cell voltage.
- the first cell control unit 13 maintains the pump cell voltage at a substantially constant value.
- the first cell control unit 13 temporarily lowers the pump cell voltage.
- the first acquisition unit 14 is a part that performs a process of acquiring the slope of the change in the current output from the second cell, that is, the slope of the change in the sensor cell current.
- the second acquisition unit 15 is a portion that performs a process of acquiring the convergence value of the current output from the second cell, that is, the convergence value of the sensor cell current.
- the slope acquired by the first acquisition unit 14 and the convergence value acquired by the second acquisition unit 15 are used for calculating the deterioration rate, which will be described later.
- the storage unit 16 is a non-volatile storage device provided in the control device 10, and is specifically a flash memory.
- the storage unit 16 stores in advance information necessary for calculating the deterioration rate. The specific content of the information will be described later.
- the deterioration rate calculation unit 17 is a part that performs a process of calculating the deterioration rate of the exhaust gas sensor 100.
- the "deterioration rate" is an index indicating the degree of deterioration occurring in the exhaust gas sensor 100, and is calculated as a value larger as the deterioration of the exhaust gas sensor 100 progresses. In this embodiment, the deterioration rate is calculated as any value in the range of 0% to 100%. The specific calculation method of the deterioration rate will be described later.
- the deterioration rate calculated by the deterioration rate calculation unit 17 is used, for example, as an index for determining whether or not the exhaust gas sensor 100 is normal.
- the warning light provided on the vehicle can be turned on to urge the occupants to take measures such as replacement.
- the value of the concentration of nitrogen oxides acquired by the exhaust gas sensor 100 may be corrected by using the deterioration rate.
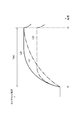
- FIG. 5A shows an example of a time change of the pump cell voltage when the deterioration rate is calculated.
- FIG. 5 (B) shows an example of the time change of the pump cell current.
- FIG. 5C shows an example of the time change of the sensor cell current.
- the normal control that is, the process for measuring the nitrogen oxide concentration is temporarily stopped at time t0, and the process for calculating the deterioration rate is started from time t0.
- the voltage applied to the pump cell 150 is changed from the initial VP1 to a lower VP0 (FIG. 5A).
- the process is performed by the first cell control unit 13.
- the oxygen discharge by the pump cell 150 is temporarily suppressed after the time t0.
- the pump cell current has decreased from the initial IP0 to an IP1 lower than this (Fig. 5 (B)).
- This decrease in the pump cell current means that the amount of oxygen passing through the pump cell 150 and reaching the sensor cell 160 has increased after time t0. Therefore, as shown by line L10 in FIG. 5C, the sensor cell current starts to increase from time t0, and finally converges to a substantially constant value.
- IP2 may be equal to the original value of IP0, but it is often slightly different from IP0 due to changes in the state of the internal combustion engine up to that point.
- the line L10 in FIG. 5C shows the time change of the sensor cell current in the normal state in which the sensor cell 160 is not deteriorated.
- the line L11 in the figure shows the time change of the sensor cell current when the sensor cell 160 is deteriorated.
- the deterioration rate can be calculated based on the slope of the change in the sensor cell current after the time t0. For example, if the correspondence between the slope of the change in the sensor cell current and the deterioration rate is created as a map in advance, the deterioration rate can be calculated based on the slope of the change in the sensor cell current by referring to the map. can.
- Line L20 in FIG. 6 shows the time change of the sensor cell current when the sensor cell 160 is not deteriorated, similarly to line L10 in FIG. 5 (C).
- the line L21 shows the time change of the sensor cell current when the sensor electrode 112 of the sensor cell 160 is poisoned and deteriorated.
- “Poisonous deterioration” is deterioration in which the performance of the sensor cell 160 deteriorates due to the components of the pump electrode 111 of the pump cell 150 evaporating and adhering to the sensor electrode 112 on the downstream side.
- the evaporation of Au (gold) contained in the pump electrode 111 may cause the above-mentioned poisoning deterioration.
- the line L22 in FIG. 6 shows the time change of the sensor cell current when the sensor electrode 112 of the sensor cell 160 is subjected to agglutination deterioration.
- the “aggregation deterioration” is a deterioration in which the performance of the sensor cell 160 deteriorates because the sensor electrode 112 of the sensor cell 160 aggregates due to the influence of temperature and the surface area thereof decreases.
- the present inventors reduce the slope of the change in the sensor cell current when poisoning deterioration occurs in the sensor cell 160, and the convergence value of the sensor cell current when cohesive deterioration occurs in the sensor cell 160. Has been found to decrease.
- the deterioration rate has been calculated based only on the slope of the change in the sensor cell current, regardless of the cause of the deterioration of the sensor cell 160. Therefore, for example, when agglomeration deterioration occurs, the deterioration rate is small because the slope of the change in the sensor cell current decreases only slightly, that is, there is almost no deterioration in the sensor cell 160. There was a possibility that the judgment would be made.
- the deterioration rate calculation unit 17 calculates the deterioration rate based on both the slope of the change in the sensor cell current and the convergence value of the sensor cell current. This makes it possible to accurately calculate the deterioration rate regardless of whether poisoning deterioration or agglutination deterioration occurs.
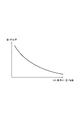
- FIG. 7 shows an example of a change in the sensor cell current during the period TM0 during which the oxygen discharge by the pump cell 150 is temporarily suppressed.
- the control device 10 acquires the waveform of such a change in the sensor cell current by sampling it at a predetermined cycle.
- the value of the sensor cell current at time t3 is shown as IS3.
- This IS3 is the value of the sensor cell current at the last timing of the period TM0.
- the period TM0 is a preset period as a period until the value of the sensor cell current converges to a substantially constant value, and is preferably set to any of 3 seconds to 10 seconds.
- the above IS3 corresponds to the value of the sensor cell current after a while has passed since the oxygen discharge by the pump cell 150 was suppressed, that is, the “convergence value” of the sensor cell current.
- IS3 is also referred to as "convergence value IS3".
- the second acquisition unit 15 of the control device 10 acquires the value of the sensor cell current acquired at the end timing of the period TM0 as the convergence value IS3.
- IS1 shown in FIG. 7 is a value of the sensor cell current set as a value of a predetermined ratio of the convergence value IS3.
- the value of this "predetermined ratio" is preferably set as any value from 0% to 50%.
- the timing at which the value of the sensor cell current reaches IS1 is shown as the time t1. Further, on the graph of FIG. 7, the point P1 corresponding to the time t1 is shown.
- IS2 shown in FIG. 7 is a value of the sensor cell current set as a value of a predetermined ratio of the convergence value IS3.
- the value of this "predetermined ratio" is preferably set as any value from 30% to 100%.
- the timing at which the value of the sensor cell current reaches IS2 is shown as the time t2.
- a point P2 corresponding to the time t2 is shown.
- the first acquisition unit 14 of the control device 10 calculates the slope of the change in the value of the sensor cell current during the period from time t1 to time t2 as “slope A1”.
- the slope A1 is the slope of a straight line connecting the points P1 and P2.
- A1 (IS2-IS1) / (t2-t1) It is calculated by the formula of.
- the slope A1 is calculated as the slope in a predetermined period.
- the inclination A1 may be calculated as an inclination at a predetermined timing.
- the slope at a predetermined timing is, for example, a differential coefficient at a specific time point in a graph showing a change in sensor cell current. That is, the slope A1 may be calculated after the length of the above "predetermined period" is brought close to 0 to the limit.
- the deterioration rate calculation unit 17 calculates the "first deterioration rate", which is one of the indexes indicating the degree of deterioration occurring in the exhaust gas sensor 100, based on the inclination A1.
- the first deterioration rate is used as an index indicating the degree of poisoning deterioration occurring in the sensor cell 160.
- the first deterioration rate takes a value from 0% to 100%, and is calculated as a larger value as the degree of poisoning deterioration occurring in the sensor cell 160 increases.
- a map as shown in FIG. 8 is stored in the storage unit 16 of the control device 10.
- the map of FIG. 8 is for calculating the first deterioration rate based on the slope A1.
- the vertical axis of FIG. 8 is the first deterioration rate. Shown on the horizontal axis of FIG. 8 is a "first index" obtained by dividing the slope A1 by the reference value of A1.
- the "reference value of A1" is an initial value of the inclination A1 acquired when the exhaust gas sensor 100 has not deteriorated.
- the first index shown on the horizontal axis of FIG. 8 can be said to be an index indicating the slope A1 acquired by the first acquisition unit 14.
- the correspondence relationship between the first index indicating the inclination A1 acquired by the first acquisition unit 14 and the first deterioration rate is preliminarily displayed as a map as shown in FIG. It is remembered. It should be noted that such a correspondence may be stored as a mathematical formula instead of a map.
- the deterioration rate calculation unit 17 calculates the "second deterioration rate", which is another index indicating the degree of deterioration occurring in the exhaust gas sensor 100, based on the convergence value IS3.
- the second deterioration rate is used as an index indicating the degree of agglutination deterioration occurring in the sensor cell 160.
- the second deterioration rate takes a value from 0% to 100%, and is calculated as a larger value as the degree of agglutination deterioration occurring in the sensor cell 160 increases.
- a map as shown in FIG. 9 is also stored in the storage unit 16 of the control device 10.
- the map of FIG. 9 is for calculating the second deterioration rate based on the convergence value IS3.
- the second deterioration rate is shown on the vertical axis of FIG. Shown on the horizontal axis of FIG. 9 is a "second index" obtained by dividing the convergence value IS3 by the reference value of the convergence value IS3.
- the "reference value of the convergence value IS3" is an initial value of the convergence value IS3 acquired when the exhaust gas sensor 100 does not deteriorate.
- the first index shown on the horizontal axis of FIG. 9 can be said to be an index indicating the convergence value IS3 acquired by the second acquisition unit 15.
- the correspondence relationship between the second index indicating the convergence value IS3 acquired by the second acquisition unit 15 and the second deterioration rate is as a map as shown in FIG. It is stored in advance. It should be noted that such a correspondence may be stored as a mathematical formula instead of a map.
- the deterioration rate calculation unit 17 calculates the first deterioration rate by referring to the correspondence relationship of FIG. 8 after acquiring the waveform of the sensor cell current as shown in FIG. 7, and refers to the correspondence relationship of FIG.
- the second deterioration rate is calculated by. After that, the larger value of the first deterioration rate and the second deterioration rate is calculated as the final deterioration rate.
- the deterioration rate calculation unit 17 performs the deterioration rate based on both the slope A1 acquired by the first acquisition unit 14 and the convergence value IS3 acquired by the second acquisition unit 15. Is calculated. Therefore, the deterioration rate can be accurately calculated regardless of whether poisoning deterioration or agglutination deterioration occurs.
- the deterioration rate calculation unit 17 calculates the first deterioration rate based on the slope A1 acquired by the first acquisition unit 14, and calculates the second deterioration rate based on the convergence value IS3 acquired by the second acquisition unit 15. Then, the deterioration rate is calculated based on the first deterioration rate and the second deterioration rate. Specifically, the deterioration rate calculation unit 17 calculates the larger value of the first deterioration rate and the second deterioration rate as the deterioration rate.
- the deterioration rate is based on the larger second deterioration rate. Can be calculated accurately.
- the storage unit 16 has a correspondence relationship between the first index indicating the slope A1 acquired by the first acquisition unit 14 and the first deterioration rate (FIG. 8), and a convergence value acquired by the second acquisition unit 15.
- Each of the second index indicating IS3 and the correspondence relationship with the second deterioration rate (FIG. 9) is stored. Therefore, it is possible to easily calculate each of the first deterioration rate and the second deterioration rate used for calculating the final deterioration rate.
- the pump electrode 111 of the pump cell 150 is formed of a Pt—Au alloy and contains gold. Since gold has a relatively low melting point, a part of gold may evaporate as the temperature of the pump cell 150 rises and adhere to the sensor electrode 112 of the sensor cell 160 on the downstream side.
- the exhaust gas sensor 100 having a configuration in which the electrode of the sensor cell 160 contains gold poisoning deterioration of the sensor cell 160 due to evaporation of gold is particularly likely to occur. Therefore, the merit of adopting the deterioration rate calculation method by the deterioration rate calculation unit 17 as described above is particularly great.
- the pump electrode 111 of the pump cell 150 and the sensor electrode 112 of the sensor cell 160 are arranged in the same measurement chamber 121. That is, they are arranged in the same space.
- “Arranged in the same space” means that the space in which the pump electrode 111 is arranged and the space in which the sensor electrode 112 is arranged are partitioned by a structure such as a porous body. It means that it has not been done.
- the specific flow of processing executed by the control device 10 in order to realize the calculation of the deterioration rate as described above will be described with reference to FIG.
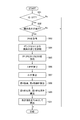
- the series of processes shown in FIG. 10 is repeatedly executed by the control device 10 every time a predetermined control cycle elapses.
- step S01 of the process it is determined whether or not the ignition switch of the vehicle is turned off.
- the ignition switch is ON, the series of processes shown in FIG. 10 is completed without calculating the deterioration rate.
- the ignition switch When the ignition switch is ON and the exhaust gas is discharged from the internal combustion engine EG, there is a possibility that the oxygen concentration around the exhaust gas sensor 100 is fluctuating. Under such circumstances, the slope of the change in the sensor cell current changes due to factors other than the deterioration rate, so it is difficult to accurately calculate the deterioration rate based on the slope of the change in the sensor cell current. Therefore, in the present embodiment, the calculation of the deterioration rate is prohibited when the ignition switch is ON.
- step S02 it is determined whether or not the predetermined environmental conditions are satisfied.
- the "environmental condition” is set in advance as a condition necessary for calculating the deterioration rate. In the present embodiment, it is set as an environmental condition that the value of the oxygen concentration around the exhaust gas sensor 100 is within a predetermined range and the magnitude of the fluctuation range of the oxygen concentration is not more than a predetermined value.
- the "oxygen concentration around the exhaust gas sensor 100" can be obtained based on the value of the pump cell current.
- step S03 If the environmental conditions are not met, it is difficult to accurately calculate the deterioration rate based on the slope of the change in the sensor cell current. Therefore, in this case, the series of processes shown in FIG. 10 is completed without calculating the deterioration rate. If the environmental conditions are satisfied, the process proceeds to step S03.
- step S03 a process of acquiring the value of the pump cell current is performed.
- the value of the pump cell current acquired here is acquired as the value of the pump cell current immediately before the suppression of oxygen discharge by the pump cell 150 is started, that is, the value of IP0 in FIG. 5 (B).
- step S04 the first cell control unit 13 starts suppressing the discharge of oxygen by the pump cell 150.
- the pump cell voltage is changed from the initial VP1 to a lower VP0.
- the period TM0 is started.
- the waveform of the change in the sensor cell current and the waveform of the change in the pump cell current are sampled by the control device 10 at predetermined cycles, respectively.
- This sampling is performed in the period from time t0 shown in FIG. 5 (B) to time t4.
- the time t4 is preset as a timing at which the value of the pump cell current stabilizes after the period TM0 ends and the pump cell voltage is returned to VP1.
- the period during which the value of the sensor cell current converges at the time of deterioration diagnosis that is, the length of the period TM0 from the time t0 to the time t3 is set to any of 3 seconds to 10 seconds, and the time t0.
- the length of the period from to time t4 is set to any of 15 seconds to 30 seconds. That is, in the present embodiment, sampling is executed for a period longer than the period TM0.
- step S05 the values of IP1 and IP2 shown in FIG. 5B are acquired from the sampled waveform of the change in the pump cell current.
- IP1 is the value of the pump cell current immediately before the end of the period TM0.
- step S05 the respective values of IS1, IS2, and IS3 shown in FIG. 7 are acquired from the sampled waveform of the change in the sensor cell current.
- the meaning of each value and the timing at which each value is acquired are as described above with reference to FIG. 7.
- the process of acquiring at least IS3 among these is performed by the second acquisition unit 15.
- step S06 the process of calculating ⁇ IP shown in FIG. 5 (B) is performed.
- the dotted line DL1 shown in FIG. 5B is a straight line showing the change when the value of the pump cell current changes from IP0 to IP2 with a constant slope in the period from time t0 to time t4. It can be said that the straight line indicates a change in the value of the pump cell current when the value of the pump cell voltage is kept constant at VP1.
- ⁇ IP which is the amount of change in the pump cell current, is calculated as the difference between the dotted line DL1 defined in this way and the value of the pump cell current (that is, IP1) immediately before the time t3.
- This ⁇ IP corresponds to the amount in which the discharge of oxygen by the pump cell 150 is suppressed. It can also be said that ⁇ IP corresponds to the amount of increase in oxygen reaching the sensor cell 160 with the start of the period TM0.
- step S08 the first index and the second index are calculated.
- the first index is calculated by dividing the slope A1 by the reference value of A1.
- the second index is calculated by dividing the convergence value IS3 by the reference value of the convergence value IS3.
- step S09 the deterioration rate calculation unit 17 performs a process of calculating each of the first deterioration rate and the second deterioration rate.
- the deterioration rate calculation unit 17 refers to the first deterioration rate by referring to the first index calculated in step S09 and the correspondence relationship in FIG. Further, the second deterioration rate is referred to by referring to the second index calculated in step S09 and the correspondence relationship in FIG.
- step S10 the deterioration rate calculation unit 17 calculates the final deterioration rate based on the first deterioration rate and the second deterioration rate calculated in step S09. Specifically, the larger value of the first deterioration rate and the second deterioration rate is calculated as the deterioration rate. As a result, the deterioration rate is accurately calculated regardless of whether poisoning deterioration or agglutination deterioration occurs.
- the second embodiment will be described.
- the present embodiment differs from the first embodiment only in the content of the processing executed by the control device 10.
- the points different from the first embodiment will be mainly described, and the points common to the first embodiment will be omitted as appropriate.
- step S01 to step S09 are the same as those shown in FIG.
- step S21 the deterioration rate calculation unit 17 calculates the final deterioration rate based on the first deterioration rate and the second deterioration rate calculated in step S09. Specifically, the total value of the first deterioration rate and the second deterioration rate is calculated as the deterioration rate. For example, if the first deterioration rate is calculated as 15% and the second deterioration rate is calculated as 15%, the final deterioration rate is calculated as 30%.
- the total value of the first deterioration rate and the second deterioration rate is calculated as the deterioration rate as described above.
- the final deterioration rate is calculated as a relatively large value, so that the replacement of the sensor cell 160 is promoted earlier. It becomes possible to take measures.
- the third embodiment will be described.
- the present embodiment differs from the first embodiment only in the content of the processing executed by the control device 10.
- the points different from the first embodiment will be mainly described, and the points common to the first embodiment will be omitted as appropriate.
- step S01 to step S09 are the same as those shown in FIG.
- step S31 it is determined whether or not the absolute value of the difference between the first deterioration rate and the second deterioration rate is equal to or less than a predetermined value.
- the process proceeds to step S32.
- step S32 means that neither poisoning deterioration nor cohesive deterioration has occurred in the sensor cell 160, or it is highly possible that these have occurred at the same time.
- the deterioration rate calculation unit 17 calculates the total value of the first deterioration rate and the second deterioration rate as the deterioration rate. Thereby, the same effect as that described in the second embodiment can be obtained.
- step S31 if the absolute value of the difference between the first deterioration rate and the second deterioration rate exceeds a predetermined value, the process proceeds to step S33.
- the transition to step S33 means that there is a high possibility that only one of poisoning deterioration and agglutination deterioration has occurred in the sensor cell 160. Therefore, in step S33, the deterioration rate calculation unit 17 calculates the larger value of the first deterioration rate and the second deterioration rate as the deterioration rate. This makes it possible to calculate an accurate deterioration rate according to the cause of the deterioration that has occurred.
- the deterioration rate calculation unit 17 determines the first deterioration rate and the second deterioration rate. Is calculated as the deterioration rate (step S32), and if the absolute value of the difference between the first deterioration rate and the second deterioration rate exceeds a predetermined value, it is the largest of the first deterioration rate and the second deterioration rate. The value of the one is calculated as the deterioration rate (step S33).
- the fourth embodiment will be described.
- the present embodiment differs from the first embodiment only in the content of the processing executed by the control device 10.
- the points different from the first embodiment will be mainly described, and the points common to the first embodiment will be omitted as appropriate.
- a plurality of correspondences between the first index and the deterioration rate are stored in the storage unit 16. These plurality of correspondences include a first correspondence shown by line L31 in FIG. 13 and a second correspondence shown by line L32.
- the deterioration rate calculation unit 17 selects one appropriate correspondence according to the situation from these plurality of correspondences, and calculates the deterioration rate using the selected correspondence.
- the first correspondence shown on line L31 is used when there is a high possibility that poisoning deterioration has occurred in the sensor cell 160.
- the second correspondence shown on line L32 is used when there is a high possibility that agglutination deterioration has occurred in the sensor cell 160.
- the deterioration rate calculation unit 17 selects one of these correspondences based on the second index indicating the convergence value IS3.
- the deterioration rate calculation unit 17 selects the second correspondence (line L32). This is used to calculate the deterioration rate.
- each of the plurality of correspondences stored in the storage unit 16 of the present embodiment corresponds to the value of the second index indicating the convergence value IS3. ..
- the correspondence between the first index indicating the inclination A1 acquired by the first acquisition unit 14 and the deterioration rate is acquired by the second acquisition unit.
- a plurality of indexes are stored for each index indicating the value IS3.
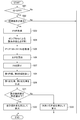
- step S01 to step S08 are the same as those shown in FIG.
- step S41 it is determined whether or not the second index calculated in step S08 is equal to or greater than the threshold value. If the second index is equal to or higher than the threshold value, the process proceeds to step S42.
- the transition to step S42 means that the value of the convergence value IS3 is relatively large and is maintained at a value close to the initial value when no deterioration has occurred. In this case, as in the example of line L21 in FIG. 6, there is a high possibility that poisoning deterioration has occurred in the sensor cell 160. Therefore, the deterioration rate calculation unit 17 selects the first correspondence relationship. After that, the deterioration rate calculation unit 17 calculates the deterioration rate corresponding to the first index calculated in step S08 as the final deterioration rate by using the selected first correspondence relationship.
- step S43 means that the value of the convergence value IS3 is relatively small, which is lower than the initial value when no deterioration has occurred.
- the deterioration rate calculation unit 17 selects the second correspondence. After that, the deterioration rate calculation unit 17 calculates the deterioration rate corresponding to the first index calculated in step S08 as the final deterioration rate by using the selected second correspondence relationship.
- the deterioration rate calculation unit 17 of the present embodiment selects one correspondence relationship based on the convergence value IS2 acquired by the second acquisition unit 15, and calculates the deterioration rate based on the correspondence relationship. do. Specifically, the deterioration rate calculation unit 17 selects one correspondence relationship based on the magnitude relationship between the index indicating the convergence value IS3 acquired by the second acquisition unit 15 and the predetermined threshold value. This makes it possible to accurately calculate the deterioration rate based on an appropriate correspondence relationship according to the cause of the deterioration that has occurred.
- each correspondence is set so as to be large.
- the second index may be used as in the present embodiment.
- a different index may be used.
- the absolute value of the difference between the acquired convergence value IS2 and the "reference value of the convergence value IS3" may be used as an index indicating the convergence value acquired by the second acquisition unit.
- the number of correspondences stored in the storage unit 16 may be two as in the present embodiment, but may be three or more.
- the deterioration rate calculation unit 17 can select one of the plurality of correspondences based on the index indicating the convergence value acquired by the second acquisition unit, and calculate the deterioration rate using this. good.
- the controls and methods described in the present disclosure are provided by configuring a processor and memory programmed to perform one or more functions embodied by a computer program. It may be realized by a computer.
- the control device and control method described in the present disclosure may be realized by a dedicated computer provided by configuring a processor including one or more dedicated hardware logic circuits.
- the control device and control method described in the present disclosure comprises a combination of a processor and memory programmed to perform one or more functions and a processor including one or more hardware logic circuits. It may be realized by one or more dedicated computers.
- the computer program may be stored on a computer-readable non-transitional tangible recording medium as an instruction executed by the computer.
- the dedicated hardware logic circuit and the hardware logic circuit may be realized by a digital circuit including a plurality of logic circuits or an analog circuit.
Landscapes
- Chemical & Material Sciences (AREA)
- Life Sciences & Earth Sciences (AREA)
- Health & Medical Sciences (AREA)
- Pathology (AREA)
- General Physics & Mathematics (AREA)
- Immunology (AREA)
- Physics & Mathematics (AREA)
- Analytical Chemistry (AREA)
- Biochemistry (AREA)
- General Health & Medical Sciences (AREA)
- Chemical Kinetics & Catalysis (AREA)
- Electrochemistry (AREA)
- Molecular Biology (AREA)
- Engineering & Computer Science (AREA)
- Food Science & Technology (AREA)
- Medicinal Chemistry (AREA)
- Exhaust Gas After Treatment (AREA)
- Measuring Oxygen Concentration In Cells (AREA)
- Combined Controls Of Internal Combustion Engines (AREA)
Applications Claiming Priority (2)
| Application Number | Priority Date | Filing Date | Title |
|---|---|---|---|
| JP2020-031805 | 2020-02-27 | ||
| JP2020031805A JP7234977B2 (ja) | 2020-02-27 | 2020-02-27 | 制御装置 |
Publications (1)
| Publication Number | Publication Date |
|---|---|
| WO2021172042A1 true WO2021172042A1 (ja) | 2021-09-02 |
Family
ID=77491410
Family Applications (1)
| Application Number | Title | Priority Date | Filing Date |
|---|---|---|---|
| PCT/JP2021/005171 Ceased WO2021172042A1 (ja) | 2020-02-27 | 2021-02-12 | 制御装置 |
Country Status (2)
| Country | Link |
|---|---|
| JP (1) | JP7234977B2 (https=) |
| WO (1) | WO2021172042A1 (https=) |
Families Citing this family (1)
| Publication number | Priority date | Publication date | Assignee | Title |
|---|---|---|---|---|
| JP2023070336A (ja) * | 2021-11-09 | 2023-05-19 | 株式会社デンソー | 制御装置 |
Citations (2)
| Publication number | Priority date | Publication date | Assignee | Title |
|---|---|---|---|---|
| JP2015059926A (ja) * | 2013-09-20 | 2015-03-30 | 株式会社デンソー | ガスセンサ制御装置 |
| JP2018200229A (ja) * | 2017-05-26 | 2018-12-20 | 株式会社デンソー | ガスセンサ制御装置 |
Family Cites Families (2)
| Publication number | Priority date | Publication date | Assignee | Title |
|---|---|---|---|---|
| JP4365830B2 (ja) | 2006-01-18 | 2009-11-18 | 株式会社日立製作所 | 内燃機関の空燃比センサ診断装置 |
| US9897028B2 (en) | 2013-06-26 | 2018-02-20 | Toyota Jidosha Kabushiki Kaisha | Diagnosis system of internal combustion engine |
-
2020
- 2020-02-27 JP JP2020031805A patent/JP7234977B2/ja active Active
-
2021
- 2021-02-12 WO PCT/JP2021/005171 patent/WO2021172042A1/ja not_active Ceased
Patent Citations (2)
| Publication number | Priority date | Publication date | Assignee | Title |
|---|---|---|---|---|
| JP2015059926A (ja) * | 2013-09-20 | 2015-03-30 | 株式会社デンソー | ガスセンサ制御装置 |
| JP2018200229A (ja) * | 2017-05-26 | 2018-12-20 | 株式会社デンソー | ガスセンサ制御装置 |
Also Published As
| Publication number | Publication date |
|---|---|
| JP7234977B2 (ja) | 2023-03-08 |
| JP2021135177A (ja) | 2021-09-13 |
Similar Documents
| Publication | Publication Date | Title |
|---|---|---|
| JP6744231B2 (ja) | 触媒劣化診断方法および触媒劣化診断システム | |
| CN105673165B (zh) | 催化剂劣化判断方法 | |
| JP5969433B2 (ja) | 内燃機関のSOx濃度検出装置 | |
| JP6149641B2 (ja) | ガスセンサ制御装置 | |
| JP7234976B2 (ja) | 制御装置 | |
| US20160061771A1 (en) | Gas concentration detecting device | |
| JP5981398B2 (ja) | 内燃機関のSOx濃度検出装置 | |
| US9891188B2 (en) | Gas concentration detecting device | |
| JP6421771B2 (ja) | 硫黄酸化物検出装置 | |
| JP6965578B2 (ja) | ガスセンサ制御装置 | |
| WO2021172042A1 (ja) | 制御装置 | |
| JP6344262B2 (ja) | 排気センサ | |
| JP2015036538A (ja) | 内燃機関の制御装置および制御方法 | |
| JP6927174B2 (ja) | 制御装置 | |
| US10731588B2 (en) | Control apparatus for exhaust gas sensor | |
| JP6708168B2 (ja) | ガスセンサ制御装置 | |
| JP2015105843A (ja) | ガスセンサ制御装置 | |
| WO2023085015A1 (ja) | 制御装置 | |
| JP4305291B2 (ja) | 濃度検出装置 | |
| WO2018221528A1 (ja) | ガスセンサ制御装置 | |
| WO2019235212A1 (ja) | 制御装置 | |
| JP7746580B2 (ja) | 測定ガス空間内のガスの少なくとも1つの割合を特定するセンサを動作させるための方法 | |
| JP5141576B2 (ja) | ガス濃度検出装置 | |
| JP2019124185A (ja) | 制御装置 | |
| JP6477514B2 (ja) | 硫黄酸化物検出装置 |
Legal Events
| Date | Code | Title | Description |
|---|---|---|---|
| 121 | Ep: the epo has been informed by wipo that ep was designated in this application |
Ref document number: 21761055 Country of ref document: EP Kind code of ref document: A1 |
|
| NENP | Non-entry into the national phase |
Ref country code: DE |
|
| 122 | Ep: pct application non-entry in european phase |
Ref document number: 21761055 Country of ref document: EP Kind code of ref document: A1 |