WO2021020016A1 - ガスセンサ素子およびガスセンサ - Google Patents
ガスセンサ素子およびガスセンサ Download PDFInfo
- Publication number
- WO2021020016A1 WO2021020016A1 PCT/JP2020/025956 JP2020025956W WO2021020016A1 WO 2021020016 A1 WO2021020016 A1 WO 2021020016A1 JP 2020025956 W JP2020025956 W JP 2020025956W WO 2021020016 A1 WO2021020016 A1 WO 2021020016A1
- Authority
- WO
- WIPO (PCT)
- Prior art keywords
- electrode
- solid electrolyte
- gas
- gas sensor
- detection electrode
- Prior art date
- Legal status (The legal status is an assumption and is not a legal conclusion. Google has not performed a legal analysis and makes no representation as to the accuracy of the status listed.)
- Ceased
Links
Images


Classifications
-
- G—PHYSICS
- G01—MEASURING; TESTING
- G01N—INVESTIGATING OR ANALYSING MATERIALS BY DETERMINING THEIR CHEMICAL OR PHYSICAL PROPERTIES
- G01N27/00—Investigating or analysing materials by the use of electric, electrochemical, or magnetic means
- G01N27/26—Investigating or analysing materials by the use of electric, electrochemical, or magnetic means by investigating electrochemical variables; by using electrolysis or electrophoresis
- G01N27/403—Cells and electrode assemblies
- G01N27/406—Cells and probes with solid electrolytes
- G01N27/407—Cells and probes with solid electrolytes for investigating or analysing gases
- G01N27/4075—Composition or fabrication of the electrodes and coatings thereon, e.g. catalysts
-
- G—PHYSICS
- G01—MEASURING; TESTING
- G01N—INVESTIGATING OR ANALYSING MATERIALS BY DETERMINING THEIR CHEMICAL OR PHYSICAL PROPERTIES
- G01N27/00—Investigating or analysing materials by the use of electric, electrochemical, or magnetic means
- G01N27/26—Investigating or analysing materials by the use of electric, electrochemical, or magnetic means by investigating electrochemical variables; by using electrolysis or electrophoresis
- G01N27/403—Cells and electrode assemblies
- G01N27/406—Cells and probes with solid electrolytes
- G01N27/407—Cells and probes with solid electrolytes for investigating or analysing gases
- G01N27/409—Oxygen concentration cells
Definitions
- the present disclosure relates to gas sensor elements and gas sensors.
- a gas sensor arranged in the exhaust pipe of an internal combustion engine for example, in order to detect a solid electrolyte composed of a zirconia solid electrolyte having oxygen ion conductivity and a concentration of a specific gas in the gas to be measured.
- a gas sensor element provided with the detection electrode of the above and a reference electrode provided on the other surface of the solid electrolyte body and exposed to the reference gas, and a gas sensor using the gas sensor element are known.
- a gas sensor element in which a detection electrode has a noble metal region composed of a noble metal, a solid electrolyte region composed of a solid electrolyte, and a mixed region in which a noble metal and a solid electrolyte are mixed the gas sensor.
- a gas sensor using an element is disclosed.
- the gas sensor is configured to measure the NOx concentration of the gas to be measured by a gas sensor element built in the gas sensor.
- the noble metal a noble metal containing at least platinum (Pt) and rhodium (Rh), which has high NOx decomposability, is used.
- the unevenly distributed rhodium affects the movement of oxygen ions (O2 - ions), and charges tend to be accumulated. That is, the electrode capacitance of the detection electrode becomes large. As the electrode capacitance of the detection electrode increases, the noise of the current increases and the static detection accuracy decreases. In addition, the hysteresis of the current also increases, and the dynamic detection accuracy during transient behavior such as a sudden change in NOx concentration decreases.
- An object of the present disclosure is to provide a gas sensor element capable of reducing the electrode capacitance of a detection electrode, and a gas sensor using the gas sensor element.
- One aspect of the present disclosure is a solid electrolyte composed of a zirconia solid electrolyte having oxygen ion conductivity.
- a detection electrode provided on one surface of the solid electrolyte body for detecting the concentration of a specific gas in the gas to be measured, and
- a gas sensor element provided on the other surface of the solid electrolyte body and provided with a reference electrode exposed to a reference gas.
- the detection electrode has a noble metal region composed of a noble metal containing at least platinum and rhodium, a solid electrolyte region composed of the solid electrolyte, and a mixed region in which the noble metal and the solid electrolyte coexist.
- the electrode capacitance of the detection electrode is predetermined in the dL Cartesian coordinate system represented by the width d of the mixed region and the ratio L of the rhodium unevenly distributed portion in the mixed region to the entire mixed region.
- a curve representing the correlation between the width d of the mixed region and the ratio L of the rhodium uneven distribution portion when it becomes a value is defined as a correlation curve.
- the width d of the mixed region and the ratio L of the rhodium uneven distribution portion are set from the region below the correlation curve. It is in the gas sensor element.
- Another aspect of the present disclosure is a gas sensor having the gas sensor element.
- the gas sensor element has the above configuration. Therefore, the gas sensor element can reduce the electrode capacitance of the detection electrode.
- the gas sensor has the gas sensor element capable of reducing the electrode capacitance of the detection electrode. Therefore, the gas sensor suppresses current noise and hysteresis by reducing the electrode capacitance of the detection electrode, and can detect the concentration of the specific gas in the gas to be measured with high accuracy.
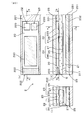
- FIG. 1 is a cross-sectional view of the gas sensor of the embodiment having the gas sensor element according to the first embodiment.
- 2A and 2B are cross-sectional views showing a detailed configuration of the gas sensor element according to the first embodiment
- FIG. 2A is a cross-sectional view taken along the line aa along the longitudinal direction of the gas sensor element
- FIG. 2B is a bb.
- the cross-sectional view taken along the line is a cross-sectional view taken along the line cc perpendicular to the longitudinal direction of the gas sensor element.
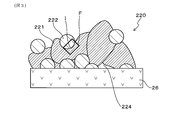
- FIG. 3 is an explanatory diagram schematically showing the fine structure of the detection electrode in the gas sensor element according to the first embodiment.
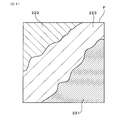
- FIG. 4 is an explanatory view schematically showing an enlarged portion F surrounded by a square in FIG.
- FIG. 5 is an explanatory diagram for explaining a method of measuring the width d of the mixed region.
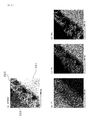
- 6A and 6B are explanatory views for explaining a method of measuring the ratio L of the rhodium uneven distribution portion, in which FIG. 6A is a STEM image of a mixed region, and FIG. 6B is an EDS mapping image of Zr element in the mixed region.
- c) is an example of an EDS mapping image of Pt element in the mixed region, and (d) is an example of an EDS mapping image of Rh element in the mixed region.
- FIG. 6A is a STEM image of a mixed region
- FIG. 6B is an EDS mapping image of Zr element in the mixed region.
- c) is an example of an EDS mapping image of Pt element
- FIG. 7 is an explanatory diagram for explaining a correlation curve showing the correlation between the width d of the mixed region and the ratio L of the rhodium uneven distribution portion when the electrode capacitance of the detection electrode becomes a predetermined value in the dL Cartesian coordinate system.
- FIG. 8 is an explanatory diagram showing an equivalent circuit model of the detection electrode when measuring the electrode capacitance of the detection electrode.
- FIG. 9 is an explanatory diagram schematically showing a Core-Cole plot diagram when measuring the electrode capacitance of the detection electrode.
- FIG. 10 is an explanatory diagram schematically showing a Bode diagram when measuring the electrode capacitance of the detection electrode.
- FIG. 11 is a diagram showing the relationship between the width d (nm) of the mixed region and the ratio L (%) of the rhodium uneven distribution portion obtained in the experimental example.
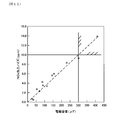
- FIG. 12 is a diagram showing the relationship between the electrode capacitance ( ⁇ F) of the detection electrode and the NOx output noise (ppm) obtained in the experimental example.
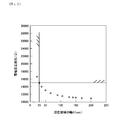
- FIG. 13 is a diagram showing the relationship between the width d (nm) of the mixed region and the electrode reaction resistance ( ⁇ ) of the detection electrode obtained in the experimental example.
- the gas sensor element of the present embodiment is provided on one surface of a solid electrolyte composed of a zirconia solid electrolyte having oxygen ion conductivity and a solid electrolyte, and detects the concentration of a specific gas in the gas to be measured. It is provided with a detection electrode for the purpose and a reference electrode provided on the other surface of the solid electrolyte body and exposed to the reference gas.
- the detection electrode has a noble metal region composed of a noble metal containing at least platinum (Pt) and rhodium (Rh), a solid electrolyte region composed of a solid electrolyte, and a mixed region in which the noble metal and the solid electrolyte are mixed. ing.
- the electrode capacitance of the detection electrode is set to a predetermined value.
- a curve representing the correlation between the width d of the mixed region and the ratio L of the rhodium uneven distribution portion is defined as a correlation curve.
- the width d of the mixed region and the ratio L of the rhodium uneven distribution portion are set from the region below the correlation curve.
- the width d of the mixed region and the ratio L of the rhodium uneven distribution portion are set from the region below the correlation curve in which the electrode capacitance of the detection electrode is a predetermined value, so that the electrode capacitance of the detection electrode is set. Can be reduced. This can be considered to be due to the following reasons.
- the detection electrode using a noble metal containing at least Pt and Rh contains two or more kinds of metal elements.
- separation of each metal element may occur due to the difference in diffusion rate of each metal element when a mixed region is generated at the interface between the noble metal region and the solid electrolyte region.
- the rhodium uneven distribution portion in which Rh is unevenly distributed among the separated metal elements inhibits the reoxidation of Zr generated by the reduction of ZrO 2 in the process of forming the mixed region. That is, when the rhodium uneven distribution portion increases, Rh is preferentially oxidized at the time of reoxidation, and the reoxidation of Zr is inhibited.
- the gas sensor of the present embodiment has the gas sensor element of the present embodiment capable of reducing the electrode capacitance of the detection electrode. Therefore, the gas sensor of the present embodiment suppresses current noise and hysteresis by reducing the electrode capacitance of the detection electrode, and can detect the concentration of the specific gas in the gas to be measured with high accuracy.
- gas sensor element and the gas sensor of the present embodiment are not limited by the following examples.
- the gas sensor 1 has a gas sensor element 2.
- the gas sensor 1 of the first embodiment can be, for example, a NOx sensor that detects the amount of nitrogen oxides (NOx).
- NOx nitrogen oxides
- Such a gas sensor 1 is used, for example, by being arranged in an exhaust pipe through which exhaust gas flows in an internal combustion engine.
- the gas to be measured G is an exhaust gas, and the specific gas whose concentration is to be detected is NOx.
- the specific gas in the measured gas G is NOx.
- the specific gas to be detected is not limited to NOx, and can be implemented as, for example, a gas sensor that detects ammonia or other gas by selecting an appropriate element for the constituent material of the solid electrolyte or the electrode. ..
- the gas sensor 1 is installed in the exhaust passage of an internal combustion engine in a vehicle. Exhaust gas flowing through the exhaust passage is introduced into the gas sensor 1 as the gas to be measured G. As a result, the gas sensor 1 measures the NOx concentration of the gas G to be measured by the gas sensor element 2 built in the gas sensor 1.
- the gas sensor 1 includes a sensor housing 101, an insulating insulator 102, element covers 103A, 103B, 103C, and a sensor harness 104 in addition to the gas sensor element 2.
- FIG. 1 shows an example in which the sensor control circuit 105 is connected to the sensor harness 104. Note that Y in FIG. 1 indicates the gas flow direction in which the gas to be measured G flows inside the gas sensor element 2.
- the sensor housing 101 holds the gas sensor element 2 inside via an insulating insulator 102.
- the element covers 103A, 103B, and 103C are fixed to the sensor housing 101.
- the element covers 103A and 103B cover the outer peripheral side of the upstream element end portion 10a of the gas sensor element 2 in the gas flow direction Y.
- the element covers 103A and 103B have gas introduction holes 103a and 103b in order to introduce the exhaust gas from the exhaust pipe as the gas to be measured G into the upstream element end portion 10a housed therein.
- the element cover 103C covers the outer peripheral side of the downstream element end portion 10b of the gas sensor element 2 in the gas flow direction Y.
- the element cover 103C has an atmosphere introduction hole 103c for introducing the atmosphere as the reference gas A into the downstream element end portion 10b housed therein.
- a plurality of sensor harnesses 104 are provided across the inside and outside of the element cover 103C.
- the sensor control circuit 105 is connected to the gas sensor element 2 via a plurality of sensor harnesses 104 outside the sensor housing 101 and the element cover 103C.
- the sensor control circuit 105 in the first embodiment controls the supply of voltage to the detection cell 22, the monitor cell 23, and the pump cell 24, which will be described later.
- the gas sensor element 2 includes a measurement gas chamber 20, a reference gas chamber 21, a detection cell 22, a monitor cell 23, a pump cell 24, and a heater 25.
- the gas sensor element 2 is configured by laminating a heater 25, a solid electrolyte body 26 described later, and an insulating layer 28.
- the measurement gas chamber 20 is formed as a space surrounded by the solid electrolyte body 26 and the insulating layer 28, and the reference gas chamber 21 is formed as a space surrounded by the heater 25 and the solid electrolyte body 26.
- each element of the gas sensor element 2 will be described in detail.
- the measurement gas chamber 20 is a space in which the exhaust gas as the gas to be measured G is introduced.
- the measurement gas chamber 20 is formed as a space sandwiched between the solid electrolyte body 26 and the insulating layer 28.
- the insulating layer 28 is plate-shaped and is laminated on the plate-shaped solid electrolyte body 26 via the first spacer 201.
- the first spacer 201 has a C shape with one side open, whereby the measurement gas chamber 20 has a box shape with a part open.
- the opened portion is referred to as an exhaust gas introduction port 202.
- a diffusion resistor 203 is arranged at the introduction port 202 in the present embodiment, and the exhaust gas passes through the diffusion resistor 203 and is introduced into the measurement gas chamber 20. Therefore, the exhaust gas is introduced into the measurement gas chamber 20 by the diffusion resistor 203 under a predetermined diffusion resistance.
- the solid electrolyte body 26 is composed of a zirconia solid electrolyte having oxygen ion conductivity. Specifically, for example, yttria-stabilized zirconia (YSZ) or the like can be adopted as the solid electrolyte. As the solid electrolyte, for example, calcium oxide-stabilized zirconia, alumina-stabilized zirconia, or the like can also be adopted. Alumina and other generally known insulators can be used for the above-mentioned insulating layer 28 and the first spacer 201.
- the reference gas chamber 21 is a space into which the reference gas A for generating the reference potential for calculating the concentration of NOx, which is a specific gas, is introduced.
- the atmosphere is introduced into the reference gas chamber 21 as the reference gas A.
- the reference gas chamber 21 is formed as a space sandwiched between the heater 25 and the solid electrolyte body 26.
- the solid electrolyte body 26 is laminated on the heater 25 formed in a plate shape via the second spacer 211.
- the second spacer 211 is formed on the side where the diffusion resistor 203 is formed, and the reference gas A introduction port (not shown) is the introduction port 202 of the measurement gas chamber 20. Is designed to open on the opposite side.
- the solid electrolyte body 26 is formed so as to separate the measurement gas chamber 20 and the reference gas chamber 21, and is exposed to both the measurement gas chamber 20 and the reference gas chamber 21.
- oxygen ions move in the solid electrolyte body 26 according to the difference between the NOx concentration in the exhaust gas and the NOx concentration in the atmosphere, and a sensor current is generated.
- the detection cell 22 has a detection electrode 220, a solid electrolyte body 26, and a reference electrode 27.
- the detection electrode 220 is formed on one surface of the solid electrolyte body 26 exposed to the measurement gas chamber 20.
- the reference electrode 27 is formed on one surface of the solid electrolyte body 26 exposed to the reference gas chamber 21. That is, in the detection cell 22, the solid electrolyte body 26 is sandwiched between the detection electrode 220 and the reference electrode 27.
- the monitor cell 23 and the pump cell 24, which will be described later, also include the solid electrolyte body 26 and the reference electrode 27 as components, but in the first embodiment, the detection cell 22, the monitor cell 23, and the pump cell 24 are the solid electrolyte body 26 and the pump cell 24.
- the reference electrode 27 is shared.
- the detection electrode 220 contains a noble metal containing platinum (Pt) and rhodium (Rh), and a solid electrolyte having the same composition as the solid electrolyte constituting the solid electrolyte body 26. That is, the detection electrode 220 is an electrode composed of platinum and rhodium acting as catalysts and a zirconia solid electrolyte having oxygen ion conductivity.
- the solid electrolyte contained in the detection electrode 220 is integrally bonded with the solid electrolyte body 26 constituting the detection cell 22, and is in a state where ion conduction is possible between the solid electrolytes.
- NOx contained in the exhaust gas introduced into the measurement gas chamber 20 is adsorbed on the surface of the exposed noble metal and ionized into nitrogen ions and oxygen ions by catalytic action.
- oxygen ions conduct in the solid electrolyte contained in the detection electrode 220.
- This charge is further conducted to the solid electrolyte body 26, which is detected as a sensor current. Then, the concentration of NOx is detected based on the magnitude of the sensor current.
- the detailed microstructure of the detection electrode 220 will be described later.
- the monitor cell 23 has a monitor electrode 230, a solid electrolyte body 26, and a reference electrode 27. As described above, the monitor cell 23 shares the solid electrolyte body 26 and the reference electrode 27 with the detection cell 22.
- the monitor electrode 230 is formed on one surface of the solid electrolyte body 26 exposed to the measurement gas chamber 20.
- the monitor electrode 230 is, for example, an electrode containing platinum (Pt) and gold (Au), and although it does not have the ability to decompose NOx, it can decompose oxygen molecules so that a current caused by oxygen ions flows. It has become.
- the monitor electrode 230 is formed adjacent to the detection electrode 220 in a direction orthogonal to the flux direction of the exhaust gas flowing from the introduction port 202 to the detection cell 22. That is, the detection electrode 220 and the monitor electrode 230 are under the same exposure conditions with respect to the flux of the exhaust gas uniformly introduced into the measurement gas chamber 20.
- the monitor cell 23 detects the concentration of residual oxygen contained in the exhaust gas after the oxygen concentration is adjusted by the pump cell 24. Specifically, the monitor cell 23 detects the current flowing through the solid electrolyte body 26 caused by the residual oxygen. In this gas sensor element 2, by subtracting the output of the monitor cell 23 from the output of the detection cell 22, the offset of the output of the detection cell 22 due to residual oxygen can be canceled and the NOx concentration can be detected. It has become.
- the pump cell 24 is located upstream of the detection cell 22 and the monitor cell 23 in introducing the exhaust gas.
- the pump cell 24 has a pump electrode 240, a solid electrolyte body 26, and a reference electrode 27.
- the pump electrode 240 is formed on one surface of the solid electrolyte body 26 exposed to the measurement gas chamber 20.
- the pump electrode 240 is an electrode containing platinum (Pt) and gold (Au), and reduces oxygen to generate oxygen ions.
- the oxygen ion is conducted through the solid electrolyte body 26, moves to the reference electrode 27 side, and is discharged to the reference gas chamber 21.
- the pump cell 24 is a cell that adjusts the oxygen concentration in the measurement gas chamber 20 by its pumping action.
- the pump cell 24 adjusts the oxygen concentration in the exhaust gas on the upstream side with respect to the flow of the exhaust gas, and the detection cell 22 and the monitor cell 23 adjust the current caused by NOx with respect to the exhaust gas after the oxygen concentration is adjusted. And the current caused by residual oxygen is output respectively.
- the pump cell 24 in the first embodiment has a function of decomposing a substance existing in the exhaust gas to generate a reducing gas. Specifically, the pump cell 24 decomposes water molecules contained in the exhaust gas to generate hydrogen gas. Hydrogen gas has a reducing property, and when this function is used when the gas sensor element 2 is started, oxygen stored in the detection electrode 220 is reduced and removed.
- the heater 25 maintains the temperature of the solid electrolyte body 26 at a temperature of 600 ° C. or higher to function as a solid electrolyte.
- the heater 25 is formed by providing a conductor layer 252 that generates heat by energization between the ceramic substrates 251.
- the conductor layer 252 is formed so as to overlap the solid electrolyte body 26 when the surface on which the various electrodes 220, 230, 240, 27 are formed is viewed from the front, and at least the various electrodes 220, 230, 240, 27 are formed. It is possible to maintain the temperature of the portion where the is formed and its vicinity at the active temperature.
- the temperature distribution of the solid electrolyte body 26 realized by the heater 25 can be appropriately set according to the required performance, and the routing of the conductor layer 252 is set according to the required temperature distribution. Can be done.
- the detection electrode 220 includes a noble metal region 221 composed of a noble metal containing at least platinum and rhodium, a solid electrolyte region 222 composed of a solid electrolyte, and a noble metal and a solid electrolyte.
- a mixed region 223 in which Further, as illustrated in FIG. 3, the detection electrode 220 has pores 224.
- the solid electrolyte constituting the solid electrolyte region 222 is specifically composed of a solid electrolyte having the same composition as the solid electrolyte constituting the solid electrolyte body 26.
- the mixed region 223 is formed along the interface I between the noble metal region 221 and the solid electrolyte region 222. Further, the mixed region 223 can be specifically composed of a Pt—Rh alloy and ZrO 2 .
- the width of the mixed region 223 is d.
- the width d of the mixed region 223 is measured as follows. As illustrated in FIG. 5, five visual fields of reflected electron images of a cross section along the thickness direction of the detection electrode 220 are acquired by observation with a scanning electron microscope (SEM). At this time, the observation magnification is 100,000 times. Next, for each of the acquired backscattered electron images, the shortest distance between the interface I1 between the mixed region 223 and the noble metal region 221 and the interface I2 between the mixed region 223 and the solid electrolyte region 222 is set at 10 points at equal intervals. Measure. The average value of the obtained measured values for the five visual fields (that is, the measured values at a total of 50 points) is defined as the width d (nm) of the mixed region 223.
- L be the ratio of the rhodium uneven distribution portion in the mixed region 223 to which the rhodium is unevenly distributed with respect to the entire mixed region 223.
- the ratio L of the rhodium uneven distribution portion is measured as follows. Using a scanning transmission electron microscope (STEM) and an energy dispersive X-ray analysis (EDS) device, one field of view is EDS point analysis (measurement range: diameter 10 nm) for the mixed region 223 in the cross section along the thickness direction of the detection electrode 220. 20 points or more per (magnification: for example, 200,000 times).
- FIG. 6 (a) shows an example of an STEM image of a mixed region
- FIG. 6 (b) shows an example of an EDS mapping image of Zr element in a mixed region
- FIG. 6 (c) shows an EDS mapping image of Pt element in a mixed region
- FIG. 6D shows an example of an EDS mapping image of the Rh element in the mixed region.
- the points to be analyzed for example, eight lines can be drawn at equal intervals in each of the vertical and horizontal directions of the image, and the points to be analyzed can be determined from the line intersections in the mixed region 223. At this time, the number of lines can be increased or decreased as necessary so that the number of points to be analyzed is 20 or more.
- the Rh ratio at each measurement point is calculated from the following formula 1.
- Rh ratio (%) 100 ⁇ (Rh [wt%]) / (Rh [wt%] + Pt [wt%]) ... Equation 1
- the measurement points where the Rh ratio exceeds 80% are defined as the rhodium uneven distribution portion, and the ratio of the rhodium uneven distribution portion to the total number of measurement points is calculated from the following formula 2, and the calculated value is the ratio L (%) of the rhodium uneven distribution portion. ).
- Rhodium uneven distribution ratio L (%) 100 ⁇ (points of measurement points where Rh ratio exceeds 80%) / (total number of measurement points) ... Equation 2
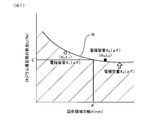
- the mixed region when the electrode capacitance of the detection electrode 220 becomes a predetermined value As illustrated in FIG. 7, in the dL Cartesian coordinate system represented by the width d of the mixed region 223 and the ratio L of the rhodium uneven distribution portion, the mixed region when the electrode capacitance of the detection electrode 220 becomes a predetermined value.
- a curve representing the correlation between the width d of 223 and the ratio L of the rhodium uneven distribution portion is defined as the correlation curve R.
- the horizontal axis is the width d of the mixed region 223, and the vertical axis is the ratio L of the rhodium uneven distribution portion.
- the correlation curve R has the width d of the mixed region 223 as the horizontal axis, plots the ratio L of the rhodium uneven distribution portion at least two points or more, and performs multiple regression analysis from the electrode capacitance of the detection electrode 220 at each plot point. It can be obtained by obtaining a correlation line having the same electrode capacitance at. That is, the correlation curve R can be obtained by obtaining the correlation line having the same electrode capacitance by multiple regression analysis using the coordinates of at least two points consisting of the combination of the width d of the mixed region 223 and the ratio L of the rhodium uneven distribution portion. Can be done. More specifically, in FIG.
- a correlation curve R having the same electrode capacitance X 2 ( ⁇ F) is obtained by multiple regression analysis using two plot points ( 3 , L 3 ).
- the number of coordinates of the plot points in the multiple regression analysis can be preferably 3 or more from the viewpoint of obtaining a higher correlation.
- the electrode capacitance of the detection electrode 220 can be obtained by performing an equivalent circuit fitting on the Core-Cole plot using an impedance analyzer. Specifically, the measurement of the electrode capacitance of the detection electrode 220 is performed at the sensor operating temperature of 700 to 900 ° C. and in a NO gas atmosphere (for example, 2000 ppm).
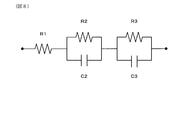
- FIG. 8 shows an equivalent circuit model of the detection electrode 220.
- FIG. 9 shows a schematic diagram of a Core-Cole plot diagram.
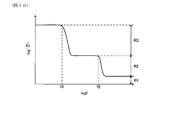
- FIG. 10 shows a schematic diagram of a Bode diagram.
- R1 is the intragranular resistance of the solid electrolyte.
- R2 is the grain boundary resistance between the noble metal particles of the electrode and the solid electrolyte particles.
- R3 is the total of the interfacial resistance between the noble metal particles of the electrode and the gas, the resistance due to the adsorption of NO gas molecules, and the resistance due to surface diffusion, that is, the electrode reaction resistance.
- C2 is the capacitance of the grain boundary between the noble metal particles of the electrode and the solid electrolyte particles.
- C3 is the capacitance at the interface between the noble metal particles of the electrode and the gas.
- the resistance (R1, R2, R3) can be obtained from the chord of each semicircle in the Core-Cole plot diagram.
- the electrode capacitance C e of the detection electrodes 220 can be calculated from the following equation.
- the correlation curve R is a curve in which the proportion L of the rhodium uneven distribution portion decreases as the width d of the mixed region 223 increases. Further, the correlation curve R is located higher as the electrode capacitance of the detection electrode 220 increases, and is located lower as the electrode capacitance of the detection electrode 220 decreases. Therefore, for example, when there is a request to set the electrode capacitance of the detection electrode 220 to a predetermined value or less, the electrode capacitance of the detection electrode 220 is set to be within the region below the correlation curve R when the predetermined value is reached.
- the width d of the mixed region 223 and the ratio L of the rhodium uneven distribution portion may be set. More specifically, as shown in FIG.
- Rhodium so as to be smaller than the ratio L'of the rhodium uneven distribution portion when the width of the mixed region 223 is d', which is obtained from the correlation curve R when the electrode capacitance of the detection electrode 220 becomes a predetermined value (X2).
- the ratio of the uneven distribution portion may be set.
- the electrode capacitance of the detection electrode 220 when there is a request for the electrode capacitance of the detection electrode 220 to be a predetermined value (for example, X2) or less and the ratio of the rhodium uneven distribution portion is L', the electrode capacitance of the detection electrode 220 is a predetermined value (X2). ),
- the width of the mixed region 223 may be set so as to be smaller than the width d'of the mixed region 223 when the ratio of the rhodium uneven distribution portion is L'.
- the detection electrode 220 has a configuration in which the width d of the mixed region 223 and the ratio L of the rhodium uneven distribution portion are set from the region below the correlation curve R when the electrode capacitance of the detection electrode 220 is 300 ⁇ F. Can be.
- the low frequency noise from the outside is amplified by the electrode capacitance of the detection electrode 220. Therefore, by reducing the electrode capacitance of the detection electrode 220, NOx output noise is reduced and the static accuracy of NOx output is improved. Further, when an electric charge is accumulated in the electrode capacitance of the detection electrode 220, the current value is delayed with respect to the voltage change when there is a transient voltage change, and hysteresis occurs. Therefore, the dynamic accuracy of NOx output is improved by reducing the electrode capacitance of the detection electrode 220.
- the detection electrode 220 is preferably configured such that the width d of the mixed region 223 and the ratio L of the rhodium uneven distribution portion are set from the region below the correlation curve R when the electrode capacitance of the detection electrode 220 is 250 ⁇ F.
- the width d of the mixed region 223 and the ratio L of the rhodium uneven distribution portion are set from the region below the correlation curve R when the electrode capacitance of the detection electrode 220 is 200 ⁇ F, and more preferably the detection electrode.
- the width d of the mixed region 223 and the ratio L of the rhodium uneven distribution portion can be set from the region below the correlation curve R when the electrode capacitance of 220 is 150 ⁇ F.
- the width d of the mixed region 223 can be 30 nm or more. According to this configuration, it becomes easy to make a sufficient amount of the three-phase interface between the gas phase containing the specific gas in the gas to be measured G in the mixed region 223, the noble metal region 221 and the solid electrolyte region 222. Therefore, it becomes easy to reduce the electrode reaction resistance of the detection electrode 220, and the activity of the detection electrode 220 can be improved.
- the width d of the mixed region 223 can be preferably 40 nm or more, more preferably 50 nm or more, and further preferably 100 nm or more from the viewpoint of improving the activity of the detection electrode 220.
- Rh has a reducing property, it has a property of agglutinating and stabilizing, and when a heat load is applied by maintaining a high temperature, Rh particles aggregate with each other and the reaction resistance increases. If the width d of the mixed region 223 becomes too large, condensation will proceed more easily. From the viewpoint of durability against heat load due to high temperature maintenance, the width d of the mixed region 223 is preferably 3000 nm or less, more preferably 2000 nm or less, still more preferably 1500 nm or less, and even more preferably 1000 nm or less. be able to.
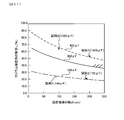
- the electrode reaction resistance of the detection electrode 220 can be specifically 15000 ⁇ or less. According to this configuration, it becomes easy to obtain a highly active and highly accurate NOx output.
- the electrode reaction resistance of the detection electrode 220 is R3 described in the above-mentioned measurement of the electrode capacitance of the detection electrode 220, and this R3 can be calculated together with the measurement of the electrode capacitance of the detection electrode 220. Further, as shown in the experimental example described later, the electrode reaction resistance of the detection electrode 220 can be set to 15000 ⁇ or less by setting the width d of the mixed region 223 to 30 nm or more.
- the electrode reaction resistance of the detection electrode 220 can be preferably 14000 ⁇ or less, more preferably 13000 ⁇ or less, still more preferably 12000 ⁇ or less, from the viewpoint of improving the accuracy of NOx output. Since the smaller the electrode reaction resistance of the detection electrode 220 is, the better, the lower limit is not particularly limited.
- the noble metal contained in the detection electrode 220 can be configured to contain 30 to 70% by mass of rhodium and 70 to 30% by mass of platinum.
- the noble metal contained in the detection electrode 220 can be made of a Pr—Rh alloy containing 30 to 70% by mass of rhodium and 70 to 30% by mass of platinum. According to these configurations, the balance between the NOx decomposability by Rh and the securing of the peel strength of the detection electrode 220 by the oxidative expansion of Rh is excellent.
- the monitor cell 23 is not an essential configuration from the viewpoint of detecting the concentration of the specific gas in the gas to be measured G.
- the space in which the detection cell 22 is formed and the space in which the pump cell 24 is formed may be configured to be separated so that the gas to be measured G can come and go.
- the gas sensor element 2 may have a configuration in which a diffusion rate-determining body (not shown) is formed between the space in which the detection cell 22 is formed and the space in which the pump cell 24 is formed.
- the detection electrode 220 can be formed, for example, as follows. A mixture containing noble metal particles containing at least Pt and Rh such as Pt—Rh alloy particles, zirconia-like solid electrolyte particles such as yttria-stabilized zirconia particles, and, if necessary, a pore-forming agent is added to the solid electrolyte 26. Apply to the surface and bake in a nitrogen atmosphere. Next, a voltage is applied between the baked detection electrode 220 (strictly speaking, the electrode before becoming the detection electrode 220) and the reference electrode 27 in a nitrogen gas atmosphere to perform an energization process.
- Pt—Rh alloy particles zirconia-like solid electrolyte particles such as yttria-stabilized zirconia particles
- a pore-forming agent is added to the solid electrolyte 26. Apply to the surface and bake in a nitrogen atmosphere.
- a voltage is applied between the baked detection electrode 220 (strictly speaking, the electrode before becoming the detection electrode 220) and the reference
- the gas sensor element of each sample contained a Pt—Rh alloy, yttria-stabilized zirconia, and pores as the detection electrode, as shown in FIG. 6 above. It is composed of a noble metal region composed of a Pt—Rh alloy, a solid electrolyte region composed of yttria-stabilized zirconia, and a mixed region in which a Pt—Rh alloy and yttria-stabilized zirconia are mixed. It was confirmed that there was.
- the width d of the mixed region and the ratio L of the rhodium uneven distribution portion were measured according to the above-mentioned measurement method.
- the value of the ratio L of the rhodium uneven distribution portion was plotted with the width d of the mixed region as the horizontal axis.
- the electrode capacitance of the detection electrode is set as the objective variable y
- the width d of the mixed region and the ratio L of the rhodium uneven distribution portion are set as explanatory variables (x 1 , x).
- the following multiple regression equation was obtained by performing multiple regression analysis as 2 ).
- the proportion L of the rhodium uneven distribution portion decreases as the width d of the mixed region increases.
- the correlation curve is located upward as the electrode capacitance of the detection electrode increases, and is located downward as the electrode capacitance of the detection electrode decreases. From this result, when there is a request to set the electrode capacitance of the detection electrode to a predetermined value or less, the region below the correlation curve (negative side of the correlation curve) where the electrode capacitance of the detection electrode becomes the predetermined value is the mixed region. It can be seen that by setting the width d and the ratio L of the rhodium uneven distribution portion, the electrode capacitance can be reduced more than the electrode capacitance of the correlation curve.
- the coordinates (c, d) in which the width d of the mixed region and the ratio L of the rhodium uneven distribution portion are combined are on the negative side with respect to the width d of the mixed region and on the negative side with respect to the ratio L of the rhodium uneven distribution portion.
- FIG. 13 As shown in FIG. 13, according to the relationship between the width d of the mixed region and the electrode reaction resistance of the detection electrode, it can be seen that the electrode reaction resistance of the detection electrode decreases as the width d of the mixed region increases. .. Further, according to FIG. 13, it can be seen that it is desirable that the width d of the mixed region is 30 nm or more in order to reduce the electrode reaction resistance of the detection electrode to 15000 ⁇ or less in order to improve the NOx detection accuracy. Note that FIG.
- the width d of the mixed region d 30 nm in relation to the width d (nm) of the mixed region and the ratio L (%) of the rhodium uneven distribution portion.
- the width d of the mixed region and the rhodium uneven distribution portion from the region below the correlation curve when the electrode capacitance of the detection electrode is 300 ⁇ F and the width d of the mixed region is 30 nm or more.
- the present disclosure is not limited to the above embodiments and experimental examples, and various changes can be made without departing from the gist thereof.
- the configurations shown in the embodiments and experimental examples can be arbitrarily combined. That is, although the present disclosure has been described in accordance with the embodiments, it is understood that the present disclosure is not limited to the embodiments, structures, and the like.
- the present disclosure also includes various modifications and modifications within an equal range.
- various combinations and forms, as well as other combinations and forms that include only one element, more, or less, are also within the scope of the present disclosure.
Landscapes
- Chemical & Material Sciences (AREA)
- Life Sciences & Earth Sciences (AREA)
- Health & Medical Sciences (AREA)
- Physics & Mathematics (AREA)
- Chemical Kinetics & Catalysis (AREA)
- Electrochemistry (AREA)
- Molecular Biology (AREA)
- Analytical Chemistry (AREA)
- Biochemistry (AREA)
- General Health & Medical Sciences (AREA)
- General Physics & Mathematics (AREA)
- Immunology (AREA)
- Pathology (AREA)
- Measuring Oxygen Concentration In Cells (AREA)
Priority Applications (1)
| Application Number | Priority Date | Filing Date | Title |
|---|---|---|---|
| DE112020003625.1T DE112020003625T5 (de) | 2019-07-29 | 2020-07-02 | Gassensorelement und Gassensor |
Applications Claiming Priority (2)
| Application Number | Priority Date | Filing Date | Title |
|---|---|---|---|
| JP2019139191A JP7070517B2 (ja) | 2019-07-29 | 2019-07-29 | ガスセンサ素子およびガスセンサ |
| JP2019-139191 | 2019-07-29 |
Publications (1)
| Publication Number | Publication Date |
|---|---|
| WO2021020016A1 true WO2021020016A1 (ja) | 2021-02-04 |
Family
ID=74229960
Family Applications (1)
| Application Number | Title | Priority Date | Filing Date |
|---|---|---|---|
| PCT/JP2020/025956 Ceased WO2021020016A1 (ja) | 2019-07-29 | 2020-07-02 | ガスセンサ素子およびガスセンサ |
Country Status (3)
| Country | Link |
|---|---|
| JP (1) | JP7070517B2 (enExample) |
| DE (1) | DE112020003625T5 (enExample) |
| WO (1) | WO2021020016A1 (enExample) |
Families Citing this family (1)
| Publication number | Priority date | Publication date | Assignee | Title |
|---|---|---|---|---|
| US12222314B2 (en) * | 2021-01-22 | 2025-02-11 | Ngk Insulators, Ltd. | Sensor element of NOx sensor |
Citations (6)
| Publication number | Priority date | Publication date | Assignee | Title |
|---|---|---|---|---|
| WO2014080867A1 (ja) * | 2012-11-22 | 2014-05-30 | 株式会社デンソー | ガスセンサ用の電極及びそれを用いたガスセンサ素子 |
| WO2016111345A1 (ja) * | 2015-01-08 | 2016-07-14 | 株式会社デンソー | NOxセンサ |
| JP2017116530A (ja) * | 2015-12-17 | 2017-06-29 | 株式会社デンソー | ガスセンサ素子及びガスセンサ |
| JP2017150933A (ja) * | 2016-02-24 | 2017-08-31 | 株式会社Soken | ガスセンサ素子 |
| JP2018100879A (ja) * | 2016-12-20 | 2018-06-28 | 株式会社デンソー | ガスセンサ素子およびガスセンサユニット |
| JP2019015632A (ja) * | 2017-07-07 | 2019-01-31 | 株式会社デンソー | ガスセンサ素子およびガスセンサ |
Family Cites Families (1)
| Publication number | Priority date | Publication date | Assignee | Title |
|---|---|---|---|---|
| JP2019139191A (ja) | 2018-02-15 | 2019-08-22 | キヤノン株式会社 | レンズフード、レンズ装置、及び撮像装置 |
-
2019
- 2019-07-29 JP JP2019139191A patent/JP7070517B2/ja active Active
-
2020
- 2020-07-02 DE DE112020003625.1T patent/DE112020003625T5/de active Pending
- 2020-07-02 WO PCT/JP2020/025956 patent/WO2021020016A1/ja not_active Ceased
Patent Citations (7)
| Publication number | Priority date | Publication date | Assignee | Title |
|---|---|---|---|---|
| WO2014080867A1 (ja) * | 2012-11-22 | 2014-05-30 | 株式会社デンソー | ガスセンサ用の電極及びそれを用いたガスセンサ素子 |
| JP2014122878A (ja) * | 2012-11-22 | 2014-07-03 | Denso Corp | ガスセンサ用の電極及びそれを用いたガスセンサ素子 |
| WO2016111345A1 (ja) * | 2015-01-08 | 2016-07-14 | 株式会社デンソー | NOxセンサ |
| JP2017116530A (ja) * | 2015-12-17 | 2017-06-29 | 株式会社デンソー | ガスセンサ素子及びガスセンサ |
| JP2017150933A (ja) * | 2016-02-24 | 2017-08-31 | 株式会社Soken | ガスセンサ素子 |
| JP2018100879A (ja) * | 2016-12-20 | 2018-06-28 | 株式会社デンソー | ガスセンサ素子およびガスセンサユニット |
| JP2019015632A (ja) * | 2017-07-07 | 2019-01-31 | 株式会社デンソー | ガスセンサ素子およびガスセンサ |
Also Published As
| Publication number | Publication date |
|---|---|
| JP7070517B2 (ja) | 2022-05-18 |
| DE112020003625T5 (de) | 2022-04-21 |
| JP2021021660A (ja) | 2021-02-18 |
Similar Documents
| Publication | Publication Date | Title |
|---|---|---|
| US8409414B2 (en) | Gas sensor and nitrogen oxide sensor | |
| US6419818B2 (en) | NOx concentration-measuring method | |
| CN103998922B (zh) | 气体传感器用电极及气体传感器 | |
| JP4632506B2 (ja) | NOxガス検出装置 | |
| JP6824828B2 (ja) | アンモニア濃度測定装置,アンモニア濃度測定システム,排ガス処理システム,及びアンモニア濃度測定方法 | |
| US20030136674A1 (en) | Gas sensor and nitrogen oxide sensor | |
| EP0930501B1 (en) | Method for measuring NOx concentration | |
| EP0867715A1 (en) | Gas sensor | |
| US11474068B2 (en) | Gas sensor element and gas sensor | |
| JP2017020838A (ja) | ガスセンサのポンプ電極及び基準電極 | |
| US20200209184A1 (en) | Gas sensor element and gas sensor | |
| JP2004354400A (ja) | ガスセンサ及び窒素酸化物センサ | |
| US10935517B2 (en) | Gas sensor element and gas sensor unit | |
| JP7070517B2 (ja) | ガスセンサ素子およびガスセンサ | |
| JP2020071080A (ja) | アンモニア検出装置 | |
| TW201743338A (zh) | 氣體感測電極形成用之金屬糊 | |
| JP2014235003A (ja) | SOxガスセンサ、SOxガス濃度の検出方法 | |
| JP3583301B2 (ja) | ガスセンサ | |
| JP7234988B2 (ja) | ガスセンサ | |
| JP4213939B2 (ja) | ガス検出装置 | |
| JP2021021660A5 (enExample) | ||
| JP2024173304A (ja) | ガスセンサ素子 | |
| JP2025166341A (ja) | センサ素子、ガスセンサ、およびセンサ素子の製造方法 | |
| JP4726996B2 (ja) | NOxガス検出装置 | |
| CN108872345B (zh) | 气体传感器 |
Legal Events
| Date | Code | Title | Description |
|---|---|---|---|
| 121 | Ep: the epo has been informed by wipo that ep was designated in this application |
Ref document number: 20847493 Country of ref document: EP Kind code of ref document: A1 |
|
| 122 | Ep: pct application non-entry in european phase |
Ref document number: 20847493 Country of ref document: EP Kind code of ref document: A1 |