WO2020235288A1 - スプリングバック量乖離要因部位特定方法および装置 - Google Patents
スプリングバック量乖離要因部位特定方法および装置 Download PDFInfo
- Publication number
- WO2020235288A1 WO2020235288A1 PCT/JP2020/017379 JP2020017379W WO2020235288A1 WO 2020235288 A1 WO2020235288 A1 WO 2020235288A1 JP 2020017379 W JP2020017379 W JP 2020017379W WO 2020235288 A1 WO2020235288 A1 WO 2020235288A1
- Authority
- WO
- WIPO (PCT)
- Prior art keywords
- springback
- stress
- molded product
- analysis
- stress distribution
- Prior art date
- Legal status (The legal status is an assumption and is not a legal conclusion. Google has not performed a legal analysis and makes no representation as to the accuracy of the status listed.)
- Ceased
Links
Images


Classifications
-
- G—PHYSICS
- G06—COMPUTING OR CALCULATING; COUNTING
- G06F—ELECTRIC DIGITAL DATA PROCESSING
- G06F30/00—Computer-aided design [CAD]
- G06F30/20—Design optimisation, verification or simulation
- G06F30/23—Design optimisation, verification or simulation using finite element methods [FEM] or finite difference methods [FDM]
-
- B—PERFORMING OPERATIONS; TRANSPORTING
- B21—MECHANICAL METAL-WORKING WITHOUT ESSENTIALLY REMOVING MATERIAL; PUNCHING METAL
- B21D—WORKING OR PROCESSING OF SHEET METAL OR METAL TUBES, RODS OR PROFILES WITHOUT ESSENTIALLY REMOVING MATERIAL; PUNCHING METAL
- B21D22/00—Shaping without cutting, by stamping, spinning, or deep-drawing
-
- G—PHYSICS
- G06—COMPUTING OR CALCULATING; COUNTING
- G06F—ELECTRIC DIGITAL DATA PROCESSING
- G06F30/00—Computer-aided design [CAD]
- G06F30/10—Geometric CAD
- G06F30/17—Mechanical parametric or variational design
-
- G—PHYSICS
- G06—COMPUTING OR CALCULATING; COUNTING
- G06F—ELECTRIC DIGITAL DATA PROCESSING
- G06F2111/00—Details relating to CAD techniques
- G06F2111/10—Numerical modelling
-
- G—PHYSICS
- G06—COMPUTING OR CALCULATING; COUNTING
- G06F—ELECTRIC DIGITAL DATA PROCESSING
- G06F2113/00—Details relating to the application field
- G06F2113/14—Pipes
-
- G—PHYSICS
- G06—COMPUTING OR CALCULATING; COUNTING
- G06F—ELECTRIC DIGITAL DATA PROCESSING
- G06F2119/00—Details relating to the type or aim of the analysis or the optimisation
- G06F2119/14—Force analysis or force optimisation, e.g. static or dynamic forces
-
- G—PHYSICS
- G06—COMPUTING OR CALCULATING; COUNTING
- G06F—ELECTRIC DIGITAL DATA PROCESSING
- G06F2119/00—Details relating to the type or aim of the analysis or the optimisation
- G06F2119/18—Manufacturability analysis or optimisation for manufacturability
Definitions
- the present invention relates to a method and an apparatus for identifying a portion of the press-molded product that causes a discrepancy between the springback amount of the press-molded product of the actual panel and the springback amount of the CAE analysis.
- the springback (SB) effective stress is calculated from the residual stress before mold release and the residual stress after mold release, and the SB effective stress is used.
- a method for performing a more appropriate evaluation is disclosed by performing factor analysis.
- the above method performs springback analysis from the stress state calculated from the data setting in CAE analysis.
- Patent Document 3 the measured three-dimensional shape created by actually measuring the surface shape of the press-molded molded product is incorporated into the CAE analysis, and the measured three-dimensional shape is in the bottom dead point state of molding by the mold model.
- a method for performing a more accurate evaluation is disclosed by performing a mechanical analysis of the state of being sandwiched between the two to obtain a stress distribution state and performing a factor analysis using the stress distribution state.
- JP-A-2007-229724 Japanese Unexamined Patent Publication No. 2012-206158 Japanese Unexamined Patent Publication No. 2013-71120
- the shape may be different from the shape expected by the countermeasures taken for the actual press-molded product. This is because the molding load assumed in the CAE analysis is not applied to the metal plate depending on the shape of the die used for press molding and various molding conditions, or the CAE analysis accurately determines the stress state before mold release. In such a case, it is necessary to adjust the mold and molding conditions used for press molding, and to review the CAE analysis settings and mold shape. There is.
- the present invention has been made to solve the above-mentioned problems, and is a portion of the press-molded product that causes a discrepancy between the springback amount of the press-molded product of the actual panel and the springback amount of the CAE analysis. It is an object of the present invention to provide a method and an apparatus for identifying a part of a springback amount divergence factor for specifying a springback amount.
- the cause of the deviation of the springback amount is the difference between the stress that contributed to the springback in the CAE analysis (hereinafter also referred to as the driving stress distribution) and the stress that contributed to the springback in the actual panel (driving stress distribution). I came up with the idea that it might be.
- a springback analysis was performed on a springback amount generated in a press-molded product obtained by press-molding an actual panel and an analysis model having the same shape as the press-molded product.
- the part in the molded product shape that causes the discrepancy is specified, and the tertiary surface shape obtained by measuring the surface shape of the press-molded product after mold release is obtained.
- a press-molded product model is created from the original shape measurement data, a mechanical analysis is performed with the press-molded product model sandwiched by a mold model up to the bottom dead point, and the stress distribution at the bottom dead point of molding is determined by the press-molded product.
- the molded product drive stress distribution acquisition step to be acquired as the molded product drive stress distribution that contributed to the springback, and the bottom dead point stress distribution and the residual stress distribution after mold release in the springback analysis are acquired, and the bottom dead point stress distribution is obtained.
- the analysis drive stress distribution acquisition step for acquiring the difference between the residual stress distribution and the residual stress distribution after mold release as the analysis drive stress distribution in the springback analysis, and the molded product drive stress distribution for the molded product drive stress distribution are the shape of the molded product at the bottom dead point in the springback analysis.
- the molded product springback amount acquisition step for acquiring the springback amount by performing springback analysis based on the set molded product driving stress distribution and the analysis driving stress distribution are set to the molded product at the bottom dead point.
- the shape is set, and the value of the analytical driving stress in a part of the set analytical driving stress distribution is set to the value of the molded product driving stress in the region corresponding to the partial region in the molded product driving stress distribution.
- the stress is obtained from the difference between the analysis drive stress distribution acquired in the analysis drive stress distribution acquisition step and the molded product drive stress distribution acquired in the molded product drive stress distribution acquisition step.
- a stress replacement region selection step is provided in which a difference distribution is acquired and a region having a relatively large difference from the stress difference distribution is selected as a part of the region to be stress-replaced.
- the springback amount divergence factor site identification device performs springback analysis on the springback amount generated in the press-molded product obtained by press-molding the actual panel and the analysis model having the same shape as the press-molded product.
- the part in the molded product shape that causes the discrepancy is specified, and the tertiary surface shape obtained by measuring the surface shape of the press-molded product after mold release is obtained.
- a press-molded product model is created from the original shape measurement data, a mechanical analysis is performed with the press-molded product model sandwiched by a mold model up to the bottom dead point, and the stress distribution at the bottom dead point of molding is determined by the press-molded product.
- the molded product driving stress distribution acquisition means acquired as the molded product driving stress distribution that contributed to the springback, and the bottom dead point stress distribution in the springback analysis and the residual stress distribution after mold release are acquired, and the bottom dead point stress distribution is obtained.
- the analysis drive stress distribution acquisition means for acquiring the difference between the residual stress distribution after the mold release and the analysis drive stress distribution in the springback analysis, and the molded product drive stress distribution of the molded product are obtained from the molded product shape at the bottom dead point in the springback analysis.
- the molded product springback amount acquisition means for acquiring the springback amount by performing springback analysis based on the set molded product drive stress distribution, and the analysis drive stress distribution for the molded product at the bottom dead point.
- the shape is set, and the value of the analytical driving stress in a part of the set analytical driving stress distribution is set to the value of the molded product driving stress in the region corresponding to the partial region in the molded product driving stress distribution.
- the stress substitution springback amount acquisition means for acquiring the springback amount by performing the springback analysis based on the replaced stress substitution distribution, and the springback amount acquired by the stress substitution springback amount acquisition means. , The difference from the springback amount acquired by the molded product springback amount acquisition means is obtained, and based on the obtained difference, molding that causes a discrepancy between the press-molded product and the springback amount in the springback analysis. It is provided with a springback amount divergence factor part identification means for specifying a part in the product shape.
- the stress is obtained from the difference between the analysis drive stress distribution acquired by the analysis drive stress distribution acquisition means and the molded product drive stress distribution acquired by the molded product drive stress distribution acquisition means.
- a stress replacement region selection means for acquiring a difference distribution and selecting a region having a relatively large difference from the stress difference distribution as a part of the region to be stress-replaced is provided.
- the present invention it is possible to identify a portion that causes a discrepancy between the springback analysis by CAE analysis and the amount of springback that occurs in the actual press-molded product, so that the actual press-molding die and molding conditions can be adjusted. It is possible to reduce the work load and improve the usefulness of springback countermeasures using CAE analysis.
- FIG. 1 is a flow chart showing a processing flow of a method for identifying a portion of a springback amount deviation factor according to the first embodiment.
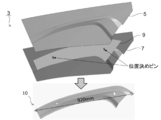
- FIG. 2 is a diagram illustrating a press-molded product according to the first embodiment.
- FIG. 3 is a diagram showing a driving stress distribution in the CAE analysis in the first embodiment.
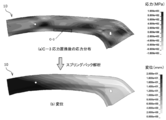
- FIG. 4 is a diagram showing a driving stress distribution (a) in an actual panel and a displacement (b) calculated by springback analysis based on the driving stress distribution in the first embodiment.
- FIG. 5 is a diagram showing an analysis result of a fixed point in the springback analysis in the first embodiment and a displacement obtained by the springback analysis.
- FIG. 1 is a flow chart showing a processing flow of a method for identifying a portion of a springback amount deviation factor according to the first embodiment.
- FIG. 2 is a diagram illustrating a press-molded product according to the first embodiment.
- FIG. 3 is a diagram showing a driving stress distribution in the CAE analysis in the first
- FIG. 6 is a diagram illustrating a method of calculating a swing amount and a splash amount, which are springback amounts in the first embodiment.
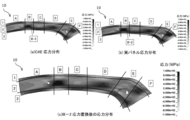
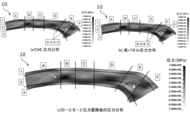
- FIG. 7 is a diagram showing a driving stress distribution (a) in the CAE analysis, a driving stress distribution (b) in the actual panel, and a stress difference distribution (c) in the CAE analysis and the actual panel in the first embodiment. ..
- FIG. 8 is a diagram illustrating a region division of the stress difference distribution and a region where the stress difference is relatively large in the first embodiment.
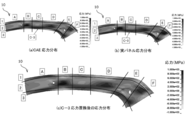
- FIG. 9 is a diagram illustrating the region division (a) of the driving stress distribution in the CAE analysis and the region division (b) of the driving stress distribution in the actual panel in the first embodiment.
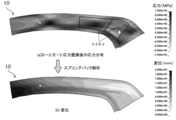
- FIG. 10 is a diagram showing regions (a) and (b) for replacing driving stress and stress distribution (stress substitution distribution) (c) after replacing driving stress in the region in the first embodiment.
- FIG. 11 is a diagram showing a stress substitution distribution (a) and a displacement (b) calculated by springback analysis based on the stress substitution distribution in the first embodiment (region B-1).
- FIG. 12 is a diagram showing regions (a) and (b) for replacing driving stress and stress distribution (stress substitution distribution) (c) after replacing driving stress in the region in the first embodiment.
- FIG. 13 is a diagram showing a stress substitution distribution (a) and a displacement (b) calculated by springback analysis based on the stress substitution distribution in the first embodiment (region B-2).
- FIG. 14 is a diagram showing regions (a) and (b) for replacing driving stress and stress distribution (stress substitution distribution) (c) after replacing driving stress in the region in the first embodiment.
- FIG. 15 is a diagram showing a stress substitution distribution (a) and a displacement (b) calculated by springback analysis based on the stress substitution distribution in the first embodiment (region C-3).
- FIG. 16 is a diagram showing regions (a) and (b) for replacing driving stress and stress distribution (stress substitution distribution) (c) after replacing driving stress in the region in the first embodiment.
- FIG. 17 is a diagram showing a stress substitution distribution (a) and a displacement (b) calculated by springback analysis based on the stress substitution distribution in the first embodiment (region D-2).
- FIG. 18 is a diagram showing regions (a) and (b) for replacing driving stress and stress distribution (stress substitution distribution) (c) after replacing driving stress in the region in the first embodiment.
- FIG. 19 is a diagram showing a stress substitution distribution (a) and a displacement (b) calculated by springback analysis based on the stress substitution distribution in the first embodiment (region E-2).
- FIG. 20 is a diagram showing regions (a) and (b) for replacing driving stress and stress distribution (stress substitution distribution) (c) after replacing driving stress in the region in the first embodiment. (Region D-2 / E-2).
- FIG. 21 is a diagram showing a stress substitution distribution (a) and a displacement (b) calculated by springback analysis based on the stress substitution distribution in the first embodiment (regions D-2 / E-2). ..
- FIG. 22 is a diagram showing regions (a) and (b) for replacing driving stress and stress distribution (stress substitution distribution) (c) after replacing driving stress in the region in the first embodiment. (Region F-2).
- FIG. 23 is a diagram showing a stress substitution distribution (a) and a displacement (b) calculated by springback analysis based on the stress substitution distribution in the first embodiment (region F-2).
- FIG. 24 is a graph showing the relationship between the region in which the driving stress is replaced and the amount of deviation of the swing caused by the springback when the driving stress is replaced in the first embodiment.
- FIG. 25 is a graph showing the relationship between the region in which the driving stress is replaced and the amount of splash deviation caused by the springback when the driving stress is replaced in the first embodiment.
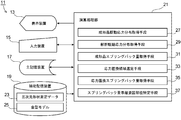
- FIG. 26 is a block diagram for explaining the configuration of the springback amount deviation factor portion specifying device according to the second embodiment.
- the method for identifying the component of the springback amount deviation factor includes a molded product drive stress distribution acquisition step S1, an analysis drive stress distribution acquisition step S3, and a molded product springback amount.
- the acquisition step S5, the stress substitution region selection step S7, the stress substitution springback amount acquisition step S9, and the springback amount deviation factor site identification step S11 are provided.
- the “bottom dead center” indicates a state in which the punch and the die are in contact with each other with the blank sandwiched between them (in the CAE analysis, the molding is completed).
- the “bottom dead center of molding” indicates a state in which molding is completed with an actual press die.
- the “dead center under analysis” indicates a state in which molding in CAE analysis is completed.
- FIG. 2 a press forming analysis is performed in which the blank model 9 which is the work material (steel plate) is sandwiched by the mold model 3 including the die 5 and the punch 7.
- the blank model 9 is fixed in the molding process by the positioning pin as shown in FIG.
- the element size of the blank model 9 is about 1 mm
- the coefficient of friction between the blank model 9 and the mold model 3 is 0.15
- the bottom dead center position of the molding is 1.45 mm for the upper and lower mold models.
- the material to be processed was a 980 MPa class GA steel sheet with a thickness of 1.4 mm. It is assumed that the actual panel in the present embodiment is formed by press molding under the same conditions as the molding conditions set in the CAE analysis.
- the molded product drive stress distribution acquisition step S1 is a step of acquiring the drive stress distribution of the actual panel.
- the actual panel is formed by press molding under the same conditions as the molding conditions set in the CAE analysis as described above, and the surface shape of the actual panel after molding is measured to obtain a three-dimensional shape.
- the press-molded product model is subjected to mechanical analysis in a state of being sandwiched to the bottom dead center of molding by the mold model 3 shown in FIG. 2 to obtain the stress distribution as shown in FIG. 4 (a). is there.
- An elastic finite element analysis is performed as the mechanical analysis, and the stress distribution obtained by the elastic finite element analysis corresponds to the stress contributing to the springback of the actual panel, that is, the driving stress of the actual panel.
- Patent Document 3 As a specific method for measuring the three-dimensional shape of the actual panel, creating the press-molded product model, and analyzing the elastic finite element, for example, the method described in Patent Document 3 can be used.
- the analysis driving stress distribution acquisition step S3 is a step of acquiring the bottom dead point stress distribution in the CAE analysis (springback analysis) and the residual stress distribution after the mold release, respectively, and acquiring the driving stress in the CAE analysis from the difference. ..
- the stress at the bottom dead center of the press-molded product affects the behavior of the springback, the stress remains in the press-molded product after it is released from the mold. That is, it is considered that not all the stresses before the mold release contributed to the springback, and the stress remaining in the press-molded product in which the springback after the mold release occurred did not contribute to the springback. It is necessary to calculate the driving stress in the CAE analysis in order to perform an accurate comparative analysis with the driving stress (stress contributing to the springback) acquired in the molded product driving stress distribution acquisition step S1.
- CAE analysis is performed using the mold model 3 and the blank model 9 shown in FIG. 2, and the stress of the press-formed product before the mold release (bottom dead point) and after the mold release are performed.
- the driving stress distribution in the CAE analysis as shown in FIG. 3 (hereinafter, simply stress) (Also called distribution) is calculated.
- a computer performs CAE analysis, and for CAE analysis, for example, finite element method analysis software can be used.
- analysis is performed by executing LS-DYNA Ver.971 which is commercially available finite element method analysis software on a computer, and a dynamic explicit method is applied to the solver.
- the present invention is not limited to the one using the mold model 3 as shown in FIG. 2 and the one in which the press-molded product 10 having the hat cross-sectional shape is the molding target, and the mold model and the press molding are limited to the molding target. Products and the like can be set as appropriate. Furthermore, if the residual stress after mold release is a small value that can be almost ignored, it is considered that the entire stress distribution at the bottom dead center of the analysis contributes to springback, and the stress distribution at the bottom dead center is analyzed. It may be a distribution.
- Step to acquire the amount of spring back for molded products In the molded product springback amount acquisition step S5, the molded product driving stress distribution acquired in the molded product driving stress distribution acquisition step S1 is set to the molded product shape at the bottom dead point in the CAE analysis, and the set molded product driving stress distribution is set. This is a step of performing a springback analysis based on the above and calculating the amount of springback generated there.
- a springback analysis is performed on a press-molded product 10 (FIG. 4 (a)) having a bottom dead center shape in which a molded product drive stress distribution is set, and the displacement after springback is performed by the springback analysis. (FIG. 4 (b)) is calculated.
- FIG. 5 In the springback analysis, as shown in FIG. 5, three points provided on one end side of the press-molded product were fixed at fixed points, and the displacement due to the springback was calculated.
- the swing amount (FIG. 6 (a)) and the splash amount (FIG. 6 (b)) were calculated based on the displacement calculated by the springback analysis.
- the swing amount is moved in the direction of the arrow in the figure by the springback of either of the two evaluation points provided on the other end side of the press-molded product 10.
- the amount (the direction of the arrow is positive) and the amount of splash are the amount of displacement in the molding stroke direction at the midpoint of the two evaluation points (the direction away from the die 5 is positive). ..
- ⁇ Stress replacement region selection step> In the stress substitution region selection step S7, as shown in FIG. 7, the stress distribution (FIGS. 3 and 7 (a)) acquired in the analysis drive stress distribution acquisition step S3 and the stress acquired in the molded product drive stress distribution acquisition step S1 The difference from the distribution (FIGS. 4 (a) and 7 (b)) is calculated as the stress difference distribution (FIG. 7 (c)), and the region having a relatively large stress difference is stress-replaced from the calculated stress difference distribution.
- This is a step of selecting a region to be performed (a part of the region in the present invention) (hereinafter, also referred to as a “stress substitution region”).
- the reason why the region with a relatively large stress difference is selected as the stress substitution region is that the difference between the CAE analysis and the driving stress distribution of the actual panel is the cause of the deviation of the springback amount, as explained in the background to the present invention. This is due to the finding that. This is because it is considered that the dissociation factor site is included in the region where the stress difference is relatively large, that is, the region where the difference in the driving stress distribution is relatively large. In each stress distribution shown in FIG. 7, the difference in the magnitude of stress is shown by the shade of color, but FIG. 7 (c) is more color-displayed than FIGS. 7 (a) and 7 (b). The range width is set small. By doing so, it is easier to distinguish between a part having a large stress difference (a part close to black or white) and a part having a small stress difference (a part close to the grayscale intermediate color on the right side of the figure).
- the press-formed product 10 is divided into a plurality of regions (6 divisions A to F in the longitudinal direction and 3 divisions 1 to 3 in the width direction), and the stress in each region is obtained.
- the differences shall be compared and the region where the stress difference is judged to be relatively large (the region including the black or near-white part) shall be selected.
- the stress substitution region selection step S7 in the present embodiment the six regions (B-1, B-2, C-3, D-2, E-2, F-2) shown by the broken line circles in the figure of FIG. 8 are shown. ) Was selected.
- the method of selecting a region having a relatively large stress difference as a stress substitution region is not limited to the above-mentioned method.
- the magnitude of the stress difference is numerically determined for each divided region.
- the number of areas such as 1/2 or 1/3 of the total number of divisions may be selected.
- a region judged to have a relatively large stress difference is selected, but the selection criteria are not limited to this, and for example, all regions having a stress difference equal to or higher than a preset value are selected. You may try to do it.
- the analysis drive stress distribution acquired in the analysis drive stress distribution acquisition step S3 is set to the shape of the molded product at the bottom dead point, and the stress substitution region in the set analysis drive stress distribution.
- the analysis driving stress value of the region selected in the selection step S7 is replaced with the molded product driving stress value of the region corresponding to the selected region in the molded product driving stress distribution acquired in the molded product driving stress distribution acquisition step S1.
- the springback analysis is performed based on the stress distribution after the replacement (stress substitution distribution) to obtain the springback amount.
- FIG. 9 shows a state in which the driving stress distribution in the CAE analysis and the driving stress distribution in the actual panel are divided into regions by the same method as the stress difference distribution in FIG.
- stress replacement is performed on the region B-1, which is one of the regions selected in the stress replacement region selection step S7.
- the result of replacing the stress in the region B-1 in the driving stress distribution (FIG. 10 (a)) in the CAE analysis with the stress in the region B-1 in the driving stress distribution in the actual panel (FIG. 10 (b)) is shown in FIG. It is shown in 10 (c).
- FIG. 11 shows the result of the displacement calculated by performing the springback analysis based on the stress distribution after the region B-1 stress replacement. Based on the calculated displacement, the swing amount (FIG. 6 (a)) and the splash amount (FIG. 6 (b)), which are the springback amounts, were calculated, respectively.
- FIGS. 12 to 23 The results of performing stress substitution in the same manner for the other regions selected in the stress substitution region selection step S7 and performing springback analysis based on the stress substitution distribution are shown in FIGS. 12 to 23. Based on the calculated displacement, the swing amount and the splash amount were calculated for the other regions as well. In addition, in regions D-2 and E-2, a region having a large stress difference was observed so as to straddle the two regions (see FIG. 8). Therefore, in addition to the stress substitution in each region, both regions The amount of springback when stress substitution was performed was also calculated (see FIGS. 20 and 21). As described above, the region for performing stress replacement does not necessarily have to be one region, and the stress in a plurality of regions may be replaced.
- Step to identify the cause of the springback amount deviation> In the springback amount deviation factor site identification step S11, the difference between the springback amount acquired in the stress replacement springback amount acquisition step S9 and the springback amount acquired in the molded product springback amount acquisition step S5 was obtained and obtained. Based on the difference, it is a step to identify a part that causes a difference in the amount of springback between the CAE analysis and the actual panel.
- FIG. 24 shows the difference between the swing amount acquired in the stress replacement springback amount acquisition step S9 (swing amount in the CAE analysis) and the swing amount in the actual panel acquired in the molded product springback amount acquisition step S5.
- the result of finding the amount of swing deviation is shown.
- “None” on the horizontal axis of the graph means that there is no stress substitution, and in this case, the amount of deviation is -11.6 mm, which is the difference between the CAE analysis and the actual panel.
- ALL is a case where all the regions of the driving stress distribution of the CAE analysis are replaced with the driving stress distribution of the actual panel, and in this case, the deviation amount becomes almost zero.
- “B-1” to “F-2” on the horizontal axis are the amount of swing deviation when stress substitution is performed on the driving stress of the CAE analysis for the six regions selected in the stress substitution region selection step S7.
- the amount of divergence when stress substitution was performed on "D-2” or "E-2” among the selected 6 regions. Can be seen to be decreasing.
- the amount of swing deviation can be further reduced by substituting the driving stress distribution of the actual panel in both the regions D-2 and E-2. all right. Therefore, from the results of FIG. 24, it can be identified that the regions D-2 and E-2 are the sites that cause a discrepancy between the CAE analysis and the swing amount of the actual panel.
- FIG. 25 shows the results of obtaining the amount of deviation between the CAE analysis and the splash of the actual panel.
- the amount of splash divergence when stress substitution is performed on "F-2" out of the selected 6 regions for the amount of divergence that occurred in the CAE analysis and the actual panel shown in "None", It was found that the amount of divergence was reduced. Therefore, from the result of FIG. 25, it can be identified that the region F-2 is a site that causes a discrepancy between the CAE analysis and the amount of splash of the actual panel.
- the region having the same degree of dissociation as “none” indicates that the region has little influence on the dissociation that occurs in the CAE analysis and the actual panel. That is, it is suggested that even if such a region is identified as a divergence factor site and press-molded by taking some measures, the amount of springback divergence between the CAE analysis and the actual panel is almost the same. .. Therefore, in the present invention, when the amount of springback deviation when the driving stress of a part of the region is replaced is about the same as the amount of springback deviation of the actual panel in the CAE analysis without stress substitution, the part of the region is determined. It is not a part that causes a discrepancy between the CAE analysis and the springback amount of the actual panel.
- the method of dividing the press-molded product into 18 regions has been described, but since it is necessary to increase the number of division regions and further subdivide the press-molded product having a complicated shape, the results are obtained in all the subdivision regions. It takes time to find. Using the stress substitution region selection step S7 of the present embodiment to narrow down the region that is expected to have a large influence is effective in shortening the time until the divergence factor site is specified.
- the present invention is not limited to this, and the stress replacement region selection step S7 is not performed, and the stress replacement springback amount acquisition step S9 is performed as a part of each divided region to be stress-replaced. It may be.
- the method for identifying the springback amount divergence factor site described in the first embodiment can be realized by causing a PC (personal computer) to execute a preset program.
- a PC personal computer
- An example of such a device will be described in this embodiment.
- the springback amount deviation factor site identification device 11 includes a display device 13, an input device 15, a main storage device 17, an auxiliary storage device 19, and arithmetic processing as shown in FIG. 26 as an example. It has a part 21.
- a display device 13, an input device 15, a main storage device 17, and an auxiliary storage device 19 are connected to the arithmetic processing unit 21, and each function is performed by a command of the arithmetic processing unit 21.
- the display device 13 is used for displaying an execution result and the like, and is composed of a liquid crystal monitor and the like.
- the input device 15 is used for input from an operator and is composed of a keyboard, a mouse, and the like.
- the main storage device 17 is used for temporary storage and calculation of data used by the calculation processing unit 21, and is composed of a RAM or the like.
- the auxiliary storage device 19 is used for storing data and the like, and is composed of a hard disk and the like. At least various data necessary for CAE analysis such as the three-dimensional shape measurement data 23 and the mold model 25 are stored in the auxiliary storage device 19.
- the arithmetic processing unit 21 is composed of a CPU such as a PC. Molded product drive stress distribution acquisition means 27, analysis drive stress distribution acquisition means 29, molded product springback amount acquisition means 31, stress replacement region selection means 33, stress replacement springback amount acquisition means 35, and springback amount.
- the divergence factor site identifying means 37 is realized by executing a preset program in the arithmetic processing unit 21.
- the molded product driving stress distribution acquisition means 27 realizes the same processing as the molded product driving stress distribution acquisition step S1 described in the first embodiment.
- the analysis drive stress distribution acquisition means 29 performs the analysis drive stress distribution acquisition step S3
- the molded product springback amount acquisition means 31 performs the molded product springback amount acquisition step S5
- the stress replacement region selection means 33 selects the stress substitution region.
- the stress replacement springback amount acquisition means 35 realizes the stress replacement springback amount acquisition step S9
- the springback amount deviation factor site specifying means 37 realizes the springback amount deviation factor site identification step S11.
- the present embodiment as described above, it is possible to accurately identify the portion that causes the difference between the CAE analysis and the springback amount of the actual panel as in the first embodiment. Therefore, it is possible to efficiently perform CAE analysis and various adjustment operations for bringing the shape of the actual panel closer to each other based on the specified portion, and further ensure the usefulness of the springback countermeasure.
- the present invention is not limited to this as described in the first embodiment.
- the stress replacement springback amount acquisition means 35 may perform stress replacement by performing stress replacement as a part of each of the divided regions to be stress-replaced.
- the present invention is not limited to the final molded product (product shape), but can also be applied to an intermediate molded product in the case of a press-molded product in which the molding process is performed separately. Further, in the above-described embodiment, an example in which a steel plate is used as a work material has been described, but it can also be applied to an aluminum plate.
Landscapes
- Engineering & Computer Science (AREA)
- Physics & Mathematics (AREA)
- Theoretical Computer Science (AREA)
- Geometry (AREA)
- General Physics & Mathematics (AREA)
- Computer Hardware Design (AREA)
- Evolutionary Computation (AREA)
- General Engineering & Computer Science (AREA)
- Mechanical Engineering (AREA)
- Mathematical Analysis (AREA)
- Mathematical Optimization (AREA)
- Pure & Applied Mathematics (AREA)
- Computational Mathematics (AREA)
- Shaping Metal By Deep-Drawing, Or The Like (AREA)
- Testing Of Devices, Machine Parts, Or Other Structures Thereof (AREA)
Priority Applications (5)
| Application Number | Priority Date | Filing Date | Title |
|---|---|---|---|
| US17/613,386 US20220222398A1 (en) | 2019-05-22 | 2020-04-22 | Springback-amount-discrepancy-causing-portion specifying method and device |
| KR1020217037893A KR102674934B1 (ko) | 2019-05-22 | 2020-04-22 | 스프링 백량 괴리 요인 부위 특정 방법 및 장치, 그리고 스프링 백량 괴리 요인 부위 특정 프로그램을 기록한 컴퓨터로 판독 가능한 매체 |
| CN202080037875.2A CN113853605B (zh) | 2019-05-22 | 2020-04-22 | 回弹量偏差主因部位确定方法及装置 |
| MX2021014239A MX2021014239A (es) | 2019-05-22 | 2020-04-22 | Metodo y dispositivo que especifica la porcion del factor que causa discrepancia en la cantidad de liberacion de deformacion elastica. |
| EP20809819.4A EP3975031A4 (en) | 2019-05-22 | 2020-04-22 | Method and device for identifying springback-amount discrepancy-causing sites |
Applications Claiming Priority (2)
| Application Number | Priority Date | Filing Date | Title |
|---|---|---|---|
| JP2019095824A JP6841295B2 (ja) | 2019-05-22 | 2019-05-22 | スプリングバック量乖離要因部位特定方法および装置 |
| JP2019-095824 | 2019-05-22 |
Publications (1)
| Publication Number | Publication Date |
|---|---|
| WO2020235288A1 true WO2020235288A1 (ja) | 2020-11-26 |
Family
ID=73453768
Family Applications (1)
| Application Number | Title | Priority Date | Filing Date |
|---|---|---|---|
| PCT/JP2020/017379 Ceased WO2020235288A1 (ja) | 2019-05-22 | 2020-04-22 | スプリングバック量乖離要因部位特定方法および装置 |
Country Status (7)
| Country | Link |
|---|---|
| US (1) | US20220222398A1 (https=) |
| EP (1) | EP3975031A4 (https=) |
| JP (1) | JP6841295B2 (https=) |
| KR (1) | KR102674934B1 (https=) |
| CN (1) | CN113853605B (https=) |
| MX (1) | MX2021014239A (https=) |
| WO (1) | WO2020235288A1 (https=) |
Cited By (1)
| Publication number | Priority date | Publication date | Assignee | Title |
|---|---|---|---|---|
| JP7276584B1 (ja) | 2022-01-11 | 2023-05-18 | Jfeスチール株式会社 | プレス成形品のスプリングバック量評価方法、装置及びプログラム、並びにプレス成形品の製造方法 |
Families Citing this family (1)
| Publication number | Priority date | Publication date | Assignee | Title |
|---|---|---|---|---|
| CN118950747B (zh) * | 2024-07-08 | 2025-11-14 | 中国第一汽车股份有限公司 | 热成型冲压产品的控扭方法、车身及车辆 |
Citations (6)
| Publication number | Priority date | Publication date | Assignee | Title |
|---|---|---|---|---|
| JP2007229724A (ja) | 2006-02-27 | 2007-09-13 | Jfe Steel Kk | プレス成形解析方法 |
| JP2009172677A (ja) * | 2007-12-25 | 2009-08-06 | Nippon Steel Corp | スプリングバック発生原因分析方法、その装置、そのプログラム及び記録媒体 |
| JP2012206158A (ja) | 2011-03-30 | 2012-10-25 | Jfe Steel Corp | プレス成形解析方法 |
| JP2013071120A (ja) | 2011-09-26 | 2013-04-22 | Jfe Steel Corp | プレス成形におけるスプリングバック要因分析方法及び装置 |
| JP2014065056A (ja) * | 2012-09-26 | 2014-04-17 | Jfe Steel Corp | プレス成形品のスプリングバック要因特定方法および装置 |
| JP2016193455A (ja) * | 2015-03-31 | 2016-11-17 | 上海交通大学 | 金属板材曲げ成形制御方法 |
Family Cites Families (5)
| Publication number | Priority date | Publication date | Assignee | Title |
|---|---|---|---|---|
| CN102708222B (zh) * | 2006-08-31 | 2014-11-26 | 新日铁住金株式会社 | 回弹发生原因特定方法、回弹发生原因部位特定方法、回弹对策位置特定方法以及它们的装置 |
| BRPI0923582B8 (pt) * | 2008-12-25 | 2021-08-17 | Nippon Steel & Sumitomo Metal Corp | método e dispositivo para análise de uma causa de recuperação elástica em um produto formado |
| CN101811156A (zh) * | 2009-02-25 | 2010-08-25 | 江苏卡明模具有限公司 | 基于cae分析法获取板材成型回弹量的方法 |
| JP6683269B1 (ja) * | 2019-02-01 | 2020-04-15 | Jfeスチール株式会社 | スプリングバック量変動要因部位特定方法 |
| JP6852750B2 (ja) * | 2019-04-25 | 2021-03-31 | Jfeスチール株式会社 | スプリングバック量乖離要因部位特定方法および装置 |
-
2019
- 2019-05-22 JP JP2019095824A patent/JP6841295B2/ja active Active
-
2020
- 2020-04-22 US US17/613,386 patent/US20220222398A1/en active Pending
- 2020-04-22 EP EP20809819.4A patent/EP3975031A4/en active Pending
- 2020-04-22 CN CN202080037875.2A patent/CN113853605B/zh active Active
- 2020-04-22 KR KR1020217037893A patent/KR102674934B1/ko active Active
- 2020-04-22 WO PCT/JP2020/017379 patent/WO2020235288A1/ja not_active Ceased
- 2020-04-22 MX MX2021014239A patent/MX2021014239A/es unknown
Patent Citations (6)
| Publication number | Priority date | Publication date | Assignee | Title |
|---|---|---|---|---|
| JP2007229724A (ja) | 2006-02-27 | 2007-09-13 | Jfe Steel Kk | プレス成形解析方法 |
| JP2009172677A (ja) * | 2007-12-25 | 2009-08-06 | Nippon Steel Corp | スプリングバック発生原因分析方法、その装置、そのプログラム及び記録媒体 |
| JP2012206158A (ja) | 2011-03-30 | 2012-10-25 | Jfe Steel Corp | プレス成形解析方法 |
| JP2013071120A (ja) | 2011-09-26 | 2013-04-22 | Jfe Steel Corp | プレス成形におけるスプリングバック要因分析方法及び装置 |
| JP2014065056A (ja) * | 2012-09-26 | 2014-04-17 | Jfe Steel Corp | プレス成形品のスプリングバック要因特定方法および装置 |
| JP2016193455A (ja) * | 2015-03-31 | 2016-11-17 | 上海交通大学 | 金属板材曲げ成形制御方法 |
Cited By (3)
| Publication number | Priority date | Publication date | Assignee | Title |
|---|---|---|---|---|
| JP7276584B1 (ja) | 2022-01-11 | 2023-05-18 | Jfeスチール株式会社 | プレス成形品のスプリングバック量評価方法、装置及びプログラム、並びにプレス成形品の製造方法 |
| WO2023136023A1 (ja) * | 2022-01-11 | 2023-07-20 | Jfeスチール株式会社 | プレス成形品のスプリングバック量評価方法、装置及びプログラム、並びにプレス成形品の製造方法 |
| JP2023102255A (ja) * | 2022-01-11 | 2023-07-24 | Jfeスチール株式会社 | プレス成形品のスプリングバック量評価方法、装置及びプログラム、並びにプレス成形品の製造方法 |
Also Published As
| Publication number | Publication date |
|---|---|
| MX2021014239A (es) | 2022-01-06 |
| CN113853605A (zh) | 2021-12-28 |
| JP2020190923A (ja) | 2020-11-26 |
| KR102674934B1 (ko) | 2024-06-12 |
| CN113853605B (zh) | 2025-06-03 |
| KR20210151974A (ko) | 2021-12-14 |
| US20220222398A1 (en) | 2022-07-14 |
| EP3975031A4 (en) | 2022-07-13 |
| EP3975031A1 (en) | 2022-03-30 |
| JP6841295B2 (ja) | 2021-03-10 |
Similar Documents
| Publication | Publication Date | Title |
|---|---|---|
| JP6852750B2 (ja) | スプリングバック量乖離要因部位特定方法および装置 | |
| JP5582211B1 (ja) | 応力−ひずみ関係シミュレート方法、スプリングバック量予測方法およびスプリングバック解析装置 | |
| US20160288184A1 (en) | Method for Bending Metal Sheet to Achieve High Angle Accuracy | |
| JP6060591B2 (ja) | プレス成形品のスプリングバック要因特定方法および装置 | |
| CN110147602B (zh) | 一种建立折弯回弹角预测模型的方法及其应用 | |
| JP5834698B2 (ja) | プレス成形におけるスプリングバック要因分析方法及び装置 | |
| WO2010073756A1 (ja) | スプリングバック発生原因分析方法、スプリングバック発生原因分析装置、スプリングバック発生原因分析プログラム及び記録媒体 | |
| JP2009172677A (ja) | スプリングバック発生原因分析方法、その装置、そのプログラム及び記録媒体 | |
| WO2020158062A1 (ja) | スプリングバック量変動要因部位特定方法 | |
| JP6841295B2 (ja) | スプリングバック量乖離要因部位特定方法および装置 | |
| JP6149843B2 (ja) | プレス成形品の形状矯正解析方法及び装置、プレス成形品の形状矯正方法 | |
| JP6044606B2 (ja) | 見込み金型形状作成方法及び装置 | |
| JP6303815B2 (ja) | 鍛造割れ予測方法、鍛造割れ予測プログラム、および記録媒体 | |
| CN103747890B (zh) | 冲压成形品的反冲对策效果确认方法以及装置 | |
| JP5737059B2 (ja) | プレス成形シミュレーション解析方法及び装置 | |
| CN112685947A (zh) | 一种板料回弹模型参数优化方法、装置、终端及存储介质 | |
| JP2023102256A (ja) | プレス成形品の外周形状評価方法、装置及びプログラム、並びにプレス成形品の製造方法 | |
| JP7556373B2 (ja) | 成形シミュレーション用の摩擦係数決定方法、成形シミュレーション方法、プレス部品の設計方法、金型の製造方法、プレス成形部品の製造方法、摩擦係数決定プログラム、及び成形シミュレーション用のプログラム | |
| JP2023108091A (ja) | プレス成形品の外周形状評価方法、装置及びプログラム | |
| KR20240119094A (ko) | 프레스 성형 해석 방법, 프레스 성형 해석 장치 및 프레스 성형 해석 프로그램 |
Legal Events
| Date | Code | Title | Description |
|---|---|---|---|
| 121 | Ep: the epo has been informed by wipo that ep was designated in this application |
Ref document number: 20809819 Country of ref document: EP Kind code of ref document: A1 |
|
| ENP | Entry into the national phase |
Ref document number: 20217037893 Country of ref document: KR Kind code of ref document: A |
|
| WWE | Wipo information: entry into national phase |
Ref document number: MX/A/2021/014239 Country of ref document: MX |
|
| NENP | Non-entry into the national phase |
Ref country code: DE |
|
| ENP | Entry into the national phase |
Ref document number: 2020809819 Country of ref document: EP Effective date: 20211222 |
|
| WWP | Wipo information: published in national office |
Ref document number: MX/A/2021/014239 Country of ref document: MX |
|
| WWG | Wipo information: grant in national office |
Ref document number: 202080037875.2 Country of ref document: CN |
|
| WWG | Wipo information: grant in national office |
Ref document number: MX/A/2021/014239 Country of ref document: MX |