WO2020003624A1 - 消費電力推定装置 - Google Patents
消費電力推定装置 Download PDFInfo
- Publication number
- WO2020003624A1 WO2020003624A1 PCT/JP2019/009600 JP2019009600W WO2020003624A1 WO 2020003624 A1 WO2020003624 A1 WO 2020003624A1 JP 2019009600 W JP2019009600 W JP 2019009600W WO 2020003624 A1 WO2020003624 A1 WO 2020003624A1
- Authority
- WO
- WIPO (PCT)
- Prior art keywords
- power consumption
- target
- reference signals
- unit
- total
- Prior art date
- Legal status (The legal status is an assumption and is not a legal conclusion. Google has not performed a legal analysis and makes no representation as to the accuracy of the status listed.)
- Ceased
Links
Images



Classifications
-
- G—PHYSICS
- G01—MEASURING; TESTING
- G01R—MEASURING ELECTRIC VARIABLES; MEASURING MAGNETIC VARIABLES
- G01R21/00—Arrangements for measuring electric power or power factor
- G01R21/133—Arrangements for measuring electric power or power factor by using digital technique
-
- G—PHYSICS
- G06—COMPUTING OR CALCULATING; COUNTING
- G06Q—INFORMATION AND COMMUNICATION TECHNOLOGY [ICT] SPECIALLY ADAPTED FOR ADMINISTRATIVE, COMMERCIAL, FINANCIAL, MANAGERIAL OR SUPERVISORY PURPOSES; SYSTEMS OR METHODS SPECIALLY ADAPTED FOR ADMINISTRATIVE, COMMERCIAL, FINANCIAL, MANAGERIAL OR SUPERVISORY PURPOSES, NOT OTHERWISE PROVIDED FOR
- G06Q50/00—Information and communication technology [ICT] specially adapted for implementation of business processes of specific business sectors, e.g. utilities or tourism
- G06Q50/06—Energy or water supply
-
- H—ELECTRICITY
- H02—GENERATION; CONVERSION OR DISTRIBUTION OF ELECTRIC POWER
- H02J—ELECTRIC POWER NETWORKS; CIRCUIT ARRANGEMENTS OR SYSTEMS FOR SUPPLYING OR DISTRIBUTING ELECTRIC POWER; SYSTEMS FOR STORING ELECTRIC ENERGY
- H02J3/00—Circuit arrangements for AC mains or AC distribution networks
Definitions
- This specification discloses a power consumption estimation device that is installed in a predetermined area and estimates the power consumption of each of one or more target facilities whose operation state can be monitored.
- a regression analysis is performed based on time-series data of the total power consumption in the predetermined area and time-series data indicating the driving status of the equipment installed in the predetermined area.
- Patent Document 1 discloses an apparatus that calculates the power consumption of each of a plurality of air conditioners installed in a predetermined area.
- total air-conditioning power consumed by a plurality of air conditioners is obtained from total power consumed in a predetermined area and base power, which is power consumed by other than the air conditioners.
- the power consumption of each air conditioner is obtained based on the time series data of the electric power and the time series data indicating the driving state of each of the plurality of air conditioners. According to this technique, since it is not necessary to provide a power measuring device for each facility, it is possible to acquire the power consumption of each of a plurality of facilities at low cost.
- Patent Document 1 has a problem that the accuracy of estimating the base power, which is power consumed by devices other than the air conditioner, is low, and as a result, the accuracy of estimating the power consumption of each facility is low. That is, in Patent Literature 1, the total power consumption at a specific date and time (for example, the total power consumption in a time period when the air conditioner is not driven in a certain day satisfying a specific condition) is consumed by other than the air conditioner. Power, that is, the base power, and the value of the base power is considered to be constant even if the day and month change.
- a power consumption estimating apparatus estimates the amount of power consumed by equipment whose driving status cannot be monitored, for example, office equipment, from the number of personnel present in a predetermined area. (For example, Patent Document 2).
- a system for managing the number of personnel is separately required, which leads to an increase in cost.
- the present specification discloses a power consumption estimating apparatus that can estimate the power consumption of each target facility installed in a predetermined area with a simpler configuration and with higher accuracy.
- a power consumption estimating device disclosed in the present specification is a power consumption estimating device that is installed in a predetermined area and estimates the power consumption of each of one or more target facilities whose operation state can be monitored.
- a total power consumption obtaining unit that obtains time-series data of total power consumption, which is power consumption, and an operation state obtaining unit that obtains time-series data of operation parameters obtained by quantifying the operation state of the one or more target facilities.
- a reference signal generation unit that generates one or more reference signals each represented by a predetermined basis function, the obtained total power consumption as an objective variable, the obtained operation parameters of the one or more target facilities, and the generation By performing a multiple regression analysis using the component values of the one or more reference signals obtained as explanatory variables, the contribution of the one or more target facilities to the total power consumption is calculated.
- Azukado estimator by multiplying the operating parameters and the contribution of the target equipment, characterized in that it comprises a power consumption calculation unit for calculating a power consumption of the relevant equipment.
- the power consumption calculation unit may generate a breakdown of the total power consumption for each hour by calculating the power consumption of each of the one or more target facilities for each hour.
- the basis function may be a function in which a substantially mountain-shaped or substantially rectangular rising occurs only once.
- each reference signal may repeat the signal represented by the basis function every unit time.
- the one or more reference signals may include one or more signal groups, and each signal group may include a plurality of reference signals having the same shape and different phases.
- the plurality of reference signals belonging to the same signal group are represented by a substantially mountain-shaped function having a peak of width W, and may be out of phase by W / 2.
- the one or more reference signals include two or more signal groups, and a peak width of a reference signal belonging to one signal group is different from a peak width of a reference signal belonging to another signal group. Is also good.
- the power consumption estimation device in order to simulate power consumed by a plurality of reference signals other than the target facility, the power consumption of each of the target facilities installed in a predetermined area is simplified. With the configuration, estimation can be performed with higher accuracy.
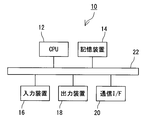
- FIG. 2 is a block diagram illustrating a physical configuration of a power consumption estimation device.
- FIG. 2 is a block diagram illustrating a functional configuration of a power consumption estimation device.
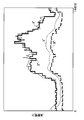
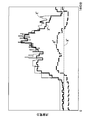
- FIG. 5 is a diagram illustrating an example of a reference signal. It is the figure which superimposed a plurality of reference signals. It is a figure explaining a regression model. It is a flowchart which shows the estimation process of a contribution. It is a flowchart which shows the estimation process of the breakdown of power consumption. It is a figure which shows the measured value and estimated value of the power consumption by this example.
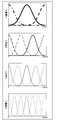
- FIG. 7 is a diagram illustrating an example of another reference signal.
- FIG. 7 is a diagram illustrating an example of another reference signal.
- FIG. 9 is a diagram illustrating an actual measurement value and an estimated value of power consumption according to the related art.
- FIG. 1 is a block diagram showing a physical configuration of the power consumption estimating apparatus 10
- FIG. 2 is a block diagram showing a functional configuration.
- This power consumption estimating apparatus 10 is an apparatus that estimates the power consumption of each of one or more target facilities installed in a predetermined area by regression analysis. That is, in general, a building such as a building or a factory is provided with a power meter for measuring the power consumption of the entire building or the entire floor. Using this power meter, the total power consumption of a predetermined area (for example, the whole building or the whole floor) can be grasped.
- the target facility is a facility whose operation is managed by the building management system, and is, for example, an air conditioning facility.
- the target facility is a facility whose operation is managed by the building management system, and is, for example, an air conditioning facility.
- the power consumption estimation device 10 estimates such individual power consumption of the target facility based on the total power consumption and the operation state of the target facility.
- the power consumption estimating apparatus 10 in which one whole building is defined as a “predetermined area” and a plurality of air conditioners installed in the whole building are “target facilities” will be described as an example.
- the power consumption estimating apparatus 10 is constructed by one or more computers driven according to a specific program. That is, as illustrated in FIG. 1, the power consumption estimation device 10 includes a CPU 12, a storage device 14, an input device 16, an output device 18, and a communication interface (hereinafter, referred to as “communication I / F”) 20. And are connected by a bus 22.
- the power consumption estimation device 10 includes a CPU 12, a storage device 14, an input device 16, an output device 18, and a communication interface (hereinafter, referred to as “communication I / F”) 20. And are connected by a bus 22.
- the CPU 12 performs various operations. Specifically, the CPU 12 reads the power consumption estimation program stored in the storage device 14 as necessary, and performs various calculations necessary for estimating the power consumption. The specific contents of the processing by the CPU 12 will be described later.
- the storage device 14 stores various data (including programs), and is configured by combining, for example, one or more semiconductor memories such as a RAM and a ROM, a hard disk drive, and a solid state drive.
- the storage device 14 stores a power consumption estimation program for estimating power consumption, which will be described later.
- the input device 16 receives an operation instruction and data input from an operator, and is configured by, for example, combining one or more of a keyboard, a mouse, a touch panel, a microphone, and the like.
- the output device 18 outputs various types of information to an operator, and is configured by combining, for example, one or more displays, speakers, and the like.
- the communication I / F 20 exchanges data with other electronic devices and information terminals. For example, the total power consumption detected by the building management system and the operation state of the target facility (air conditioning facility) are input to the power consumption estimation device 10 via the communication I / F 20. Further, the diagnosis result by the power consumption estimation device 10 may be sent to another information terminal via the communication I / F 20.
- FIG. 1 illustrates the power consumption estimation device 10 as one computer, the power consumption estimation device 10 may include a plurality of computers that can communicate with each other. In addition, the power consumption estimation device 10 may be a part of a building management system.
- the target facility 100 is a facility for which individual power consumption is to be estimated, and is a facility whose operation is managed by the building management system 110.
- the air conditioner installed in the building for example, an air conditioner indoor unit, an air conditioner outdoor unit, and the like are set as the target facilities 100.
- the non-monitoring facility 102 is a facility that consumes power and is not managed by the building management system 110. Therefore, the non-monitoring facility 102 includes, for example, lighting, an outlet, and the like.
- the target facility 100 and the non-monitoring facility 102 are both connected to a power supply 106 via a power supply line 103, and power is supplied from the power supply 106.
- the total value of the power supplied to the target facility 100 and the non-monitoring facility 102, that is, the total power consumption is measured by the power meter 104.
- the building management system 110 manages the operation of the target facility 100 according to a management program set in advance.
- the configuration of the building management system 110 can be changed as appropriate, but the building management system 110 has at least an operating state storage unit 114 and a total power consumption storage unit 112.
- the operation state storage unit 114 stores time-series data of the operation state of each of the plurality of target facilities 100. More specifically, the building management system 110 periodically acquires the operation state of each target facility 100 and stores the acquired operation state in the operation state storage unit 114 in association with the date and time. At this time, the building management system 110 represents the operating state by a numerical value. For example, it is represented by a numerical value of “1” during operation and “0” during operation stop.
- a numerical value indicating the operation state is referred to as an operation parameter.
- the value of the operation parameter may be a binary value of “1” during operation and “0” during operation stop.
- the operation parameter value is “1” during the heating operation, “0.8” during the cooling operation, “0.3” during the ventilation operation, and “0” during the stop operation.
- it may be set in multiple stages according to the operation type.
- the value of the operation parameter may be set according to a difference value between the target temperature of air conditioning and the current room temperature, the number of revolutions of the compressor, and the like.
- the operation state storage unit 114 stores time-series data of numerical values (operation parameter values) indicating the operation state of each of the plurality of target facilities 100.
- the total power consumption storage unit 112 stores time-series data of the total value (total power consumption) of the power consumption of the entire building. Specifically, the building management system 110 periodically acquires the total power consumption per unit time measured by the power meter 104 and stores the total power consumption in the total power consumption storage unit 112 in association with the date and time. It is desirable that the sampling timing of the total power consumption and the sampling timing of the operation state of the target facility 100 match. Further, the sampling period is not particularly limited, but is preferably set to a value of 30 seconds or more and within 1 hour, more preferably 1 minute or more and 10 minutes or less.
- the building management system 110 stores the time series data of the operation parameter value and the total power consumption, but these data are stored in the storage device 14 provided in the power consumption estimation device 10. You may.
- the power consumption estimating apparatus 10 estimates the individual power consumption of each of the plurality of target facilities 100 by performing a multiple regression analysis of the total power consumption as an objective variable, an operation parameter value, and components of a reference signal described later as explanatory variables. Before describing the functional configuration of the power consumption estimation device 10, the principle of individual power consumption estimation will be described.
- Total power consumption y n at a sampling time n consists a total value X n of the individual power consumption of the plurality of target equipment 100, the total value R n of the individual power consumption of the plurality of non-monitoring facility 102, the sum of.
- the y n X n + R n .
- X n is referred to as “target power consumption” and R n is referred to as “unmonitored power consumption”.
- the target power consumption Xn which is the total value of the individual power consumptions of the first to M-th target facilities 100, can be expressed by Expression 1.
- FIG. 3 is a diagram showing the first to fifth reference signals r1 to r5
- FIG. 4 is a diagram showing the first to fifth reference signals r1 to r5 superimposed.
- the reference signal is a signal obtained by repeating a signal represented by a predetermined basis function every unit time (for example, every 24 hours).
- the type of this basis function is not particularly limited, but is preferably a function in which a substantially mountain-shaped or substantially rectangular rising occurs only once.
- a Gaussian function shown in Expression 2 is used as a basis function.
- the Gaussian function is a mountain-shaped (more precisely, bell-shaped) function, but the width W of the mountain depends on ⁇ , and the center of the mountain depends on ⁇ .
- the i-th reference signal ri is a signal obtained by repeating the signal represented by Expression 2 every 24 hours.
- the peak width W is a period from when the value of ri exceeds 1% of the peak value until it becomes less than 1%.
- the non-monitored power consumption R n is expressed by Expression 3 using the first to I-th reference signals r1 to rI.
- bi is the contribution set for each reference signal ri.
- c is a constant term, which means power consumption that always occurs without depending on time.
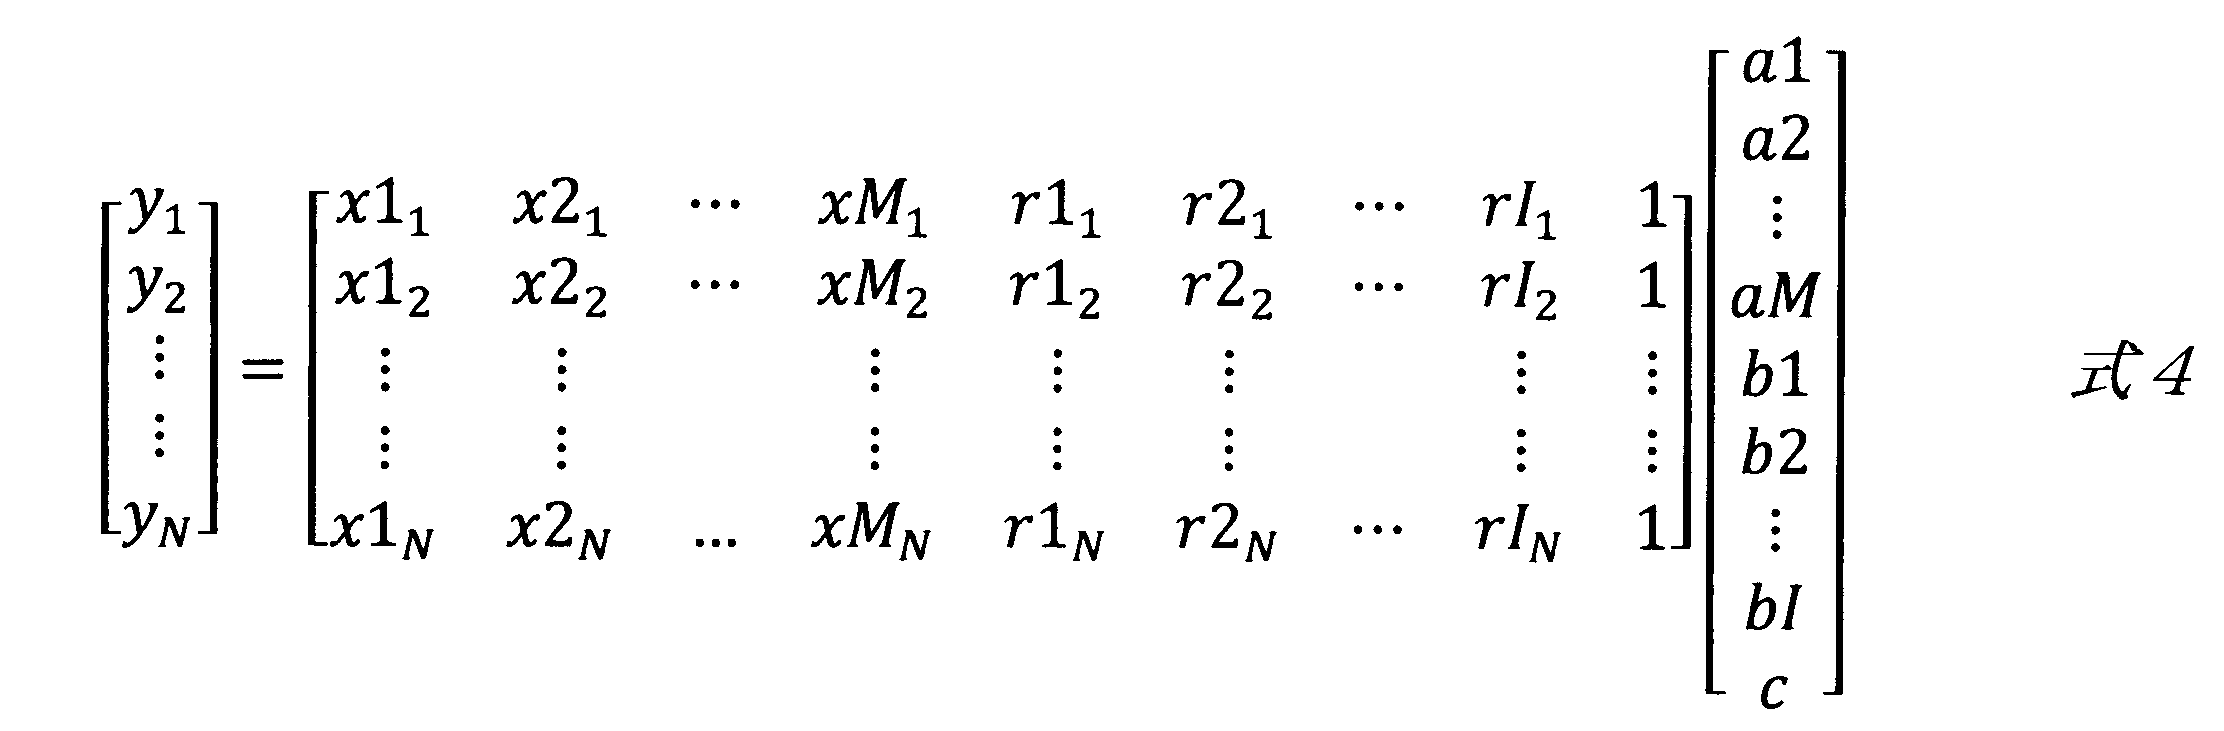
- the operating parameters xm n of the target equipment 100, and the reference signal ri n, the total power consumption y n is known, the contribution am and bi, the constant term c is unknown is there. If the contributions am and bi and the constant term c can be solved, the individual power consumption xm n ⁇ am of the target facility 100 can be obtained. Therefore, in this example, the power consumption is modeled by Expression 4, and the contributions am and bi and the constant term c are obtained by multiple regression analysis.
- FIG. 5 shows the description of each item of the equation (4).
- Equation 4 can be solved if N> (M + I + 1). Therefore, (M + I + 1) or more times, if collected total power consumption y n and operating parameters xm n is, it calculates the contribution am, bi and constant term c. Then, the operating parameters xm n of each target equipment 100, by multiplying the calculated contribution am, may calculate power consumption of the m target equipment 100 at the sampling timing n.
- the left side of Expression 4 is referred to as “total power vector”.
- the first matrix on the right side is called a “state matrix”.
- the power consumption estimation device 10 has a functional configuration capable of performing such calculations.
- the functional configuration of the power consumption estimation device 10 will be described again with reference to FIG.
- Total power vector generation unit 32 from the time-series data of the total power consumption y n stored in the total power consumption storage unit 112, the total power vector, i.e., generates a left-hand side vector in equation 4.
- total power vector generation unit 32 functions as the total power consumption acquiring unit for acquiring time series data of the total power consumption y n.
- the number N of samples constituting the total power vector is not particularly limited as long as it is equal to or more than the value (M + I + 1) obtained by adding the number M of the target equipment 100, the number I of reference signals, and 1 to each other. However, it is desirable that the number of samples N is equal to or more than 24 hours.
- State matrix generator 34 time-series data of the operating parameter values xm n stored in the operation state storage unit 114, and, based on the reference signal ri n generated by the reference signal generator 36, generates a status matrix I do.
- the state matrix generator 34 functions as the driving state acquisition unit for acquiring time series data of the operating parameter values xm n.
- Reference signal generating unit 36 in response to a request from the state matrix generating unit 34 generates a reference signal ri n.
- the generated total power vector and state matrix are input to the contribution estimating unit 38.
- the contribution estimating unit 38 solves the contributions am and bi and the constant term c after applying the total power vector and the state matrix vector to Expression 4. Since a known multiple regression analysis technique can be used for this calculation, a detailed description is omitted.
- the contributions am and bi and the constant term c calculated by the contribution estimation unit 38 are stored in the contribution storage unit 40.
- Breakdown calculating section 42 the operating parameters xm n of the target equipment 100 multiplies am stored in the contribution degree storage unit 40, and calculates the individual consumption of the target equipment 100, as the power consumption estimation unit Function.
- the power consumption of all the plurality of non-monitoring facilities 102 that is, the non-monitoring power consumption R n is calculated. I do.
- the breakdown of the power consumption at each time is calculated.
- the calculated details (individual power consumption and unmonitored power consumption R n of each target facility 100) are stored in the power consumption storage unit 44 in association with the time.
- FIG. 6 shows the flow of the process of estimating the degree of contribution.
- the process of estimating the contribution may be performed at least once. However, in order to improve the estimation accuracy, the process of estimating the contribution is repeatedly executed with a certain time interval, and the values of the contribution and the constant term stored in the contribution storage unit 40 are updated. It is desirable. That is, the contribution am of each of the plurality of target facilities 100 represents the individual power consumption per unit time (in the above example, the sampling period).
- the individual power consumption per unit time varies depending on the surrounding environment, deterioration of the target facility 100, and the like. By periodically estimating and updating the degree of contribution, it is possible to obtain an estimation result in which such deterioration of the target facility 100 is also taken into consideration.
- the total power vector generation unit 32 When estimating the degree of contribution, firstly, the total power vector generation unit 32, based on time-series data of the total power consumption y n, to produce a total power vector (S10). Further, the power consumption estimation device 10, the time series data of operational parameters xm n, the reference signal ri n, on the basis of, for generating a state matrix (S12).
- the contribution estimating unit 38 obtains the contributions am and bi and the constant term c by multiple regression analysis according to the regression model of Equation 4 (S14).
- the process of estimating the contribution ends (S16).
- FIG. 7 is a flowchart showing the flow of the process of estimating the breakdown of power consumption.
- the process of estimating the breakdown of the power consumption may be executed at any timing and any number of times after the contribution is calculated. Therefore, the process of estimating the breakdown may be performed periodically, or may be performed at a timing instructed by the user.
- breakdown calculation portion 42 reads the time series data of a plurality of target equipment 100 each operating parameters xm n acquired during the period to be estimated breakdown (S20). Further, the breakdown calculation unit 42 also reads a plurality of contributions am and bi and a constant term c stored in the contribution storage unit 40 (S22).
- breakdown calculation portion 42 the operating parameters xm n of the target facility 100, a value obtained by multiplying the contribution am, is calculated as a separate power of relevant equipment 100 (S24). Further, in Equation 3, the reference signal ri n, and, bi stored in the contribution degree storage unit 40, by fitting the c, calculates the unsupervised power R n (S26). Then, when these power consumptions are stored in the power consumption storage unit 44, the breakdown estimation processing ends (S28).
- the non-monitoring power R n is the total value of the power consumption of the non-monitoring facility 102, it simulates a plurality of reference signals ri n. Therefore, as compared with Patent Document 1 considered the unsupervised power R n is constant, it is possible to reduce the error, it is possible to further improve the estimation accuracy of the individual power consumption of the target equipment 100. Further, unlike in Patent Document 2 in which power consumption is simulated by the number of personnel, in this example, the number of personnel is not used for power consumption estimation. Therefore, a system (for example, an entrance system) for monitoring the number of personnel is not required, and the individual power consumption of the target facility 100 can be more easily estimated.
- FIGS. 8 and 11 are graphs respectively showing the measured values R # and X # and the estimated values R * and X * of the power consumption of a certain building for 24 hours. More specifically, in FIGS. 8 and 11, the total value of the power consumption of the plurality of non-monitoring facilities 102 (non-monitoring power consumption R) and the total value of the individual power consumption of the plurality of target facilities 100 (target power consumption X) Is a stacked graph.
- the bold dashed line indicates the measured value R # of the unmonitored power consumption
- the bold solid line indicates the measured value X # of the target power consumption drawn by being stacked on the measured value R # .
- the thin broken line indicates the estimated value R * of the unmonitored power consumption
- the thin solid line indicates the estimated value X * of the target power consumption drawn by being stacked on the estimated value R *. Is shown.
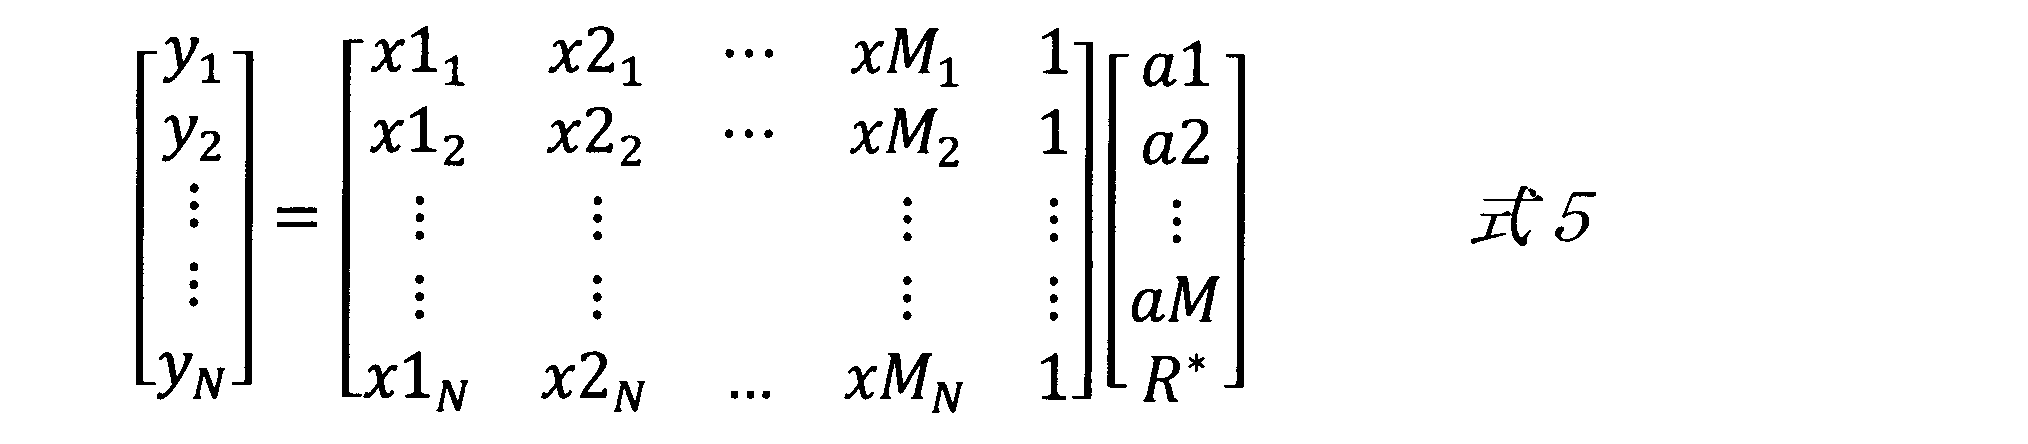
- the estimated values R * and X * are estimated based on the technology disclosed in Patent Document 1. That is, in FIG. 11, on the assumption that the estimated value R * is always constant, based on the actually measured value of the total power consumption and the operating state of the plurality of target facilities 100, Individual power consumption is determined by multiple regression analysis. That is, FIG. 11 finds each contribution am based on the regression model shown in Expression 5. As is apparent from Equation 5, in the related art, the estimated value R * of the unmonitored power consumption is treated as a known constant term in the regression model.
- the estimated value R * of the unmonitored power consumption is regarded as constant, so that the error between the estimated value R * of the unmonitored power consumption and the measured value R # increases. If the error of the constant term R * used in the regression model is large, the estimation accuracy using the regression model naturally deteriorates, and the estimation accuracy of the individual power consumption of the target facility 100 deteriorates. This is clear from the fact that the error between the estimated value X * of the target power consumption, which is the total value of the individual power consumption of the target facility 100, and the actually measured value X # is large in FIG.
- non-monitoring power consumption is simulated using a plurality of reference signals ri.
- the error between the estimated value R * of the unmonitored power consumption and the measured value R # is small. Since the unmonitored power consumption can be accurately estimated, in this example, the estimation accuracy of the individual power consumption of the target facility 100 is also improved. This is clear from the fact that the error between the estimated value X * of the target power consumption and the measured value X # is small in FIG.
- the configuration described so far is an example, and at least multiple regression is performed using time series data of total power consumption as an objective variable, time series data of operation parameters of a plurality of target facilities and components of a plurality of reference signals as explanatory variables.
- Other configurations may be appropriately changed as long as the power consumption of each of the plurality of target facilities is determined by the analysis.
- the forms of the plurality of reference signals may be appropriately changed.
- a peak-shaped signal having a width W of 12 hours is used as a reference signal, but the peak width W of the reference signal may be appropriately changed as shown in FIG.
- the width W of the reference signal ri is 24 hours, 16 hours, 12 hours, and 8 hours in order from the top.
- the phases of the plurality of reference signals ri are shifted by W / 2.
- the plurality of reference signals ri include two or more signal groups, and the width W of the peak of the reference signal ri belonging to one signal group is equal to the width W of the peak of the reference signal ri belonging to another signal group. May be different.
- the plurality of reference signals ri may be a combination of the four types of reference signals ri shown in FIG.
- Non-monitoring power consumption may be simulated by using a plurality of reference signals ri as shown in FIG.
- the shape of the reference signal may be changed as appropriate.
- the basis function representing the reference signal is a function in which a mountain-shaped or rectangular rising occurs only once.
- 10 power consumption estimating device 12 CPU, 14 storage device, 16 input device, 18 output device, 20 communication I / F, 22 bus, 32 total power vector generation unit (total power consumption acquisition unit), 34 state matrix generation unit ( Operating state acquisition unit), 36 reference signal generation unit, 38 contribution estimation unit, 40 contribution storage unit, 42 breakdown calculation unit (power consumption estimation unit), 44 power consumption storage unit, 100 target equipment, 102 non-monitoring equipment, 103 power supply line, 104 power meter, 106 power supply, 110 building management system, 112 total power consumption storage unit, 114 operation state storage unit.
Landscapes
- Engineering & Computer Science (AREA)
- Business, Economics & Management (AREA)
- Health & Medical Sciences (AREA)
- Economics (AREA)
- Physics & Mathematics (AREA)
- General Physics & Mathematics (AREA)
- Power Engineering (AREA)
- Human Resources & Organizations (AREA)
- Tourism & Hospitality (AREA)
- General Health & Medical Sciences (AREA)
- Public Health (AREA)
- Marketing (AREA)
- Primary Health Care (AREA)
- Strategic Management (AREA)
- Water Supply & Treatment (AREA)
- General Business, Economics & Management (AREA)
- Theoretical Computer Science (AREA)
- Testing And Monitoring For Control Systems (AREA)
- Management, Administration, Business Operations System, And Electronic Commerce (AREA)
- Supply And Distribution Of Alternating Current (AREA)
- Remote Monitoring And Control Of Power-Distribution Networks (AREA)
Abstract
Description



Claims (7)
- 所定区域に設置されるとともにその運転状態が監視可能な1以上の対象設備それぞれの消費電力を推定する消費電力推定装置であって、
前記所定区域全体での消費電力である合計消費電力の時系列データを取得する合計消費電力取得部と、
前記1以上の対象設備の運転状態を数値化した運転パラメータの時系列データを取得する運転状態取得部と、
それぞれが所定の基底関数で表される1以上の参照信号を生成する参照信号生成部と、
取得された前記合計消費電力を目的変数、取得された前記1以上の対象設備の運転パラメータおよび生成された前記1以上の参照信号の成分値を説明変数として重回帰分析することで、前記1以上の対象設備それぞれの前記合計消費電力に対する寄与度を算出する寄与度推定部と、
前記対象設備の前記寄与度と前記運転パラメータとを乗算することで、前記対象設備の消費電力を算出する消費電力算出部と、
を備えることを特徴とする消費電力推定装置。 - 請求項1に記載の消費電力推定装置であって、
前記消費電力算出部は、前記1以上の対象設備それぞれの消費電力を各時間ごとに算出することで、前記合計消費電力の各時間ごとの内訳を生成する、ことを特徴とする消費電力推定装置。 - 請求項1または2に記載の消費電力推定装置であって、
前記基底関数は、略山形または略矩形の立ち上がりが1回だけ発生する関数である、ことを特徴とする消費電力推定装置。 - 請求項3に記載の消費電力推定装置であって、
各参照信号は、前記基底関数で表される信号を、単位時間ごとに繰り返す、ことを特徴とする消費電力推定装置。 - 請求項3または4に記載の消費電力推定装置であって、
前記1以上の参照信号は、1以上の信号グループを含み、
各信号グループは、互いに同一の形状、かつ、互いに位相が異なる複数の参照信号を含む、
ことを特徴とする消費電力推定装置。 - 請求項4に記載の消費電力推定装置であって、
同一の信号グループに属する前記1以上の参照信号は、幅Wの山を持つ略山形の関数で表されており、W/2ずつ位相がずれている、
ことを特徴とする消費電力推定装置。 - 請求項5に記載の消費電力推定装置であって、
前記1以上の参照信号は、2以上の信号グループを含んでおり、
一つの信号グループに属する参照信号の山の幅は、他の信号グループに属する参照信号の山の幅と異なる、
ことを特徴とする消費電力推定装置。
Priority Applications (4)
| Application Number | Priority Date | Filing Date | Title |
|---|---|---|---|
| GB2020052.3A GB2586938B (en) | 2018-06-27 | 2019-03-11 | Power consumption estimation device |
| SG11202012877TA SG11202012877TA (en) | 2018-06-27 | 2019-03-11 | Power consumption estimation device |
| AU2019292449A AU2019292449B2 (en) | 2018-06-27 | 2019-03-11 | Power consumption estimation device |
| US17/083,572 US11215651B2 (en) | 2018-06-27 | 2020-10-29 | Power consumption estimation device |
Applications Claiming Priority (2)
| Application Number | Priority Date | Filing Date | Title |
|---|---|---|---|
| JP2018-122208 | 2018-06-27 | ||
| JP2018122208A JP7081070B2 (ja) | 2018-06-27 | 2018-06-27 | 消費電力推定装置 |
Related Child Applications (1)
| Application Number | Title | Priority Date | Filing Date |
|---|---|---|---|
| US17/083,572 Continuation US11215651B2 (en) | 2018-06-27 | 2020-10-29 | Power consumption estimation device |
Publications (1)
| Publication Number | Publication Date |
|---|---|
| WO2020003624A1 true WO2020003624A1 (ja) | 2020-01-02 |
Family
ID=68986911
Family Applications (1)
| Application Number | Title | Priority Date | Filing Date |
|---|---|---|---|
| PCT/JP2019/009600 Ceased WO2020003624A1 (ja) | 2018-06-27 | 2019-03-11 | 消費電力推定装置 |
Country Status (6)
| Country | Link |
|---|---|
| US (1) | US11215651B2 (ja) |
| JP (1) | JP7081070B2 (ja) |
| AU (1) | AU2019292449B2 (ja) |
| GB (1) | GB2586938B (ja) |
| SG (1) | SG11202012877TA (ja) |
| WO (1) | WO2020003624A1 (ja) |
Families Citing this family (6)
| Publication number | Priority date | Publication date | Assignee | Title |
|---|---|---|---|---|
| JP2022173831A (ja) * | 2021-05-10 | 2022-11-22 | 東京電力ホールディングス株式会社 | 学習装置、情報処理装置、学習方法、情報処理方法及びプログラム |
| WO2023021607A1 (ja) * | 2021-08-18 | 2023-02-23 | 三菱電機ビルソリューションズ株式会社 | 消費電力推定装置、消費電力推定方法および消費電力推定プログラム |
| JP2023147393A (ja) * | 2022-03-30 | 2023-10-13 | 大和ハウス工業株式会社 | 省エネルギー性能簡易予測システム |
| CN116414657A (zh) | 2023-03-24 | 2023-07-11 | 三星半导体(中国)研究开发有限公司 | 用于片上系统功耗分析的方法和系统 |
| CN116204566B (zh) * | 2023-04-28 | 2023-07-14 | 深圳市欣冠精密技术有限公司 | 一种数字化工厂监控大数据处理系统 |
| CN119363495B (zh) * | 2024-12-24 | 2025-04-01 | 中京科信技术有限公司 | 基于电源管理的通信设备优化方法及装置 |
Citations (3)
| Publication number | Priority date | Publication date | Assignee | Title |
|---|---|---|---|---|
| JP2014143819A (ja) * | 2013-01-23 | 2014-08-07 | Fujitsu Ltd | 情報処理装置、情報処理方法、情報処理システムおよび情報処理プログラム |
| JP2014229252A (ja) * | 2013-05-27 | 2014-12-08 | 株式会社日立製作所 | 計算機、予測方法、及び、予測プログラム |
| JP2015006105A (ja) * | 2013-06-21 | 2015-01-08 | 富士通株式会社 | 情報処理装置、情報処理方法、情報処理システムおよび情報処理プログラム |
Family Cites Families (22)
| Publication number | Priority date | Publication date | Assignee | Title |
|---|---|---|---|---|
| JP3591300B2 (ja) * | 1998-04-24 | 2004-11-17 | 株式会社日立製作所 | 電力供給制御装置 |
| JP2001056105A (ja) * | 1999-08-12 | 2001-02-27 | East Japan Railway Co | 蒸気弁自動制御システム及び記憶媒体 |
| JP2003189471A (ja) * | 2001-12-12 | 2003-07-04 | Mitsubishi Electric Corp | 電力需要家データ分析方法 |
| JP2003319556A (ja) | 2002-04-18 | 2003-11-07 | Daikin Ind Ltd | 目標電力制御装置及び目標電力制御方法 |
| JP4196635B2 (ja) | 2002-10-15 | 2008-12-17 | ダイキン工業株式会社 | 消費エネルギー量算出装置及び消費エネルギー量算出方法 |
| JP4130134B2 (ja) | 2003-02-26 | 2008-08-06 | 三洋電機株式会社 | 施設内機器の各運転モード毎の単位時間当たりの消費電力量算出装置および施設内機器の消費電力量算出装置 |
| JP2004280618A (ja) * | 2003-03-18 | 2004-10-07 | Hitachi Ltd | エネルギー管理システム |
| JP4346584B2 (ja) | 2004-08-12 | 2009-10-21 | 三洋電機株式会社 | デマンド制御装置およびプログラム |
| EP1729223A3 (en) | 2005-06-01 | 2011-12-14 | Sanyo Electric Co., Ltd. | Demand control apparatus, electric power consumption prediction method, and program therefor |
| JP5011830B2 (ja) * | 2006-06-09 | 2012-08-29 | 富士通セミコンダクター株式会社 | データ処理方法、データ処理プログラム、該プログラムを記録した記録媒体およびデータ処理装置 |
| JP4713623B2 (ja) * | 2008-09-25 | 2011-06-29 | 株式会社日立製作所 | 充放電管理装置 |
| JP2012017930A (ja) | 2010-07-09 | 2012-01-26 | Tokyo Electric Power Co Inc:The | 空調システム内機器の使用エネルギー量推定方法、及び、この方法が実装された使用エネルギー量推定装置 |
| JP2013101057A (ja) | 2011-11-09 | 2013-05-23 | Hitachi Ltd | 電力量管理方法、電力量管理装置、及び電力量管理プログラム |
| JP5720632B2 (ja) | 2012-06-29 | 2015-05-20 | ダイキン工業株式会社 | 空調制御システム |
| JP5914860B2 (ja) * | 2012-10-12 | 2016-05-11 | パナソニックIpマネジメント株式会社 | 管理装置 |
| JP2015002588A (ja) * | 2013-06-14 | 2015-01-05 | 株式会社日立製作所 | 電力消費管理システムおよび方法 |
| JP6414797B2 (ja) | 2014-01-09 | 2018-10-31 | 日新電機株式会社 | エネルギー消費量計算装置 |
| JP6249895B2 (ja) * | 2014-07-03 | 2017-12-20 | シャープ株式会社 | 電力制御システム、方法及び電力制御装置 |
| JP6564264B2 (ja) * | 2014-09-16 | 2019-08-21 | 積水化学工業株式会社 | 電力管理システム及び電力管理方法 |
| JP6498976B2 (ja) * | 2015-03-20 | 2019-04-10 | 株式会社東芝 | 推定装置、推定方法およびコンピュータプログラム |
| JP6091568B1 (ja) | 2015-09-01 | 2017-03-08 | 株式会社Looop | 電力消費量予測制御装置、電力消費量予測方法および電力消費量予測プログラム |
| WO2018101363A1 (ja) * | 2016-11-30 | 2018-06-07 | 日本電気株式会社 | 状態推定装置と方法とプログラム |
-
2018
- 2018-06-27 JP JP2018122208A patent/JP7081070B2/ja active Active
-
2019
- 2019-03-11 AU AU2019292449A patent/AU2019292449B2/en active Active
- 2019-03-11 WO PCT/JP2019/009600 patent/WO2020003624A1/ja not_active Ceased
- 2019-03-11 GB GB2020052.3A patent/GB2586938B/en active Active
- 2019-03-11 SG SG11202012877TA patent/SG11202012877TA/en unknown
-
2020
- 2020-10-29 US US17/083,572 patent/US11215651B2/en active Active
Patent Citations (3)
| Publication number | Priority date | Publication date | Assignee | Title |
|---|---|---|---|---|
| JP2014143819A (ja) * | 2013-01-23 | 2014-08-07 | Fujitsu Ltd | 情報処理装置、情報処理方法、情報処理システムおよび情報処理プログラム |
| JP2014229252A (ja) * | 2013-05-27 | 2014-12-08 | 株式会社日立製作所 | 計算機、予測方法、及び、予測プログラム |
| JP2015006105A (ja) * | 2013-06-21 | 2015-01-08 | 富士通株式会社 | 情報処理装置、情報処理方法、情報処理システムおよび情報処理プログラム |
Also Published As
| Publication number | Publication date |
|---|---|
| GB2586938A (en) | 2021-03-10 |
| GB2586938B (en) | 2021-09-29 |
| JP2020004041A (ja) | 2020-01-09 |
| GB202020052D0 (en) | 2021-02-03 |
| US11215651B2 (en) | 2022-01-04 |
| US20210041487A1 (en) | 2021-02-11 |
| SG11202012877TA (en) | 2021-02-25 |
| AU2019292449B2 (en) | 2021-04-22 |
| AU2019292449A1 (en) | 2020-12-10 |
| JP7081070B2 (ja) | 2022-06-07 |
Similar Documents
| Publication | Publication Date | Title |
|---|---|---|
| WO2020003624A1 (ja) | 消費電力推定装置 | |
| US9753477B2 (en) | Load forecasting for residential sector demand response | |
| Aman et al. | Holistic measures for evaluating prediction models in smart grids | |
| US8799205B2 (en) | Systems and methods for virtual sub-metering | |
| JP6985833B2 (ja) | データ処理装置、制御システム、データ処理方法及びプログラム | |
| WO2013090026A2 (en) | Automated monitoring for changes in energy consumption patterns | |
| WO2015136666A1 (ja) | 個別電気機器稼働状態推定装置、およびその方法 | |
| JP2021193563A (ja) | 資産の予測健全性解析を実行するための方法およびコンピューティングシステム | |
| Martin et al. | Energy calibration of HVAC sub-system model using sensitivity analysis and meta-heuristic optimization | |
| WO2013090017A2 (en) | Systems, methods and devices for determining energy conservation measure savings | |
| JP2025142367A (ja) | データ処理方法及び電子機器 | |
| US20240135468A1 (en) | Power Consumption Estimation Device, Power Consumption Estimation Method, and Non-transitory Computer Readable Storage Medium Storing Power Consumption Estimation Program | |
| WO2016056113A1 (ja) | 省エネルギ化診断装置、省エネルギ化診断方法およびプログラム | |
| JP6919856B2 (ja) | 強化学習プログラム、強化学習方法、および強化学習装置 | |
| JP6086875B2 (ja) | 発電量予測装置および発電量予測方法 | |
| Kim | Hybrid modeling approach for better identification of building thermal network model and improved prediction | |
| CN114564487B (zh) | 预报预测相结合的气象栅格数据更新方法 | |
| Figueiredo et al. | On the regularization parameter selection for sparse code learning in electrical source separation | |
| Namboodiri et al. | Analytical calculation of errors in time and value perception due to a subjective time accumulator: A mechanistic model and the generation of Weber’s law | |
| Fraga et al. | Optimisation as a tool for gaining insight: an application to the built environment | |
| Ledva et al. | Disaggregating load by type from distribution system measurements in real time | |
| JP6417152B2 (ja) | 機器電力推定方法およびシステム | |
| JP6143919B2 (ja) | 電気機器モニタリング装置およびその方法 | |
| JP7525032B1 (ja) | 性能評価装置、性能評価方法、及びプログラム | |
| TW202346876A (zh) | 耗電量估算裝置、程式產品及耗電量估算方法 |
Legal Events
| Date | Code | Title | Description |
|---|---|---|---|
| 121 | Ep: the epo has been informed by wipo that ep was designated in this application |
Ref document number: 19826365 Country of ref document: EP Kind code of ref document: A1 |
|
| ENP | Entry into the national phase |
Ref document number: 2019292449 Country of ref document: AU Date of ref document: 20190311 Kind code of ref document: A |
|
| ENP | Entry into the national phase |
Ref document number: 202020052 Country of ref document: GB Kind code of ref document: A Free format text: PCT FILING DATE = 20190311 |
|
| NENP | Non-entry into the national phase |
Ref country code: DE |
|
| 122 | Ep: pct application non-entry in european phase |
Ref document number: 19826365 Country of ref document: EP Kind code of ref document: A1 |