WO2019235015A1 - 分析装置 - Google Patents
分析装置 Download PDFInfo
- Publication number
- WO2019235015A1 WO2019235015A1 PCT/JP2019/009851 JP2019009851W WO2019235015A1 WO 2019235015 A1 WO2019235015 A1 WO 2019235015A1 JP 2019009851 W JP2019009851 W JP 2019009851W WO 2019235015 A1 WO2019235015 A1 WO 2019235015A1
- Authority
- WO
- WIPO (PCT)
- Prior art keywords
- wavelength
- sample
- light
- component
- sample component
- Prior art date
- Legal status (The legal status is an assumption and is not a legal conclusion. Google has not performed a legal analysis and makes no representation as to the accuracy of the status listed.)
- Ceased
Links
Images


Classifications
-
- G—PHYSICS
- G01—MEASURING; TESTING
- G01N—INVESTIGATING OR ANALYSING MATERIALS BY DETERMINING THEIR CHEMICAL OR PHYSICAL PROPERTIES
- G01N21/00—Investigating or analysing materials by the use of optical means, i.e. using sub-millimetre waves, infrared, visible or ultraviolet light
- G01N21/17—Systems in which incident light is modified in accordance with the properties of the material investigated
- G01N21/25—Colour; Spectral properties, i.e. comparison of effect of material on the light at two or more different wavelengths or wavelength bands
- G01N21/27—Colour; Spectral properties, i.e. comparison of effect of material on the light at two or more different wavelengths or wavelength bands using photo-electric detection ; circuits for computing concentration
-
- G—PHYSICS
- G01—MEASURING; TESTING
- G01N—INVESTIGATING OR ANALYSING MATERIALS BY DETERMINING THEIR CHEMICAL OR PHYSICAL PROPERTIES
- G01N35/00—Automatic analysis not limited to methods or materials provided for in any single one of groups G01N1/00 - G01N33/00; Handling materials therefor
- G01N35/10—Devices for transferring samples or any liquids to, in, or from, the analysis apparatus, e.g. suction devices, injection devices
Definitions
- the present invention relates to an analyzer for analyzing sample components contained in a sample.
- a dedicated container is prepared, and a biological sample of a patient is collected in the container and pre-processed.
- the sample is blood
- the collected blood is put into a blood collection tube.
- blood can be separated into blood clot and serum, or blood cells and plasma can be separated, thereby obtaining serum or plasma that is a necessary component for analysis. .
- the probe As a process necessary before conducting a test on a liquid component of a sample containing biologically derived molecules such as serum and plasma, there is a process of detecting the position and amount of the liquid component. This is because if the amount of liquid is unknown, the probe may pierce the separating agent or blood cells during dispensing, and an error due to clogging may occur. If the amount of the liquid component can be detected at the pretreatment stage, the probe height can be controlled to avoid an error due to clogging. Furthermore, when the amount of liquid component does not satisfy the amount required for analysis, the dispensing amount can be determined by giving priority to analysis items. Therefore, if the amount of the liquid component can be detected in the preprocessing stage, the efficiency of the inspection is expected.
- Patent Documents 1 to 4 listed below are techniques for detecting the amount of liquid components such as serum and plasma, or detecting the layer position of liquid components.
- Patent Document 1 uses a first light beam that passes through serum and is blocked by blood clots, and a second light beam that is blocked by blood serum and blood clots. The light beams transmitted by the first and second beams are transmitted through a container. A method for detecting and determining the sample layer position from the difference between the transmitted light amounts of the two is disclosed.
- Patent Document 2 discloses a method for determining a sample layer position from a difference value of each absorbance by using a first light beam that is specifically absorbed in serum, a second light beam that is not specifically absorbed in serum, and a third light beam. Is disclosed.
- Patent Document 3 irradiates a sample with a light beam composed of first and second wavelength components, receives light transmitted through the sample, and then separates the first and second components by signal processing.
- a method of determining a sample layer position from the quotient of two wavelength components is disclosed.
- Patent Document 4 discloses a technique for obtaining a first derivative of a quotient of a first wavelength component and a second wavelength component transmitted through a sample and obtaining a boundary between liquid levels based on the first derivative.
- Specimen pre-treatment generally requires measurement without opening the sample container lid. This is to prevent the sample from spilling when the lid is opened and causing contamination between the samples.
- specimen identification information such as a barcode label is often printed on the sample container, and there is a demand for measurement even for a sample whose contents are difficult to visually recognize.
- the state of the sample differs depending on the blood collection tube used. In the case of a test tube containing a separating agent, the sample has a four-layer structure of blood clot / separating agent / serum / air, and in the case of a test tube for coagulation analysis, the sample has a three-layer structure of blood cell / plasma / air. Have. As described above, even when the configuration of the component layer is different for each sample, it is necessary to detect the height of each component layer.
- Patent Documents 1 and 2 measure the light transmission amount using light beams having a plurality of wavelengths having different transmittances in each biological sample layer.
- this technique by calculating the difference value of the light transmission amount, it is possible to calculate the boundary surface position of the sample layer by removing the influence of light scattering on the label.
- this technique requires a light projecting device and a light receiving device corresponding to the number of light beams used for measurement, the device becomes large and expensive, and adjustment is not easy.
- due to scattering of the light beam a plurality of light beams may interfere with each other at the time of light detection, and the measurement accuracy error of the boundary surface position of the sample layer may increase.
- Patent Document 3 measures a light transmission amount using a light beam composed of first and second wavelength components.
- This technique solves the problem that the light beams having different wavelengths interfere with each other by separating them into first and second wavelength components by signal processing after light detection using phase modulation and demodulation. .
- this technique can only separate the first and second wavelength components that are the wavelength of the incident light. For example, it is difficult to extract light having a wavelength narrower than the wavelength band of the light source.
- a biological sample such as blood has various components depending on the health condition of the individual and the acquisition environment of the sample, and the characteristic light absorption and transmission wavelengths differ by several nanometers. Therefore, this technique still has a problem in detecting the component of the sample layer and the position of the boundary surface with high reliability and accuracy.
- Patent Document 4 obtains the first derivative of the quotient of the first wavelength component and the second wavelength component transmitted through the sample, and obtains the boundary between the liquid levels based on the first derivative. (Claims 1-2, 0064-0065 of the same document). Since this method is presumed to use a plurality of light sources having different wavelengths as in Patent Documents 1 and 2 (0027 of Patent Document 4, light source 2 and 3), There are similar issues. The method of Patent Document 4 is based on the premise that the quotient of the first wavelength component and the second wavelength component is obtained (0007 and 0064-0065 of the same document), and therefore the sample components that can be detected are those It is thought that it is restricted by the wavelength.
- the present invention has been made in view of the above problems, and provides an analyzer that can accurately detect a sample component in a container and a boundary surface position between sample components without using a plurality of light sources. It is intended.
- the analyzer according to the present invention irradiates light to a container containing one or more sample components separated from a sample in layers, and sets a wavelength at which the light intensity of the light transmitted through the sample is maximum for each layer. By specifying, each sample component contained in the container is specified.
- the position of the sample component layer or the boundary surface between the sample layers in the container can be detected with high accuracy without using a plurality of light sources.
- FIG. 1 is a configuration diagram illustrating an outline of a biological sample analyzer 10 according to Embodiment 1.
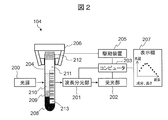
- FIG. 2 is a configuration diagram of a detection device 104.
- FIG. It is an example of a structure of the wavelength spectroscopy part 201 in a sample detection apparatus, and its peripheral element. It is a figure which shows a mode that the drive device 205 changes the position which irradiates the light from the light source 200 with respect to the test tube 204.
- FIG. The wavelength dependence of the transmitted light amount after passing through each sample component is shown. It is a schematic diagram of the result of normalizing the transmitted light amount after passing through each sample with the respective maximum values.
- FIG. 5 is a schematic diagram of an irradiation position when a label 213 is affixed to a test tube 204, and a schematic diagram of the wavelength dependence of the amount of transmitted light after passing through each sample. It is a plot of the wavelength with which the amount of transmitted light after passing through the sample is maximum, obtained while changing the position of the test tube 204 using the driving device 205. For example, it is an example of the result of specifying the interface position between sample component layers in the same manner for a sample used in blood coagulation analysis or the like.
- FIG. 1 is a configuration diagram showing an outline of a biological sample analyzer 10 according to Embodiment 1 of the present invention.
- the biological sample analyzer 10 is a device that preprocesses a biological sample collected from a patient using the preprocessing system 100 and analyzes the sample using the automatic analyzer 112.
- the biological sample analyzer 10 includes a pretreatment system 100, a control PC 111, and an automatic analyzer 112.
- the pretreatment system 100 includes a transfer line 101, a loading module 102, a centrifuge module 103, a detection device 104, a plugging module 105, a labeler 106 (for example, using a barcode), a dispensing module 107, a plugging module 108, and a sorting module. 109, a storage module 110 is provided.
- the control PC 111 controls the entire apparatus including the preprocessing system 100.
- the automatic analyzer 112 analyzes the components of the biological sample by, for example, quantitative analysis.
- a biological sample for example, blood or urine
- a biological sample for example, blood or urine
- blood collection and sample input into the input module 102 are performed manually by the user.
- the specimen is placed on the transport line 101 and is placed between the centrifuge module 103, the detection device 104, the opening module 105, the labeler 106, the dispensing module 107, the closing module 108, the sorting module 109, and the storage module 110. Moved.
- the centrifuge module 103 performs centrifuge on the input specimen.
- the biological sample is blood and a separating agent is contained in a test tube
- the sample is separated into a clot layer and a serum layer by centrifugation with the separating agent interposed therebetween.
- the biological sample is blood and no separating agent is contained in the test tube
- the sample is separated into a blood cell layer and a plasma layer by centrifugation.
- the detection device 104 detects a component of the biological sample layer, a position of the biological sample layer, a liquid amount of the biological sample, and the like.
- the specimen is moved to the sorting module 109 and classified as an error specimen.
- the specimen is moved to the opening module 105 by the transport line 101 in order to perform biochemistry and immunoassay.
- Opening module 105 opens the sample stopper.
- the dispensing module 107 divides the centrifuged specimen (parent specimen) into small parts (child specimens) for analysis by the automatic analyzer 112 or the like.
- the labeler 106 affixes a barcode label to the subdivided container.
- the closing module 108 closes the stopper of each sample container.
- the sorting module 109 sorts the parent sample and the child sample, and moves them to the storage module 110 in the case of the parent sample and to the automatic analyzer 112 in the case of the child sample.
- the automatic analyzer 112 performs quantitative analysis on each sample component of the specimen. Some components (for example, the dispensing module 107) may be shared between the automatic analyzer 112 and the pretreatment system 100.
- FIG. 2 is a configuration diagram of the detection device 104.
- a test tube 204 containing a sample is also shown on the drawing.
- the detection device 104 includes a light source 200, a wavelength spectroscopic unit 201, a light receiving unit 202, a computer 203 (corresponding to “control device” and “calculation device”), a drive device 205, and a gripping device 206.
- the gripping device 206 arranges the test tube 204 so as to be sandwiched between the light source 200 and the light receiving unit 202.
- the light source 200 emits light from the side surface of the test tube 204 including the sample to be measured.
- the drive device 205 moves the test tube 204 in the vertical direction to change the position in the height direction at which the light from the light source 200 is irradiated onto the test tube 204.
- the wavelength spectroscopic unit 201 separates light of a specific wavelength component from the light from the light source 200 that has passed through the sample.
- the light receiving unit 202 measures the transmitted light amount (light intensity) of the separated wavelength component.
- the computer 203 is connected to the wavelength spectroscopic unit 201 / light receiving unit 202 / drive device 205 and controls them. For example, in accordance with an instruction from the computer 203, the wavelength spectroscopic unit 201 changes the wavelength band of the light to be separated.
- the transmitted light output from the light receiving unit 202 is subjected to signal processing by the computer 203 after A / D conversion, for example.
- the drive device 205 changes the relative positional relationship in the height direction between the test tube 204 and the light source 200 (the positions in the height direction of the wavelength spectroscopic unit 201 and the light receiving unit 202 are also adjusted to the position of the light source 200). Thereby, the amount of transmitted light at a specific height on the test tube 204 is measured.
- the display 207 outputs the measurement result obtained by the light receiving unit 202. For example, a light transmission amount for each wavelength, a sample component arranged at a specific height, and the like are output.
- the test tube 204 When the measurement target is blood, the test tube 204 includes, for example, a blood clot 208, a separating agent 209, serum 210, and air 211, and is capped with a cap 212.
- a label 213 made of paper or a seal On the outer periphery of the test tube 204, a label 213 made of paper or a seal, which is used for the type of the test tube 204, an inspection item, or a patient identification application, may be attached.
- the label 213 may be printed with a bar code, characters, and the like.
- FIG. 3 is a configuration example of the wavelength spectroscopic unit 201 and its peripheral elements in the sample detection apparatus.
- the light source 200 is disposed on the side of the test tube 204 and irradiates the side surface of the test tube 204 with light.
- the irradiated light is preferably collected using the lens 300 so as to pass through the sample.
- a light source that generates light having a wavelength in the vicinity of a region where a light absorption peak of a sample to be measured here, serum
- a wavelength in the range of 1300 to 1700 nm is preferable.
- a light emitting diode having a central wavelength of 1450 nm is used.
- This light having the central wavelength is well absorbed by water, which is the main component of serum, and light having a wavelength shorter than the central wavelength is transmitted through water.
- the light in this wavelength band has a property of transmitting the separating agent at a wavelength longer than the center wavelength, and is absorbed by the blood clot in the entire wavelength band.
- any of a laser, a light emitting diode, and a halogen lamp may be used.
- a laser high directivity and high output can be obtained, and in the case of a light emitting diode, there is a cost merit.
- a light source having a wide emission wavelength region may be used by arranging a plurality of lasers and light emitting diodes next to each other or by combining them with lenses, fibers, or the like. Since the light emission wavelength of the light source 200 slightly changes depending on the ambient temperature or the like, a temperature sensor is arranged near the light source 200, the control voltage is changed according to the temperature, or the light source 200 is controlled to a constant temperature. Is preferred.
- the light from the light source 200 passes through the test tube 204 including the sample, and is then collected again by the lens 300 and passes through the wavelength spectroscopic unit 201.
- the wavelength spectroscopic unit 201 has a function of extracting light having an arbitrary wavelength from incident light.
- Examples of the wavelength spectroscopic unit 201 include a filter that extracts light of a specific wavelength using light interference, an optical filter that uses a thin film of a material having wavelength selectivity, a prism that can spatially separate light for each wavelength, A diffraction grating or the like is used. As shown in FIG. 4C, which will be described later, blood has a light intensity peak in an adjacent wavelength region.
- the wavelength spectroscopic unit 201 has a wavelength resolution of about 20 nm full width at half maximum or smaller.
- a Fabry-Perot filter using optical interference which has a high wavelength resolution and a large cost merit and can simplify the apparatus configuration, is used.
- the surface area of the light receiving unit 202 can be increased, which is effective when light is scattered by the label on the surface of the test tube 204.
- the use of a diffraction grating is effective when measuring with high wavelength resolution.
- the wavelength spectroscopic unit 201 includes, for example, two mirror thin films 301, an intermediate layer 302, and a voltage control device 303.
- the two mirror thin films 301 are opposed to each other with an intermediate layer 302 having a thickness of several ⁇ m, and can transmit light having a specific wavelength according to the gap between the mirrors.
- the voltage controller 303 controls the electrostatic attractive force by the voltage controller 303 and changing the distance between the two mirror thin films 301, light having an arbitrary wavelength can be transmitted.
- the gap between the mirrors becomes smaller as the voltage applied to the voltage control device 303 is increased, and light on the shorter wavelength side is transmitted.
- the gap between the mirrors slightly changes depending on the ambient temperature, so a temperature sensor is arranged near the wavelength spectroscopic unit 201 and the control voltage is changed according to the temperature, or It is preferable to control the wavelength spectroscopic unit 201 to a constant temperature.
- the light having an arbitrary wavelength that has passed through the wavelength spectroscopic unit 201 is converted into a signal representing the amount of transmitted light by the light receiving unit 202.
- a photodiode is often used as the light receiving unit 202.
- an InGaAs (indium gallium arsenide) photodiode having high sensitivity in the near infrared region is preferable.
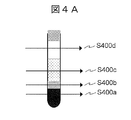
- FIG. 4A is a diagram illustrating a state in which the position where the light from the light source 200 is irradiated onto the test tube 204 is changed by the driving device 205.
- S400a is an irradiation position for the clot layer
- S400b is an irradiation position for the separating agent layer
- S400c is an irradiation position for the serum layer
- S400d is an irradiation position for the air layer.
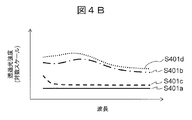
- FIG. 4B shows the wavelength dependence of the amount of transmitted light after passing through each sample component.
- S401a is a clot
- S401b is a separating agent
- S401c is serum
- S401d is the amount of transmitted light after passing through air.
- the light source 200 preferably emits light in the near-infrared region, and the light in the near-infrared region is transmitted through the air and the test tube. .
- the transmitted light amount S401b that has passed through the separating agent is the second largest.
- the separating agent tends to transmit light in the near-infrared region in general, but the tendency becomes more prominent on the long wavelength side. Serum tends to absorb light in the near-infrared region, and the tendency becomes remarkable particularly at a long wavelength. Since the clot absorbs light strongly in the entire near infrared region, the transmitted light amount S401a transmitted through the clot is the smallest.
- the transmitted light amount and the characteristic wavelength of the transmitted light amount are greatly different depending on the sample component through which the light from the light source 200 is transmitted.
- the amount of transmitted light also depends on the thickness of the sample (in this example, the short direction of the test tube 204), and it is necessary to pay attention to the characteristic wavelength when detecting sample components.
- FIG. 4C is a schematic diagram of a result obtained by normalizing the amount of transmitted light after passing through each sample by the maximum value.
- S402a shows a blood clot
- S402b shows a separating agent
- S402c shows serum
- S402d shows the result of normalizing the amount of transmitted light after passing through each maximum value.
- the blood clot layer In the blood clot layer, light from the light source 200 is absorbed in the entire wavelength region, so that there is no characteristic wavelength in S402a, and the wavelength dependence is flat. Since the air layer hardly absorbs light from the light source 200, S402d has a shape close to the spectrum unique to the light source 200.
- the spectrum has one peak near the center wavelength of the light source 200.
- the olefin resin which is the main component of the separating agent, transmits near-infrared light, it absorbs light in the short wavelength region as compared with air. It shifts to the long wavelength side, and becomes a wavelength dependent characteristic like S402b.
- Water which is the main component of serum, strongly absorbs light in the long-wavelength side of the near infrared region, particularly 1450 nm and 1900 nm, and the intermediate wavelength region of both wavelengths, so the spectrum is shorter than the wavelength inherent to the light source 200. Has a peak.
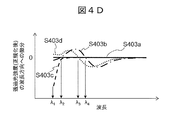
- FIG. 4D is a schematic diagram of a result of calculating a first derivative with respect to a value obtained by normalizing a transmitted light amount after passing through each sample with a maximum value.
- the first derivative is calculated in the wavelength direction. That is, the increment of the amount of transmitted light with respect to the increment of wavelength is the first derivative.
- S403a is a clot
- S403b is a separating agent
- S403c is serum
- S403d is the first derivative of a value obtained by normalizing the amount of light transmitted after passing through.
- the wavelength at which the value of the first derivative zero-crosses means the wavelength at which the amount of transmitted light becomes a minimum value or a maximum value. Therefore, by specifying the wavelength of the zero cross point, the characteristic wavelength of each sample component can be accurately specified.
- the following can be specified as the characteristic wavelength representing each sample component.
- the separating agent and the air have transmitted light peaks at specific wavelengths ⁇ 4 and ⁇ 3, respectively, so that the first derivative zero-crosses at these wavelengths. Therefore, it can be specified that the component layers whose first derivatives are zero-crossed at these wavelengths are the serum layer and the air layer, respectively.
- the component layer is a serum layer. It can be seen that the component layer having a flat characteristic regardless of the wavelength region is a clot layer.
- the value of the first derivative of the transmitted light amount is used for convenience of specifying the characteristic wavelength component.
- the normalized transmitted light amount itself is also a characteristic spectral characteristic. Therefore, the same processing can be performed using this.
- S402c it is possible to specify whether or not the transmitted light amount is sharply attenuated in the short wavelength region based on the difference between the wavelength at which the transmitted light amount is maximum and the minimum wavelength.
- a minimum value such as ⁇ 2 is shown.
- the wavelength may be extracted and used to identify each sample component layer. The distinction between the minimum value and the maximum value may be grasped in advance for each sample component.
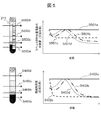
- FIG. 5 is a schematic diagram of an irradiation position when the label 213 is attached to the test tube 204, and a schematic diagram of the wavelength dependence of the amount of transmitted light after passing through each sample.
- S500a is a schematic diagram of a light beam when a label and a blood clot are measured
- S500b is a label and a separating agent
- S500c is a label and serum
- S500d is a label and air.
- S501a indicates the label and blood clot
- S501b indicates the label and separation agent
- S501c indicates the label and serum
- S501d indicates the result of normalizing the transmitted light amount after passing through the label and air, respectively.
- the wavelength characteristics described in FIG. 4C are also shown.
- the peak wavelength does not change. Therefore, the position of the sample component layer can be detected regardless of the presence or absence of the label 213.
- the label 213 When the label 213 is attached to the surface of the test tube 204, the light from the light source 200 is scattered on the surface of the label 213, or the light is absorbed inside the label 213, so that the amount of light detected by the light receiving unit 202 decreases. .
- the main cause of the decrease in the amount of light due to the label 213 being affixed is light scattering on the surface of the label 213. Due to this light scattering, a constant light amount decreases in the entire wavelength region regardless of the wavelength in the near infrared region. That is, regardless of the presence or absence of the label 213, the wavelength at which the amount of transmitted light reaches a peak is determined depending only on the sample component. Therefore, the sample components of blood clot, separating agent, serum, and air can be specified by the method described in FIGS. 4B to 4D. Therefore, even if the label 213 exists, the sample component can be accurately specified.
- the label 213 faces the light receiving unit 202, but the first embodiment may be applied when the label 213 faces the light source 200.
- the first embodiment may be applied even when the label is attached over the entire circumference of the test tube 204 and it is difficult to visually confirm the contents, or when a plurality of labels are attached in an overlapping manner.
- a high-power laser or a high-power light-emitting diode may be used to transmit the label, or a high power can be obtained instantaneously by making the timing of light emission intermittent.
- the light source 200 may be controlled as described above. When a plurality of labels are attached, not only the light source 200 but also the light receiving unit 202 is required to measure the amount of light with a wide dynamic range.
- the signal obtained by the light receiving unit 202 may be detected in a wide dynamic range using a logarithmic amplifier, or an automatic gain control amplifier capable of dynamically changing the gain may be used. Furthermore, in the case of the pulse light emission described above, the signal-to-noise ratio may be improved by performing measurement in synchronization with the light emission period.
- the biological sample analyzer 10 specifies the sample component of each layer accommodated in the test tube 204 by specifying the wavelength at which the transmitted light amount transmitted through the test tube 204 reaches a peak. That is, the light source 200 emits light having a plurality of wavelength components, and the wavelength spectroscopic unit 201 separates specific wavelength components, whereby the sample components of each layer can be specified. Therefore, each sample component can be specified accurately with a simple optical system configuration without using a plurality of light sources.
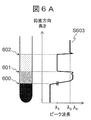
- FIG. 6A is a plot of wavelengths obtained by changing the position of the test tube 204 using the driving device 205 and having a maximum amount of transmitted light after passing through the sample.
- the peak wavelength is assumed to be 1300 nm, which is the shortest wavelength included in the light source 200.
- FIG. 6A an example of a sample obtained by separating blood components used in general biochemical immunoassay and the like is shown. The sample has a three-layer structure of clot 208 / separating agent 209 / serum 210 from the bottom of the test tube, and a layer of air 211 exists on the serum.
- the interface of the sample is an interface 600 between the clot and the separating agent, an interface 601 between the separating agent and serum, and an interface 602 between the serum and air.
- the peak wavelength was obtained by moving the test tube 204 in the vertical direction according to the waveform shown in FIG. 4C to obtain the peak wavelength height dependency S603.
- the peak wavelength in air 211 is ⁇ 3
- the peak wavelength in serum 210 is ⁇ 1
- the peak wavelength in separation agent 209 is ⁇ 4
- the peak wavelength in clot 208 does not exist. Therefore, by specifying the height at which the peak wavelength changes, it is possible to detect the boundary surface position between the sample component layers.
- the peak wavelength is the center wavelength of the light source 200. It becomes. By utilizing this, the bottom of the test tube 204 can be detected.
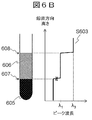
- FIG. 6B is an example of the result of specifying the interface position between sample component layers in the same manner for a sample used in, for example, blood coagulation analysis.
- the sample has a two-layer structure of blood cells 605 / plasma 606 from the bottom of the test tube, and a layer of air 211 exists on the plasma.
- the interface of the sample is an interface 607 between blood cells and plasma, and an interface 608 between plasma and air.
- the peak wavelength changes stepwise corresponding to the sample component layer. Therefore, even in the case of such a sample, the position of the interface between the sample component layers can be detected by extracting the height at which the peak wavelength changes.
- the measurement was performed while moving the position of the test tube 204 by about 1 mm.
- the error between the position where the peak wavelength changes and the position of the sample boundary surface measured with a caliper was as good as 1 mm or less.
- the boundary surface position may be measured more precisely by changing the relative position between the test tube 204 and the light source 200 more precisely.
- the present invention can be used to detect a layer called a buffy coat that exists slightly between blood cells and plasma. Good.
- the buffy coat contains a lot of platelets and cell components, for example, there is a need to exclude the buffy coat in blood coagulation analysis, and for example, there is a need to dispense a sample including the buffy coat in genetic testing. These needs can be realized by the present invention.
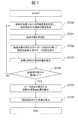
- FIG. 7 is a flowchart for explaining a procedure by which the biological sample analyzer 10 extracts the boundary surface position of the sample. Hereinafter, each step of FIG. 7 will be described.
- the light source 200 emits light from the side of the test tube 204 containing the sample.
- the light receiving unit 202 acquires the amount of light transmitted through the sample and the wavelength spectroscopic unit 201.
- the computer 203 acquires the transmitted light amount at each wavelength in the near-infrared wavelength region by acquiring the transmitted light amount at each wavelength while scanning the wavelength separated by the wavelength spectroscopic unit 201.
- Step S701 The computer 203 normalizes the transmitted light amount with reference to the maximum value of the transmitted light amount in the scanned wavelength range.
- the computer 203 calculates the first derivative in the wavelength direction of the transmitted light amount normalized in step S701. That is, a function representing an increase in transmitted light amount with respect to an increase in wavelength is obtained.
- the computer 203 calculates the peak wavelength at which the amount of transmitted light is maximum by specifying the zero cross point of the obtained first derivative. Furthermore, the maximum value and minimum value of the first derivative, and the second derivative may be obtained for the sample component having the serum-like characteristics described in FIGS. 4C and 4D.
- Step S703 The computer 203 changes the relative position between the light source 200 and the test tube 204 by the driving device 205. That is, the position of the height direction in which the test tube 204 is irradiated with light is changed. Preferably, in this step, the relative position is moved with a resolution comparable to the desired boundary surface position resolution.
- step S700 is started from the state where the light source 200 is arranged at the same height as the bottom of the test tube 204, and the computer 203 changes the relative position by a distance corresponding to the height of the test tube 204 until the relative position is changed. To S703 is repeated. Regardless of the height of the test tube 204 itself, if the position where the sample exists is defined in advance, it is not always necessary to move by the height of the test tube 204 in this step. This step may be terminated.
- Steps S705 to S706 The computer 203 obtains the position of the boundary surface between the sample component layers according to the result of step S702 (S705).
- the computer 203 calculates the liquid amount of each sample component using the obtained boundary surface position and the size (for example, inner diameter) of the test tube 204 (S706).
- S701 and S702 may be performed after S704.
- S700 and S703 are performed. It may be performed at the same time, and S701 and S702 may be performed after S704.
- Embodiment 3 of the present invention a procedure for simply specifying each sample component using this will be described.
- the configuration of the biological sample analyzer 10 is the same as in the first and second embodiments.
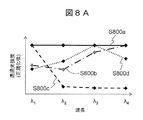
- FIG. 8A shows the wavelength dependency of the amount of transmitted light when the transmission wavelength of the wavelength spectroscopic unit 201 is changed from ⁇ 1 to ⁇ 4.
- S800a is a clot
- S800b is a separating agent
- S800c is serum
- S800d is air
- the amount of light transmitted after normalization is normalized by each maximum value.
- the wavelength at which the transmitted light amount reaches a peak is different for each sample component layer. Therefore, if the configuration of the sample components and the wavelength characteristics of each sample component are known in advance, the transmitted light amounts of ⁇ 1 to ⁇ 4 are measured for each sample component layer, and the transmitted light amount reaches a peak at any wavelength. By determining whether or not, the sample component of each layer can be specified.
- FIG. 8B shows the result of specifying each sample component according to the procedure described in FIG. 8A when the test tube 204 contains the clot 208, the separating agent 209, and the serum 210.
- the wavelength at which the transmitted light amount is maximum changes in a step shape according to the boundary position between the sample component layers. In other words, the position of the boundary surface between the sample layers can be detected by calculating the change point of the wavelength at which the transmitted light amount is maximum.
- FIG. 8C shows the result of specifying each sample component according to the procedure described in FIG. 8A when the test tube 204 includes blood cells 605 and plasma 606. Similar to FIG. 8B, the position of the boundary surface between the sample layers can be detected by calculating the change point of the wavelength at which the amount of transmitted light is maximized.
- the position of the boundary surface between the sample component layers is specified by the procedure described with reference to FIG. 8A, it is desirable to select several wavelengths from the periphery of the center wavelength of the light source 200, and the same number as the number of sample component layers to be detected. It is preferable to select the degree.
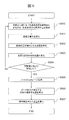
- FIG. 9 is a flowchart for explaining a procedure by which the biological sample analyzer 10 extracts the boundary surface position of the sample. Hereinafter, each step of FIG. 9 will be described.
- Step S900 This step is the same as step S700.
- the computer 203 is different from step S700 in that the wavelength separated by the wavelength spectroscopic unit 201 is discretely changed as described with reference to FIG. 8A.
- Steps S901 to S902 S901 is the same as step S701.
- the computer 203 specifies the wavelength direction in which the normalized transmitted light amount is maximum (S902). For example, in S800d of FIG. 8A, ⁇ 3 has the maximum transmitted light amount among the wavelengths ⁇ 1 to ⁇ 4.
- Steps S903 to S904 These steps are the same as S703 to S704.
- the computer 203 preferably removes noise from the obtained vertical plot by filtering or the like. This is to remove the noise component that exists in the vicinity of the boundary surface between serum and air in FIG. 8B and to accurately calculate the boundary surface position of the sample.
- FIG. 9 Steps S906 to S907 These steps are the same as S705 to S706.
- the biological sample analyzer 10 identifies the sample component of each layer by irradiating the sample having a known component structure with light having a wavelength at which the transmitted light amount of each component reaches a peak. .
- the wavelength spectroscopic unit 201 there is no need to scan the wavelength component separated by the wavelength spectroscopic unit 201, so that the boundary surface position of the sample component layer can be specified accurately and at high speed.
- the present invention is not limited to the embodiments described above, and includes various modifications.
- the above-described embodiment has been described in detail for easy understanding of the present invention, and is not necessarily limited to one having all the configurations described.
- a part of the configuration of an embodiment can be replaced with the configuration of another embodiment, and the configuration of another embodiment can be added to the configuration of an embodiment.
- the present invention is not limited to the test tube 204, and other containers may be used.
- the wavelength spectroscopic unit 201 is disposed between the test tube 204 and the light receiving unit 202, but the positional relationship between the test tube 204 and the wavelength spectroscopic unit 201 may be reversed. That is, the order does not matter as long as the test tube 204 and the wavelength spectroscopic unit 201 exist between the light source 200 and the light receiving unit 202.
- the relative position between the test tube 204 and the light source 200 is changed by moving the position of the test tube 204.
- the test tube 204 is fixed and the light source 200 (and wavelength) is changed.
- the positions of the spectroscopic unit 201 and the light receiving unit 202) may be moved.
- the dispensing module 107 may utilize the boundary surface positions (for example, the boundary surface 601 and the boundary surface 607) between the sample component layers obtained by the above embodiment.
- the dispensing module 107 sucks a certain amount of serum or plasma from the test tube 204 and divides it into another test tube. In this step, if the dispensing probe is inserted up to a highly viscous separation agent or blood cell component, the probe is likely to be clogged and the risk of stopping the analysis is high. Therefore, if the position of the dispensing probe is controlled based on the obtained boundary surface position information, the risk can be reduced. In general, the sample is often contained in a cylindrical test tube.
- the volume can be calculated by approximating the sample layer with a cylinder or the like therefrom. For example, this procedure can be used in step S706. Based on this volume information, it is possible to estimate how many times the dispensing module 107 can dispense. If the amount of sample is insufficient, analysis may be performed from priority items.
- the above-described configurations, functions, processing units, processing means, etc. may be realized in hardware by designing a part or all of them, for example, with an integrated circuit.
- Each of the above-described configurations, functions, and the like may be realized by software by interpreting and executing a program that realizes each function by the processor.
- Information such as programs, tables, and files that realize each function can be stored in a memory, a hard disk, a recording device such as an SSD (Solid State Drive), or a recording medium such as an IC card or an SD card.
- the control lines and information lines are those that are considered necessary for the explanation, and not all the control lines and information lines on the product are necessarily shown. In practice, it may be considered that almost all the components are connected to each other.
- SYMBOLS 100 Pretreatment system 101 ... Conveyance line 102 ... Input module 103 ... Centrifugal module 104 ... Detection apparatus 105 ... Opening module 106 ... Labeler 107 ... Dispensing module 108 ... Closing module 109 ... Sorting module 110 ... Storage module 111 ... Control PC DESCRIPTION OF SYMBOLS 112 ... Automatic analyzer 200 ... Light source 201 ... Wavelength spectroscopy part 202 ... Light receiving part 203 ... Computer 204 ... Test tube 205 ... Driving device 206 ... Gripping device 207 ... Display 208 ... Clot 209 ... Separation agent 210 ... Serum 211 ... Air 212 ... Cap 213 ... Label 300 ... Lens 301 ... Mirror thin film 302 ... Intermediate layer 303 ... Voltage control device
Landscapes
- Physics & Mathematics (AREA)
- Immunology (AREA)
- General Health & Medical Sciences (AREA)
- Pathology (AREA)
- General Physics & Mathematics (AREA)
- Health & Medical Sciences (AREA)
- Life Sciences & Earth Sciences (AREA)
- Analytical Chemistry (AREA)
- Chemical & Material Sciences (AREA)
- Biochemistry (AREA)
- Mathematical Physics (AREA)
- Spectroscopy & Molecular Physics (AREA)
- Engineering & Computer Science (AREA)
- Theoretical Computer Science (AREA)
- Investigating Or Analysing Materials By Optical Means (AREA)
- Automatic Analysis And Handling Materials Therefor (AREA)
- Investigating Or Analysing Biological Materials (AREA)
Applications Claiming Priority (2)
| Application Number | Priority Date | Filing Date | Title |
|---|---|---|---|
| JP2018-106834 | 2018-06-04 | ||
| JP2018106834A JP6999500B2 (ja) | 2018-06-04 | 2018-06-04 | 分析装置 |
Publications (1)
| Publication Number | Publication Date |
|---|---|
| WO2019235015A1 true WO2019235015A1 (ja) | 2019-12-12 |
Family
ID=68769330
Family Applications (1)
| Application Number | Title | Priority Date | Filing Date |
|---|---|---|---|
| PCT/JP2019/009851 Ceased WO2019235015A1 (ja) | 2018-06-04 | 2019-03-12 | 分析装置 |
Country Status (2)
| Country | Link |
|---|---|
| JP (1) | JP6999500B2 (enExample) |
| WO (1) | WO2019235015A1 (enExample) |
Cited By (2)
| Publication number | Priority date | Publication date | Assignee | Title |
|---|---|---|---|---|
| CN109975565A (zh) * | 2017-12-28 | 2019-07-05 | 希森美康株式会社 | 样本测定方法及样本测定装置 |
| CN116297232A (zh) * | 2022-12-19 | 2023-06-23 | 致慧医疗器械(浙江)有限公司 | 一种梯度液动态分层定位系统及方法 |
Families Citing this family (3)
| Publication number | Priority date | Publication date | Assignee | Title |
|---|---|---|---|---|
| JP7721276B2 (ja) * | 2021-01-28 | 2025-08-12 | シスメックス株式会社 | 尿検査方法および尿検査システム |
| JP7664551B2 (ja) * | 2021-03-16 | 2025-04-18 | パナソニックIpマネジメント株式会社 | 界面検出センサ |
| JP7696100B2 (ja) * | 2021-03-25 | 2025-06-20 | パナソニックIpマネジメント株式会社 | 界面検出センサ及び界面検出方法 |
Citations (4)
| Publication number | Priority date | Publication date | Assignee | Title |
|---|---|---|---|---|
| JP2004140606A (ja) * | 2002-10-17 | 2004-05-13 | Sharp Corp | 移動通知装置、機器情報管理装置、通信システム、および移動通知方法 |
| JP2005159646A (ja) * | 2003-11-25 | 2005-06-16 | Ntt Docomo Inc | パケット通信監視装置、及びパケット通信監視方法 |
| JP2014063424A (ja) * | 2012-09-24 | 2014-04-10 | Mitsubishi Space Software Co Ltd | 不正通信検出装置及びサイバー攻撃検出システム及びコンピュータプログラム及び不正通信検出方法 |
| WO2016027447A1 (ja) * | 2014-08-19 | 2016-02-25 | 日本電気株式会社 | 通信装置、通信システムおよび通信方法 |
Family Cites Families (9)
| Publication number | Priority date | Publication date | Assignee | Title |
|---|---|---|---|---|
| JPH02195261A (ja) * | 1989-01-25 | 1990-08-01 | Shimadzu Corp | 血清サンプリング装置 |
| JP2003014641A (ja) * | 2001-07-04 | 2003-01-15 | Yokogawa Electric Corp | 赤外分析装置 |
| US7473897B2 (en) * | 2001-09-12 | 2009-01-06 | Tecan Trading Ag | System, method, and computer program for conducting optical transmission measurements and evaluating determined measuring variables |
| US6770883B2 (en) * | 2002-01-30 | 2004-08-03 | Beckman Coulter, Inc. | Sample level detection system |
| JP4472442B2 (ja) * | 2004-06-24 | 2010-06-02 | アロカ株式会社 | 界面検出装置、体積計測装置及び界面検出方法 |
| JP2007255918A (ja) * | 2006-03-20 | 2007-10-04 | Kyokko Denki Kk | 分光分析装置 |
| US20170138790A1 (en) * | 2014-06-27 | 2017-05-18 | Spectral Engines Oy | A method for determining the spectral scale of a spectrometer and apparatus |
| JP6328530B2 (ja) * | 2014-09-16 | 2018-05-23 | ジーニアルライト株式会社 | 血液凝固検出装置、血液凝固検出方法及び血液凝固検出プログラム |
| JP2016090250A (ja) * | 2014-10-30 | 2016-05-23 | セイコーエプソン株式会社 | 分光測定装置及び保管ケース |
-
2018
- 2018-06-04 JP JP2018106834A patent/JP6999500B2/ja active Active
-
2019
- 2019-03-12 WO PCT/JP2019/009851 patent/WO2019235015A1/ja not_active Ceased
Patent Citations (4)
| Publication number | Priority date | Publication date | Assignee | Title |
|---|---|---|---|---|
| JP2004140606A (ja) * | 2002-10-17 | 2004-05-13 | Sharp Corp | 移動通知装置、機器情報管理装置、通信システム、および移動通知方法 |
| JP2005159646A (ja) * | 2003-11-25 | 2005-06-16 | Ntt Docomo Inc | パケット通信監視装置、及びパケット通信監視方法 |
| JP2014063424A (ja) * | 2012-09-24 | 2014-04-10 | Mitsubishi Space Software Co Ltd | 不正通信検出装置及びサイバー攻撃検出システム及びコンピュータプログラム及び不正通信検出方法 |
| WO2016027447A1 (ja) * | 2014-08-19 | 2016-02-25 | 日本電気株式会社 | 通信装置、通信システムおよび通信方法 |
Non-Patent Citations (1)
| Title |
|---|
| TYOU, IIFAN ET AL.: "A study of decentralized IoT Security Controller", IEICE TECHNICAL REPORT, ICSS2017-58, vol. 117, no. 481, 28 February 2018 (2018-02-28), pages 43 - 48, ISSN: 0913-5685 * |
Cited By (3)
| Publication number | Priority date | Publication date | Assignee | Title |
|---|---|---|---|---|
| CN109975565A (zh) * | 2017-12-28 | 2019-07-05 | 希森美康株式会社 | 样本测定方法及样本测定装置 |
| CN109975565B (zh) * | 2017-12-28 | 2024-03-22 | 希森美康株式会社 | 样本测定方法及样本测定装置 |
| CN116297232A (zh) * | 2022-12-19 | 2023-06-23 | 致慧医疗器械(浙江)有限公司 | 一种梯度液动态分层定位系统及方法 |
Also Published As
| Publication number | Publication date |
|---|---|
| JP2019211303A (ja) | 2019-12-12 |
| JP6999500B2 (ja) | 2022-02-10 |
Similar Documents
| Publication | Publication Date | Title |
|---|---|---|
| WO2019235015A1 (ja) | 分析装置 | |
| US6195158B1 (en) | Apparatus and method for rapid spectrophotometric pre-test screen of specimen for a blood analyzer | |
| CN109073448B (zh) | 试样液面位置测量装置和试样液面位置测量方法 | |
| EP2775292B1 (en) | Blood coagulation analyzer and blood coagulation analyzing method | |
| CN105980833B (zh) | 用于分配血浆试样的方法和设备 | |
| US10852295B2 (en) | Evanescent hemolysis detection | |
| EP2016390B1 (en) | A method and a system for quantitative hemoglobin determination | |
| JP3017920B2 (ja) | 臨床関連の液体および懸濁液の分析法 | |
| JP5330313B2 (ja) | 生体試料の分析装置 | |
| US6522398B2 (en) | Apparatus for measuring hematocrit | |
| JP3524419B2 (ja) | 吸光度測定装置 | |
| CN112955742B (zh) | 一种血样分析方法及凝血分析仪 | |
| US20190072484A1 (en) | Tumor cell detection method and tumor cell detection device | |
| EP2466292B1 (en) | System for performing scattering and absorbance assays | |
| US12253461B2 (en) | Open-loop/closed-loop process control on the basis of a spectroscopic determination of undetermined substance concentrations | |
| JP2008008794A (ja) | 分析装置 | |
| US12487178B2 (en) | Systems and method for measuring pathogens and biomarkers in fluids | |
| JP7060723B2 (ja) | 検体処理システム | |
| JP2008026036A (ja) | 含有物測定装置 | |
| CN113950620A (zh) | 用于筛选生物样本的设备和过程 | |
| JP6666702B2 (ja) | 測定方法および測定装置 | |
| EP3274696A1 (en) | Pharmaceutical detection | |
| US9921141B2 (en) | Centrifugal microfluidic device and methods of use | |
| WO2023276230A1 (ja) | 濃度測定装置 |
Legal Events
| Date | Code | Title | Description |
|---|---|---|---|
| 121 | Ep: the epo has been informed by wipo that ep was designated in this application |
Ref document number: 19814018 Country of ref document: EP Kind code of ref document: A1 |
|
| NENP | Non-entry into the national phase |
Ref country code: DE |
|
| 122 | Ep: pct application non-entry in european phase |
Ref document number: 19814018 Country of ref document: EP Kind code of ref document: A1 |