WO2019187341A1 - 指標算出装置、予測システム、経過予測評価方法およびプログラム - Google Patents
指標算出装置、予測システム、経過予測評価方法およびプログラム Download PDFInfo
- Publication number
- WO2019187341A1 WO2019187341A1 PCT/JP2018/043910 JP2018043910W WO2019187341A1 WO 2019187341 A1 WO2019187341 A1 WO 2019187341A1 JP 2018043910 W JP2018043910 W JP 2018043910W WO 2019187341 A1 WO2019187341 A1 WO 2019187341A1
- Authority
- WO
- WIPO (PCT)
- Prior art keywords
- prediction
- series data
- data
- invalidity
- value
- Prior art date
Links
Images


Classifications
-
- G—PHYSICS
- G06—COMPUTING; CALCULATING OR COUNTING
- G06F—ELECTRIC DIGITAL DATA PROCESSING
- G06F17/00—Digital computing or data processing equipment or methods, specially adapted for specific functions
- G06F17/10—Complex mathematical operations
- G06F17/15—Correlation function computation including computation of convolution operations
-
- G—PHYSICS
- G06—COMPUTING; CALCULATING OR COUNTING
- G06N—COMPUTING ARRANGEMENTS BASED ON SPECIFIC COMPUTATIONAL MODELS
- G06N20/00—Machine learning
-
- G—PHYSICS
- G06—COMPUTING; CALCULATING OR COUNTING
- G06N—COMPUTING ARRANGEMENTS BASED ON SPECIFIC COMPUTATIONAL MODELS
- G06N5/00—Computing arrangements using knowledge-based models
- G06N5/04—Inference or reasoning models
-
- G—PHYSICS
- G06—COMPUTING; CALCULATING OR COUNTING
- G06Q—INFORMATION AND COMMUNICATION TECHNOLOGY [ICT] SPECIALLY ADAPTED FOR ADMINISTRATIVE, COMMERCIAL, FINANCIAL, MANAGERIAL OR SUPERVISORY PURPOSES; SYSTEMS OR METHODS SPECIALLY ADAPTED FOR ADMINISTRATIVE, COMMERCIAL, FINANCIAL, MANAGERIAL OR SUPERVISORY PURPOSES, NOT OTHERWISE PROVIDED FOR
- G06Q10/00—Administration; Management
- G06Q10/04—Forecasting or optimisation specially adapted for administrative or management purposes, e.g. linear programming or "cutting stock problem"
-
- G—PHYSICS
- G06—COMPUTING; CALCULATING OR COUNTING
- G06Q—INFORMATION AND COMMUNICATION TECHNOLOGY [ICT] SPECIALLY ADAPTED FOR ADMINISTRATIVE, COMMERCIAL, FINANCIAL, MANAGERIAL OR SUPERVISORY PURPOSES; SYSTEMS OR METHODS SPECIALLY ADAPTED FOR ADMINISTRATIVE, COMMERCIAL, FINANCIAL, MANAGERIAL OR SUPERVISORY PURPOSES, NOT OTHERWISE PROVIDED FOR
- G06Q10/00—Administration; Management
- G06Q10/06—Resources, workflows, human or project management; Enterprise or organisation planning; Enterprise or organisation modelling
- G06Q10/067—Enterprise or organisation modelling
-
- G—PHYSICS
- G16—INFORMATION AND COMMUNICATION TECHNOLOGY [ICT] SPECIALLY ADAPTED FOR SPECIFIC APPLICATION FIELDS
- G16H—HEALTHCARE INFORMATICS, i.e. INFORMATION AND COMMUNICATION TECHNOLOGY [ICT] SPECIALLY ADAPTED FOR THE HANDLING OR PROCESSING OF MEDICAL OR HEALTHCARE DATA
- G16H50/00—ICT specially adapted for medical diagnosis, medical simulation or medical data mining; ICT specially adapted for detecting, monitoring or modelling epidemics or pandemics
- G16H50/30—ICT specially adapted for medical diagnosis, medical simulation or medical data mining; ICT specially adapted for detecting, monitoring or modelling epidemics or pandemics for calculating health indices; for individual health risk assessment
Definitions
- the present invention relates to an index calculation apparatus for determining the validity of series data in a transition graph or the like whose value changes with time, and a prediction system using the index calculation apparatus.
- the present invention also relates to a progress prediction evaluation method and a progress prediction evaluation program for evaluating the validity of a progress prediction including predicted values at two or more time points of a variable whose value changes with time.
- predicting aging changes such as test values of employees measured by health checkups and the onset probability of lifestyle-related diseases based on them, and giving advice to employees on health.
- future conditions such as changes in test values over time and onset probability
- future conditions such as changes in test values over time and onset probability
- the following method can be considered as a method for obtaining the transition of the predicted value.
- a prediction model for obtaining a predicted value of one year ahead from past data is learned. For example, using training data that correlates with actual values (test values) of past prediction targets and further correlates with past test values, attributes of the target of prediction (age, etc.) and lifestyle at that time.
- a prediction model is learned in which an item to be predicted one year later is an objective variable, and other items that can be correlated with it are explanatory variables.
- the process which inputs an explanatory variable and obtains the predicted value of one year ahead is changed for several years, changing the time (prediction time) which obtains the value of prediction object with respect to the obtained prediction model.
- the time predicted time
- Non-patent Document 1 describes an example of a health risk prediction system that predicts a health risk based on the results of a health check and a lifestyle as a technology related to health prediction and health support.
- the health risk prediction system described in Non-Patent Document 1 includes two subsystems: a test value prediction system and an onset prediction system.
- the test value prediction system indicates the degree of improvement in test results accompanying lifestyle improvements for people who have minor test abnormalities at the present time and who have problems with lifestyles.
- the onset prediction system predicts the disease incidence when continuing an undesirable lifestyle and improving the lifestyle for people who do not have any abnormal testing at the present time but are biased in their lifestyle. is there.
- health support by any subsystem is interactively performed between a medical worker and a examinee, and the examinee can recognize the effect of his / her behavior change. .
- the transition of the obtained predicted value may show a change different from general knowledge.
- Patent Document 1 describes a method for evaluating a demand prediction model.
- the method described in Patent Literature 1 takes the actual demand value and the predicted demand value during the evaluation period of the demand prediction model, calculates the deviation value between the actual demand value and the predicted demand value for each supply cycle of the product.
- the demand forecast model is evaluated based on the deviation value.
- Patent Document 1 performs comprehensive evaluation of past predicted values using actual values, and is based on the premise that at least actual values at the time of prediction are obtained.
- the progress prediction in which the values at a plurality of future points in time are predicted using the assumptions as described above, not all of the conditions assumed at that point are necessarily met. That is, it is not always possible to obtain an actual value that matches all the conditions at the time of prediction.
- the method of patent document 1 which makes a determination after obtaining a track record value cannot be applied to the use etc. which judge the validity automatically before displaying a prediction result.
- invalid means at least uncertain in the knowledge of the person who handles the predicted value (in the above example, the occupational physician who provides health guidance, the insurer, the person who performs the self-check, etc.) (Impossible).
- the onset probability of lifestyle-related disease and the transition of the test value related to it gradually approach some value. Is natural.
- the method of visually determining the output of the prediction result by the domain expert has a problem that it takes not only cost but also time to output.
- the method of visually determining the output of the prediction result by the domain expert has a problem that it takes not only cost but also time to output.
- the method of visually determining the output of the prediction result by the domain expert has a problem that it takes not only cost but also time to output.
- the present invention provides an index calculation device, a prediction system, a progress prediction evaluation method, and a progress prediction evaluation program that can automatically determine the invalidity of series data including a prediction value obtained based on an assumed condition.
- the purpose is to provide.
- the index calculation device is a series of predetermined prediction target item data, which is three or more data indicating the value of the prediction target item in association with time, and at least one of which indicates the prediction value
- an invalidity score which is an index indicating the invalidity of the series data
- the present invention is characterized by comprising invalidity score output means for outputting an invalidity score based on.
- the prediction system obtains a predicted value at a predetermined prediction time point using a learned prediction model for a predetermined prediction target item, and is series data including the obtained predicted value and corresponds to time.
- a prediction means for generating series data including three or more pieces of data indicating the value of the prediction target item, at least one of which indicates the predicted value, and an index indicating the invalidity of the series data An invalidity score calculation means for calculating an invalidity score based on an error between a curve model obtained by fitting the series data into a predetermined function form and the series data, and an invalidity score
- evaluation means for evaluating a series data, a prediction value included in the series data, or a prediction model that obtains the prediction value.
- the information processing apparatus is series data of a predetermined prediction target item, and is three or more pieces of data indicating the value of the prediction target item in association with time, of which When series data including data indicating at least one prediction value is input, it is an invalidity score that is an index indicating the invalidity of the series data, and is obtained by fitting the series data into a predetermined function form. Calculates invalidity score based on error between curve model and series data, and evaluates prediction model that obtained prediction value or prediction value included in series data or series data based on invalidity score And
- the progress prediction evaluation program is a series of predetermined prediction target item data stored in a computer, and includes at least one of three or more pieces of data indicating the value of the prediction target item in association with time.
- the series data including the data showing the predicted value is input, it is an invalidity score that is an index indicating the invalidity of the series data, and is obtained by fitting the series data into a predetermined function form
- FIG. 1 is a block diagram illustrating a configuration example of an index calculation apparatus according to the present embodiment.
- the index calculation device 10 illustrated in FIG. 1 includes a score calculation unit 11.
- the score calculation unit 11 receives, as input, series data including three or more pieces of data indicating the value of the prediction target item in association with time, and at least one of which indicates the predicted value.
- An invalidity score which is an index representing sex, is calculated and output.
- the invalidity score is calculated as an index indicating how far the input series data is from a predetermined asymptotic model.
- the score calculation unit 11 calculates the unexplainable degree (invalidity score) of the input predicted value series based on the error between the input series data and a predetermined asymptotic model (see FIG. 2).
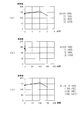
- FIG. 2 is an explanatory diagram showing an outline of the invalidity score.
- FIG. 2A is an example when the invalid validity cocoa is small
- FIG. 2B is an example when the invalid validity cocoa is large. It is.
- the shaded area represents the normal range of the inspection value.
- the asymptotic model is a curve model representing a curve having an asymptote parallel to the X axis when time is the X axis and the prediction item is the Y axis, more specifically, y ( x)
- x represents a point (coordinate) on the time axis corresponding to each data in the series data
- y (x) represents a predicted item value at time point x.
- the asymptotic model may be a curved model represented by a function that satisfies at least the condition represented by the following formula (1).
- a is an arbitrary constant. Note that the number of asymptotes present is not limited to one, but includes, for example, those represented by functions having two asymptotes such as functions called logistic functions and arctangent functions.
- the score calculation unit 11 can use a curve model represented by a predetermined function form as an asymptotic model. For example, the score calculation unit 11 can input two or more predetermined functions satisfying the above conditions. A model obtained by fitting into a shape may be used.
- the fitting may be performed, for example, by searching for a solution (model with hat) of the model parameter ⁇ that minimizes a predetermined loss function as shown in the following equation (2).
- n represents the time point of the value to be fitted
- loss () represents the error function
- f () represents the function form of the fitting destination.
- f (x n , ⁇ ) represents an output when an arbitrary time point x n and a set of model parameters ⁇ are given to the function form f (), and f (x n , ⁇ ⁇ ) It represents the output of an arbitrary time point xn in the asymptotic model obtained by fitting.
- the square loss is used as the error function, but the error function is not limited to the square loss.
- the score calculation unit 11 may calculate, for example, an error between the asymptotic model obtained in this way and the series data of the input predicted value and output it as an invalidity score.
- the score calculation unit 11 may output, for example, an error value (error) represented by the following expression (3) as an invalidity score.
- the score calculation unit 11 may independently specify data used for fitting and data used for error calculation.
- the score calculation part 11 can also receive those designation
- N ′ (where N ′ ⁇ N) data in the first half, and error calculation is performed on the remaining data (N ⁇ N).
- N ′ where N ′ ⁇ N
- 'Number' or all data (N) values may be used.
- fitting can be performed using data that is not continuous in the series data, such as first, third, and fifth data, and error calculation can be performed using all data. It is.
- the score calculation unit 11 may perform fitting and error calculation as follows, for example.
- the number of data (number of predicted values) Np included in the series data input to the score calculation unit 11 is not particularly limited, but at least one is included.
- the series data includes at least data indicating predicted values for the number of time points at which progress prediction is performed.
- the series data may include data indicating past performance values, and in this case, the above N represents the total number of data including data indicating past performance values.
- N is assumed to be 3 or more, but from the viewpoint of fitting accuracy, for example, 4 or more is more preferable.
- the error may be calculated using only the data showing the predicted value.
- the score calculation unit 11 may rescale the x-coordinate that is the value of the X-axis (a value representing the time corresponding to the value of each prediction item) before performing the fitting.
- the unit of scale on the vertical axis (Y axis: predicted value) is 50
- the unit of scale on the horizontal axis (X axis: time) is 1, and so on.
- the numerical unit scale width
- an asymptotic model as expected by a viewer cannot be obtained even if fitting is performed using the numerical values as they are. This is because, as shown in FIG.
- the time value (x coordinate) associated with each data included in the series data is rescaled in accordance with the actual display. It is preferable to perform the fitting above.
- the score calculation unit 11 has an X-axis main scale width of the Y-axis main scale.
- the x coordinate may be converted so as to be the same unit as the width (50 units in the example of FIG. 3C).
- the x coordinate is also made 50 times.
- the magnification at the time of rescaling of the x axis may be referred to as a rescale parameter x_scale.
- the score calculation unit 11 can obtain the rescale parameter x_scale as follows.
- the score calculation unit 11 inputs display parameters that are parameters for displaying the series data together with the series data, and calculates a rescale parameter xscale based on the information obtained from the series data and the display parameters. Is also possible.
- the following formula (4) is an example of a formula for calculating the rescale parameter x_scale.
- y max and y mim represent the maximum value and the minimum value of the prediction items included in the series data.
- N d represents the number of data included in the series data (the number of prediction items to be displayed).
- Ar represents the aspect ratio Ar (that is, the ratio of the width to the height) of the display graph of the series data.
- 0.8 represents the vertical display ratio
- 0.9 represents the horizontal display ratio.
- x_scale ((y max ⁇ y min ) /0.8*Ar*0.9) / (N d ⁇ 1)) ... (4)
- y max , y mim and N d correspond to information obtained from the series data
- Ar the vertical display ratio and the horizontal display ratio correspond to display parameters.
- x_scale ((y max ⁇ y min ) /0.8*2*0.9) / 4)
- x_scale is set to y-axis. It is calculated as an index representing the interval in the x direction of each data expressed in units. Therefore, when the unit of time in the series data is other than the predicted unit time, or when the unit of the interval in the x direction when displaying is other than 1, the x coordinate associated with each data is set to the predicted unit time or The x-axis unit may be multiplied by x_scale after dividing the x-axis unit by 1 in the x-direction interval.
- the score calculation unit 11 can accept the designation of x_scale.
- the score calculation unit 11 may input x_scale together with the series data.
- the score calculation unit 11 can also calculate the x_scale by inputting the display parameters as described above together with the series data.
- FIG. 5 is a flowchart illustrating an example of the operation of the index calculation apparatus according to the first embodiment.
- the score calculation unit 11 inputs the series data to be evaluated (step S101).
- the score calculation unit 11 acquires the rescale parameter x_scale (step S102).
- x_scale may be input together with the series data, or may be calculated based on the display parameters as described above.
- the score calculation unit 11 performs rescale on the time value (x coordinate) associated with each data included in the series data based on the acquired rescale parameter x_scale (step S103).
- the score calculation unit 11 learns an asymptotic model using the rescaled series data (step S104).
- the score calculation unit 11 calculates an error between the rescaled series data and the learned asymptotic model (step S105).
- the error the sum of the outputs of the error function loss () for each designated time point in the series data is obtained.
- the score calculation unit 11 outputs an invalidity score based on the calculated error (step S106).
- the score calculation unit 11 may output the error as an invalidity score as it is, or, for example, from the calculated error, an average at each time point (time point average) or an average (for example, three time point intervals) ( (Interval average) may be calculated and output as an invalidity score.
- an invalidity score that is an objective index that can determine the invalidity of input series data without using actual values. For this reason, if the invalidity score output by this embodiment is utilized, the invalidity of the series data including the predicted value obtained based on the hypothetical condition can be automatically determined.
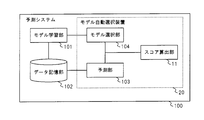
- FIG. 6 is a block diagram illustrating a configuration example of the prediction system of the present embodiment.
- the prediction system 100 illustrated in FIG. 6 includes a model learning unit 101, a data storage unit 102, a prediction unit 103, a model selection unit 104, and a score calculation unit 11.
- the model automatic selection device 20 including the model selection unit 104, the prediction unit 103, and the score calculation unit 11 is used for the prediction system 100 including the model learning unit 101 and the data storage unit 102.
- the model selection unit 104, the prediction unit 103, and the score calculation unit 11 are not necessarily limited to a configuration that is mounted on one device.
- the model learning unit 101 learns a plurality of model candidates that are candidates for a prediction model that predicts a value of a predetermined prediction target item such as a value of a certain inspection item. For example, the model learning unit 101 may learn a plurality of model candidates having different combinations of explanatory variables, constraint conditions, and various model parameters as prediction model candidates for predicting the value of the designated prediction target item.
- the data storage unit 102 stores learning data used for model learning by the model learning unit 101 and information on prediction model candidates learned by the model learning unit 101.
- the data storage unit 102 is data to be input to each model candidate in order to obtain a predicted value from each of a plurality of learned model candidates, and is a data set of explanatory variables used for each model candidate.
- the use of the predicted value obtained from the prediction data is not particularly limited.
- the prediction data may be verification data for verifying a prediction model candidate, or a prediction value actually used during operation of the prediction system, such as a future inspection value of an actual user. It may be prediction target data to be obtained (for example, a data set of explanatory variables including past test values of actual users and values of one or more inquiry items related to lifestyle habits).
- the prediction unit 103 performs progress prediction using each of a plurality of learned model candidates and the prediction data stored in the data storage unit 102, and generates series data of prediction target items for each model candidate. .
- the progress prediction is a period including at least two time points in a predetermined prediction time unit from a predetermined reference point that is a time point having at least an actual value, and at least one time point being a prediction time point. Is an evaluation target period, and the prediction value at each prediction time point included in the evaluation target period is obtained.
- the prediction time unit is a standard that can output a prediction value determined in advance as a prediction model or a prediction model candidate, such as “1 year” if the prediction model obtains a prediction value every year. Any time interval may be used.
- the prediction unit 103 applies the prediction data stored in the data storage unit 102 to each of a plurality of learned model candidates, and obtains a prediction value at each prediction time point included in a predetermined evaluation target period. . Then, the prediction unit 103 may generate, for each model candidate, series data including three or more data indicating the value of the prediction target item in association with time, together with the data indicating the obtained predicted value. Good.
- the prediction unit 103 applies the prediction data to each model candidate under the condition that some values of the explanatory variables included in the prediction data are constant when performing the progress prediction, and the prediction value at each prediction time point To generate series data including the obtained predicted value.
- the prediction unit 103 applies prediction data in which items related to lifestyle are fixed to each model candidate that predicts a predetermined inspection value, and predicts a prediction value (inspection value) at each prediction time point as a prediction result. You may get In that case, series data including the obtained predicted values (test values) at the respective prediction points is generated.
- the series data may include actual measurement values used for prediction.
- the score calculation unit 11 receives the series data acquired as a prediction result for each prediction model candidate by the prediction unit 103, and calculates an invalidity score for each series data.
- the model selection unit 104 selects a prediction model for obtaining a prediction value from a plurality of prediction model candidates based on the invalidity score for each series data calculated by the score calculation unit 11. For example, the model selection unit 104 may select a model having the lowest invalidity score. Note that the number of prediction models selected by the model selection unit 104 is not limited to one. For example, the model selection unit 104 may select a predetermined number of prediction models in ascending order of the invalidity score, for example. It is also possible to select all models whose invalidity score is a predetermined threshold value or less.
- the model selection unit 104 selects the plurality of series. It is also possible to select a model by combining the invalidity scores for the data. In that case, the model selection unit 104 may select a model by the following method, for example.
- the model selection unit 104 when selecting a prediction model, the model selection unit 104 generates a prediction model (in this example, a plurality of prediction model candidates) that generates an invalidity score of each series data and a prediction value included in each series data. It is also possible to select a prediction model that obtains a prediction value from among a plurality of prediction model candidates based on the prediction accuracy of (). By adding not only the evaluation regarding the graph shape (invalidity score) but also the evaluation regarding the prediction accuracy, it is possible to select a model having a good balance between the prediction accuracy and the number of defective samples.
- a prediction model in this example, a plurality of prediction model candidates
- the model selection unit 104 is obtained, for example, by applying predetermined verification data (for example, a data set including a combination of explanatory variables whose target variable values are known) to each prediction model to be evaluated. Based on the difference between the predicted value and the target value, the prediction accuracy (for example, mean square error square root (RMSE), correlation coefficient, etc.) may be calculated. In addition, for example, the model selection unit 104 may perform model selection based on an invalidity score from prediction models having a prediction accuracy equal to or higher than a predetermined threshold.
- predetermined verification data for example, a data set including a combination of explanatory variables whose target variable values are known
- the prediction accuracy for example, mean square error square root (RMSE), correlation coefficient, etc.
- RMSE mean square error square root
- the model selection unit 104 may perform model selection based on an invalidity score from prediction models having a prediction accuracy equal to or higher than a predetermined threshold.
- FIG. 7 is a flowchart showing an example of the operation of the prediction system of the present embodiment.
- the model learning unit 101 learns a plurality of model candidates for one prediction target item (step S201).
- the prediction unit 103 performs progress prediction on each of the plurality of model candidates learned by the model learning unit 101, and generates series data including the obtained predicted value for each model candidate (step S202). .
- the score calculation unit 11 calculates an invalidity score for the series data for each model candidate obtained by the prediction unit 103 (step S203).
- the model selection unit 104 selects a prediction model that obtains a prediction value from among a plurality of model candidates based on the invalidity score calculated by the score calculation unit 11 (step S204).
- a model that automatically outputs a more appropriate progress prediction is output from among a plurality of prediction model candidates, or a model that outputs an invalid progress prediction. Can be excluded.
- the model selection unit 103 selects at least one model (prediction model candidate). However, the model selection unit 103 obtains, for example, a plurality of prediction model candidates from them. It is also possible to determine whether or not shipment is possible based on the invalidity score of the series data including the predicted value. In that case, for example, the model selection unit 103 performs a threshold determination on the invalidity score of the series data including the predicted value obtained from each of the plurality of prediction model candidates, and if it is equal to or less than the predetermined threshold, the shipment is OK. Otherwise, it may be shipped NG.
- the model selection unit 103 performs threshold determination on the total number of defective samples, the sum of invalidity scores, and the maximum value for each model. If it is equal to or less than a predetermined threshold, the shipment is OK, and otherwise, the shipment is NG. In this example, it is also possible to make a shipping decision based on the invalid score and the prediction accuracy. In that case, for example, the model selection unit 103 may determine that shipment is OK when the prediction accuracy is equal to or higher than a predetermined threshold and the invalidity score satisfies the above condition, and may be determined as shipment NG otherwise.
- the model selection unit 103 may ship the model (predicted model candidate) (output to the outside), and if the shipment is NG, a predetermined alert process may be performed.
- alert processing for example, it is output to a predetermined server or display device together with the identifier of the model determined as shipment NG, the series data at that time, its invalidity score, etc. It may be requested to determine availability. Further, a determination result of whether or not shipment is possible manually may be accepted.
- FIG. 8 is a block diagram illustrating a configuration example of the prediction system of the present embodiment.
- the prediction system 100 illustrated in FIG. 8 includes a data storage unit 102, one or more prediction units 103, a prediction result input unit 105, a shipping determination unit 106, and a score calculation unit 11.
- FIG. 8 is a semi-automatic shipping determination device 30 including a prediction result input unit 105, a shipping determination unit 106, and a score calculation unit 11 for the prediction system 100 including the data storage unit 102 and the prediction unit 103.
- the prediction result input unit 105, the shipping determination unit 106, and the score calculation unit 11 are not necessarily limited to a configuration that is mounted on one device.
- the data storage unit 102 stores learned prediction model information corresponding to one or more prediction target items. Further, the data storage unit 102 is data to be input to each prediction model in order to obtain a prediction value from the learned prediction models, and is a prediction data (prediction) that is a data set of explanatory variables used for each prediction model. Memorize the sample). Note that the prediction data is not limited to one, and may be a plurality. For example, the data storage unit 102 may store a plurality of pieces of prediction data corresponding to each of one or more designated or predetermined prediction subjects.
- Each prediction unit 103 is associated with one prediction target item, and performs progress prediction using the learned prediction model and prediction data of the corresponding prediction target item stored in the data storage unit 102.
- the series data of the corresponding prediction target item is generated.
- each of the prediction units 103 reads a learned prediction model of a corresponding prediction target item stored in the data storage unit 102, and stores the corresponding prediction target stored in the data storage unit 102 in the prediction model. By applying the item prediction data, a prediction value at each prediction point included in a predetermined evaluation target period is obtained for the corresponding prediction target item. Then, each of the prediction units 103 may generate series data including three or more data indicating the value of the prediction target item in association with time together with the data indicating the obtained predicted value. Note that, when a plurality of pieces of prediction data are stored, each of the prediction units 103 generates series data including data indicating prediction values obtained by applying a prediction model for each prediction data. That's fine.
- each of the prediction units 103 sets the prediction data in the prediction model under the condition that some values of the explanatory variables included in the prediction data are constant when performing the progress prediction. Application is performed to obtain a prediction value at each prediction point, and series data including the obtained prediction value is generated.
- Each of the prediction units 103 applies, for example, prediction data in which items related to lifestyle are fixed to each model candidate that predicts a corresponding predetermined test value, and a prediction value at each prediction time point as a prediction result (The above inspection value) may be obtained. In that case, series data including the obtained predicted values (test values) at the respective prediction points is generated.
- the series data may include actual measurement values used for prediction.
- the prediction result input unit 105 inputs the series data of each prediction target item obtained from each of the prediction units 103.
- the score calculation unit 11 calculates an invalidity score for the series data of each prediction target item input from the prediction result input unit 105.
- the shipment determination unit 106 determines whether or not the predicted value can be shipped based on the invalidity score for the series data of each prediction target item calculated by the score calculation unit 11. For example, when a plurality of series data (for example, series data corresponding to a plurality of prediction samples) is obtained from one prediction model, the shipping determination unit 106 determines that the invalidity score of all the series data is a predetermined threshold value. If it is below, the predicted value included in each series data may be determined as shipping OK, and otherwise, a predetermined alert process may be performed. In addition, for example, when the series data is obtained from a plurality of prediction target items, the shipping determination unit 106 may individually evaluate them, or may collectively evaluate them (batch evaluation). Is possible. As an example, the shipping determination unit 106 may collectively evaluate series data including the predicted value in the shipping unit for each shipping unit (for example, a prediction target person) that is a unit in which the predicted value is shipped. .
- alert processing for example, whether it is possible to ship manually by outputting it to a predetermined server or display device together with the identifier of the model determined as shipment NG, the series data at that time, its invalidity score, etc. A determination may be requested. Further, a determination result of whether or not shipment is possible manually may be accepted.
- the shipment determination unit 106 may output a predicted value to the outside if the shipment is finally OK as a result of the final shipment determination.
- the shipment determination unit 106 determines shipment of a predicted value
- the predicted value is based not only on the invalidity score of each series data but also on the prediction accuracy of the prediction model that generated the predicted value. It is also possible to determine whether or not shipment is possible. By adding not only the evaluation related to the graph shape (invalidity score) but also the evaluation related to the prediction accuracy, it is possible to ship a predicted value with a good balance between the prediction accuracy and the number of defective samples. Note that the method for calculating the prediction accuracy may be the same as in the second embodiment.
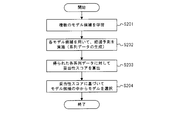
- FIG. 9 is a flowchart showing an example of the operation of the prediction system of the present embodiment.
- each of the prediction units 103 performs progress prediction on a corresponding prediction target item using a learned prediction model, and generates series data including the obtained predicted value (step). S301).
- the prediction result input unit 105 inputs the series data including the prediction result of the prediction unit 103 corresponding to each prediction target item (step S302).
- the score calculation unit 11 calculates an invalidity score for each input series data (step S303).
- the shipping determination unit 106 determines shipping of the obtained predicted value based on the invalidity score of each series data (step S304).
- the shipping determination unit 106 primarily determines whether or not shipping is possible depending on whether or not the invalidity scores of all the series data are equal to or less than a predetermined threshold.
- step S305 If the result of shipment judgment is shipment OK (Yes in step S305), the obtained predicted value is shipped (output to the outside) (step S306).
- step S307 a predetermined alert process is performed.
- the shipping determination unit 106 determines whether or not the predicted value can be shipped. However, as in the second embodiment, the shipping determination unit 106 determines whether or not the predicted model can be shipped. It is also possible to do. In that case, the shipping determination unit 106, for example, the invalidity calculated for one or more series data including a predicted value obtained by applying predetermined verification data to the prediction model to be determined. Whether or not the prediction model can be shipped may be determined based on the score. Also in this example, the shipment determination unit 106 may determine whether or not the prediction model can be shipped based on not only the invalidity score but also the prediction accuracy of the prediction model.
- the shipping determination unit 106 performs the shipping determination by comprehensively analyzing the series data including the predicted values in each sample. is there. Note that, for example, when the series data is obtained from a plurality of prediction target items, the shipping determination unit 106 may evaluate them individually or collectively (evaluate them collectively). Is possible. Further, the shipping determination unit 106 may collectively evaluate the series data including the predicted value in the shipping unit for each shipping unit that is a unit in which the predicted value or the predicted model is shipped.
- the method of evaluating the invalidity of the test value series data including the predicted value of the test item when the items related to the lifestyle are fixed is exemplified.
- the hypothetical conditions are not limited to these.
- the asymptotic model is exemplified as the model to be compared.
- the model to be compared may be other than the asymptotic model. That is, when a function form that is valid in advance is determined for the input series data, fitting to a function form that is valid in the same way is performed to obtain a curve model to be compared. The same effect can be obtained.
- FIG. 10 is a schematic block diagram showing a configuration example of a computer according to the embodiment of the present invention.
- the computer 1000 includes a CPU 1001, a main storage device 1002, an auxiliary storage device 1003, an interface 1004, a display device 1005, and an input device 1006.
- the system, server, and other devices in the above embodiment may be mounted on the computer 1000.
- the operation of each device may be stored in the auxiliary storage device 1003 in the form of a program.
- the CPU 1001 reads a program from the auxiliary storage device 1003 and develops it in the main storage device 1002, and executes predetermined processing in each embodiment according to the program.
- the CPU 1001 is an example of an information processing apparatus that operates according to a program.
- a CPU Central Processing Unit
- MPU Micro Processing Unit
- MCU Memory Control Unit
- GPU Graphics Processing Unit
- the auxiliary storage device 1003 is an example of a tangible medium that is not temporary.
- Other examples of the non-temporary tangible medium include a magnetic disk, a magneto-optical disk, a CD-ROM, a DVD-ROM, and a semiconductor memory connected via the interface 1004.
- the computer that has received the distribution may develop the program in the main storage device 1002 and execute the predetermined processing in each embodiment.
- the program may be for realizing a part of the predetermined processing in the above embodiment. Furthermore, the program may be a difference program that realizes predetermined processing in each embodiment in combination with another program already stored in the auxiliary storage device 1003.
- the interface 1004 transmits / receives information to / from other devices.
- the display device 1005 presents information to the user.
- the input device 1006 accepts input of information from the user.
- some elements of the computer 1000 may be omitted. For example, if the computer 1000 does not present information to the user, the display device 1005 can be omitted. For example, if the computer 1000 does not accept information input from the user, the input device 1006 can be omitted.
- circuitry general-purpose or dedicated circuits
- processors processors
- the like or combinations thereof. These may be constituted by a single chip or may be constituted by a plurality of chips connected via a bus.
- some or all of the constituent elements of the above embodiments may be realized by a combination of the above-described circuit and the like and a program.
- the plurality of information processing apparatuses and circuits may be centrally arranged or distributedly arranged. May be.
- the information processing apparatus, the circuit, and the like may be realized as a form in which each is connected via a communication network, such as a client and server system and a cloud computing system.
- FIG. 11 is a block diagram showing an outline of the index calculation apparatus of the present invention.
- the index calculation device 60 shown in FIG. 11 includes invalidity score output means 61.
- the invalidity score output means 61 (for example, the score calculation unit 11) is series data of a predetermined prediction target item, and is three or more pieces of data indicating the value of the prediction target item in association with time.
- an invalidity score which is an index indicating the invalidity of the series data, is obtained by fitting the series data into a predetermined function form. The invalidity score based on the error between the obtained curve model and the series data is output.
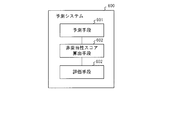
- FIG. 12 is a block diagram showing an outline of the prediction system of the present invention.
- a prediction system 600 illustrated in FIG. 12 includes a prediction unit 601, an invalidity score calculation unit 602, and an evaluation unit 603.
- the invalidity score calculation unit 602 may be realized by the invalidity score output unit 61 included in the index calculation device 60 described above.
- the prediction unit 601 (for example, the prediction unit 103) obtains a prediction value at a predetermined prediction time point using a learned prediction model for a predetermined prediction target item, and is series data including the obtained prediction value. Then, data series data is generated that is three or more data indicating the value of the prediction target item in association with time, and at least one of which indicates the predicted value.
- the invalidity score calculation means 602 (for example, the score calculation unit 11) is an invalidity score that is an index indicating the invalidity of the series data, and is a curve obtained by fitting the series data into a predetermined function form. An invalidity score based on the error between the model and the series data is calculated.
- the evaluation unit 603 (for example, the model selection unit 104 or the shipment determination unit 106) uses the series data, the predicted value or the predicted value included in the series data. The prediction model obtained is evaluated.
- (Supplementary note 1) Series data of a predetermined prediction target item, which is three or more data indicating the value of the prediction target item in association with time, at least one of which includes data indicating the prediction value Is input, an invalidity score, which is an index indicating the invalidity of the series data, and an error between the curve model obtained by fitting the series data into a predetermined function form and the series data.
- An index calculation apparatus comprising: an invalidity score output means for outputting an invalid validity score based thereon.
- the invalidity score output means performs fitting to the predetermined function form using data belonging to a predetermined first group among the series data, and a predetermined second group among the series data. An error with the curve model obtained by the fitting is calculated using data belonging to, and the invalidity score is output based on the calculated error, and the data belonging to the first group and the second.
- the index calculation apparatus according to Supplementary Note 1 or Supplementary Note 2, wherein the data belonging to the group does not completely match.
- the invalidity score output means displays the time value associated with each data included in the series data before the fitting to the predetermined function form. 5.
- the index calculation device according to any one of supplementary notes 1 to 4, wherein conversion is performed according to a scale.
- Prediction means for generating series data including three or more data indicating item values, at least one of which is data indicating a predicted value, and an invalidity score that is an index indicating the invalidity of the series data
- An invalidity score calculating means for calculating an invalidity score based on an error between a curve model obtained by fitting the series data into a predetermined function form and the series data, the series data, the series Evaluation means for performing an evaluation based on the invalidity score with respect to a prediction value included in data or a prediction model that obtains the prediction value.
- Prediction system for generating series data including three or more data indicating item values, at least one of which is data indicating a predicted value, and an invalidity score that is an index indicating the invalidity of the series data
- An invalidity score calculating means for calculating an invalidity score based on an error between a curve model obtained by fitting the series data into a predetermined function form and the series data, the series data, the series Evaluation means for performing an evaluation based on the invalidity score with respect to
- the said evaluation means is calculated using the said invalidity score and predetermined
- a model learning unit that learns a plurality of model candidates for the predetermined prediction target item, the prediction unit obtains the predicted value using each of the plurality of model candidates, and the plurality of the plurality of model candidates. Generating series data including the obtained predicted value for each model candidate, the invalidity score calculating means calculates the invalidity score for the series data for each of the plurality of model candidates, The evaluation means performs the evaluation on the plurality of model candidates, and selects a model for obtaining a predicted value of the prediction target item from the plurality of model candidates based on the evaluation result.
- One or more prediction means are provided corresponding to each of one or more prediction target items, and the invalidity score output means is the prediction target obtained from the one or more prediction means.
- the invalidity score is calculated for the series data for each item, and the evaluation means performs the evaluation on the series data for each prediction target item, and determines whether to ship the predicted value based on the evaluation result.
- the information processing apparatus is series data of a predetermined prediction target item, and is three or more pieces of data indicating the value of the prediction target item in association with time, at least one of which indicates the prediction value
- series data including data is input, an invalidity score that is an index indicating the invalidity of the series data, the curve model obtained by fitting the series data into a predetermined function form, and the series Calculating an invalidity score based on an error from the data, and evaluating the series data or a prediction value included in the series data or a prediction model that obtains the prediction value based on the invalidity score.
- prescribed prediction object item Comprising: It is 3 or more data which show the value of a prediction object item in correlation with time, The data from which at least 1 of them shows a prediction value are shown.
- series data including is input, an invalidity score that is an index indicating the invalidity of the series data, the curve model obtained by fitting the series data into a predetermined function form, and the series data
- a process of calculating an invalidity score based on the error of the error and a process of evaluating the series data or a prediction value included in the series data or a prediction model that obtains the prediction value based on the invalidity score Program to evaluate progress.
- series data including predicted values obtained based on hypothetical conditions, but also a reasonable function form is provided for series data including three or more data indicating values of prediction target items in association with time. If it can be applied, it can be suitably applied.
Landscapes
- Engineering & Computer Science (AREA)
- Physics & Mathematics (AREA)
- Theoretical Computer Science (AREA)
- Business, Economics & Management (AREA)
- General Physics & Mathematics (AREA)
- Strategic Management (AREA)
- Human Resources & Organizations (AREA)
- Data Mining & Analysis (AREA)
- Economics (AREA)
- Mathematical Physics (AREA)
- Software Systems (AREA)
- Entrepreneurship & Innovation (AREA)
- General Engineering & Computer Science (AREA)
- Computing Systems (AREA)
- Medical Informatics (AREA)
- Quality & Reliability (AREA)
- Marketing (AREA)
- Pure & Applied Mathematics (AREA)
- Mathematical Optimization (AREA)
- Mathematical Analysis (AREA)
- Computational Mathematics (AREA)
- General Business, Economics & Management (AREA)
- Development Economics (AREA)
- Tourism & Hospitality (AREA)
- Operations Research (AREA)
- Databases & Information Systems (AREA)
- Evolutionary Computation (AREA)
- Game Theory and Decision Science (AREA)
- Artificial Intelligence (AREA)
- Public Health (AREA)
- Health & Medical Sciences (AREA)
- Computational Linguistics (AREA)
- Educational Administration (AREA)
- Algebra (AREA)
- Biomedical Technology (AREA)
- Pathology (AREA)
- Primary Health Care (AREA)
- General Health & Medical Sciences (AREA)
- Epidemiology (AREA)
- Computer Vision & Pattern Recognition (AREA)
Abstract
仮定の条件に基づいて得られる予測値を含む系列データの非妥当性を自動で判断する。指標算出装置60は、所定の予測対象項目の系列データであって、時間と対応づけて予測対象項目の値を示す3つ以上のデータであってそのうちの少なくとも1つが予測値を示すデータを含む系列データが入力されると、系列データの非妥当性を示す指標である非妥当性スコアであって、系列データを所定の関数形にフィッティングして得られる曲線モデルと系列データとの誤差に基づく非妥当性スコアを出力する非妥当性スコア出力手段61を備える。
Description
本発明は、時間の経過にともなって値が変化する推移グラフ等における系列データの妥当性を判断するための指標算出装置、それを用いた予測システムに関する。また、本発明は、時間の経過にともなって値が変化する変数の2以上の時点における予測値を含む経過予測の妥当性を評価する経過予測評価方法および経過予測評価プログラムに関する。
例えば、健康診断等で測られる従業員等の検査値やそれに基づく生活習慣病の発症確率等の経年変化を予測して、従業員の各々に健康に関するアドバイスをすることを考える。具体的には、過去の健康診断結果やそのときの生活習慣を示すデータを基に、今の生活習慣を3年間続けた場合の将来の状態(検査値の経年変化や発症確率等)を予測して、産業医、保険師等が生活習慣の見直し等を提案(保健指導)したり、従業員自身がセルフチェックしたりすることを考える。
その場合、予測値の推移を得るための方法として次の方法が考えられる。まず、過去のデータから1年先の予測値を得る予測モデルを学習する。例えば、過去の予測対象の実績値(検査値)と対応づけて、それと相関し得るさらに過去の検査値や予測対象者の属性(年齢等)やそのときの生活習慣などを示す訓練データを用いて、1年後の予想対象項目を目的変数とし、それに相関し得る他の項目を説明変数とする予測モデルを学習する。そして、得られた予測モデルに対して、予測対象の値を得る時点(予測時点)を変えながら説明変数を入力して1年先の予測値を得る処理を、数年分繰り返す。このとき、説明変数のうち生活習慣に関する項目を一定とすることで、今の生活習慣を3年間続けた場合の予測値の推移を得ることができる。
このような予測値の推移に基づいて保健指導やセルフチェックを行えば、より効果的かつ効率的な、指導対象者や自身の不調予防・健康増進およびそのための行動変容が見込まれる。
健康予測や健康支援に関する技術として、非特許文献1には、健康診断の成績とライフスタイルを元に健康危険度を予知する健康危険度予測システムの例が記載されている。非特許文献1に記載の健康危険度予測システムは、検査値予測システムと、発症予測システムの2つのサブシステムを含む。検査値予測システムは、現時点で軽度の検査異常を伴っていてかつライフスタイルに問題がある人を対象に、ライフスタイルの改善に伴う検査成績の改善度合いを示すものである。また、発症予想システムは、現時点で検査異常を伴わないがライフスタイルに偏りがある人を対象に、望ましくないライフスタイルを継続した場合とライフスタイルを改善した場合の疾病発症率を予測するものである。非特許文献1によれば、いずれのサブシステムによる健康支援も医療従事者と受診者との間でインタラクティブに行われ、受診者は自分の行動変容の効果を認識することができるとされている。
しかし、単純に予測モデルを用いてこのような仮定における将来の予測値の推移を得る場合、得られる予測値の推移が一般的な知見とは異なる変化を示す場合があった。
予測値の検証に関して、例えば、特許文献1には、需要予測モデルの評価方法が記載されている。特許文献1に記載の方法は、需要予測モデルの評価期間における需要実績値と需要予測値を取り込み、製品の供給サイクルごとに需要実績値と需要予測値との乖離値を算出し、算出された乖離値に基づいて需要予測モデルを評価する。
高橋 英孝、吉田 勝美、「ライフスタイル改善のためのHRA(健康危険度予測システム)」、日本人間ドック学会誌(JHD)Vol.11 No.4 1997年、p.123-128.
しかし、非特許文献1に記載の予測システムでは、予測値の推移の妥当性について、何ら考慮されていない。
また、特許文献1に記載の方法は、実績値を用いて過去の予測値の総合評価を行うものであり、少なくとも予測をおこなった時点での実績値が得られることを前提としている。しかし、上記のような仮定を用いて将来の複数時点の値を予測する経過予測では、その時点において仮定した条件が全て合致するとは限らない。すなわち、予測時の条件と全て合致した実績値が必ずしも得られない。また、予測結果を表示する前にその妥当性を自動で判断する用途等には、実績値を得た後に判断を行う特許文献1の方法は適用できない。
なお、似た属性をもつ他の人の過去の実績値から同じ条件のものを探して実績値の代わりにすることも考えられる。しかし、全ての対象者について、過去の検査値と仮定した条件とを含む多くの説明変数の値が全ての予測時点で合致するものが見つかるとは限らない。そもそも個体差が生じやすい検査値を予測する上記の経過予測において、ごく少数の個別的な実績値を基に仮の条件での将来の予測値の推移の妥当性を判断しても、精度のよい判断結果を得ることは困難である。
課題は、仮定の条件に基づいて得られる予測値の推移の妥当性を判断できる客観的な指標がなく、予測結果が妥当であるか否かや、妥当でない場合にどれくらい妥当でないかを自動で判断するのが困難な点である。なお、ここで「妥当でない」とは、少なくとも予測値を扱う人(上記の例でいえば、保健指導を行う産業医、保険師等や、セルフチェックを行う本人等)の知見において不確か(説明不能)なことをいう。
例えば、生活習慣に関する説明変数を一定にしたときの生活習慣病の発症確率やそれに関連する検査値を予測して得られた予測値の推移を基にアドバイスを行うことを考える。
一般的な感覚によれば、生活習慣を一定にすると、例えば図13(a)に示すように、生活習慣病の発症確率やそれに関連する検査値の推移は何かの値に漸近していくのが自然である。
しかし、単に、所定の予測時間単位における1つ先の時点(例えば、1年後)の予測値を予測する予測モデルを繰り返し適用して経過予測をした場合、生活習慣を一定にしているにも関わらず、図13(b)に示すように、ある年では上向きに変化し、別のある年では下向きに変化するなど、変化の向き(プラスかマイナスか)が定まらずに乱高下するようなガタついたグラフ形状となる予測結果が示される可能性がある。このような予測結果を基に、生活習慣の改善のアドバイスをしようとしても、アドバイスをする側・受ける側の双方において違和感が生じてしまうため、アドバイスの根拠として使用できないという問題がある。
例えば上記の健康シミュレーションのように、過去の健康診断結果やそのときの生活習慣を示すデータを基に経過予測を行った結果を基に、産業医、保険師等が生活習慣の見直し等を提案(保健指導)したり、従業員自身がセルフチェックしたりすることを考えた場合、予測機構としては、いかに上記のような解釈できないような予測結果が出力されることを防止するかが重要となる。
そのためには、仮定の条件に基づいて得られる予測値を含む系列データを得た際に、実績値を待たずに、得られた系列データで示される予測値の推移が妥当であるか否か、または妥当でない場合にはどれくらい妥当でないかを表す客観的な指標が得られることが望ましい。
例えば、予測結果の出力判断をドメインエキスパートによる目視で行う方法では、コストがかかるだけでなく、出力までに時間がかかるという問題がある。また、いくつかある予測モデルの候補の中から上記のような解釈できないモデルを選択する場合においても、ドメインエキスパートによる目視で行う方法では同様の問題がある。
本発明は、上述した課題に鑑みて、仮定の条件に基づいて得られる予測値を含む系列データの非妥当性を自動で判断できる指標算出装置、予測システム、経過予測評価方法および経過予測評価プログラムを提供することを目的とする。
本発明による指標算出装置は、所定の予測対象項目の系列データであって、時間と対応づけて予測対象項目の値を示す3つ以上のデータであってそのうちの少なくとも1つが予測値を示すデータを含む系列データが入力されると、系列データの非妥当性を示す指標である非妥当性スコアであって、系列データを所定の関数形にフィッティングして得られる曲線モデルと系列データとの誤差に基づく非妥当性スコアを出力する非妥当性スコア出力手段を備えることを特徴とする。
また、本発明による予測システムは、所定の予測対象項目について、学習済みの予測モデルを用いて所定の予測時点における予測値を得るとともに、得られた予測値を含む系列データであって時間と対応づけて予測対象項目の値を示す3つ以上のデータであってそのうちの少なくとも1つが予測値を示すデータを含む系列データを生成する予測手段と、系列データの非妥当性を示す指標である非妥当性スコアであって、系列データを所定の関数形にフィッティングして得られる曲線モデルと系列データとの誤差に基づく非妥当性スコアを算出する非妥当性スコア算出手段と、非妥当性スコアに基づいて、系列データ、系列データに含まれる予測値または予測値を得た予測モデルを評価する評価手段とを備えることを特徴とする。
また、本発明による経過予測評価方法は、情報処理装置が、所定の予測対象項目の系列データであって、時間と対応づけて予測対象項目の値を示す3つ以上のデータであってそのうちの少なくとも1つが予測値を示すデータを含む系列データが入力されると、系列データの非妥当性を示す指標である非妥当性スコアであって、系列データを所定の関数形にフィッティングして得られる曲線モデルと系列データとの誤差に基づく非妥当性スコアを算出し、非妥当性スコアに基づいて、系列データまたは系列データに含まれる予測値もしくは予測値を得た予測モデルを評価することを特徴とする。
また、本発明による経過予測評価プログラムは、コンピュータに、所定の予測対象項目の系列データであって、時間と対応づけて予測対象項目の値を示す3つ以上のデータであってそのうちの少なくとも1つが予測値を示すデータを含む系列データが入力されると、系列データの非妥当性を示す指標である非妥当性スコアであって、系列データを所定の関数形にフィッティングして得られる曲線モデルと系列データとの誤差に基づく非妥当性スコアを算出する処理、および非妥当性スコアに基づいて、系列データまたは系列データに含まれる予測値もしくは予測値を得た予測モデルを評価する処理を実行させることを特徴とする。
本発明によれば、仮定の条件に基づいて得られる予測値を含む系列データの非妥当性を自動で判断できる。
実施形態1.
以下、図面を参照して本発明の実施形態について説明する。図1は、本実施形態の指標算出装置の構成例を示すブロック図である。図1に示す指標算出装置10は、スコア算出部11を備える。
以下、図面を参照して本発明の実施形態について説明する。図1は、本実施形態の指標算出装置の構成例を示すブロック図である。図1に示す指標算出装置10は、スコア算出部11を備える。
スコア算出部11は、時間と対応づけて予測対象項目の値を示す3つ以上のデータであってそのうちの少なくとも1つが予測値を示すデータを含む系列データを入力とし、その系列データの非妥当性を表す指標である非妥当性スコアを算出して出力する。
以下では、非妥当性スコアを、入力された系列データが所定の漸近モデルとどれだけ離れているかを示す指標として算出する。
既に説明したように、ある生活習慣を継続したときの検査値の予測値は何かの値に漸近するのが自然である。そこで、スコア算出部11は、入力された系列データと所定の漸近モデルとの誤差に基づいて、入力された予測値系列の説明不能度合い(非妥当性スコア)を算出する(図2参照)。なお、図2は、非妥当性スコアの概要を示す説明図であり、図2(a)は非妥当性ココアが小さい場合の例、図2(b)は非妥当性ココアが大きい場合の例である。なお、図2において網かけの領域はその検査値の正常範囲を表している。
ここで、漸近モデルは、時間をX軸、予測項目をY軸としたとき、X軸と平行な漸近線が存在する曲線を表す曲線モデル、より具体的には、x→∞のときy(x)がある値に収束する関数で表される曲線モデルをいう。ここで、xは、系列データにおいて各データが対応する時間軸上の点(座標)を表し、y(x)はx時点における予測項目値を表す。なお、漸近モデルは、以下の式(1)で表される条件を少なくとも満たす関数で表される曲線モデルであってもよい。ここで、aは任意の定数である。なお、存在する漸近線は1つに限らず、例えば、ロジスティック関数や逆正接関数と呼ばれる関数のように2つの漸近線が存在する関数で表されるものも含む。

スコア算出部11は、漸近モデルとして、予め定めた1つの関数形で表される曲線モデルを用いることもできるが、例えば、入力された系列データを、上記の条件を満たす所定の2以上の関数形にフィッティングして得られるモデルを用いてもよい。
フィッティングは、例えば、以下の式(2)に示すような予め定められた損失関数を最小化するモデルパラメータθの解(ハット付きθ)を探索することによって行ってもよい。

式(2)において、nはフィッティングを行う値の時点を表し、loss()は誤差関数を表し、f()はフィッティング先の関数形を表す。なお、f(xn,θ)で、その関数形f()に任意の時点xnと1組のモデルパラメータθとを与えたときの出力を表し、f(xn,^θ)で、フィッティングにより得られた漸近モデルにおける任意の時点xnの出力を表す。式(2)に示す例では、誤差関数として二乗損失を用いているが、誤差関数は二乗損失に限らない。
スコア算出部11は、例えば、このようにして得られた漸近モデルと、入力された予測値の系列データとの誤差を算出し、非妥当性スコアとして出力してもよい。
スコア算出部11は、例えば、以下の式(3)で示される誤差値(error)を非妥当性スコアとして出力してもよい。

スコア算出部11は、フィッティングに用いるデータと、誤差の算出に用いるデータとを独立に指定してもよい。なお、スコア算出部11は、それらの指定をユーザから受け付けることも可能である。このとき、フィッティングに用いるデータ(第1グループに属するデータ)と、誤差の算出に用いるデータ(第2グループに属するデータ)とは完全に一致していなくてもよい。
一例として、N個のデータを含む系列データが入力された場合に、フィッティングを前半のN’(ただしN’<N)個のデータを用いて行い、誤差の計算を残りのデータ(N-N’個)や全てのデータ(N個)の値を用いて行ってもよい。また、他の例として、フィッティングを1番目、3番目、5番目のデータなど系列データにおいて連続していない時点のデータを用いて行い、誤差の計算を全てのデータを用いて行う、なども可能である。
例えば、5個のデータを含む系列データが入力された場合に、スコア算出部11は、例えば次のようにしてフィッティングおよび誤差の計算を行ってもよい。
[フィッティングと誤差計算のパターン例]
・前半3個のデータでフィッティングを行い、後半2個のデータで誤差を計算する。
・前半3個のデータでフィッティングを行い、全てのデータで誤差を計算する。
・前から1、3、5番目のデータでフィッティングを行い、全てのデータで誤差を計算する。
・前半3個のデータでフィッティングを行い、後半2個のデータで誤差を計算する。
・前半3個のデータでフィッティングを行い、全てのデータで誤差を計算する。
・前から1、3、5番目のデータでフィッティングを行い、全てのデータで誤差を計算する。
ここで、スコア算出部11に入力される系列データに含まれるデータ数(予測値の数)Npは特に限定されないが、少なくとも1つは含まれるものとする。なお、実際は、系列データに、経過予測を行った時点数分の予測値を示すデータが少なくとも含まれることが好ましい。なお、系列データは、過去の実績値を示すデータを含んでいてもよく、その場合、上記のNは、過去の実績値を示すデータを含めた総データ数を表すものとする。なお、Nは3以上を前提とするが、フィッティング精度の観点からは、例えば4以上がより好ましい。
なお、系列データに実績値を示すデータが含まれている場合は、誤差の計算を、予測値を示すデータのみを用いて行ってもよい。
また、スコア算出部11は、フィッティングを行う前に、X軸の値であるx座標(各予測項目の値が対応する時間を表す値)をリスケールしてもよい。図3(a)に示すように、系列データをグラフ表示する際、縦軸(Y軸:予測値)の目盛の単位が50、横軸(X軸:時間)の目盛の単位が1など、縦軸と横軸とで数値の単位(目盛の幅)が大きく異なることが考えられる。その場合、そのままの数値を用いてフィッティングしても、見た人が期待するような漸近モデルが得られない。これは、図3(b)に示すように、X軸とY軸とで尺度が大きく異なる値を等間隔でグラフ表示したときのグラフ形状でフィッティングが行われるために、実際に表示させたときに妥当なグラフ形状とされる曲線とは異なる形状の曲線にフィッティングされてしまうためである。
このような不都合を解消するために、図3(b)に示すように、実際の表示に合わせて、系列データに含まれる各データに対応づけられている時間の値(x座標)をリスケールした上でフィッティングを行うのが好ましい。
例えば、スコア算出部11は、入力された系列データを表示するグラフの目盛設定等の表示に関するパラメータ(表示パラメータ)が得られる場合には、X軸の主目盛の幅がY軸の主目盛の幅と同じ単位(図3(c)の例でいうと、50単位)になるように、x座標を変換してもよい。この場合、X軸の主目盛の幅の単位=1に対して、Y軸の主目盛の幅の単位=50(50倍)となっているため、x座標も50倍とする。以下、このようなx軸のリスケール時の倍率を、リスケールパラメータx_scaleという場合がある。
また、スコア算出部11は、リスケールパラメータx_scaleを次のようにして求めることも可能である。スコア算出部11は、系列データとともに、その系列データを表示する際のパラメータである表示パラメータを入力し、系列データから得られる情報と、該表示パラメータとに基づいて、リスケールパラメータxscaleを計算することも可能である。
以下の式(4)は、リスケールパラメータx_scaleの算出式の一例である。式(4)において、ymax,ymimは系列データに含まれる予測項目の最大値,最小値を表す。また、Ndは系列データに含まれるデータ数(表示させる予測項目の点数)を表す。また、Arはその系列データの表示グラフの縦横比Ar(すなわち縦幅に対する横幅の比率)を表す。なお、式(4)において、0.8は縦方向の表示比率、0.9は横方向の表示比率を表しているが、これらの値は適宜調整される。
x_scale=((ymax-ymin)/0.8*Ar*0.9)/(Nd-1))
・・・(4)
・・・(4)
式(4)に示す例では、ymax,ymimおよびNdが系列データから得られる情報に相当し、Ar、縦方向の表示比率および横方向の表示比率が表示パラメータに相当する。
また、図4は、式(4)で示したx_scaleの算出方法の概略を示す説明図である。例えば、縦横比が1:2(Ar=2)、枠内に5点を表示する場合、x_scaleは次のように算出される。
x_scale=((ymax-ymin)/0.8*2*0.9)/4)
上記の例では、系列データに含まれる各データに対応づけられている時間の単位が予測単位(すなわち予測時点が1つ増えるごとに1増える数)であることを前提として、x_scaleを、y軸の単位で表現した各データのx方向の間隔を表す指標として算出している。したがって、系列データにおける時間の単位が予測単位時間以外の場合や、表示する際のx方向の間隔の単位が1以外の場合には、各データに対応づけられているx座標を予測単位時間やx方向の間隔の単位で割ってx軸の単位を1とした上で、x_scale倍すればよい。
なお、スコア算出部11は、x_scaleの指定を受けつけることも可能である。例えば、スコア算出部11は、系列データとともに、x_scaleを入力してもよい。なお、スコア算出部11は、系列データとともに、上述したような表示パラメータを入力してx_scaleを算出することも可能である。
次に、本実施形態の動作を説明する。図5は、第1の実施形態の指標算出装置の動作の一例を示すフローチャートである。
図5に示す例では、まず、スコア算出部11が、評価対象とする系列データを入力する(ステップS101)。
次いで、スコア算出部11は、リスケールパラメータx_scaleを取得する(ステップS102)。x_scaleは、系列データとともに入力されてもよいし、上述したような表示パラメータを基に算出してもよい。
次いで、スコア算出部11は、取得したリスケールパラメータx_scaleに基づいて、系列データに含まれる各データに対応づけられている時間の値(x座標)に対してリスケールを実施する(ステップS103)。
次いで、スコア算出部11は、リスケール済みの系列データを用いて、漸近モデルを学習する(ステップS104)。
次いで、スコア算出部11は、リスケール済みの系列データと学習された漸近モデルの誤差を算出する(ステップS105)。ここでは、誤差として、系列データのうち指定された各時点についての誤差関数loss()の出力の和を求める。
最後に、スコア算出部11は、算出された誤差に基づいて、非妥当性スコアを出力する(ステップS106)。スコア算出部11は、誤差をそのまま非妥当性スコアとして出力してもよいし、例えば、算出された誤差から各時点における平均(時点平均)や、所定区間(例えば、3時点区間)における平均(区間平均)を算出し、それを非妥当性スコアとして出力してもよい。
以上のように、本実施形態によれば、実績値を用いなくても、入力された系列データの非妥当性を判断できる客観的な指標である非妥当性スコアを出力することができる。このため、本実施形態により出力される非妥当性スコアを利用すれば、仮定の条件に基づいて得られる予測値を含む系列データの非妥当性を自動で判断できる。
実施形態2.
次に、第2の実施形態について説明する。本実施形態では、第1の実施形態の指標算出装置10の利用例の1つとして、モデル選択機能を有する予測システムについて説明する。図6は、本実施形態の予測システムの構成例を示すブロック図である。図6に示す予測システム100は、モデル学習部101と、データ記憶部102と、予測部103と、モデル選択部104と、スコア算出部11とを備える。
次に、第2の実施形態について説明する。本実施形態では、第1の実施形態の指標算出装置10の利用例の1つとして、モデル選択機能を有する予測システムについて説明する。図6は、本実施形態の予測システムの構成例を示すブロック図である。図6に示す予測システム100は、モデル学習部101と、データ記憶部102と、予測部103と、モデル選択部104と、スコア算出部11とを備える。
なお、図6に示す例は、モデル学習部101とデータ記憶部102とを備える予測システム100に対して、モデル選択部104と予測部103とスコア算出部11とを含むモデル自動選択装置20を新たに追加した例である。ただし、予測システム100において、モデル選択部104、予測部103およびスコア算出部11は、必ずしも1つの装置に実装される構成に限定されない。
モデル学習部101は、ある検査項目の値など、所定の予測対象項目の値を予測する予測モデルの候補とされる複数のモデル候補を学習する。モデル学習部101は、例えば、指定された予測対象項目の値を予測する予測モデルの候補として、説明変数の組み合わせや制約条件や各種モデルパラメータが異なる複数のモデル候補を学習してもよい。
データ記憶部102は、モデル学習部101でモデル学習に用いる学習用データや、モデル学習部101で学習された予測モデル候補の情報を記憶する。
また、データ記憶部102は、さらに、学習済みの複数のモデル候補の各々から予測値を得るために各モデル候補に入力するデータであって、各モデル候補に用いられる説明変数のデータセットである予測用データを記憶する。なお、予測用データにより得られる予測値の用途等は特に限定されない。例えば、予測用データは、予測モデル候補を検証するための検証用データであってもよいし、実際の利用者の将来の検査値等、予測システムの運用中において実際に利用される予測値を得るための予測対象データ(例えば、実際の利用者の過去の検査値と生活習慣に関する1つ以上の問診項目の値とを含む説明変数のデータセット等)であってもよい。
予測部103は、学習済みの複数のモデル候補の各々と、データ記憶部102に記憶されている予測用データとを用いて経過予測を行い、モデル候補ごとに予測対象項目の系列データを生成する。
ここで、経過予測とは、少なくとも実績値を有する時点である所定の基準点から所定の予測時間単位における2以上の時点を含む期間であってそのうちの少なくとも1つの時点が予測時点とされる期間を評価対象期間として、該評価対象期間に含まれる各予測時点における予測値を得ることをいう。なお、予測時間単位は、1年ごとに予測値を得る予測モデルであれば「1年」とされるなど、予め予測モデルまたは予測モデル候補に定められている予測値を出力可能な標準的な時間間隔であればよい。
例えば、予測部103は、学習済みの複数のモデル候補の各々にデータ記憶部102に記憶されている予測用データを適用して、所定の評価対象期間に含まれる各予測時点の予測値を得る。そして、予測部103は、モデル候補ごとに、得られた予測値を示すデータと併せて、時間と対応づけて予測対象項目の値を示す3つ以上のデータを含む系列データを生成してもよい。
予測部103は、経過予測を行う際、予測用データに含まれる説明変数のうちの一部の値を一定とする条件下で各モデル候補に予測用データを適用し、各予測時点の予測値を得て、得られた予測値を含む系列データを生成する。予測部103は、例えば、所定の検査値を予測するモデル候補の各々に対して、生活習慣に関する項目を一定にした予測用データを適用し、予測結果として各予測時点の予測値(検査値)を得てもよい。その場合、得られた各予測時点の予測値(検査値)を含む系列データを生成する。系列データには、予測に用いた実測値が含まれていてもよい。
スコア算出部11は、予測部103によって予測モデル候補ごとに予測結果として取得された系列データを入力とし、各系列データに対して非妥当性スコアを算出する。
モデル選択部104は、スコア算出部11によって算出された各系列データに対する非妥当性スコアに基づいて、複数の予測モデル候補の中から予測値を得る予測モデルを選択する。モデル選択部104は、例えば、非妥当性スコアが最も低いモデルを選択してもよい。なお、モデル選択部104が選択する予測モデルの数は1つに限定されず、例えば、モデル選択部104は、例えば、非妥当性スコアが低い順から所定数の予測モデルを選択してもよいし、非妥当性スコアが所定の閾値以下のモデルを全て選択することも可能である。
また、モデル選択部104は、1つの予測モデル(この場合、予測モデル候補)から複数の系列データ(例えば、複数の予測サンプルに対応した系列データ)が得られた場合には、それら複数の系列データに対する非妥当性スコアを総合してモデルを選択することも可能である。その場合において、モデル選択部104は、例えば、次の方法によりモデルを選択してもよい。
(1)モデルごとに非妥当性スコアが与えられた閾値より大きいサンプル数(系列データ)を不良サンプル数としてカウントし、不良サンプル数が少ない順に所定数(1つでも複数でも可)のモデルを選択する。
(2)モデルごとに複数の系列データに対する非妥当性スコアの総和をとり、その値が小さい順に所定数のモデルを選択する。
(3)モデルごとに複数の系列データに対する非妥当性スコアの最大値をとり、その値が小さい順に所定数のモデルを選択する。
(2)モデルごとに複数の系列データに対する非妥当性スコアの総和をとり、その値が小さい順に所定数のモデルを選択する。
(3)モデルごとに複数の系列データに対する非妥当性スコアの最大値をとり、その値が小さい順に所定数のモデルを選択する。
また、モデル選択部104は、予測モデルを選択する際、各系列データの非妥当性スコアと、各系列データに含まれる予測値を生成した予測モデル(本例であれば、複数の予測モデル候補)の予測精度とに基づいて、複数の予測モデル候補の中から予測値を得る予測モデルを選択することも可能である。グラフ形状に関する評価(非妥当性スコア)だけでなく、予測精度に関する評価を加えることで、予測精度と不良サンプル数のバランスが良好なモデルを選択できる。
モデル選択部104は、例えば、所定の検証用データ(例えば、目的変数の値が既知の説明変数の組合せからなるデータ集合)を、評価対象とされる予測モデルの各々に適用し、得られた予測値と目標値との差分を基に、予測精度(例えば、平均二乗誤差平方根(RMSE)や相関係数など)を算出してもよい。その上で、モデル選択部104は、例えば、予測精度が所定の閾値以上の予測モデルの中から非妥当性スコアに基づくモデル選択を行ってもよい。
図7は、本実施形態の予測システムの動作の一例を示すフローチャートである。図7に示す例では、まず、モデル学習部101が、1つの予測対象項目について、複数のモデル候補を学習する(ステップS201)。
次いで、予測部103が、モデル学習部101によって学習された複数のモデル候補の各々に対して経過予測を行い、モデル候補ごとに、得られた予測値を含む系列データを生成する(ステップS202)。
次いで、スコア算出部11が、予測部103によって得られたモデル候補ごとの系列データに対して、非妥当性スコアを算出する(ステップS203)。
最後に、モデル選択部104が、スコア算出部11によって算出された非妥当性スコアに基づいて、複数のモデル候補の中から予測値を得る予測モデルを選択する(ステップS204)。
以上のように、本実施形態によれば、いくつかある予測モデルの候補の中から、自動で、より妥当な経過予測が出力されるモデルを選択したり、妥当でない経過予測が出力されるモデルを除外したりすることができる。
なお、上記の例では、モデル選択部103が少なくとも1つのモデル(予測モデル候補)を選択する例を示したが、モデル選択部103が、例えば、複数の予測モデル候補について、それらから得られた予測値を含む系列データの非妥当性スコアに基づいて、出荷の可否を判定することも可能である。その場合、例えば、モデル選択部103は、複数の予測モデル候補の各々から得られた予測値を含む系列データの非妥当性スコアに対して閾値判定を行い、所定の閾値以下であれば出荷OKとし、それ以外であれば出荷NGとしてもよい。また、モデル選択部103は、例えば、1つのモデルから複数の系列データが得られた場合には、モデルごとの不良サンプル数や非妥当性スコアの総和や最大値に対して、閾値判定を行って、所定の閾値以下であれば出荷OKとし、それ以外であれば出荷NGとしてもよい。なお、本例においても、非妥当スコアと、予測精度とに基づいて、出荷判断を行うことも可能である。その場合、モデル選択部103は、例えば、予測精度が所定の閾値以上でかつ非妥当性スコアが上記の条件を満たす場合に出荷OKと判定し、それ以外は出荷NGと判定してもよい。
出荷判断の結果、出荷OKであれば、モデル選択部103は、そのモデル(予測モデル候補)を出荷(外部に出力)し、出荷NGであれば、所定のアラート処理を行ってもよい。
アラート処理としては、例えば、出荷NGとされたモデルの識別子やそのときの系列データやその非妥当性スコア等と合わせて、その旨を所定のサーバや表示装置に出力して、人手による出荷の可否判定を依頼してもよい。さらに、人手による出荷可否の判定結果を受け付けてもよい。
実施形態3.
次に、第3の実施形態について説明する。本実施形態では、第1の実施形態の指標算出装置10の利用例の1つとして、出荷判断機能を有する予測システムについて説明する。図8は、本実施形態の予測システムの構成例を示すブロック図である。図8に示す予測システム100は、データ記憶部102と、1つ以上の予測部103と、予測結果入力部105と、出荷判断部106と、スコア算出部11とを備える。
次に、第3の実施形態について説明する。本実施形態では、第1の実施形態の指標算出装置10の利用例の1つとして、出荷判断機能を有する予測システムについて説明する。図8は、本実施形態の予測システムの構成例を示すブロック図である。図8に示す予測システム100は、データ記憶部102と、1つ以上の予測部103と、予測結果入力部105と、出荷判断部106と、スコア算出部11とを備える。
なお、図8に示す例は、データ記憶部102と予測部103とを備える予測システム100に対して、予測結果入力部105と出荷判断部106とスコア算出部11とを含む半自動出荷判断装置30を新たに追加した例である。ただし、予測システム100において、予測結果入力部105、出荷判断部106およびスコア算出部11は、必ずしも1つの装置に実装される構成に限定されない。
本実施形態において、データ記憶部102は、1つ以上の予測対象項目に対応する学習済みの予測モデルの情報を記憶する。また、データ記憶部102は、それら学習済みの予測モデルから予測値を得るために各予測モデルに入力するデータであって、各予測モデルに用いられる説明変数のデータセットである予測用データ(予測サンプル)を記憶する。なお、予測用データは1つに限らず、複数であってもよい。データ記憶部102は、例えば、指定されたまたは所定の1人以上の予測対象者の各々に対応した複数の予測用データを記憶してもよい。
予測部103はそれぞれ、1つの予測対象項目と対応づけられており、データ記憶部102に記憶されている、対応する予測対象項目の学習済みの予測モデルおよび予測用データを用いて経過予測を行い、対応する予測対象項目の系列データを生成する。
例えば、予測部103の各々は、データ記憶部102に記憶されている対応する予測対象項目の学習済みの予測モデルを読み出し、該予測モデルに、データ記憶部102に記憶されている対応する予測対象項目の予測用データを適用して、対応する予測対象項目について、所定の評価対象期間に含まれる各予測時点の予測値を得る。そして、予測部103の各々は、得られた予測値を示すデータと併せて、時間と対応づけて予測対象項目の値を示す3つ以上のデータを含む系列データを生成してもよい。なお、予測部103の各々は、複数の予測用データが記憶されている場合には、予測用データごとに、予測モデルを適用して得られた予測値を示すデータを含む系列データを生成すればよい。
予測部103の各々は、第2の実施形態と同様、経過予測を行う際、予測用データに含まれる説明変数のうちの一部の値を一定とする条件下で予測モデルに予測用データを適用し、各予測時点の予測値を得て、得られた予測値を含む系列データを生成する。予測部103の各々は、例えば、対応する所定の検査値を予測するモデル候補の各々に対して、生活習慣に関する項目を一定にした予測用データを適用し、予測結果として各予測時点の予測値(上記の検査値)を得てもよい。その場合、得られた各予測時点の予測値(検査値)を含む系列データを生成する。系列データには、予測に用いた実測値が含まれていてもよい。
予測結果入力部105は、予測部103の各々から得られる各予測対象項目の系列データを入力する。
スコア算出部11は、予測結果入力部105より入力される各予測対象項目の系列データに対して、非妥当性スコアを算出する。
出荷判断部106は、スコア算出部11によって算出された各予測対象項目の系列データに対する非妥当性スコアに基づいて、予測値の出荷可否の判定を行う。出荷判断部106は、例えば、1つの予測モデルから複数の系列データ(例えば、複数の予測サンプルに対応した系列データ)が得られた場合、それら全ての系列データの非妥当性スコアが所定の閾値以下であれば、各系列データに含まれる予測値を出荷OKと判定し、それ以外であれば所定のアラート処理を行ってもよい。また、出荷判断部106は、例えば、複数の予測対象項目からそれぞれ系列データが得られた場合には、それらを個別に評価してもよいし、それらをまとめて評価(一括評価)することも可能である。一例として、出荷判断部106は、予測値が出荷される単位である出荷単位(例えば、予測対象者等)ごとに、該出荷単位における予測値を含む系列データを一括して評価してもよい。
アラート処理としては、例えば、出荷NGとされたモデルの識別子やそのときの系列データやその非妥当性スコア等と合わせてその旨を所定のサーバや表示装置に出力して、人手による出荷の可否判定を依頼してもよい。さらに、人手による出荷可否の判定結果を受け付けてもよい。
また、出荷判断部106は、そのようにして最終的に得た出荷の可否判定の結果、出荷OKであれば予測値を外部に出力してもよい。
本実施形態においても、出荷判断部106は、予測値の出荷判断を行う際、各系列データの非妥当性スコアだけでなく、その予測値を生成した予測モデルの予測精度に基づいて、予測値の出荷可否の判定を行うことも可能である。グラフ形状に関する評価(非妥当性スコア)だけでなく、予測精度に関する評価を加えることで、予測精度と不良サンプル数のバランスが良好な予測値を出荷できる。なお、予測精度の算出方法は第2の実施形態と同様でよい。
図9は、本実施形態の予測システムの動作の一例を示すフローチャートである。図9に示す例では、まず、予測部103の各々が、対応する予測対象項目について、学習済みの予測モデルを用いて経過予測を行い、得られた予測値を含む系列データを生成する(ステップS301)。
次いで、予測結果入力部105が、各予測対象項目について対応する予測部103の予測結果を含む系列データを入力する(ステップS302)。
次いで、スコア算出部11が、入力された各系列データに対して非妥当性スコアを算出する(ステップS303)。
次いで、出荷判断部106が、各系列データの非妥当性スコアに基づいて、得られた予測値の出荷判断を行う(ステップS304)。ここでは、出荷判断部106は、全ての系列データの非妥当性スコアが所定の閾値以下であるか否かによって出荷の可否を一次判定する。
出荷判断の結果、出荷OKであれば(ステップS305のYes)、得られた予測値を出荷(外部に出力)する(ステップS306)。
出荷判断の結果、出荷OKでなければ(ステップS305のNo)、所定のアラート処理を行う(ステップS307)。
以上のように、本実施形態によれば、予測結果を外部に出力するか否かの判断(出荷判断)において、その都度ドメインエキスパートによる目視によるチェックなどを行わなくても済むため、コストや出荷にかかる時間を削減できる。
なお、上記の例では、出荷判断部106が、予測値に対する出荷の可否を判断する例を示したが、第2の実施形態と同様、出荷判断部106は、予測モデルに対する出荷の可否を判断することも可能である。その場合、出荷判断部106は、例えば、判断対象とされた予測モデルに所定の検証用データを適用して得られた予測値を含む1つ以上の系列データに対して算出された非妥当性スコアに基づいて、該予測モデルの出荷の可否を判定してもよい。なお、本例においても、出荷判断部106は、非妥当性スコアだけでなく、予測モデルの予測精度に基づいて、該予測モデルの出荷の可否を判定してもよい。
また、出荷判断部106は、例えば、1つのモデルから複数のサンプルに対する予測値が得られた場合、各サンプルにおける予測値を含む系列データを総合して出荷判断を行う点については上記と同様である。なお、出荷判断部106は、例えば、複数の予測対象項目からそれぞれ系列データが得られた場合には、それらを個別に評価してもよいし、それらをまとめて評価(一括評価)することも可能である。また、出荷判断部106は、予測値や予測モデルが出荷される単位である出荷単位ごとに、該出荷単位における予測値を含む系列データを一括して評価してもよい。
なお、上記の各実施形態では、生活習慣に関する項目を一定としたときの検査項目の予測値を含む検査値の系列データに対して、その非妥当性を評価する方法を例示したが、予測対象や仮定の条件はこれらに限定されない。
また、上記では、比較対象とするモデルとして漸近モデルを例示したが、比較対象とするモデルは、漸近モデル以外であってもよい。すなわち、入力された系列データに対し予め妥当とされる関数形が決まっている場合には、同様の方法で妥当とされる関数形へのフィッティングを行って比較対象とする曲線モデルを得ることにより、同様の効果を得ることができる。
また、図10は、本発明の実施形態にかかるコンピュータの構成例を示す概略ブロック図である。コンピュータ1000は、CPU1001と、主記憶装置1002と、補助記憶装置1003と、インタフェース1004と、ディスプレイ装置1005と、入力デバイス1006とを備える。
上記の実施形態におけるシステム、サーバその他の装置等は、コンピュータ1000に実装されてもよい。その場合、各装置の動作は、プログラムの形式で補助記憶装置1003に記憶されていてもよい。CPU1001は、プログラムを補助記憶装置1003から読み出して主記憶装置1002に展開し、そのプログラムに従って各実施形態における所定の処理を実施する。なお、CPU1001は、プログラムに従って動作する情報処理装置の一例であり、CPU(Central Processing Unit)以外にも、例えば、MPU(Micro Processing Unit)やMCU(Memory Control Unit)やGPU(Graphics Processing Unit)などを備えていてもよい。
補助記憶装置1003は、一時的でない有形の媒体の一例である。一時的でない有形の媒体の他の例として、インタフェース1004を介して接続される磁気ディスク、光磁気ディスク、CD-ROM、DVD-ROM、半導体メモリ等が挙げられる。また、このプログラムが通信回線によってコンピュータ1000に配信される場合、配信を受けたコンピュータは1000がそのプログラムを主記憶装置1002に展開し、各実施形態における所定の処理を実行してもよい。
また、プログラムは、上記の実施形態における所定の処理の一部を実現するためのものであってもよい。さらに、プログラムは、補助記憶装置1003に既に記憶されている他のプログラムとの組み合わせで各実施形態における所定の処理を実現する差分プログラムであってもよい。
インタフェース1004は、他の装置との間で情報の送受信を行う。また、ディスプレイ装置1005は、ユーザに情報を提示する。また、入力デバイス1006は、ユーザからの情報の入力を受け付ける。
また、実施形態における処理内容によっては、コンピュータ1000の一部の要素は省略可能である。例えば、コンピュータ1000がユーザに情報を提示しないのであれば、ディスプレイ装置1005は省略可能である。例えば、コンピュータ1000がユーザから情報入力を受け付けないのであれば、入力デバイス1006は省略可能である。
また、上記の実施形態の各構成要素の一部または全部は、汎用または専用の回路(Circuitry)、プロセッサ等やこれらの組み合わせによって実施される。これらは単一のチップによって構成されてもよいし、バスを介して接続される複数のチップによって構成されてもよい。また、上記の実施形態の各構成要素の一部又は全部は、上述した回路等とプログラムとの組み合わせによって実現されてもよい。
上記の実施形態の各構成要素の一部又は全部が複数の情報処理装置や回路等により実現される場合には、複数の情報処理装置や回路等は、集中配置されてもよいし、分散配置されてもよい。例えば、情報処理装置や回路等は、クライアントアンドサーバシステム、クラウドコンピューティングシステム等、各々が通信ネットワークを介して接続される形態として実現されてもよい。
次に、本発明の概要を説明する。図11は、本発明の指標算出装置の概要を示すブロック図である。図11に示す指標算出装置60は、非妥当性スコア出力手段61を備える。
非妥当性スコア出力手段61(例えば、スコア算出部11)は、所定の予測対象項目の系列データであって、時間と対応づけて予測対象項目の値を示す3つ以上のデータであってそのうちの少なくとも1つが予測値を示すデータを含む系列データが入力されると、系列データの非妥当性を示す指標である非妥当性スコアであって、系列データを所定の関数形にフィッティングして得られる曲線モデルと系列データとの誤差に基づく非妥当性スコアを出力する。
以上のような構成により、実績値を用いなくても、入力された系列データの非妥当性を判断できる客観的な指標である非妥当性スコアを出力することができる。したがって、仮定の条件に基づいて得られる予測値を含む系列データの非妥当性を自動で判断できる。
また、図12は、本発明の予測システムの概要を示すブロック図である。図12に示す予測システム600は、予測手段601と、非妥当性スコア算出手段602と、評価手段603とを備える。なお、非妥当性スコア算出手段602は、上記の指標算出装置60が備える非妥当性スコア出力手段61により実現されてもよい。
予測手段601(例えば、予測部103)は、所定の予測対象項目について、学習済みの予測モデルを用いて所定の予測時点における予測値を得るとともに、得られた予測値を含む系列データであって、時間と対応づけて予測対象項目の値を示す3つ以上のデータであってそのうちの少なくとも1つが予測値を示すデータ系列データを生成する。
非妥当性スコア算出手段602(例えば、スコア算出部11)は、系列データの非妥当性を示す指標である非妥当性スコアであって、系列データを所定の関数形にフィッティングして得られる曲線モデルと系列データとの誤差に基づく非妥当性スコアを算出する。
評価手段603(例えば、モデル選択部104や出荷判断部106)は、非妥当性スコア算出手段602により算出された非妥当性スコアに基づいて、系列データ、系列データに含まれる予測値または予測値を得た予測モデルを評価する。
このような構成により、予測手段601により得られた予測値を含む系列データや、該系列データに含まれる予測値や、該予測値を得た予測モデルについて、妥当か否かを判定したり、いくつかある候補の中から、自動でより妥当なものを選択したり、妥当でないものを除外したりすることができる。
なお、上記の実施形態は以下の付記のようにも記載できる。
(付記1)所定の予測対象項目の系列データであって、時間と対応づけて予測対象項目の値を示す3つ以上のデータであってそのうちの少なくとも1つが予測値を示すデータを含む系列データが入力されると、前記系列データの非妥当性を示す指標である非妥当性スコアであって、前記系列データを所定の関数形にフィッティングして得られる曲線モデルと前記系列データとの誤差に基づく非妥当性スコアを出力する非妥当性スコア出力手段を備えることを特徴とする指標算出装置。
(付記2)前記所定の関数形は、時間が無限大のときに出力値がある値に収束するとの条件を満たす所定の関数形である付記1に記載の指標算出装置。
(付記3)前記非妥当性スコア出力手段は、前記系列データのうち所定の第1グループに属するデータを用いて前記所定の関数形へのフィッティングを行い、前記系列データのうち所定の第2グループに属するデータを用いて前記フィッティングにより得られた前記曲線モデルとの誤差を算出し、算出された前記誤差に基づいて前記非妥当性スコアを出力し、前記第1グループに属するデータと前記第2グループに属するデータとが完全一致していない付記1または付記2に記載の指標算出装置。
(付記4)前記系列データに含まれる一部のデータを第1グループとし、前記第1グループに属しないデータまたは前記系列データの全てのデータを第2グループとする付記3に記載の指標算出装置。
(付記5)前記非妥当性スコア出力手段は、前記所定の関数形へのフィッティングを行う前に、前記系列データに含まれる各データに対応づけられている時間の値を、前記系列データの表示スケールに合わせて変換する付記1から付記4のうちのいずれか1項に記載の指標算出装置。
(付記6)所定の予測対象項目について、学習済みの予測モデルを用いて所定の予測時点における予測値を得るとともに、得られた前記予測値を含む系列データであって時間と対応づけて予測対象項目の値を示す3つ以上のデータであってそのうちの少なくとも1つが予測値を示すデータを含む系列データを生成する予測手段と、前記系列データの非妥当性を示す指標である非妥当性スコアであって、前記系列データを所定の関数形にフィッティングして得られる曲線モデルと前記系列データとの誤差に基づく非妥当性スコアを算出する非妥当性スコア算出手段と、前記系列データ、前記系列データに含まれる予測値または前記予測値を得た予測モデルに対して、前記非妥当性スコアに基づく評価を行う評価手段とを備えることを特徴とする予測システム。
(付記7)前記評価手段は、前記系列データ、前記系列データに含まれる予測値または前記予測値を得た予測モデルに対して、前記非妥当性スコアと、所定の検証用データを用いて算出される前記予測モデルの予測精度とに基づいて評価を行う付記6に記載の予測システム。
(付記8)前記所定の予測対象項目について、複数のモデル候補を学習するモデル学習手段を備え、前記予測手段は、前記複数のモデル候補の各々を用いて前記予測値を得るとともに、前記複数のモデル候補ごとに、得られた前記予測値を含む系列データを生成し、前記非妥当性スコア算出手段は、前記複数のモデル候補ごとの前記系列データに対して前記非妥当性スコアを算出し、前記評価手段は、前記複数のモデル候補に対して前記評価を行い、その評価結果に基づいて前記複数のモデル候補の中から前記予測対象項目の予測値を得るモデルを選択する付記6または付記7に記載の予測システム。
(付記9)前記予測手段は、1つ以上の予測対象項目の各々に対応して1つ以上設けられ、前記非妥当性スコア出力手段は、前記1つ以上の予測手段から得られる前記予測対象項目ごとの系列データに対して前記非妥当性スコアを算出し、前記評価手段は、前記予測対象項目ごとの系列データに対して前記評価を行い、その評価結果に基づいて前記予測値の出荷判断を行う付記6または付記7に記載の予測システム。
(付記10)情報処理装置が、所定の予測対象項目の系列データであって、時間と対応づけて予測対象項目の値を示す3つ以上のデータであってそのうちの少なくとも1つが予測値を示すデータを含む系列データが入力されると、前記系列データの非妥当性を示す指標である非妥当性スコアであって、前記系列データを所定の関数形にフィッティングして得られる曲線モデルと前記系列データとの誤差に基づく非妥当性スコアを算出し、前記非妥当性スコアに基づいて、前記系列データまたは前記系列データに含まれる予測値もしくは前記予測値を得た予測モデルを評価することを特徴とする経過予測評価方法。
(付記11)コンピュータに、所定の予測対象項目の系列データであって、時間と対応づけて予測対象項目の値を示す3つ以上のデータであってそのうちの少なくとも1つが予測値を示すデータを含む系列データが入力されると、前記系列データの非妥当性を示す指標である非妥当性スコアであって、前記系列データを所定の関数形にフィッティングして得られる曲線モデルと前記系列データとの誤差に基づく非妥当性スコアを算出する処理、および前記非妥当性スコアに基づいて、前記系列データまたは前記系列データに含まれる予測値もしくは前記予測値を得た予測モデルを評価する処理を実行させるための経過予測評価プログラム。
以上、本実施形態および実施例を参照して本願発明を説明したが、本願発明は上記実施形態および実施例に限定されるものではない。本願発明の構成や詳細には、本願発明のスコープ内で当業者が理解し得る様々な変更をすることができる。
この出願は、2018年3月30日に出願された日本特許出願2018-067622を基礎とする優先権を主張し、その開示の全てをここに取り込む。
本発明は、仮定の条件に基づいて得られる予測値を含む系列データだけでなく、時間と対応づけて予測対象項目の値を示す3つ以上のデータを含む系列データについて妥当な関数形が与えられるものであれば、好適に適用可能である。
10 指標算出装置
11 スコア算出部
20 モデル自動選択装置
30 半自動出荷判断装置
100 予測システム
101 モデル学習部
102 データ記憶部
103 予測部
104 モデル選択部
105 予測結果入力部
106 出荷判断部
1000 コンピュータ
1001 CPU
1002 主記憶装置
1003 補助記憶装置
1004 インタフェース
1005 ディスプレイ装置
1006 入力デバイス
60 指標算出装置
61 非妥当性スコア出力手段
600 予測システム
601 予測手段
602 非妥当性スコア算出手段
603 評価手段
11 スコア算出部
20 モデル自動選択装置
30 半自動出荷判断装置
100 予測システム
101 モデル学習部
102 データ記憶部
103 予測部
104 モデル選択部
105 予測結果入力部
106 出荷判断部
1000 コンピュータ
1001 CPU
1002 主記憶装置
1003 補助記憶装置
1004 インタフェース
1005 ディスプレイ装置
1006 入力デバイス
60 指標算出装置
61 非妥当性スコア出力手段
600 予測システム
601 予測手段
602 非妥当性スコア算出手段
603 評価手段
Claims (11)
- 所定の予測対象項目の系列データであって、時間と対応づけて予測対象項目の値を示す3つ以上のデータであってそのうちの少なくとも1つが予測値を示すデータを含む系列データが入力されると、前記系列データの非妥当性を示す指標である非妥当性スコアであって、前記系列データを所定の関数形にフィッティングして得られる曲線モデルと前記系列データとの誤差に基づく非妥当性スコアを出力する非妥当性スコア出力手段を備える
ことを特徴とする指標算出装置。 - 前記所定の関数形は、時間が無限大のときに出力値がある値に収束するとの条件を満たす所定の関数形である
請求項1に記載の指標算出装置。 - 前記非妥当性スコア出力手段は、前記系列データのうち所定の第1グループに属するデータを用いて前記所定の関数形へのフィッティングを行い、前記系列データのうち所定の第2グループに属するデータを用いて前記フィッティングにより得られた前記曲線モデルとの誤差を算出し、算出された前記誤差に基づいて前記非妥当性スコアを出力し、
前記第1グループに属するデータと前記第2グループに属するデータとが完全一致していない
請求項1または請求項2に記載の指標算出装置。 - 前記系列データに含まれる一部のデータを第1グループとし、前記第1グループに属しないデータまたは前記系列データの全てのデータを第2グループとする
請求項3に記載の指標算出装置。 - 前記非妥当性スコア出力手段は、前記所定の関数形へのフィッティングを行う前に、前記系列データに含まれる各データに対応づけられている時間の値を、前記系列データの表示スケールに合わせて変換する
請求項1から請求項4のうちのいずれか1項に記載の指標算出装置。 - 所定の予測対象項目について、学習済みの予測モデルを用いて所定の予測時点における予測値を得るとともに、得られた前記予測値を含む系列データであって時間と対応づけて予測対象項目の値を示す3つ以上のデータであってそのうちの少なくとも1つが予測値を示すデータを含む系列データを生成する予測手段と、
前記系列データの非妥当性を示す指標である非妥当性スコアであって、前記系列データを所定の関数形にフィッティングして得られる曲線モデルと前記系列データとの誤差に基づく非妥当性スコアを算出する非妥当性スコア算出手段と、
前記系列データ、前記系列データに含まれる予測値または前記予測値を得た予測モデルに対して、前記非妥当性スコアに基づく評価を行う評価手段とを備える
ことを特徴とする予測システム。 - 前記評価手段は、前記系列データ、前記系列データに含まれる予測値または前記予測値を得た予測モデルに対して、前記非妥当性スコアと、所定の検証用データを用いて算出される前記予測モデルの予測精度とに基づいて評価を行う
請求項6に記載の予測システム。 - 前記所定の予測対象項目について、複数のモデル候補を学習するモデル学習手段を備え、
前記予測手段は、前記複数のモデル候補の各々を用いて前記予測値を得るとともに、前記複数のモデル候補ごとに、得られた前記予測値を含む系列データを生成し、
前記非妥当性スコア算出手段は、前記複数のモデル候補ごとの前記系列データに対して前記非妥当性スコアを算出し、
前記評価手段は、前記複数のモデル候補に対して前記評価を行い、その評価結果に基づいて前記複数のモデル候補の中から前記予測対象項目の予測値を得るモデルを選択する
請求項6または請求項7に記載の予測システム。 - 前記予測手段は、1つ以上の予測対象項目の各々に対応して1つ以上設けられ、
前記非妥当性スコア出力手段は、前記1つ以上の予測手段から得られる前記予測対象項目ごとの系列データに対して前記非妥当性スコアを算出し、
前記評価手段は、前記予測対象項目ごとの系列データに対して前記評価を行い、その評価結果に基づいて前記予測値の出荷判断を行う
請求項6または請求項7に記載の予測システム。 - 情報処理装置が、
所定の予測対象項目の系列データであって、時間と対応づけて予測対象項目の値を示す3つ以上のデータであってそのうちの少なくとも1つが予測値を示すデータを含む系列データが入力されると、前記系列データの非妥当性を示す指標である非妥当性スコアであって、前記系列データを所定の関数形にフィッティングして得られる曲線モデルと前記系列データとの誤差に基づく非妥当性スコアを算出し、
前記非妥当性スコアに基づいて、前記系列データまたは前記系列データに含まれる予測値もしくは前記予測値を得た予測モデルを評価する
ことを特徴とする経過予測評価方法。 - コンピュータに、
所定の予測対象項目の系列データであって、時間と対応づけて予測対象項目の値を示す3つ以上のデータであってそのうちの少なくとも1つが予測値を示すデータを含む系列データが入力されると、前記系列データの非妥当性を示す指標である非妥当性スコアであって、前記系列データを所定の関数形にフィッティングして得られる曲線モデルと前記系列データとの誤差に基づく非妥当性スコアを算出する処理、および
前記非妥当性スコアに基づいて、前記系列データまたは前記系列データに含まれる予測値もしくは前記予測値を得た予測モデルを評価する処理
を実行させるための経過予測評価プログラム。
Priority Applications (4)
| Application Number | Priority Date | Filing Date | Title |
|---|---|---|---|
| EP18911933.2A EP3779812A4 (en) | 2018-03-30 | 2018-11-29 | Index computation device, prediction system, progress prediction evaluation method, and program |
| CN201880091870.0A CN111937012A (zh) | 2018-03-30 | 2018-11-29 | 指标计算设备、预测系统、进度预测评估方法和程序 |
| US16/977,248 US20210042700A1 (en) | 2018-03-30 | 2018-11-29 | Index computation device, prediction system, progress prediction evaluation method, and program |
| JP2020509617A JP7140410B2 (ja) | 2018-03-30 | 2018-11-29 | 予測システム、予測方法および予測プログラム |
Applications Claiming Priority (2)
| Application Number | Priority Date | Filing Date | Title |
|---|---|---|---|
| JP2018-067622 | 2018-03-30 | ||
| JP2018067622 | 2018-03-30 |
Publications (1)
| Publication Number | Publication Date |
|---|---|
| WO2019187341A1 true WO2019187341A1 (ja) | 2019-10-03 |
Family
ID=68061178
Family Applications (1)
| Application Number | Title | Priority Date | Filing Date |
|---|---|---|---|
| PCT/JP2018/043910 WO2019187341A1 (ja) | 2018-03-30 | 2018-11-29 | 指標算出装置、予測システム、経過予測評価方法およびプログラム |
Country Status (5)
| Country | Link |
|---|---|
| US (1) | US20210042700A1 (ja) |
| EP (1) | EP3779812A4 (ja) |
| JP (1) | JP7140410B2 (ja) |
| CN (1) | CN111937012A (ja) |
| WO (1) | WO2019187341A1 (ja) |
Cited By (1)
| Publication number | Priority date | Publication date | Assignee | Title |
|---|---|---|---|---|
| WO2024070126A1 (ja) * | 2022-09-27 | 2024-04-04 | 株式会社Nttドコモ | 需要予測モデル生成装置 |
Families Citing this family (7)
| Publication number | Priority date | Publication date | Assignee | Title |
|---|---|---|---|---|
| US11783949B2 (en) * | 2018-11-30 | 2023-10-10 | Ariel Precision Medicine, Inc. | Methods and systems for severity calculator |
| US20210150335A1 (en) * | 2019-11-20 | 2021-05-20 | International Business Machines Corporation | Predictive model performance evaluation |
| US20220059238A1 (en) * | 2020-08-24 | 2022-02-24 | GE Precision Healthcare LLC | Systems and methods for generating data quality indices for patients |
| TWI827974B (zh) * | 2021-09-08 | 2024-01-01 | 財團法人工業技術研究院 | 虛擬功能效能分析系統及其分析方法 |
| CN116796652B (zh) * | 2023-08-25 | 2023-12-26 | 国网浙江省电力有限公司电力科学研究院 | 湿热地区配电变压器密封橡胶垫圈劣化失效预测方法 |
| CN117390937B (zh) * | 2023-12-12 | 2024-03-05 | 华中科技大学 | 一种快充条件下含缺陷储氢气瓶损伤预测方法及系统 |
| CN117574682B (zh) * | 2024-01-11 | 2024-03-26 | 华中科技大学 | 一种核壳ncm电极颗粒机械失效预测方法及系统 |
Citations (7)
| Publication number | Priority date | Publication date | Assignee | Title |
|---|---|---|---|---|
| JPH10228463A (ja) | 1997-02-17 | 1998-08-25 | Hitachi Ltd | 需要予測モデル評価方法 |
| JP2005063208A (ja) * | 2003-08-14 | 2005-03-10 | Nippon Telegr & Teleph Corp <Ntt> | ソフトウェア信頼度成長モデル選択方法、ソフトウェア信頼度成長モデル選択装置、ソフトウェア信頼度成長モデル選択プログラム、およびプログラム記録媒体 |
| WO2005031278A1 (ja) * | 2003-09-29 | 2005-04-07 | Nozzle Network Co., Ltd. | グラフ作成プログラム |
| JP2011176984A (ja) * | 2010-02-25 | 2011-09-08 | Toshiba Corp | エネルギー配分計算装置 |
| JP2016201869A (ja) * | 2015-04-07 | 2016-12-01 | レモンガス株式会社 | エネルギマネジメント方法およびエネルギマネジメントシステム |
| JP2017049677A (ja) * | 2015-08-31 | 2017-03-09 | 富士通株式会社 | 機械学習管理プログラム、機械学習管理装置および機械学習管理方法 |
| JP2018067622A (ja) | 2016-10-19 | 2018-04-26 | 日立化成株式会社 | 太陽電池セル及び太陽電池モジュール |
Family Cites Families (14)
| Publication number | Priority date | Publication date | Assignee | Title |
|---|---|---|---|---|
| JP5071851B2 (ja) * | 2007-10-31 | 2012-11-14 | 日本電信電話株式会社 | 時間情報を用いた予測装置、予測方法、予測プログラムおよびそのプログラムを記録した記録媒体 |
| CN101929994A (zh) * | 2010-08-24 | 2010-12-29 | 昆明理工大学 | 一种预测多相混合均匀性的时间序列模型和方法 |
| CN102200759A (zh) * | 2011-05-28 | 2011-09-28 | 东华大学 | 一种非线性核化自适应预测方法 |
| US20130194271A1 (en) * | 2012-01-30 | 2013-08-01 | Sap Ag | Visualization of Uncertain Times Series |
| JP5392444B1 (ja) * | 2012-04-26 | 2014-01-22 | 日本電気株式会社 | 保健指導対象者選定条件作成支援装置 |
| CN103093287B (zh) * | 2013-01-29 | 2017-02-08 | 广东电网公司电力调度控制中心 | 电网指标预测误差评估方法和系统 |
| JP6109037B2 (ja) * | 2013-10-23 | 2017-04-05 | 本田技研工業株式会社 | 時系列データ予測装置、時系列データ予測方法、及びプログラム |
| CN103942457B (zh) * | 2014-05-09 | 2017-04-12 | 浙江师范大学 | 基于关联向量机回归的水质参数时间序列预测方法 |
| US10558924B2 (en) * | 2014-05-23 | 2020-02-11 | DataRobot, Inc. | Systems for second-order predictive data analytics, and related methods and apparatus |
| JP5698860B1 (ja) * | 2014-08-22 | 2015-04-08 | 株式会社アールファイブ | 在庫管理システム、在庫管理方法、及びプログラム |
| JP6384590B2 (ja) * | 2015-03-26 | 2018-09-05 | 日本電気株式会社 | 学習モデル生成システム、方法およびプログラム |
| JP6734582B2 (ja) * | 2015-12-22 | 2020-08-05 | 国立研究開発法人理化学研究所 | リスク評価方法、リスク評価装置及びリスク評価プログラム |
| JP6742894B2 (ja) * | 2016-06-09 | 2020-08-19 | 株式会社日立製作所 | データ予測システムおよびデータ予測方法 |
| CN107491830B (zh) * | 2017-07-03 | 2021-03-26 | 北京奇艺世纪科技有限公司 | 一种时间序列曲线的处理方法和装置 |
-
2018
- 2018-11-29 WO PCT/JP2018/043910 patent/WO2019187341A1/ja active Application Filing
- 2018-11-29 JP JP2020509617A patent/JP7140410B2/ja active Active
- 2018-11-29 CN CN201880091870.0A patent/CN111937012A/zh active Pending
- 2018-11-29 EP EP18911933.2A patent/EP3779812A4/en not_active Withdrawn
- 2018-11-29 US US16/977,248 patent/US20210042700A1/en not_active Abandoned
Patent Citations (7)
| Publication number | Priority date | Publication date | Assignee | Title |
|---|---|---|---|---|
| JPH10228463A (ja) | 1997-02-17 | 1998-08-25 | Hitachi Ltd | 需要予測モデル評価方法 |
| JP2005063208A (ja) * | 2003-08-14 | 2005-03-10 | Nippon Telegr & Teleph Corp <Ntt> | ソフトウェア信頼度成長モデル選択方法、ソフトウェア信頼度成長モデル選択装置、ソフトウェア信頼度成長モデル選択プログラム、およびプログラム記録媒体 |
| WO2005031278A1 (ja) * | 2003-09-29 | 2005-04-07 | Nozzle Network Co., Ltd. | グラフ作成プログラム |
| JP2011176984A (ja) * | 2010-02-25 | 2011-09-08 | Toshiba Corp | エネルギー配分計算装置 |
| JP2016201869A (ja) * | 2015-04-07 | 2016-12-01 | レモンガス株式会社 | エネルギマネジメント方法およびエネルギマネジメントシステム |
| JP2017049677A (ja) * | 2015-08-31 | 2017-03-09 | 富士通株式会社 | 機械学習管理プログラム、機械学習管理装置および機械学習管理方法 |
| JP2018067622A (ja) | 2016-10-19 | 2018-04-26 | 日立化成株式会社 | 太陽電池セル及び太陽電池モジュール |
Non-Patent Citations (1)
| Title |
|---|
| HIDETAKA TAKAHASHIKATSUMI YOSHIDA: "HRA (Health Risk Appraisal System) for Lifestyle Improvement", JOURNAL OF JAPAN SOCIETY OF HUMAN DOCK (JHD, vol. 11, no. 4, 1997, pages 123 - 128 |
Cited By (1)
| Publication number | Priority date | Publication date | Assignee | Title |
|---|---|---|---|---|
| WO2024070126A1 (ja) * | 2022-09-27 | 2024-04-04 | 株式会社Nttドコモ | 需要予測モデル生成装置 |
Also Published As
| Publication number | Publication date |
|---|---|
| JPWO2019187341A1 (ja) | 2021-02-12 |
| JP7140410B2 (ja) | 2022-09-21 |
| EP3779812A4 (en) | 2021-12-29 |
| CN111937012A (zh) | 2020-11-13 |
| US20210042700A1 (en) | 2021-02-11 |
| EP3779812A1 (en) | 2021-02-17 |
Similar Documents
| Publication | Publication Date | Title |
|---|---|---|
| WO2019187341A1 (ja) | 指標算出装置、予測システム、経過予測評価方法およびプログラム | |
| CN108597617B (zh) | 流行病分级预测方法及装置、计算机装置和可读存储介质 | |
| WO2019187372A1 (ja) | 予測システム、モデル生成システム、方法およびプログラム | |
| US20120271612A1 (en) | Predictive modeling | |
| CN107767191A (zh) | 一种基于医药大数据预测药品销售趋势的方法 | |
| US10699225B2 (en) | Production management support apparatus, production management support method, and production management support program | |
| US20110173018A1 (en) | System and method for use of prediction market data to generate real-time predictive healthcare models | |
| JP2019128904A (ja) | 予測システム、シミュレーションシステム、方法およびプログラム | |
| US20180315502A1 (en) | Method and apparatus for optimization and simulation of patient flow | |
| KR20160135451A (ko) | 학과계열 선정 시스템 및 그 방법 | |
| CN115049315A (zh) | 一种用电安全风险评估方法、装置、设备及存储介质 | |
| Basakha et al. | Health care cost disease as a threat to Iranian aging society | |
| Topsakal et al. | Utilization of machine learning for the objective assessment of rhinoplasty outcomes | |
| Alghawli et al. | A Fuzzy MCDM Approach for Structured Comparison of the Health Literacy Level of Hospitals | |
| WO2019181517A1 (ja) | 視野検査装置、その制御方法及び視野検査プログラム | |
| JP6604032B2 (ja) | 評価支援装置、評価支援プログラム及び評価支援システム | |
| WO2023223533A1 (ja) | 推定装置、推定方法およびプログラム | |
| JP2016099688A (ja) | リスク評価方法およびリスク評価装置 | |
| US20160224912A1 (en) | Information processing apparatus, and non-transitory recording medium | |
| JP4896848B2 (ja) | 認定適正化シミュレーションシステム及びこのシステムのためのプログラムを記録したコンピュータ読み取り可能な記憶媒体 | |
| JP2749657B2 (ja) | ソフトウェア品質シミュレータ装置 | |
| Bolton | Validation of statistical models for creep rupture by parametric analysis | |
| Hayashi | DEA and social policy: A performance evaluation of Japanese local welfare offices | |
| DK201770230A1 (en) | Multi criteria decision analysis for mitigating of crowding | |
| JP2023025415A (ja) | プログラム、記憶媒体、システム、学習済モデルおよび判定方法 |
Legal Events
| Date | Code | Title | Description |
|---|---|---|---|
| 121 | Ep: the epo has been informed by wipo that ep was designated in this application |
Ref document number: 18911933 Country of ref document: EP Kind code of ref document: A1 |
|
| ENP | Entry into the national phase |
Ref document number: 2020509617 Country of ref document: JP Kind code of ref document: A |
|
| WWE | Wipo information: entry into national phase |
Ref document number: 2018911933 Country of ref document: EP |