WO2019124025A1 - 測定装置およびプログラム - Google Patents
測定装置およびプログラム Download PDFInfo
- Publication number
- WO2019124025A1 WO2019124025A1 PCT/JP2018/044217 JP2018044217W WO2019124025A1 WO 2019124025 A1 WO2019124025 A1 WO 2019124025A1 JP 2018044217 W JP2018044217 W JP 2018044217W WO 2019124025 A1 WO2019124025 A1 WO 2019124025A1
- Authority
- WO
- WIPO (PCT)
- Prior art keywords
- pulse wave
- blood pressure
- unit
- frequency
- sensor unit
- Prior art date
- Legal status (The legal status is an assumption and is not a legal conclusion. Google has not performed a legal analysis and makes no representation as to the accuracy of the status listed.)
- Ceased
Links
Images


Classifications
-
- A—HUMAN NECESSITIES
- A61—MEDICAL OR VETERINARY SCIENCE; HYGIENE
- A61B—DIAGNOSIS; SURGERY; IDENTIFICATION
- A61B5/00—Measuring for diagnostic purposes; Identification of persons
- A61B5/02—Detecting, measuring or recording for evaluating the cardiovascular system, e.g. pulse, heart rate, blood pressure or blood flow
- A61B5/021—Measuring pressure in heart or blood vessels
- A61B5/02108—Measuring pressure in heart or blood vessels from analysis of pulse wave characteristics
-
- A—HUMAN NECESSITIES
- A61—MEDICAL OR VETERINARY SCIENCE; HYGIENE
- A61B—DIAGNOSIS; SURGERY; IDENTIFICATION
- A61B5/00—Measuring for diagnostic purposes; Identification of persons
- A61B5/0002—Remote monitoring of patients using telemetry, e.g. transmission of vital signals via a communication network
- A61B5/0015—Remote monitoring of patients using telemetry, e.g. transmission of vital signals via a communication network characterised by features of the telemetry system
- A61B5/0022—Monitoring a patient using a global network, e.g. telephone networks, internet
-
- A—HUMAN NECESSITIES
- A61—MEDICAL OR VETERINARY SCIENCE; HYGIENE
- A61B—DIAGNOSIS; SURGERY; IDENTIFICATION
- A61B5/00—Measuring for diagnostic purposes; Identification of persons
- A61B5/02—Detecting, measuring or recording for evaluating the cardiovascular system, e.g. pulse, heart rate, blood pressure or blood flow
- A61B5/021—Measuring pressure in heart or blood vessels
- A61B5/02141—Details of apparatus construction, e.g. pump units or housings therefor, cuff pressurising systems, arrangements of fluid conduits or circuits
-
- A—HUMAN NECESSITIES
- A61—MEDICAL OR VETERINARY SCIENCE; HYGIENE
- A61B—DIAGNOSIS; SURGERY; IDENTIFICATION
- A61B5/00—Measuring for diagnostic purposes; Identification of persons
- A61B5/02—Detecting, measuring or recording for evaluating the cardiovascular system, e.g. pulse, heart rate, blood pressure or blood flow
- A61B5/021—Measuring pressure in heart or blood vessels
- A61B5/022—Measuring pressure in heart or blood vessels by applying pressure to close blood vessels, e.g. against the skin; Ophthalmodynamometers
- A61B5/0235—Valves specially adapted therefor
-
- A—HUMAN NECESSITIES
- A61—MEDICAL OR VETERINARY SCIENCE; HYGIENE
- A61B—DIAGNOSIS; SURGERY; IDENTIFICATION
- A61B5/00—Measuring for diagnostic purposes; Identification of persons
- A61B5/05—Detecting, measuring or recording for diagnosis by means of electric currents or magnetic fields; Measuring using microwaves or radio waves
- A61B5/053—Measuring electrical impedance or conductance of a portion of the body
-
- A—HUMAN NECESSITIES
- A61—MEDICAL OR VETERINARY SCIENCE; HYGIENE
- A61B—DIAGNOSIS; SURGERY; IDENTIFICATION
- A61B5/00—Measuring for diagnostic purposes; Identification of persons
- A61B5/68—Arrangements of detecting, measuring or recording means, e.g. sensors, in relation to patient
- A61B5/6801—Arrangements of detecting, measuring or recording means, e.g. sensors, in relation to patient specially adapted to be attached to or worn on the body surface
- A61B5/6802—Sensor mounted on worn items
- A61B5/681—Wristwatch-type devices
-
- A—HUMAN NECESSITIES
- A61—MEDICAL OR VETERINARY SCIENCE; HYGIENE
- A61B—DIAGNOSIS; SURGERY; IDENTIFICATION
- A61B5/00—Measuring for diagnostic purposes; Identification of persons
- A61B5/72—Signal processing specially adapted for physiological signals or for diagnostic purposes
- A61B5/7225—Details of analogue processing, e.g. isolation amplifier, gain or sensitivity adjustment, filtering, baseline or drift compensation
-
- A—HUMAN NECESSITIES
- A61—MEDICAL OR VETERINARY SCIENCE; HYGIENE
- A61B—DIAGNOSIS; SURGERY; IDENTIFICATION
- A61B5/00—Measuring for diagnostic purposes; Identification of persons
- A61B5/74—Details of notification to user or communication with user or patient; User input means
- A61B5/742—Details of notification to user or communication with user or patient; User input means using visual displays
Definitions
- the present disclosure relates to a measuring device and program, and more particularly to a measuring device and program of information related to pulse waves.
- Patent Document 1 Japanese Patent Laid-Open No. 2017-070739 discloses a configuration for measuring a biosignal including pulse wave information of one or both of a radial artery and an ulnar artery. Do.
- Patent Document 2 Japanese Patent Application Laid-Open No. 2016-135261 irradiates light on the surface of a living body from a sensor having light emitting elements arranged in a first direction in order to detect a pulse wave, and A configuration is disclosed in which light is received by a light receiving element and detected as a pulse wave signal. Moreover, patent document 2 discloses the structure which distinguishes the signals by the light which originates in each sensor by shifting the light emission period of the sensors arrange
- An object in one aspect of the present disclosure is to provide a measurement device and a program for acquiring information on pulse waves more accurately.
- a device for measuring a pulse wave includes a first pulse wave sensor unit and a second pulse wave sensor unit that can be disposed corresponding to each of measurement sites separated from each other.
- the first pulse wave sensor unit outputs a first current signal having a first frequency to a corresponding measurement site, and a first output unit for detecting a voltage signal representing a pulse wave from the corresponding measurement site. And a detection unit.
- the second pulse wave sensor unit outputs a second output unit that outputs a second current signal having a second frequency different from the first frequency to the corresponding measurement site, and a voltage signal representing a pulse wave from the corresponding measurement site. And a second detection unit for detecting.
- the first detection unit processes the voltage signal representing the pulse wave to be detected based on the filter characteristic corresponding to the first frequency
- the second detection unit processes the voltage signal representing the pulse wave to be detected to the second frequency Process based on the corresponding filter characteristics.
- an apparatus for measuring a pulse wave includes a first pulse wave sensor unit and a second pulse wave sensor unit that can be disposed corresponding to each of measurement sites separated from each other.
- the first pulse wave sensor unit outputs a first current signal having a first frequency to a corresponding measurement site, and a first output unit for detecting a voltage signal representing a pulse wave from the corresponding measurement site. And a second output unit that outputs a second current signal having a second frequency to a corresponding measurement site, and a voltage signal representing a pulse wave from the corresponding measurement site. And a second detection unit for detecting The measuring device alternately drives the first pulse wave sensor unit and the second pulse wave sensor unit at predetermined intervals.
- the first frequency and the second frequency indicate the same frequency.
- the first frequency is different from the second frequency.
- the first frequency represents 50 kHz or 60 kHz
- the second frequency represents 50 kHz or 60 kHz.
- the measurement apparatus further detects a pulse wave propagation velocity from at least one of a pulse wave indicated by the voltage signal detected by the first detection unit and a pulse wave indicated by the voltage signal detected by the second detection unit.
- the measuring apparatus further comprises a first blood pressure based on a pulse wave propagation velocity calculated from a pulse wave indicated by the voltage signal detected by the first detection unit, and a pulse wave indicated by the voltage signal detected by the second detection unit.
- the blood pressure calculation unit is further provided to calculate at least one of the second blood pressure based on the calculated pulse wave velocity.
- the measuring device further detects an S / N ratio for each of the voltage signals representing pulse waves detected by the first detection unit and the second detection unit.
- the blood pressure calculation unit calculates pulse wave propagation calculated from a pulse wave indicated by a voltage signal having a higher S / N ratio among voltage signals representing pulse waves detected by the first detection unit and the second detection unit. Calculate blood pressure based on velocity.
- the blood pressure calculation unit calculates a representative blood pressure of the first blood pressure and the second blood pressure.
- the representative blood pressure includes the mean blood pressure of the first blood pressure and the second blood pressure.
- the mean blood pressure is an average calculated by weighting each of the first blood pressure and the second blood pressure, wherein the weight of the first blood pressure is based on the corresponding S / N ratio, and the weight of the second blood pressure is It is based on the corresponding S / N ratio.
- the measurement apparatus further includes a display, and further includes a communication unit for communicating with an external information processing apparatus having a display unit, and the measurement apparatus displays the blood pressure value calculated by the blood pressure calculation unit on the display unit. To the information processing apparatus via the communication unit.
- a program for causing a computer to execute a control method of a device wherein the device may be disposed corresponding to each of measurement sites separated from each other, and a first pulse wave sensor unit A second output step of controlling the first pulse wave sensor unit to output a first current signal having a first frequency to a corresponding measurement site;
- the first pulse wave sensor unit is controlled to detect a voltage signal representing the pulse wave from the measurement site corresponding to the first pulse wave sensor unit, and the second pulse wave sensor unit has a second frequency.
- a program for causing a computer to execute a control method of an apparatus.
- the device includes a first pulse wave sensor unit and a second pulse wave sensor unit that can be disposed corresponding to each of the measurement sites separated from each other.
- the control method comprises: controlling a first pulse wave sensor unit to output a first current signal having a first frequency to a corresponding measurement region; and controlling the first pulse wave sensor unit as a corresponding measurement region A second detection step of controlling to detect a voltage signal representing a pulse wave from the second output, and a second output controlling a second current signal having a second frequency to a corresponding measurement site Step, a second detection step of controlling the second pulse wave sensor unit to detect a voltage signal representing a pulse wave from the corresponding measurement site, and a first pulse wave sensor unit and a second pulse wave sensor unit in advance Alternately driving at predetermined intervals.
- FIG. 1 is an external perspective view of a sphygmomanometer 1 according to a first embodiment.
- FIG. 7 schematically shows a cross section perpendicular to the longitudinal direction of the wrist 90 in a state where the sphygmomanometer 1 according to Embodiment 1 is attached to the left wrist 90.
- FIG. 5 is a diagram showing a planar layout of an electrode group for impedance measurement in a state where the sphygmomanometer 1 according to Embodiment 1 is attached to a wrist 90.
- FIG. 2 is a block diagram of a control system of the sphygmomanometer 1 according to the first embodiment.
- FIG. 2 is a diagram showing a configuration of a sensor unit according to Embodiment 1;
- FIG. 5 is a schematic view for explaining blood pressure measurement based on pulse wave propagation time according to the first embodiment.
- FIG. 7 is a schematic cross-sectional view along the longitudinal direction of the wrist in a state where the sphygmomanometer 1 is attached to the wrist 90 when performing blood pressure measurement by the oscillometric method according to the first embodiment.
- FIG. 2 is a view schematically showing a configuration of a function related to measurement provided in the CPU 100 according to the first embodiment.
- 7 is a flowchart showing a process of blood pressure measurement based on PTT according to the first embodiment.
- FIG. 5 is a diagram showing an example of storage of measurement results according to the first embodiment.
- FIG. 7 is a view showing a display example of measurement results according to the first embodiment.
- FIG. 1 is a diagram showing a schematic configuration of a system according to a first embodiment.
- FIG. 2 is a diagram for explaining the background of the first embodiment.
- FIG. 1 is a diagram showing a configuration of a first embodiment.
- FIG. 16 schematically shows a configuration of a function related to measurement provided in CPU 100A according to the second embodiment.
- FIG. 10 schematically shows a cycle CR according to the second embodiment.
- FIG. 10 is a diagram schematically showing a waveform of a current signal output to a measurement site according to Embodiment 2.
- 15 is a flowchart showing a control method of the sphygmomanometer 1 according to the fourth embodiment.
- 15 is a flowchart showing another control method of the sphygmomanometer 1 according to the fourth embodiment.
- pulse wave propagation time (hereinafter referred to as PTT) is illustrated as information on pulse waves, but information on pulse waves is not limited to PTT.
- the measurement apparatus for acquiring the information regarding a pulse wave demonstrates the case mounted in the sphygmomanometer which is a wearable terminal.
- the device equipped with the “measurement device” is not limited to the sphygmomanometer.
- the sphygmomanometer is not limited to a wearable terminal.
- FIG. 1 is an external perspective view of the sphygmomanometer 1 according to the first embodiment.
- FIG. 2 schematically shows a cross section perpendicular to the longitudinal direction of the wrist 90 in a state in which the sphygmomanometer 1 according to the first embodiment is attached to the left wrist 90 (hereinafter also referred to as “mounted state”).
- the left wrist 90 is the measurement site.
- the “measurement site” may be a site through which an artery passes, and is not limited to the wrist.
- the measurement site may be, for example, the lower limbs such as the right wrist, the upper arm, the ankle, and the thigh.
- belt 20 is a belt-like member.
- the belt 20 is slidably wound and mounted in the mounted state so that the longitudinal direction of the belt 20 corresponds to the circumferential direction of the wrist 90.
- the dimension (width dimension) in the width direction Y of the belt 20 is, for example, about 30 mm.
- Belt 20 includes a band 23 and a compression cuff 21.
- the strip 23 has an inner circumferential surface 23a which is a surface on the measurement site side and an outer circumferential surface 20b which is a surface opposite to the inner circumferential surface 23a.
- the compression cuff 21 is attached along the inner circumferential surface 23 a of the strip 23 and has an inner circumferential surface 20 a in contact with the wrist 90 (see FIG. 2).
- the compression cuff 21 is configured as a fluid bag by facing two stretchable polyurethane sheets in the thickness direction and welding their peripheral portions.
- the fluid bag of the compression cuff 21 may be a bag-like member capable of containing a fluid.
- the compression cuff 21 is inflated when the fluid is supplied, and the measurement site is pressurized as the compression cuff 21 is inflated. In addition, when the fluid is discharged, the compression cuff 21 contracts and the pressurization state of the measurement site is released.
- the main body 10 is provided integrally with one end 20 e of the belt 20.
- the belt 20 and the main body 10 may be separately formed, and the main body 10 may be integrally attached to the belt 20 via an engaging member (for example, a hinge).
- the portion where the main body 10 is disposed corresponds to the back side surface (surface on the back side of the hand) 90b of the wrist 90 in the mounted state (see FIG. 2).
- FIG. 2 a radial artery 91 and an ulnar artery 91A which pass near the palmar side (palm side) 90a in the wrist 90 are shown.
- the main body 10 has a three-dimensional shape having a thickness in a direction perpendicular to the outer circumferential surface 20 b of the belt 20.
- the main body 10 is small and thin so as not to interfere with the daily activities of the user.
- the main body 10 has a quadrangular frustum-shaped contour protruding outward from the belt 20.
- a display 50 is provided on the top surface (the surface farthest from the measurement site) 10 a of the main body 10.
- An operation unit 52 for inputting an instruction from the user is provided along the side surface 10f of the main body 10 (the left side front side surface in FIG. 1) 10f.
- a sensor portion 40 and a portion between the one end 20 e of the belt 20 and the other end 20 f on the inner peripheral surface 20 a of the belt 20 (that is, the inner peripheral surface 20 a of the compression cuff 21) 40A is provided.
- the sensor units 40 and 40A have a function of detecting a pulse wave using an impedance measurement function.
- An electrode group 40E is disposed on the inner circumferential surface 20a of the portion where the sensor unit 40 is disposed.
- the electrode group 40E has six plate-like (or sheet-like) electrodes 41 to 46 which are disposed in a state of being separated from each other in the width direction Y of the belt 20.
- the part where the electrode group 40E is disposed corresponds to the radial artery 91 of the wrist 90 in the mounted state.
- the solid 22 is disposed at a position corresponding to the electrode group 40E on the outer circumferential surface 21a.
- a pressure cuff 24 is disposed on the outer peripheral side of the solid 22.
- the pressing cuff 24 is an expanding member that locally suppresses a region corresponding to the electrode group 40E in the circumferential direction of the compression cuff 21.
- the pressure cuff 24 is disposed on the inner circumferential surface 23 a of the strip 23 that constitutes the belt 20 (see FIG. 2).
- the band 23 is made of a plastic material that is flexible in the thickness direction and inelastic in the circumferential direction (longitudinal direction).
- the pressing cuff 24 is a fluid bag that expands and contracts in the thickness direction of the belt 20, and is pressurized by the supply of fluid and is not pressurized by discharging the fluid.
- the pressure cuff 24 is configured as, for example, a fluid bag by facing two stretchable polyurethane sheets in the thickness direction and welding their peripheral portions.
- the solid 22 is disposed at a position corresponding to the electrode group 40 ⁇ / b> E on the inner circumferential surface 24 a of the pressing cuff 24.
- the solid 22 is made of, for example, a plate-like resin (for example, polypropylene) having a thickness of about 1 to 2 mm.
- the belt 20, the pressing cuff 24, and the solid 22 are used as a pressing unit that presses the sensor unit 40 against the measurement site (a site corresponding to the radial artery 91).
- the sensor unit 40A has an arrangement aspect and a configuration similar to the sensor unit 40. Specifically, the electrode group 40F is disposed on the inner circumferential surface 20a of the portion where the sensor unit 40A is disposed.
- the electrode group 40F has six plate-like (or sheet-like) electrodes 41A to 46A which are disposed in a state of being separated from each other in the width direction Y of the belt 20.
- the part where the electrode group 40F is disposed corresponds to the ulnar artery 91A of the wrist 90 in the mounted state.
- the solid 22A is disposed at a position corresponding to the electrode group 40F on the outer circumferential surface 21a.
- the pressing cuff 24A is disposed on the outer peripheral side of the solid 22A.
- the pressing cuff 24A is an expanding member that locally suppresses the region corresponding to the electrode group 40F in the circumferential direction of the compression cuff 21.
- the pressure cuff 24A is also disposed on the inner circumferential surface 23a of the strip 23 that constitutes the belt 20 (see FIG. 2).
- the pressing cuff 24A is a fluid bag that expands and contracts in the thickness direction of the belt 20, and is pressurized by the supply of fluid and is not pressurized by discharging the fluid.
- the pressing cuff 24A is configured as, for example, a fluid bag by facing two stretchable polyurethane sheets in the thickness direction and welding their peripheral portions.
- the solid 22A is disposed at a position corresponding to the electrode group 40F on the inner circumferential surface 24b of the pressing cuff 24A.
- the solid 22A is made of, for example, a plate-like resin (eg, polypropylene) having a thickness of about 1 to 2 mm.
- the belt 20, the pressing cuff 24A, and the solid 22A are used as a pressing unit that presses the sensor unit 40A against the measurement site (a site corresponding to the ulnar artery 91A).
- the bottom surface 10b (the surface closest to the measurement site) 10b of the main body 10 and the end 20f of the belt 20 are three-fold buckles 15 (hereinafter, also simply referred to as "buckles 15"). Connected by.
- the buckle 15 includes a plate-like member 25 disposed on the outer circumferential side and a plate-like member 26 disposed on the inner circumferential side.
- One end 25 e of the plate member 25 is rotatably attached to the main body 10 via a connecting rod 27 extending along the width direction Y.
- the other end 25 f of the plate 25 is rotatably attached to one end 26 e of the plate 26 via a connecting rod 28 extending in the width direction Y.
- the other end 26 f of the plate member 26 is fixed by the fixing portion 29 in the vicinity of the end 20 f of the belt 20.
- the attachment position of the fixing portion 29 is variably set in advance in accordance with the circumferential length of the wrist 90 of the user.
- the sphygmomanometer 1 (belt 20) is generally formed in a substantially annular shape, and the bottom surface 10b of the main body 10 and the end 20f of the belt 20 can be opened and closed in the arrow B direction in FIG. Configured
- the user When mounting the sphygmomanometer 1 on the wrist 90, the user passes the left hand through the belt 20 from the direction indicated by the arrow A in FIG. 1 with the buckle 15 opened and the diameter of the ring of the belt 20 increased.
- the user adjusts the angular position of the belt 20 around the wrist 90 by sliding or the like, and moves the sensor unit 40 so as to be positioned on the radial artery 91.
- the electrode group 40E of the sensor unit 40 abuts on a portion 90a1 of the palm lateral surface 90a of the wrist 90 corresponding to the radial artery 91.
- the electrode group 40F of the sensor unit 40A is in a state of being in contact with a portion of the palm lateral surface 90a of the wrist 90 that corresponds to the ulnar artery 91A. In this state, the user closes and fixes the buckle 15. Thus, the user winds and wears the sphygmomanometer 1 (belt 20) around the wrist 90.
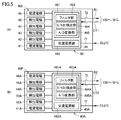
- FIG. 3 is a diagram showing a planar layout of the electrode group for impedance measurement in a state where the sphygmomanometer 1 according to the first embodiment is attached to the wrist 90.
- the electrode group 40E of the sensor unit 40 in the worn state, is aligned along the longitudinal direction of the wrist corresponding to the radial artery 91 of the left wrist 90.
- the electrode group 40E includes current electrode pairs 41 and 46 for current conduction disposed on both sides in the width direction Y, and a detection electrode pair 42 and 43 and a detection electrode pair 44 disposed between the current electrode pairs 41 and 46. , 45 and so on.
- the first pulse wave sensor 40-1 includes detection electrode pairs 42 and 43
- the second pulse wave sensor 40-2 includes detection electrode pairs 44 and 45.
- Detection electrode pairs 44 and 45 are arranged corresponding to the downstream side of the blood flow of the radial artery 91 with respect to the detection electrode pairs 42 and 43.
- a distance D (see FIG. 6 described later) between the center of the detection electrode pair 42, 43 and the center of the detection electrode pair 44, 45 is set to, for example, 20 mm.
- the interval D corresponds to the interval between the first pulse wave sensor 40-1 and the second pulse wave sensor 40-2.
- the distance between the detection electrode pair 42, 43 and the distance between the detection electrode pair 44, 45 are both set to 2 mm.
- Electrode group 40F of the sensor unit 40A is aligned along the longitudinal direction of the wrist corresponding to the ulnar artery 91A of the left wrist 90.
- Electrode group 40F includes current electrode pairs 41A and 46A for current conduction disposed on both sides with respect to width direction Y, and detection electrode pairs 42A and 43A and detection electrode pair 44A disposed between the current electrode pairs 41A and 46A. , 45A.
- the first pulse wave sensor 40-1A includes a detection electrode pair 42A, 43A
- the second pulse wave sensor 40-2A includes a detection electrode pair 44A, 45A.
- the detection electrode pair 44A, 45A is disposed corresponding to the downstream side of the blood flow of the ulnar artery 91A with respect to the detection electrode pair 42A, 43A.
- the above-mentioned distance D between the center of the detection electrode pair 42A, 43A and the center of the detection electrode pair 44A, 45A is set to, for example, 20 mm.
- the interval D corresponds to the interval between the first pulse wave sensor 40-1A and the second pulse wave sensor 40-2A.
- the distance between the detection electrode pair 42A, 43A and the distance between the detection electrode pair 44A, 45A are both set to 2 mm, for example.
- the belt 20 can be configured to be thin as a whole. Also, since the electrode groups 40E and 40F can be configured flexibly, the electrode groups 40E and 40F do not prevent the compression of the left wrist 90 by the compression cuff 21 and do not impair the accuracy of blood pressure measurement by the oscillometric method described later. .
- FIG. 4 is a block diagram of a control system of the sphygmomanometer 1 according to the first embodiment.
- the sphygmomanometer 1 has an oscillometric blood pressure measurement function and a blood pressure measurement function based on PTT.
- the sphygmomanometer 1 of FIG. 4 exemplifies a configuration using air as a fluid.
- the main unit 10 includes a central processing unit (CPU) 100 functioning as a control unit, a display 50, a memory 51 functioning as a storage unit, an operation unit 52, a battery 53, and a communication unit 59. And. Also, the main body 10 includes a pressure sensor 31, a pump 32, a valve 33, a pressure sensor 34, and a switching valve 35. The switching valve 35 switches the connection destination of the pump 32 and the valve 33 to the compression cuff 21 or the pressing cuffs 24 and 24A.
- CPU central processing unit
- the main body 10 includes a pressure sensor 31, a pump 32, a valve 33, a pressure sensor 34, and a switching valve 35.
- the switching valve 35 switches the connection destination of the pump 32 and the valve 33 to the compression cuff 21 or the pressing cuffs 24 and 24A.
- main body 10 includes an oscillation circuit 310 and an oscillation circuit 340 that convert outputs from pressure sensor 31 and pressure sensor 34 into frequencies, and a pump drive circuit 320 that drives pump 32.
- the configuration of the sensor units 40 and 40A will be described later with reference to FIG.
- the display 50 is configured of, for example, an organic EL (Electro Luminescence) display, and displays information in accordance with a control signal from the CPU 100. This information includes the measurement results.
- the display 50 is not limited to the organic EL display, and may be configured of another type of display such as, for example, an LCD (Liquid Cristal Display).
- the operation unit 52 is, for example, a push-type switch, and inputs an operation signal to the CPU 100 in accordance with an instruction to start or stop blood pressure measurement by the user.
- the operation unit 52 is not limited to the push-type switch, and may be, for example, a pressure-sensitive (resistive) or proximity-type (electrostatic capacitive) touch panel switch.
- the main body 10 may include a microphone (not shown), and may receive an instruction to start blood pressure measurement by the user's voice.
- the memory 51 is data of a program for controlling the sphygmomanometer 1, data used to control the sphygmomanometer 1, setting data for setting various functions of the sphygmomanometer 1, data of measurement results of blood pressure values, etc. Is stored temporarily.
- the memory 51 is also used as a work memory or the like when a program is executed.
- the CPU 100 executes various functions as a control unit in accordance with a program for controlling the sphygmomanometer 1 stored in the memory 51. For example, when performing blood pressure measurement by the oscillometric method, the CPU 100 drives the pump 32 (and the valve 33) based on a signal from the pressure sensor 31 in response to an instruction to start blood pressure measurement from the operation unit 52. Do. Further, the CPU 100 calculates the blood pressure value (systolic blood pressure (systolic blood pressure) and diastolic blood pressure (Diastolic blood pressure)) based on the signal from the pressure sensor 31, and also measures the pulse rate. calculate.
- blood pressure value systolic blood pressure (systolic blood pressure) and diastolic blood pressure (Diastolic blood pressure)
- the CPU 100 When performing blood pressure measurement based on PTT, the CPU 100 performs control to drive the valve 33 in order to discharge air in the compression cuff 21 in accordance with an instruction to start blood pressure measurement from the operation unit 52. Further, the CPU 100 controls the switching valve 35 to switch the connection destination of the pump 32 (and the valve 33) to the pressure cuffs 24 and 24A. Further, the CPU 100 performs control to calculate the blood pressure value based on the signal from the pressure sensor 34.
- Communication unit 59 is controlled by CPU 100 to communicate with an external information processing apparatus via network 900.
- the external information processing apparatus may include a portable terminal 10B and a server 30, which will be described later, but is not limited to these apparatuses.
- Communication via network 900 may include wireless or wired.
- the network 900 may include the Internet and a LAN (Local Area Network). Alternatively, it may include one-to-one communication using a USB cable.
- the communication unit 59 may include a micro USB connector.
- the pump 32 and the valve 33 are connected to the compression cuff 21 and the pressure cuffs 24 and 24A via the switching valve 35 and the air pipes 39a and 39b.
- the pressure sensor 31 is connected to the compression force cuff 21 and the pressing cuffs 24 and 24A via the air pipe 38a and the pressure sensor 34 via the air pipe 38b.
- the pressure sensor 31 detects the pressure in the compression cuff 21 via the air pipe 38a.
- the switching valve 35 is driven based on a control signal supplied from the CPU 100, and switches the connection destination of the pump 32 and the valve 33 to the compression cuff 21 or the pressing cuffs 24 and 24A.
- the pump 32 is configured of, for example, a piezoelectric pump.
- the pump 32 passes the air pipe 39a to pressurize the pressure (cuff pressure) in the compression cuff 21.
- the compression cuff 21 is supplied with air as a fluid for pressurization.
- the pump 32 applies pressure (cuff pressure) in the cuffs of the pressing cuffs 24 and 24A.
- air is supplied to the pressure cuffs 24 and 24A through the air pipe 39b.
- the valve 33 is mounted on the pump 32, and is configured to be controlled in opening / closing as the pump 32 is turned on / off. Specifically, when the connection destination of the pump 32 and the valve 33 is switched to the compression cuff 21 by the switching valve 35, the valve 33 is closed when the pump 32 is turned on, and the pressure cuff 21 is While the air is enclosed, it is opened when the pump 32 is turned off, and the air of the compression cuff 21 is exhausted to the atmosphere through the air pipe 39a.
- Pump drive circuit 320 drives pump 32 based on a control signal supplied from CPU 100.
- the pressure sensor 31 is, for example, a piezoresistive pressure sensor, and is connected to the pump 32, the valve 33, and the compression cuff 21 via an air pipe 38a.
- the pressure sensor 31 detects the pressure of the belt 20 (the compression cuff 21), for example, the pressure based on the atmospheric pressure (zero) via the air pipe 38a, and outputs it as a time-series signal.
- the oscillation circuit 310 outputs, to the CPU 100, a frequency signal having a frequency corresponding to an electrical signal value based on a change in electrical resistance due to the piezoresistive effect from the pressure sensor 31.
- the output of the pressure sensor 31 is used to control the pressure of the compression force 21 and to calculate the blood pressure value by oscillometric method.
- the pressure sensor 34 is, for example, a piezoresistive pressure sensor, and is connected to the pump 32, the valve 33, and the pressing cuffs 24 and 24A through an air pipe 38b.
- the pressure sensor 34 detects the pressure of the pressure cuffs 24 and 24A, for example, the pressure based on the atmospheric pressure (zero) via the air pipe 38b, and outputs it as a time-series signal.
- the oscillation circuit 340 oscillates according to the electrical signal value based on the change in electrical resistance due to the piezoresistive effect from the pressure sensor 34, and outputs a frequency signal having a frequency according to the electrical signal value of the pressure sensor 34 to the CPU 100.
- the output of the pressure sensor 34 is used to control the pressure of the pressure cuffs 24 and 24A and to calculate the blood pressure based on PTT.
- the CPU 100 controls the pump 32 and the valve 33 to increase and decrease the cuff pressure according to various conditions. .
- the battery 53 supplies power to various elements mounted on the main body 10.
- the battery 53 also supplies power to the sensor unit 40 and the 40A unit 49 through the wiring 71.
- the wiring 71 is inserted between the main body 10 and the sensor units 40 and 40A along the circumferential direction of the belt 20 in a state of being sandwiched between the strip 23 of the belt 20 and the compression cuff 21 together with the wiring 72 for signal. It is provided extending to
- FIG. 5 is a diagram showing the configuration of the sensor unit according to the first embodiment.
- the sensor unit 40 includes the electrodes 41 to 46 of the above-described electrode group 40E, and a conduction and voltage detection unit 49.
- the energization and voltage detection unit 49 outputs an AC power supply unit 492 (corresponding to a first output unit) that outputs the first current signal having the first frequency to the corresponding measurement site via the current electrodes 41 and 46, and the corresponding operation.
- a voltage detection unit 491 (corresponding to a first detection unit) for detecting a voltage signal representing a pulse wave from the measurement site of (1) through the detection electrodes 42 to 45.
- AC power supply unit 492 receives a voltage from battery 53 and applies a voltage having a first frequency to current electrodes 41 and 46 in accordance with control signal CT1 from CPU 100. Thereby, current is supplied to the measurement site.
- the voltage detection unit 491 detects a voltage signal from the measurement site via the detection electrodes 42 to 45 in accordance with the control signal CT1 from the CPU 100.
- the voltage detection unit 491 includes a filter unit 493 including a band-pass filter (BPF) having a filter characteristic (cutoff frequency or the like) corresponding to the first frequency, an S / N ratio of a detected voltage signal (signal-noise). and an A / D (analog-digital) converter 495 for converting a voltage signal into digital data.
- BPF band-pass filter
- a / D analog-digital converter 495 for converting a voltage signal into digital data.
- the voltage detection unit 491 outputs the detected S / N ratio R1 and the converted digital data to the CPU 100.
- the sensor unit 40A includes the electrodes 41A to 46A of the electrode group 40F described above, and a current detection and voltage detection unit 49A.
- the AC power supply 492A (corresponding to the second output part) outputs the second current signal having the second frequency to the corresponding measurement site via the current electrodes 41A and 46A, and the corresponding current And a voltage detection unit 491A (corresponding to a second detection unit) for detecting a voltage signal representing a pulse wave from the measurement site of (1) through the detection electrodes 42A to 45A.
- AC power supply unit 492A receives the voltage from battery 53 and applies a voltage having the second frequency to current electrodes 41A and 46A in accordance with control signal CT2 from CPU 100. Thereby, current is supplied to the measurement site.
- Voltage detection unit 491A detects a voltage signal from the measurement site via detection electrodes 42A to 45A in accordance with control signal CT2 from CPU 100.
- the voltage detection unit 491A includes a filter unit 493A including a BPF having a filter characteristic (cutoff frequency) corresponding to the second frequency, and an S / N ratio (signal-noise ratio) of a voltage signal to be detected. It includes an N ratio detector 494A, and an A / D converter 495A that converts a voltage signal into digital data.
- the voltage detection unit 491A outputs the detected S / N ratio R2 and the converted digital data to the CPU 100.
- AC power supply units 492 and 492A may be configured to include a booster circuit and a voltage adjustment circuit for receiving a voltage from battery 53 and generating a voltage signal of the first frequency and the second frequency.
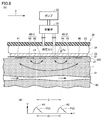
- FIG. 6 is a schematic view for explaining blood pressure measurement based on pulse wave propagation time according to the first embodiment.
- FIG. 6A shows a schematic cross section along the longitudinal direction of the wrist when blood pressure measurement based on pulse wave propagation time is performed in a state where the sphygmomanometer 1 is attached to the wrist 90.
- FIG. 6B shows the waveforms of pulse wave signals PS1 and PS2.
- FIG. 6 shows the sensor unit 40 positioned above the radial artery 91 at the measurement site, even if the sensor unit 40A is positioned above the ulnar artery 91A at the measurement site, FIG. Similar explanations are possible. Therefore, here, the description of blood pressure measurement based on pulse wave propagation time by the sensor unit 40A will be briefly described.
- the AC power supply unit 492 unit applies a predetermined voltage between the current electrode pair 41 and 46 to have a first frequency at the measurement site, for example, a high frequency constant current of 1 mA. flow i.
- the voltage detection unit 491 also detects the voltage signal v1 between the detection electrode pair 42, 43 constituting the first pulse wave sensor 40-1 and the detection electrode pair 44, 45 constituting the second pulse wave sensor 40-2. And the voltage signal v2 of the The voltage signals v1 and v2 are pulses of the blood flow of the radial artery 91 in portions of the palm side 90a of the left wrist 90, which are opposed to the first pulse wave sensor 40-1 and the second pulse wave sensor 40-2, respectively. Represents the change in electrical impedance due to waves.
- the voltage signals v1 and v2 are removed by the filter unit 493 from components other than the signal component corresponding to the first frequency.
- the S / N ratio detection unit 494 detects the S / N ratio of the voltage signal after passing through the filter.
- the A / D conversion unit 495 converts the voltage signals v1 and v2 after passing through the filter unit 493 from analog data to digital data, and outputs the converted data to the CPU 100 through the wiring 72.
- the CPU 100 performs predetermined signal processing on the input voltage signals v1 and v2 (digital data) to generate pulse wave signals PS1 and PS2 having a mountain-like waveform as shown in FIG. 6 (B). Generate
- the voltage signals v1 and v2 are, for example, about 1 mv. Moreover, each peak A1, A2 of pulse wave signal PS1, PS2 is about 1V, for example.
- PWV Pulse Wave Velocity
- the sensor unit 40A also has a second frequency at the measurement site by applying a predetermined voltage between the current electrode pair 41 and 46 with respect to the measurement site of the ulnar artery 91A, for example, the current having a second frequency A high frequency constant current i with a value of 1 mA is applied.
- the voltage detection unit 491A is provided between the voltage signal v1A between the detection electrode pair 42A, 43A constituting the first pulse wave sensor 40-1A and the detection electrode pair 44A, 45A constituting the second pulse wave sensor 40-2A.
- the voltage signal v2A of the The voltage signals v1A and v2A are pulses of the blood flow of the ulnar artery 91A in portions of the palm side 90a of the left wrist 90, which are opposed to the first pulse wave sensor 40-1A and the second pulse wave sensor 40-2A, respectively. Represents the change in electrical impedance due to waves.
- the filter unit 493A In the voltage detection unit 49A, components other than the signal component corresponding to the second frequency are removed from the voltage signals v1A and v2A by the filter unit 493A.
- the S / N ratio detection unit 494A detects the S / N ratio of the voltage signal after passing through the filter.
- the A / D conversion unit 495A converts the voltage signals v1 and v2 after passing through the filter unit 493A from analog data into digital data, and outputs the converted data to the CPU 100 through the wiring 72.
- the A / D conversion unit 495 and the A / D conversion unit 495A have, for example, 300 Hz as a sampling rate, it is not limited to this rate, and may be any sampling rate necessary to maintain the accuracy of PTT calculation. .
- the CPU 100 performs predetermined signal processing on the input voltage signals v1A and v2A (digital data) to generate pulse wave signals PS1A and PS2A.
- the interval D between the respective peaks A1 and A2 of the pulse wave signals PS1A and PS2A and the time difference ⁇ t are detected in the same manner as described above.
- the pressure cuff 24 is in a pressurized state, and the air inside the compression cuff 21 is discharged and is in a non-pressured state.
- the pressing cuff 24 and the solid 22 are disposed across the first pulse wave sensor 40-1, the second pulse wave sensor 40-2, and the current electrode pair 41, 46 with respect to the artery direction of the radial artery 91. Therefore, when the pressure cuff 24 is pressurized by the pump 32, the first pulse wave sensor 40-1, the second pulse wave sensor 40-2, and the current electrode pair 41, 46 are wrist-linked via the solid material 22.
- the palm side 90 a of 90 is pressed.
- the pressing force of each of the current electrode pairs 41 and 46, the first pulse wave sensor 40-1, and the second pulse wave sensor 40-2 on the palm side 90a of the wrist 90 can be set to an appropriate value.
- the pressure cuff 24 of the fluid bag is used as the pressing portion, the pump 32 and the valve 33 can be used in common with the compression cuff 21, and the configuration can be simplified.
- the first pulse wave sensor 40-1, the second pulse wave sensor 40-2, and the current electrode pair 41, 46 can be pressed through the solid 22, the pressing force on the measurement site becomes uniform, and the accuracy is high. Blood pressure measurement based on pulse wave transit time can be performed. Such a feature can be obtained similarly even in the case of measurement by the sensor unit 40A.
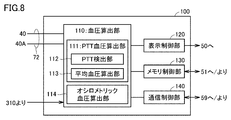
- FIG. 8 is a diagram schematically showing a configuration of functions related to measurement provided in the CPU 100 according to the first embodiment.
- CPU 100 calculates blood pressure by calculation (estimate) blood pressure calculation unit 110, display control unit 120 that controls display 50, writes data to memory 51, or reads data from memory 51.
- a communication control unit 140 that controls the communication unit 59.
- the blood pressure calculation unit 110 includes a PTT blood pressure calculation unit 111 corresponding to a blood pressure measurement function based on PTT, and an oscillometric blood pressure calculation unit 114 corresponding to a blood pressure measurement function according to the oscillometric method shown in FIG.
- the PTT blood pressure calculation unit 111 includes a PTT detection unit 112 and an average blood pressure calculation unit 113. Details of the functions of each unit will be described later.
- the blood pressure measurement function based on PTT by the PTT blood pressure calculation unit 111 will be described.
- the CPU 100 activates the PTT blood pressure calculation unit 111.
- the CPU 100 drives the switching valve 35 according to the instruction of the user, and switches the connection destination of the pump 32 and the valve 33 to the pressure cuffs 24 and 24A.
- the CPU 100 closes the valve 33 and drives the pump 32 through the pump drive circuit 320 to send air to the pressure cuffs 24 and 24A, thereby increasing the cuff pressure Pc which is the pressure in the pressure cuffs 24 and 24A at a constant speed.
- the PTT detection unit 112 of the CPU 100 outputs the first first pulse wave sensor 40-1 and the second second pulse wave sensor 40-2 of the sensor unit 40 in time series.
- the first and second pulse wave signals PS1 and PS2 are obtained, and the cross-correlation coefficient r between the waveforms of the first and second pulse wave signals PS1 and PS2 is calculated in real time.
- the time difference ⁇ t between the peaks A1 and A2 of the amplitudes of the first and second pulse wave signals PS1 and PS2 is calculated as PTT (pulse wave propagation time).
- the PTT detection unit 112 of the CPU 100 receives the first and second pulse wave signals PS1A and PS2A from the first pulse wave sensor 40-1A and the second pulse wave sensor 40-2A of the sensor unit 40A. And calculate the cross-correlation coefficient r between the waveforms of both pulse wave signals.
- the CPU 100 determines that the cross-correlation coefficient r calculated in real time in the pressurization process exceeds the threshold value Th, the first and second pulse wave signals PS1A and PS2A detected at the cuff pressure Pc at that time
- the time difference ⁇ t between the peaks of the amplitudes of the first and second pulse wave signals PS1A and PS2A is calculated as PTT (pulse wave propagation time).
- EBP blood pressure
- ⁇ and ⁇ are predetermined coefficients
- DT represents pulse wave propagation time, whereby the blood pressure EBP (hereinafter also referred to as blood pressure EBP-1) based on the PTT of the radial artery 91 and the ulnar artery 91A
- EBP-2 blood pressure based on PTT is measured
- the average blood pressure calculation unit 113 calculates the average of the blood pressure EBP-1 and the blood pressure EBP-2.
- the CPU 100 After the instruction to start measurement is instructed via the operation unit 52, the CPU 100 repeatedly executes the calculation of PTT and the calculation of the blood pressure EBP while the instruction to stop is not given. When an instruction to stop measurement is input via the operation unit 52, the CPU 100 controls each unit to end the measurement operation.
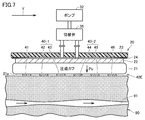
- FIG. 7 is a schematic cross-sectional view along the longitudinal direction of the wrist in a state where the sphygmomanometer 1 is attached to the wrist 90 when performing blood pressure measurement by the oscillometric method according to the first embodiment.
- the pressure cuff 24 is in a non-pressurized state by discharging the internal air, and the compression cuff 21 is in a pressurized state in which the air is supplied.
- the compression cuff 21 extends in the circumferential direction of the wrist 90, and when pressed by the pump 32, uniformly compresses the circumferential direction of the left wrist 90. Since only the electrode group 40E exists between the inner peripheral surface of the compression cuff 21 and the left wrist 90, the compression by the compression cuff 21 is not blocked by other members, and the blood vessel is sufficiently closed. be able to.
- the oscillometric blood pressure calculation unit 114 follows the output waveform from the first pressure sensor 31 through the oscillation circuit 310 detected in the pressurization process or decompression process of the compression cuff 21 to the measurement site. Calculate (estimate) blood pressure.
- the method of calculating blood pressure by the oscillometric method according to the present embodiment follows a known method, and therefore the description will not be repeated here.
- the display control unit 120 generates display data based on various types of information including the blood pressure calculated by the blood pressure calculation unit 110, and drives the display 50 according to the generated display data. Thereby, the display 50 displays information including the measured blood pressure. Further, the memory control unit 130 stores various information including the blood pressure calculated by the blood pressure calculation unit 110 in the memory 51. Thus, the memory 51 can store a history of information including the measured blood pressure. The memory control unit 130 reads various types of information including the blood pressure calculated by the blood pressure calculation unit 110 from the memory 51. The communication control unit 140 transmits various information including the blood pressure calculated by the blood pressure calculation unit 110 or read from the memory 51 to an external information processing apparatus via the communication unit 59, and the information processing apparatus Display on.
- the functions of the units in FIG. 8 are stored in the memory 51 as a program.
- the CPU 100 realizes the functions of the respective units by reading and executing a program from the memory 51.
- the function of each part is not limited to the method realized by the program.
- it may be realized by a circuit including an application specific integrated circuit (ASIC) or a field-programmable gate array (FPGA).
- ASIC application specific integrated circuit
- FPGA field-programmable gate array
- it may be realized by a combination of a program and a circuit.
- FIG. 9 is a flowchart showing a process of blood pressure measurement based on PTT according to the first embodiment.
- a program according to this flowchart is stored in the memory 51, read by the CPU 100, and executed.
- CPU 100 receives a start instruction when the user performs a switch operation to start blood pressure measurement of PTT at operation unit 52 in the wearing state (step S10).
- the CPU 100 controls the switching valve 35 so as to switch the connection destination of the pump 32 and the valve 33 to the pressure cuffs 24 and 24A (step S12).
- air is exhausted from the cuffs 24 and 24A.
- the CPU 100 drives the pump 32 to pressurize the pressure cuffs 24, 24A to a predetermined pressure, and then closes the valve 33 (step S14), and then stops the pump 32 (step SS16).
- the CPU 100 outputs a current signal to the measurement site and outputs control signals CT1 and CT2 to the sensor units 40 and 40A so as to detect a voltage signal indicating a pulse wave (step S18).
- the sensor unit 40 outputs digital data of the voltage signal (pulse wave signal) detected from the measurement site of the radial artery 91, and detects the S / N ratio R1 of the component of the first frequency in the voltage signal. Output (step S22).
- the sensor unit 40A outputs digital data of the voltage signal (pulse wave signal) detected from the measurement site of the ulnar artery 91A, and detects the S / N ratio R2 of the component of the second frequency in the voltage signal And output to the CPU 100 (step S22).
- the PTT detection unit 112 calculates PTT in accordance with the pulse wave signals from the sensor units 40 and 40A (step S24).
- the PTT blood pressure calculation unit 111 calculates blood pressure EBP-1 based on PTT corresponding to the sensor unit 40, and calculates blood pressure EBP-2 based on PTT corresponding to the sensor unit 40A (step S26).
- the CPU 100 outputs blood pressure information based on the calculated blood pressures EBP-1 and EBP-2 (step S28).
- the display control unit 120 controls the display 50 to display information on the blood pressure.
- the memory control unit 130 stores the information on the blood pressure in the memory 51.
- the communication control unit 140 transmits the information on the blood pressure to an external information processing apparatus via the communication unit 59.
- FIG. 10 is a diagram showing an example of storage of measurement results according to the first embodiment.
- the memory 51 stores a table 394 for recording the measurement results of the sphygmomanometer 1.
- table 394 stores measurement result data in record units.
- Each record is data 39E of ID (identification) for uniquely identifying the record, data 39G of measurement date and time, blood pressure value calculated (estimated) by oscillometric blood pressure calculation unit 114 (systolic blood pressure SBP and diastole Data 39H including blood pressure DBP) and pulse rate PLS, S / N ratio data 39I, and data 39J indicating blood pressure calculated (estimated) by PTT blood pressure calculation unit 111 are associated and included.
- the S / N ratio data 39I includes the S / N ratio R1 detected for the associated blood pressure EBP-1 and the S / N ratio R2 detected for the associated blood pressure EBP-2.
- Data 39J includes blood pressure EBP-1 and blood pressure EBP-2 calculated (estimated) at the time of measurement of PTT blood pressure.
- the data 39J may further include the representative blood pressure EBP-R.
- Representative blood pressure EBP-R indicates blood pressure that is representative of corresponding blood pressure EBP-1 and blood pressure EBP-2.
- the memory control unit 130 associates blood pressure and pulse rate data 39H according to the oscillometric method measured at the relevant date and time, and blood pressure value data 39J based on PTT, in association with the measurement date and time data 39G Store.
- the manner of storing measurement data in the table 394 is not limited to the record unit as shown in FIG. Any mode may be used as long as the detected data 39E to 39J are associated (linked) each time the blood pressure is measured.
- the representative blood pressure EBP-R indicates the average blood pressure calculated from the corresponding blood pressure EBP-1 and blood pressure EBP-2 by the average blood pressure calculation unit 113, but the representative blood pressure EBP-R is the average blood pressure It is not limited to.
- the CPU 100 may determine one of the blood pressure EBP-1 and the blood pressure EBP-2 which satisfies the predetermined condition as the representative blood pressure EBP-R.
- a predetermined condition for example, the larger (or smaller) one of the blood pressure EBP-1 and the blood pressure EBP-2 is determined as the representative blood pressure EBP-R.
- one of blood pressure EBP-1 and blood pressure EBP-2 which exceeds the threshold (or which is lower than the threshold) is determined as the representative blood pressure EBP-R.
- the higher one of the blood pressure EBP-1 and the blood pressure EBP-2 (the smaller the noise) is determined as the representative blood pressure EBP-R.
- one of blood pressure EBP-1 and blood pressure EBP-2 that has a corresponding S / N ratio larger (higher) than a predetermined threshold value is determined as a representative blood pressure EBP-R.
- the average blood pressure calculation unit 113 has a function of weighted average calculation of calculating an average by weighting each of the blood pressure EBP-1 and the blood pressure EBP-2.
- the weight of blood pressure EBP-1 is based on the value of the corresponding S / N ratio R1
- the weight of blood pressure EBP-2 is based on the corresponding S / N ratio R2.
- the average blood pressure calculation unit 113 sets the weight to be larger as the corresponding S / N ratio is higher (that is, as the noise is smaller). Therefore, the representative blood pressure EBP-R calculated by the weighted average can represent a value close to the blood pressure of the one having a higher S / N ratio among the blood pressure EBP-1 and the blood pressure EBP-2.
- FIG. 11 is a diagram showing a display example of measurement results according to the first embodiment.
- the screen of display 50 includes systolic blood pressure SBP, diastolic blood pressure DBP and pulse rate PLS, representative blood pressure EBP-R, reliability 40B, and measurement date based on the oscillometric method. It is based on the value of S / N ratio corresponding to blood pressure EBP-1 based on representative blood pressure EBP-R and blood pressure EBP-2.
- the reliability 40B includes the reliability (or authenticity) of the value of the representative blood pressure EBP-R being displayed.
- the reliability 40B is based on the blood pressure EBP-1 based on the representative blood pressure EBP-R displayed on the same screen, the S / N ratio R1 corresponding to the blood pressure EBP-2, and the S / N ratio R2.
- Can. when the CPU 100 determines that the S / N ratio R1 and the S / N ratio R2 are larger (higher) values than the threshold, the CPU 100 determines that the reliability is high, and the reliability 40B is “GOOD”. It displays with the character of (refer to FIG. 11).
- the CPU 100 determines that at least one of the S / N ratio R1 and the S / N ratio R2 is equal to or less than the threshold, the CPU 100 determines that the reliability is low, and the character of "NG" To display the reliability 40B.
- the output aspect of reliability is not limited to such a character.
- the display of an image (pattern), the color of the value of the representative blood pressure EBP-R, or the like may be used.
- the user can also obtain an indication as to whether the displayed blood pressure EBP-R is a reliable value from the reliability 40B.
- the display example of FIG. 11 corresponds to, for example, a display example when the blood pressure measurement ends (step S28) or a display example of data read from the table 394 of FIG.
- the information in FIG. 11 is displayed by the display control unit 120 controlling the display 50.
- the display control unit 120 calculates the representative blood pressure EBP-R based on the blood pressure EBP-1 and EBP-2 calculated by the PTT blood pressure calculation unit 111, the blood pressure value calculated by the oscillometric blood pressure calculation unit 114, Display data is generated based on the reliability 40B, and the display 50 is driven based on the display data.
- the display control unit 120 generates display data based on the associated data 39H and data 39J and the reliability 40B of the table 394 in FIG. 10, and drives the display 50 based on the generated display data.
- the display control unit 120 can display the measured blood pressure data or the blood pressure data stored in the table 394 on the display 50.
- FIG. 12 is a diagram showing a schematic configuration of a system according to the first embodiment.
- the sphygmomanometer 1 described above communicates with the server 30 or the portable terminal 10 B, which is an external information processing device, via the network 900.
- the sphygmomanometer 1 communicates with the portable terminal 10B via the LAN, and the portable terminal 10B communicates with the server 30 via the Internet.
- the sphygmomanometer 1 can communicate with the server 30 via the portable terminal 10B.
- the sphygmomanometer 1 may communicate with the server 30 without passing through the portable terminal 10B.
- the CPU 100 may transmit the information to the portable terminal 10B and cause the display unit 158 to display the information.
- the storage destination of the measurement results shown in the table 394 of FIG. 10 is not limited to the memory 51 of the sphygmomanometer 1.
- the storage unit of the portable terminal 10B or the storage unit 32A of the server 30 may be used.
- it may be stored in two or more of the memory 51, the storage unit of the portable terminal 10B, and the storage unit 32A of the server 30.
- FIG. 13 is a diagram for explaining the background of the first embodiment.
- FIG. 14 is a diagram showing the configuration of the first embodiment.
- a voltage signal (pulse wave signal) having a high S / N ratio depending on individual differences or the mounting mode of the sphygmomanometer 1 Since there are variations in the part that can detect), a part that can detect a voltage signal (pulse wave signal) with a high S / N ratio among multiple measurement parts is determined, and the pulse wave signal is determined from the determined part. It is desirable to detect.
- electrodes are disposed with both the radial artery 91 and the ulnar artery 91 A as measurement sites, and different frequencies (first frequency or second frequency) for each measurement site.
- a current of frequency is output, and a voltage signal representing a pulse wave detected from each measurement site is processed based on filter characteristics corresponding to the corresponding frequency.
- the first embodiment by selecting the higher pulse wave signal having the above-described S / N ratio, it is possible to obtain pulse wave information with high accuracy and the representative blood pressure EBP-R.
- the first frequency exhibits a value different from the second frequency.
- the first frequency is one of 50 kHz and 60 kHz
- the second frequency is the other.
- the values of the first frequency and the second frequency are not limited to these.
- the sensor unit 40 corresponding to the first pulse wave sensor unit and the sensor unit 40A corresponding to the second pulse wave sensor unit are not simultaneously driven, but are predetermined. It is driven alternately at specified intervals.
- the sphygmomanometer 1 according to the second embodiment includes a CPU 100A that realizes a function different from that of the CPU 100 according to the first embodiment.
- the configuration of sphygmomanometer 1 according to the second embodiment is the same as the configuration shown in FIG. 1, and therefore description will not be repeated.
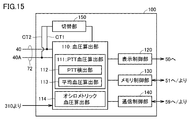
- FIG. 15 is a diagram schematically showing a configuration of functions related to measurement provided in the CPU 100A according to the second embodiment.
- CPU 100A includes switching unit 150 in addition to the configuration of CPU 100 shown in FIG.
- the other functions of CPU 100A are the same as those shown in FIG. 8, and therefore the description will not be repeated.
- the switching unit 150 outputs the control signal CT1 to the sensor unit 40, and outputs the control signal CT2 to the sensor unit 40A.
- the switching unit 150 alternately outputs the control signal CT1 and the control signal CT2 at a predetermined cycle (interval) CR.
- the sensor unit 40 is driven in a period in which the control signal CT1 is output from the switching unit 150, and stops in a period in which the control signal CT1 is not output.
- the sensor unit 40A is driven during the period when the control signal CT2 is output from the switching unit 150, and stops during the period when the control signal CT2 is not output.
- the sensor unit 40 and the sensor unit 40A operate in the same manner as in the first embodiment during the driving periods.
- the 2nd frequency which the 2nd current signal which the 2nd current signal which outputs to a part (part corresponding to radial artery 91) has is the same frequency, for example, shows 50 kHz, it is not limited to this. Therefore, the filter unit 493 and the filter unit 493A also have frequency characteristics (cutoff frequency) according to 50 kHz.
- the frequency of the output current is sufficiently large.
- CR is determined to have a period corresponding to several hundreds to several kHz. It is desirable to determine this period based on the frequency and sampling rate of the current output to the measurement site.
- FIG. 16 is a diagram schematically showing a cycle CR according to the second embodiment.
- the switching unit 150 outputs the control signal CT1 and the control signal CT2 alternately according to the cycle CR.
- the sensor unit 40 and the sensor unit 40A are alternately driven every half cycle CR1.
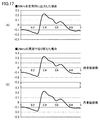
- FIG. 17 is a diagram schematically showing the waveform of the current signal output to the measurement site according to the second embodiment.
- the switching unit 150 alternately controls the control signal CT1 and the control signal CT2 in a cycle CR according to 25 kHz.
- Embodiment 2 As described above, when PTT is calculated based on impedance, the voltage signal (pulse wave signal) having a high S / N ratio can be detected depending on the individual difference or the mounting mode of the sphygmomanometer 1. Among the measurement sites, it is desirable to determine a site where a voltage signal (pulse wave signal) having a high S / N ratio can be detected, and to detect a pulse wave signal from the determined site.
- switching unit 150 sets a predetermined interval (interval according to period CR) to each measurement site corresponding to radial artery 91 and ulnar artery 91A. Then, current signals of the same frequency are alternately output, and pulse wave information including PTT is acquired from voltage signals representing pulse waves detected from each measurement site.
- a current signal is output to each measurement site, as shown in FIG. 13 (A) or 13 (B)
- no current signal is output to the other measurement site, as shown in FIG. 13 (C). It is possible to prevent the occurrence of the interference shown.
- the pulse wave information with high accuracy and the representative blood pressure EBP-R are acquired by selecting the higher pulse wave signal of the S / N ratio. You can also.
- the display of the measurement result on the display 50, the storage in the memory 51, and the transmission to an external information processing apparatus are also performed.
- the first frequency and the second frequency are the same frequency, but may be different.
- the first frequency is one of 50 kHz and 60 kHz
- the second frequency is the other.
- the sphygmomanometer 1 has a first mode and a second mode which are selectively activated as a mode for measuring pulse wave information.
- the sensor unit 40 outputs the first current signal having the first frequency to the measurement site corresponding to the radial artery 91, and sets the voltage signal representing the pulse wave signal detected from the measurement site to the first frequency. Process based on the corresponding filter characteristics.
- the sensor unit 40A outputs the second current signal having the second frequency to the measurement site corresponding to the ulnar artery 91A, and detects the pulse from the measurement site.
- a voltage signal representative of the wave signal is processed based on the filter characteristics corresponding to the second frequency.
- the switching unit 150 stops.
- the first pulse wave sensor unit and the second pulse wave sensor unit are alternately driven by the switching unit 150 at predetermined intervals.
- the sphygmomanometer 1 can acquire pulse wave information including PTT which is not affected by the interference described above.
- the user can instruct the CPU 100 which of the mode 1 and the mode 2 is to be activated.
- FIG. 18 is a flowchart showing a control method of the sphygmomanometer 1 according to the fourth embodiment.
- FIG. 19 is a flowchart showing another control method of the sphygmomanometer 1 according to the fourth embodiment.
- step S18 of FIG. 9 in the case of the first embodiment, the process according to the flowchart of FIG. 18 is executed, and in the case of the second embodiment, the process according to the flowchart of FIG.
- step S18 CPU 100 controls sensor units 40 and 40A as follows.
- the AC power supply unit 492 of the first pulse wave sensor unit (sensor unit 40) is controlled to output the first current signal having the first frequency to the corresponding measurement site (measurement site corresponding to the radial artery 91).
- the first output step (step S31) and the voltage detection unit 491 of the first pulse wave sensor unit represent pulse waves from the measurement site corresponding to the first pulse wave sensor section (measurement site corresponding to the radial artery 91).
- the second output step (step S33) for controlling output to the measurement site corresponding to the ulnar artery 91A, and the voltage detection unit 491A of the second pulse wave sensor unit, the measurement corresponding to the second pulse wave sensor unit Part (ulnar) for controlling to detect a voltage signal representing a pulse wave from the measurement site corresponding to the pulse 91A, and a voltage signal representing the pulse wave detected in the first detection step (step S32) Are processed using the filter unit 493 based on the filter characteristics corresponding to the first frequency (step S35), and the voltage signal representing the pulse wave detected in the second detection step is
- CPU 100 controls sensor units 40 and 40A in the following manner in step S18.
- step S41 controlling the switching unit 150 to drive the first pulse wave sensor unit (sensor unit 40) and the second pulse wave sensor unit (sensor unit 40A) alternately at predetermined intervals (step S41)
- step S42 controlling the AC power supply unit 492 of the first pulse wave sensor unit to output the first current signal having the first frequency to the corresponding measurement site (measurement site corresponding to the radial artery 91) S42), a first detection step (step S43) in which the first pulse wave sensor unit also controls the voltage detection unit 491 to detect a voltage signal representing a pulse wave from the corresponding measurement site, and a second pulse wave sensor unit
- step S44 for controlling the second AC power supply 492A to output the second current signal having the second frequency to the corresponding measurement site (the measurement site corresponding to the ulnar artery 91A); wave
- An AC power supply section 492A of the capacitors unit performs a second detection step of
- the program is non-transitory computer readable such as a compact disk read only memory (CD) attached to the computer of the sphygmomanometer 1, secondary storage device, main storage device and memory card. It can also be provided by recording on a special recording medium. Alternatively, the program can be provided by being recorded in a recording medium such as a hard disk built in the computer. Alternatively, the program can be provided by downloading via the network 900.
- CD compact disk read only memory
- SYMBOLS 1 Sphygmomanometer, 10 main body, 10B portable terminal, 30 server, 40, 40A sensor part, 40B reliability, 40E, 40F electrode group, 491, 491A voltage detection part, 50 display, 51 memory, 52 operation part, 53 battery , 59 communication unit, 71, 72 wiring, 90 wrist, 91 radial artery, 91 A ulnar artery, 110 blood pressure calculation unit, 111 PTT blood pressure calculation unit, 112 PTT detection unit, 113 mean blood pressure calculation unit, 114 oscillometric blood pressure calculation unit, Reference Signs List 120 display control unit 130 memory control unit 140 communication control unit 150 switching unit 158 display unit 310 340 oscillation circuit 394 table 492 492 A AC power supply unit 493 493 A filter unit 494 494 A S / N detection unit, 495, 495A A / D converter, 900 network, A1, A2 peak, CR cycle, CR1 half cycle, CT1, CT2 control signal, D interval, DBP diasto
Landscapes
- Health & Medical Sciences (AREA)
- Life Sciences & Earth Sciences (AREA)
- Engineering & Computer Science (AREA)
- Physics & Mathematics (AREA)
- Public Health (AREA)
- General Health & Medical Sciences (AREA)
- Animal Behavior & Ethology (AREA)
- Surgery (AREA)
- Veterinary Medicine (AREA)
- Molecular Biology (AREA)
- Biophysics (AREA)
- Pathology (AREA)
- Biomedical Technology (AREA)
- Heart & Thoracic Surgery (AREA)
- Medical Informatics (AREA)
- Cardiology (AREA)
- Physiology (AREA)
- Vascular Medicine (AREA)
- Signal Processing (AREA)
- Psychiatry (AREA)
- Computer Vision & Pattern Recognition (AREA)
- Artificial Intelligence (AREA)
- Power Engineering (AREA)
- Ophthalmology & Optometry (AREA)
- Computer Networks & Wireless Communication (AREA)
- Nuclear Medicine, Radiotherapy & Molecular Imaging (AREA)
- Radiology & Medical Imaging (AREA)
- Measuring Pulse, Heart Rate, Blood Pressure Or Blood Flow (AREA)
Priority Applications (3)
| Application Number | Priority Date | Filing Date | Title |
|---|---|---|---|
| DE112018006494.8T DE112018006494T5 (de) | 2017-12-21 | 2018-11-30 | Messgerät und Programm |
| CN201880082820.6A CN111542261A (zh) | 2017-12-21 | 2018-11-30 | 测量装置和程序 |
| US16/899,450 US20200345245A1 (en) | 2017-12-21 | 2020-06-11 | Measurement apparatus and computer-readable recording medium |
Applications Claiming Priority (2)
| Application Number | Priority Date | Filing Date | Title |
|---|---|---|---|
| JP2017245311A JP2019110987A (ja) | 2017-12-21 | 2017-12-21 | 測定装置およびプログラム |
| JP2017-245311 | 2017-12-21 |
Related Child Applications (1)
| Application Number | Title | Priority Date | Filing Date |
|---|---|---|---|
| US16/899,450 Continuation US20200345245A1 (en) | 2017-12-21 | 2020-06-11 | Measurement apparatus and computer-readable recording medium |
Publications (1)
| Publication Number | Publication Date |
|---|---|
| WO2019124025A1 true WO2019124025A1 (ja) | 2019-06-27 |
Family
ID=66994130
Family Applications (1)
| Application Number | Title | Priority Date | Filing Date |
|---|---|---|---|
| PCT/JP2018/044217 Ceased WO2019124025A1 (ja) | 2017-12-21 | 2018-11-30 | 測定装置およびプログラム |
Country Status (5)
| Country | Link |
|---|---|
| US (1) | US20200345245A1 (https=) |
| JP (1) | JP2019110987A (https=) |
| CN (1) | CN111542261A (https=) |
| DE (1) | DE112018006494T5 (https=) |
| WO (1) | WO2019124025A1 (https=) |
Families Citing this family (5)
| Publication number | Priority date | Publication date | Assignee | Title |
|---|---|---|---|---|
| WO2018102427A1 (en) | 2016-11-29 | 2018-06-07 | Boston Biomedical, Inc. | Naphthofuran derivatives, preparation, and methods of use thereof |
| WO2018213424A1 (en) | 2017-05-17 | 2018-11-22 | Boston Biomedical, Inc. | Methods for treating cancer |
| CN114302674B (zh) * | 2019-09-06 | 2024-07-09 | 夏普株式会社 | 测量装置及测量方法 |
| JP7540263B2 (ja) | 2020-09-24 | 2024-08-27 | カシオ計算機株式会社 | 電子機器、方法およびプログラム |
| CN112587114A (zh) * | 2020-12-25 | 2021-04-02 | 苏州益舒缘科技有限公司 | 一种心率检测手环及其检测方法 |
Citations (9)
| Publication number | Priority date | Publication date | Assignee | Title |
|---|---|---|---|---|
| JPH04250135A (ja) * | 1990-07-18 | 1992-09-07 | Rudolf A Hatschek | 血圧測定装置 |
| JP2003169779A (ja) * | 2001-12-06 | 2003-06-17 | Fukuda Denshi Co Ltd | 脈波伝播速度測定装置 |
| WO2008065873A1 (en) * | 2006-12-01 | 2008-06-05 | Omron Healthcare Co., Ltd. | Sphygmometric electrode unit, and sphygmometer |
| US8197416B1 (en) * | 2005-08-19 | 2012-06-12 | Ravi Shankar | Pulsatile measurement of cardiac malfunction conditions |
| JP2016000088A (ja) * | 2014-06-11 | 2016-01-07 | フクダ電子株式会社 | 脈波伝播時間計測用具及び脈波伝播時間計測装置 |
| US20160374618A1 (en) * | 2015-06-23 | 2016-12-29 | PhysioWave, Inc. | Determining physiological parameters using movement detection |
| US20170065185A1 (en) * | 2015-04-30 | 2017-03-09 | Withings | Weighing Scale with Extended Functions |
| JP2017070739A (ja) * | 2015-10-06 | 2017-04-13 | 三星電子株式会社Samsung Electronics Co.,Ltd. | 生体情報測定装置及び方法並びにウェアラブルデバイス |
| US20180078148A1 (en) * | 2016-09-22 | 2018-03-22 | Microsoft Technology Licensing, Llc | Bioimpedance based pulse waveform sensing |
Family Cites Families (7)
| Publication number | Priority date | Publication date | Assignee | Title |
|---|---|---|---|---|
| JP2009542294A (ja) * | 2006-07-05 | 2009-12-03 | コーニンクレッカ フィリップス エレクトロニクス エヌ ヴィ | 装着型モニタリングシステム |
| CN103648374B (zh) * | 2011-02-17 | 2016-08-17 | 高通股份有限公司 | 用于确定哺乳动物心血管分量的方法和系统 |
| EP2816950A4 (en) * | 2012-02-22 | 2015-10-28 | Aclaris Medical Llc | DEVICE AND SYSTEM FOR DETECTING PHYSIOLOGICAL SIGNALS |
| EP3294128B1 (en) * | 2015-05-11 | 2022-06-29 | Samsung Electronics Co., Ltd. | Biosensor electrode structure and biosensor including the same |
| US10213117B2 (en) * | 2016-02-18 | 2019-02-26 | Qualcomm Incorporated | Blood pressure estimation based on pulse wave velocity |
| DE102016004462A1 (de) * | 2016-04-06 | 2017-10-12 | Fachhochschule Lübeck | Messverfahren und Messvorrichtung zur nicht-invasiven Messung der aortalen Pulswellengeschwindigkeit einer Messperson |
| EP3518753B1 (en) * | 2016-09-27 | 2025-08-27 | Itamar Medical Spry 2021, Limited Partnership | Systems and methods for biological metrics measurement |
-
2017
- 2017-12-21 JP JP2017245311A patent/JP2019110987A/ja active Pending
-
2018
- 2018-11-30 DE DE112018006494.8T patent/DE112018006494T5/de not_active Withdrawn
- 2018-11-30 WO PCT/JP2018/044217 patent/WO2019124025A1/ja not_active Ceased
- 2018-11-30 CN CN201880082820.6A patent/CN111542261A/zh active Pending
-
2020
- 2020-06-11 US US16/899,450 patent/US20200345245A1/en not_active Abandoned
Patent Citations (9)
| Publication number | Priority date | Publication date | Assignee | Title |
|---|---|---|---|---|
| JPH04250135A (ja) * | 1990-07-18 | 1992-09-07 | Rudolf A Hatschek | 血圧測定装置 |
| JP2003169779A (ja) * | 2001-12-06 | 2003-06-17 | Fukuda Denshi Co Ltd | 脈波伝播速度測定装置 |
| US8197416B1 (en) * | 2005-08-19 | 2012-06-12 | Ravi Shankar | Pulsatile measurement of cardiac malfunction conditions |
| WO2008065873A1 (en) * | 2006-12-01 | 2008-06-05 | Omron Healthcare Co., Ltd. | Sphygmometric electrode unit, and sphygmometer |
| JP2016000088A (ja) * | 2014-06-11 | 2016-01-07 | フクダ電子株式会社 | 脈波伝播時間計測用具及び脈波伝播時間計測装置 |
| US20170065185A1 (en) * | 2015-04-30 | 2017-03-09 | Withings | Weighing Scale with Extended Functions |
| US20160374618A1 (en) * | 2015-06-23 | 2016-12-29 | PhysioWave, Inc. | Determining physiological parameters using movement detection |
| JP2017070739A (ja) * | 2015-10-06 | 2017-04-13 | 三星電子株式会社Samsung Electronics Co.,Ltd. | 生体情報測定装置及び方法並びにウェアラブルデバイス |
| US20180078148A1 (en) * | 2016-09-22 | 2018-03-22 | Microsoft Technology Licensing, Llc | Bioimpedance based pulse waveform sensing |
Also Published As
| Publication number | Publication date |
|---|---|
| JP2019110987A (ja) | 2019-07-11 |
| DE112018006494T5 (de) | 2020-10-22 |
| CN111542261A (zh) | 2020-08-14 |
| US20200345245A1 (en) | 2020-11-05 |
Similar Documents
| Publication | Publication Date | Title |
|---|---|---|
| WO2019124025A1 (ja) | 測定装置およびプログラム | |
| JP6991022B2 (ja) | 表示制御装置およびプログラム | |
| US20190307336A1 (en) | Pulse wave measurement device, pulse wave measurement method, and blood pressure measurement device | |
| WO2018123284A1 (ja) | 脈波測定装置および脈波測定方法、並びに血圧測定装置 | |
| US11589757B2 (en) | Blood pressure estimation device | |
| JP6777535B2 (ja) | 血圧計および血圧測定方法並びに機器 | |
| JP6741570B2 (ja) | 脈波測定装置および脈波測定方法、並びに血圧測定装置 | |
| US20190307340A1 (en) | Blood pressure measurement device and blood pressure measurement method | |
| JP6965066B2 (ja) | 脈波測定装置、血圧測定装置、機器、脈波測定方法、および血圧測定方法 | |
| US11495350B2 (en) | Information processing apparatus, information processing method, and non-transitory computer-readable storage medium information processing program | |
| CN110891480B (zh) | 测定装置和测定方法 | |
| JP7023751B2 (ja) | 生体情報測定装置 | |
| JP6970605B2 (ja) | 血圧推定装置 | |
| JP7102176B2 (ja) | 生体情報測定装置 | |
| JP6841174B2 (ja) | 脈波測定装置 |
Legal Events
| Date | Code | Title | Description |
|---|---|---|---|
| 121 | Ep: the epo has been informed by wipo that ep was designated in this application |
Ref document number: 18892387 Country of ref document: EP Kind code of ref document: A1 |
|
| 122 | Ep: pct application non-entry in european phase |
Ref document number: 18892387 Country of ref document: EP Kind code of ref document: A1 |