WO2019044244A1 - 作物栽培支援装置 - Google Patents
作物栽培支援装置 Download PDFInfo
- Publication number
- WO2019044244A1 WO2019044244A1 PCT/JP2018/027072 JP2018027072W WO2019044244A1 WO 2019044244 A1 WO2019044244 A1 WO 2019044244A1 JP 2018027072 W JP2018027072 W JP 2018027072W WO 2019044244 A1 WO2019044244 A1 WO 2019044244A1
- Authority
- WO
- WIPO (PCT)
- Prior art keywords
- cultivation
- image
- unit
- crop
- field
- Prior art date
- Legal status (The legal status is an assumption and is not a legal conclusion. Google has not performed a legal analysis and makes no representation as to the accuracy of the status listed.)
- Ceased
Links
Images




Classifications
-
- A—HUMAN NECESSITIES
- A01—AGRICULTURE; FORESTRY; ANIMAL HUSBANDRY; HUNTING; TRAPPING; FISHING
- A01G—HORTICULTURE; CULTIVATION OF VEGETABLES, FLOWERS, RICE, FRUIT, VINES, HOPS OR SEAWEED; FORESTRY; WATERING
- A01G7/00—Botany in general
-
- G—PHYSICS
- G06—COMPUTING OR CALCULATING; COUNTING
- G06Q—INFORMATION AND COMMUNICATION TECHNOLOGY [ICT] SPECIALLY ADAPTED FOR ADMINISTRATIVE, COMMERCIAL, FINANCIAL, MANAGERIAL OR SUPERVISORY PURPOSES; SYSTEMS OR METHODS SPECIALLY ADAPTED FOR ADMINISTRATIVE, COMMERCIAL, FINANCIAL, MANAGERIAL OR SUPERVISORY PURPOSES, NOT OTHERWISE PROVIDED FOR
- G06Q50/00—Information and communication technology [ICT] specially adapted for implementation of business processes of specific business sectors, e.g. utilities or tourism
- G06Q50/02—Agriculture; Fishing; Forestry; Mining
Definitions
- the present invention relates to a crop cultivation support device that supports crop cultivation.
- a conventional crop cultivation support device is disclosed in Patent Document 1.
- the crop cultivation support device includes a database, a growth curve generation unit, a key time extraction unit, a high-dimensional analysis model generation unit, a trend prediction unit, and a display unit.
- the database stores satellite data from satellite images of time series of multiple cycles of plant growth of crops and meteorological data including temperature of time series.
- the growth curve generation unit calculates the vegetation index of the plant for each field and each season and the effective integrated temperature from a predetermined reference time based on the satellite data and the meteorological data read from the database, and the vegetation index vs. effective integrated temperature Multiple vegetation growth curves are created for the target crops of past multiple cycles for each field.
- the key time extraction unit extracts a vegetation index (NDVI) with respect to a predetermined key time representing a growth important period specific to vegetation, from the created vegetation growth curve.
- the high-dimensional analysis model generation unit plots the high-dimensional analysis model in which the vegetation index of each key time per vegetation growth curve is plotted on the high-dimensional vegetation analysis coordinates with the vegetation index of multiple key times as each axis Produce multiple crops for multiple cycles of target crops.
- the trend prediction unit is based on a plurality of high-dimensional analysis models of field crops to be predicted, and predicts unacquired key times according to the acquired key time vegetation index in the vegetation growth curve of the predicted year and prediction cycle. Determine the index. By this, the trend prediction unit predicts the vegetation growth curve after the acquisition of the target crop. Thereby, the crop cultivation support apparatus can perform the growth situation and yield prediction of the crop of a predetermined field.
- the growth status of crops may differ depending on fields, farmers, regions, etc. even for crops of the same variety.
- rice in a field where rice is grown with a lower amount of fertilizer than normal grows slower than rice in a field where rice is grown with normal amount of fertilizer.
- it is possible to predict the growth status of crops in each field even if It is difficult to determine whether or not the situation is present (the presence or absence of an abnormal part). In other words, it is difficult to make an absolute judgment on the field conditions. Therefore, the user can not accurately determine the condition of the field, and there is a problem that the usability of the crop cultivation support device is reduced.
- An object of this invention is to provide the crop cultivation assistance apparatus which can improve usability.
- a crop cultivation support device includes a cultivation information output unit that outputs predetermined cultivation information on a crop for each of a plurality of cultivation areas for cultivating a crop, and the cultivation information.
- a comparison unit that compares a predetermined standard range based on the correlation of a plurality of parameters with the cultivation information for each cultivation area, and whether or not the cultivation information is within the standard range based on the comparison result of the comparison unit And a display unit for displaying the cultivation regions separately.
- the crop cultivation support device outputs a cultivation information output unit that outputs predetermined cultivation information on the crop for each of a plurality of cultivation regions for cultivating the crop, and a predetermined standard range based on the correlation of the plurality of parameters including the cultivation information. And a display unit for displaying, on a cultivation area basis, whether or not the cultivation information is within a standard range based on the comparison result of the comparison unit.
- FIG. 1 is a view showing a schematic configuration of a crop cultivation support apparatus of the first embodiment.
- the crop cultivation support device 1 includes the imaging unit 2 and the information terminal 3 and supports the cultivation of the crop PL in the field FD (cultivation region).
- the field FD is, for example, a substantially rectangular shape in plan view, provided with ridges on four sides, and indicates a paddy field or a field surrounded by the ridges.
- the imaging unit 2 is configured of, for example, a multispectral camera, and is attached to the aircraft 4.
- the imaging unit 2 includes a visible imaging unit 20 (see FIG. 2) and a near infrared imaging unit 21 (see FIG. 2).
- the visible imaging unit 20 and the near-infrared imaging unit 21 are disposed at predetermined intervals in a plane parallel to the field FD.
- the visible imaging unit 20 forms an image of visible light (visible image).
- the visible imaging unit 20 includes a first band pass filter, a first imaging optical system, a first image sensor (optical sensor), a first digital signal processor, and the like (all not shown).
- the first band pass filter transmits light in a relatively narrow band whose center wavelength is, for example, 650 nm.
- the first imaging optical system forms an optical image of the visible light of the measuring object transmitted through the first band pass filter on a predetermined first imaging surface.
- the first image sensor is disposed with the light receiving surface aligned with the first imaging surface, detects a relatively narrow band light having a central wavelength of 650 nm included in the sunlight reflected by the field FD, and An optical image of visible light is converted into an electrical signal.
- the first digital signal processor performs image processing on the output of the first image sensor to form a visible image.
- the near infrared imaging unit 21 forms an image (near infrared image) of near infrared light.
- the near-infrared imaging unit 20 includes a second band pass filter, a second imaging optical system, a second image sensor (optical sensor), and a second digital signal processor (all not shown).
- the second band pass filter transmits light in a relatively narrow band whose center wavelength is a predetermined wavelength of 750 nm or more (for example, a wavelength of 800 nm).
- the second imaging optical system forms an optical image of the near-infrared light of the measuring object transmitted through the second band pass filter on a predetermined second imaging surface.
- the second image sensor is disposed with the light receiving surface aligned with the second imaging surface, detects relatively narrow band light having a central wavelength of 800 nm contained in sunlight reflected by the field FD, and An optical image of near infrared light is converted into an electrical signal.
- the second digital signal processor performs image processing on the output of the second image sensor to form a near infrared image.
- an image sensor of VGA type 640 pixels ⁇ 480 pixels
- the imaging unit 2 may be configured by the visible imaging unit 20 without the near infrared imaging unit 21.
- the visible imaging unit 20 includes a first imaging optical system, a first image sensor, and R / G / B / Ir or W / Y / R / Ir disposed on the first image sensor.
- the “R”, “G”, and “B” are filters that mainly transmit red light, green light, and blue light, respectively.
- the above “Ir” is a filter that mainly transmits near infrared light.
- the “W” is a filter that mainly transmits white light
- the “Y” is a filter that mainly transmits yellow light.
- the flying object 4 is constituted by an autonomously flying unmanned aerial vehicle (drone), and flies over the field FD.
- the flying object 4 has a housing 41 provided with a plurality of (for example, eight) horizontal rotary wings 42.
- the imaging unit 2 is disposed in a housing 25 attached to the lower surface of the housing 41.
- the housing 25 is configured to be movable in the direction in which the lower surface having the opening (not shown) is directed vertically downward and in the direction facing the front by a moving mechanism (not shown).
- a plurality of leg portions 46 are provided to project downward from the lower surface of the housing 41. At the time of landing of the flying object 4, the legs 46 contact the ground.
- the flight vehicle 4 rotates the horizontal rotary wing 42 even if the user does not operate it using a wireless controller (not shown) or the like. It can fly autonomously.
- the visible imaging unit 20 and the near infrared imaging unit 21 face vertically downward.
- the visible imaging unit 20 and the near infrared imaging unit 21 can move over the field FD to capture an image of the field FD.
- the visible imaging unit 20 and the near infrared imaging unit 21 face in the front direction. Thereby, the damage by the collision with the ground of the lens (not shown) of the visible imaging part 20 and the near-infrared imaging part 21 etc. can be prevented.
- the aircraft 4 may be configured to be capable of wireless control flight (guided flight) by the user.
- the flying object 4 may be, for example, a balloon, an airship, an airplane, a helicopter or the like.
- a lifting device such as a crane for lifting the housing 25 from the ground may be used. At this time, the suspended case 25 is moved in the horizontal direction.
- the information terminal 3 is configured of, for example, a personal computer.
- the information terminal 3 is configured to be able to communicate with the flying object 4 and the imaging unit 2 via the connection units 35 and 45 (see FIG. 2), and has a display unit 31 and an operation unit 32.
- the display unit 31 includes, for example, a liquid crystal panel, and displays an operation menu, a communication state with the flying object 4, a composite image CI described later, a scatter diagram 100 described later, maps 200 and 210 described later, and the like.
- the operation unit 32 has a keyboard 32a and a mouse 32b, and receives and outputs input operations of various data.
- the information terminal 3 may be configured by a mobile phone such as a smartphone or a tablet PC.
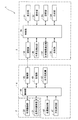
- FIG. 2 is a block diagram showing the configuration of the crop cultivation support apparatus 1.
- the information terminal 3 and the flying object 4 respectively have control units 39 and 49 including CPUs that control the respective units.
- the control unit 39 and the control unit 49 are wirelessly connected via the connection units 35 and 45.
- the display unit 31, the operation unit 32, the storage unit 33, the combining unit 34, the connection unit 35, the malfunction detection unit 36, the growth index derivation unit 37, and the comparison unit 38 are connected to the control unit 39.
- the storage unit 33 stores various programs and various data.
- the various programs include programs for controlling the overall operation of the information terminal 3 and the like.
- the various data include a visible image, a near infrared image, a captured image FI, a point image PI, a composite image CI, and the like.
- the captured image FI is an image formed based on both a visible image and a near infrared image, or a near infrared image.
- the point image PI is an image of a point on the captured image FI.
- the point image PI includes one or a plurality of pixels, and the size of one point image PI is smaller than the size of one captured image FI.
- the composite image CI is an image formed by combining a plurality of point images PI, and in the present embodiment, is an entire image of one field FD, for example. Further, in the present embodiment, the captured image FI, the spot image PI, and the composite image CI are formed by an NDVI image and a coverage image described later.
- the combining unit 34 forms a spot image PI based on a plurality of (six in the present embodiment) captured images FI. Further, the combining unit 34 combines a plurality of point images PI. Thus, the combining unit 34 forms a combined image CI.
- connection parts 35 and 45 are provided with an antenna (not shown).
- the connection units 35 and 45 transmit and receive communication data by radio waves via an antenna.
- the communication data includes a visible image and a near infrared image captured by the visible imaging unit 20 and the near infrared imaging unit 21 respectively.
- the defect detection unit 36 detects a defect area DR (see FIG. 6) having a defect described later on the captured image FI.
- the combining unit 34 forms the point image PI except for the defect region DR as described later.
- the growth index deriving unit 37 derives a growth index indicating the growth state of the crop PL in the field FD, based on the visible image captured by the visible imaging unit 20 and the near infrared image captured by the near infrared imaging unit 21. .
- an NDVI Normalized Difference Vegetation Index
- An NDVI image which is an image displayed by NDVI, is formed based on a visible image and a near infrared image.
- the pixel value of the visible image is Rv and the pixel value of the near infrared image is Ri
- the pixel value of the NDVI image corresponding to the pixel values of the visible image and the near infrared image corresponds to NDVI
- NDVI (Ri ⁇ (Ri ⁇ It is expressed as Rv) / (Ri + Rv).
- the pixel value at the pixel position (10, 15) of the NDVI image is derived from the pixel value at the pixel position (10, 15) of the visible image and the pixel value at the pixel position (10, 15) of the near infrared image.
- the parallax between the visible imaging unit 20 and the near infrared imaging unit 21 is taken into consideration, and at least one of the pixel positions of the visible image and the near infrared image is shifted so as to correct the parallax.
- NDVI may be derived.
- the first imaging optical system of the visible imaging unit 20 and the second imaging optical system of the near-infrared imaging unit 21 have the same optical characteristics such as angle of view and distortion.
- the vegetation cover rate which shows the ratio which the ground surface of the field FD is covered by crop PL is used.
- the growth index deriving unit 37 performs binarization processing based on the near-infrared image of the field FD captured by the near-infrared imaging unit 21 to form a binarized image of white and black.
- the white part corresponds to the crop PL
- the black part corresponds to the soil.
- the growth index deriving unit 37 derives an vegetation coverage that indicates the ratio of the white portion in the binarized image.
- an image represented by a vegetation coverage is referred to as a vegetation coverage image.
- the imaging unit 2 and the growth index deriving unit 37 constitute a cultivation information output unit that outputs predetermined cultivation information on the crop PL.
- the comparison unit 38 compares a standard range NR (see FIG. 9), which will be described later, based on the correlation between NDVI (cultivation information and parameters) and coverage rate (cultivation information and parameters), NDVI and coverage rate for each field FD. Do. In addition, the comparison unit 38 derives an approximate curve AC (see FIG. 9) that approximates the relationship between the NDVI and the coverage rate, and sets the range of a predetermined displacement amount as the standard range NR.
- a storage unit 43, a connection unit 45, a horizontal rotary wing 42, an orientation measurement unit 47, and a position detection unit 48 are connected to the control unit 49 of the flying object 4. Further, the visible imaging unit 20 and the near infrared imaging unit 21 are connected to the control unit 49.
- the storage unit 43 stores a control program (including an autonomous flight program) of the aircraft 4, a control program of the imaging unit 2, and various data.
- the various data stored in the storage unit 43 include flight data such as the flight path and altitude of the aircraft 4 and the like.
- the position detection unit 48 includes, for example, a GPS (Global Positioning System).
- the GPS may be a GPS having a correction function of correcting an error such as DGPS (Differential GPS).
- the position detection unit 48 detects the position (latitude X, longitude Y, height Z) of the imaging unit 2 (visible imaging unit 20 and near-infrared imaging unit 21).
- the orientation measurement unit 47 is formed of, for example, a three-axis azimuth meter (three-axis geomagnetic sensor), and measures the orientation of the imaging unit 2 on the earth. Further, the control unit 39 derives the position of the point image PI from the position, the angle of view, and the number of pixels of the imaging unit 2.
- FIG. 3 is a view showing a process of forming a composite image CI.
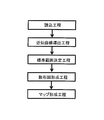
- the process of forming the composite image CI includes a photographing process, a growth index image forming process, a defect detection process, a point image forming process, and an image combining process.
- the composite image CI will be described by taking an image of one field FD as an example. Since the composite image CI of the coverage image is similarly formed, the formation of the composite image CI of the NDVI image will be described as an example.
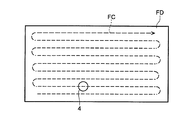
- FIG. 4 is a plan view showing an imaging process.
- the flying object 4 autonomously flies by the rotation of the horizontal rotary wing 42 and reaches over the field FD.
- the flying object 4 flies over the field FD at a set altitude H (30 m in the present embodiment) and a set velocity (15 km / h in the present embodiment) in a ninety-nine fold in plan view as shown by the arrow FC.
- the flying object 4 flies from one end to the other end in the longitudinal direction along the longitudinal direction of the agricultural field FD, and reaches the other end a predetermined distance along the lateral direction of the agricultural field FD After flying, it is repeated to fly to one longitudinal end along the longitudinal direction. While the flying object 4 is flying over the field FD, the visible imaging unit 20 and the near infrared imaging unit 21 capture the field FD.
- FIG. 5 shows a side view of the imaging process.
- illustration of the flying body 4 is abbreviate
- the imaging range D is an area of about 24.85 m ⁇ about 33.13 m.
- the imaging unit 2 captures one visible image and one near-infrared image each for one second, the same point SP on the field FD is captured six times each.
- the visible image and the near infrared image are transmitted to the control unit 39 through the connection units 45 and 35 and stored in the storage unit 33. At this time, each visible image and each near-infrared image are stored in the storage unit 33 in association with the position of the imaging unit 2. After the imaging process, the process proceeds to a growth index image forming process.
- the growth index deriving unit 37 derives NDVI from the pixels of the visible image and the pixels of the near infrared image. Thereby, a captured image FI which is an NDVI image is formed.
- the NDVI image is color-coded with R, G, and B according to the NDVI. For example, in the NDVI image, NDVI decreases in the order of R, G, and B.
- the vegetation coverage deriving unit 37 When forming the vegetation coverage image represented by the vegetation coverage, the vegetation coverage deriving unit 37 derives the vegetation coverage in the growth index image forming process. Thereby, the captured image FI which is a vegetation coverage image is formed.
- the coverage ratio image is color-coded by R, G, and B according to the coverage ratio. For example, in the coverage image, the coverage decreases in the order of R, G, and B.
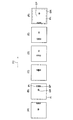
- FIG. 6 is a view showing a plurality of (six in the present embodiment) captured images FI in which the same point SP is captured in the defect detection step.
- the same point SP is captured in the captured images FI of “A” to “F”.
- the imaging timings of the captured images FI of “A” to “F” are different, and are arranged in time series in the order of “A” to “F”. For example, when the field FD is a paddy field, the sun reflected on the water surface at the time of the photographing process may be reflected in the visible image and the near infrared image. For this reason, there may be a case where a defect region DR having a defect caused by the reflection of the sun is generated on the captured image FI.
- the direction of the housing 25 accommodating the imaging unit 2 may be temporarily changed to the front direction (the direction other than the field FD) due to the erroneous operation of the moving mechanism or the like.
- the area when the orientation of the imaging unit 2 is changed on the captured image FI is the defect area DR.
- a state in which the crop PL is laid down due to wind or the like may be reflected in the visible image and the near infrared image.
- the area where the crop PL fell on the captured image FI is the defect area DR.
- a shading error may occur in which the NDVI (characteristic value) of the peripheral part Ph of the captured image FI is lower than the NDVI of the central part CP.
- the area of the peripheral part Ph of the captured image FI is the defect area DR.
- the visible imaging unit 20 and the near infrared imaging unit 21 are disposed apart from each other by a predetermined distance. For this reason, an error may occur due to the shift between the visible pixel and the near-infrared pixel due to the parallax between the visible imaging unit 20 and the near-infrared imaging unit 21. In this case, a region where the amount of deviation is larger than a predetermined value is the failure region DR.
- the NDVI of the failure area DR in the above example indicates a value lower than the NDVI of the other non-failure area (the area which is not the failure area DR). For this reason, when a plurality of point images PI are synthesized using the NDVI of the defect area DR, the quality of the synthesized image CI is degraded. Therefore, the defect detection unit 36 detects the defect area DR on the captured image FI, and the combining unit 34 forms the point image PI excluding the defect area DR detected by the defect detection unit 36. In the present embodiment, the defect detection unit 36 detects the defect region DR by relatively comparing NDVIs of a plurality of regions obtained by dividing one captured image FI.
- the defect detection unit 36 Is detected as a failure area DR.
- the area image Pr of the predetermined area including the same point SP on the captured image FI of “C” overlaps the defect area DR.
- the size (range) of the area image Pr is smaller than the size (range) of the captured image FI.
- the combining unit 34 does not use the area image Pr of “C”, and uses the remaining five area images Pr to include the same point SP.
- the average value of NDVI of each pixel in the image Pr is derived.
- the point image PI (refer FIG. 7) of the same point SP from which the defect area
- the point image PI from which the defect area DR has been removed is similarly formed for the area images Pr of the other identical points SP.
- a plurality of point images P IN (see FIG. 7) from which the defect area DR has been removed are formed.
- “N” is a serial number assigned to each of the plurality of spot images PI, and is an integer from 1 to K when the total number of the plurality of spot images PI is K.
- the combining unit 34 uses all six area images Pr to use the area image Pr including the same point SP. Derive the average value of NDVI of each pixel in When the NDVI of the defect area DR can be corrected by the image correction of the area image Pr, the area image Pr after the correction may be used.
- each of the plurality of locations image PI N is the visible image pickup unit 20 and the near-infrared imaging unit 21 at the time of imaging of each of the visible image and infrared image used in forming the point image PI N latitude X N , Longitude Y N , altitude Z N and azimuth ⁇ N.
- Combining unit 34 performs for each of the plurality of locations images PI N, latitude X N with a pixel position of the point image PI N of a point image PI N, longitude Y N, the affine transformation based on high Z N and orientation theta N . Thereby, the pixel position of the point image PI is converted to the pixel position in the composite image CI.
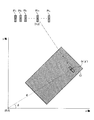
- FIG. 7 shows a diagram for explaining the image combining process.
- Upper part of FIG. 7 shows a plurality of locations images PI N
- lower part of FIG. 7 shows the coordinate system of the composite image CI.
- the affine transformation is a transformation combining linear transformation and translation (translation) as known, and is expressed by Equation 1 (for example, "What is the affine transformation", [online], [May 15, 2017 Day search], the Internet (URL: http / / d. Hatena. Ne. Jp / Zellij / 20120523 / p1)).
- the column vector (x ', y') indicates the pixel position in the coordinate system of the composite image CI as shown in the lower part of FIG.
- the 2-by-2 matrix consisting of the components a, b, c, d in the 1st row, 1st row, 2nd row, 2nd row, 1st row and 2nd row, 2nd column in the first term on the right side of Equation 1 is a rotation transformation matrix
- the column vector (t x , t y ) of the second term on the right side of Formula 1 represents R ( ⁇ ), and represents a transformation matrix of translation (translation).
- the actual height of the imaging unit 2 at the time of the imaging process is the rotation matrix R ( ⁇ ).
- a scaling factor is multiplied according to the actual altitude at the imaging step so as to be equal to the reference altitude.
- the component a is a value obtained by multiplying cos ⁇ by a scaling factor.
- Equations 3 and 4 The components t x and t y in the translation (translation) conversion matrix are given by Equations 3 and 4.
- the angle ⁇ [rad] between the distance d [m] from the origin (0, 0) in the coordinate system of the composite image CI and the horizontal direction (x axis) is derived from the latitude X and longitude Y Convert to the number of pixels.
- the coefficient k in Equations 3 and 4 is a coefficient for converting a meter to the number of pixels. For example, when the number of pixels of the first image sensor and the second image sensor is 480, the coefficient k is 24.85 [m] / 480 [pixel]] 0.052 [m / pixel]. Also, methods for calculating the distance d [m] and the angle ⁇ [rad] are known, and are given by Equation 5 and Equation 6 (for example, “distance between two points and azimuth angle”, [online], [2017 5 22 month search], the Internet (URL: http // keisan.casio.jp / exec / system / 1257670779)).
- Equations 5 and 6 X1 and Y1 are the latitude and longitude of the point A, and X2 and Y2 in the equations 5 and 6 are the latitude and longitude of the point B, respectively.
- the point A or the point B is the origin (0, 0) in the coordinate system of the composite image CI.
- the position after conversion of the NDVI interpolated (linear interpolation etc.) by the NDVI of the pixel at the position (x, y) before conversion obtained by Expression 8 or the NDVI of a plurality of pixels existing near the position , Y ′) is determined as the NDVI of the pixel.
- the entire image of one field FD can be obtained by the process of forming the composite image CI described above. In addition, the whole image can be similarly acquired about other farmland FD.
- FIG. 8 is a view showing a display process.
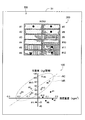
- FIG. 9 is a view showing an example of the data display screen DS displayed on the display unit 31 when the display process is completed.
- the display process includes a read process, an approximate curve derivation process, a standard range determination process, a scatter diagram formation process, and a map formation process.
- the comparing unit 38 reads, from the storage unit 33, the NDVI and the coverage rate corresponding to all pixels of the composite image CI of a plurality of field FDs (fields FD of # 1 to # 12 in this embodiment).
- the crops PL for example, Koshihikari rice
- the cultivation method is the same.
- the comparison unit 38 derives the average value of the NDVI and the coverage for each field FD.
- an approximate curve AC (including an approximate straight line) is derived using, for example, the least squares method based on the average value of the NDVI of each field FD and the average value of the coverage. That is, the comparison unit 38 derives an approximate curve AC that approximates the relationship between two parameters (NDVI, coverage).
- an approximate curve AC which approximates the relationship between two parameters (NDVI, coverage) is an approximate straight line.
- the comparison unit 38 determines a range of a predetermined displacement amount from the approximate curve AC as a standard range NR (an area surrounded by a broken line in FIG. 9).
- the displacement amount is, for example, the distance from the approximate curve AC. That is, the standard range NR is based on the correlation between the NDVI (parameter) and the coverage (parameter).
- the approximate curve AC may be expressed not by a linear function but by a quadratic function or the like. In this case, the square value of the parameter is taken as a "parameter".
- the display unit 31 forms a scatter diagram 100 having the NDVI and the coverage rate as coordinate axes.
- the scatter diagram 100 is represented by two-dimensional orthogonal coordinates in which the horizontal axis and the vertical axis are NDVI and coverage, respectively.
- the display unit 31 displays # 2 and # 4 field FD within the standard range NR by means of triangle marks (marking) for the NDVI and the plant coverage rate within # 3 and # 10 within the standard range NR.
- the field FD of is indicated by a square mark (marking)
- the field FD of # 5, # 6, and # 9 within the standard range NR is indicated by a circle (marking) for NDVI and coverage.
- the display unit 31 displays the NDVI and the field FD with low coverage rate, the medium field FD and the high field FD in the standard range NR by a triangle mark, a square mark and a circle mark, respectively.
- the user can easily recognize the difference in growth speed of the crop PL in the field FD in the standard range NR.
- the NDVI and plant coverage of the field FD within the standard range NR are more likely to move along the approximate curve AC due to the increase or decrease of the amount of fertilizer etc.
- Abnormality occurs in the field FD within the standard range NR.
- the potential for location eg, soil loss, water gate failure, etc. is diminished.
- the display unit 31 may display all the fields FD in the standard range NR with the same mark.
- the display unit 31 displays # 1, # 7, and # 8 field FD with the NDVI and the plant coverage outside the standard range NR by the diamond marks (marking), and the NDVI and the land coverage # 11 with the plant coverage outside the standard range NR,
- the # 12 field FD is displayed by a star mark (marking). That is, the display unit 31 displays the field FD within the standard range NR and the field FD outside the standard range NR with different markings.
- the display unit 31 represents the NDVI and the coverage rate based on the combined image CI (NDVI image and coverage rate image) of the field FD of # 1 to # 12 stored in the storage unit 33
- Map 200, 210 (see FIG. 9) of the field FD of 1 to # 12 are respectively formed.
- the NDVI increases in the order of the contour lines A1, A2, and A3, and in the map 210, the coverage rate increases in the order of the contour lines B1, B2, and B3.
- the maps 200 and 210 are formed using affine transformation or the like.
- the scatter diagram 100 and the data of the maps 200 and 210 are stored in the storage unit 33.
- the display unit 31 displays markings on the field FD in which the NDVI and the coverage rate are outside the standard range NR in the maps 200 and 210.
- a rhombus mark is displayed on the # 1, # 7, and # 8 field FDs of the maps 200 and 210 as in the scatter diagram 100, and the stars are displayed on the # 11 and # 12 field FDs of the maps 200 and 210. The form is displayed.
- the scatter diagram 100 and the maps 200 and 210 make it easy for the user to recognize that the NDVI and coverage rate of the field FD of # 1, # 7, # 8, # 11, # 12 deviate from the standard range NR. Can. That is, in the field FD of # 1, # 7, # 8, # 11, and # 12, the growth state of the crop is out of the growth state of the crop PL predicted by the field FD of # 1 to # 12, and the user It can be easily recognized that the condition of the field FD is bad (there is an abnormal place or the like in the field FD). Then, the user can take measures for the field FD of # 1, # 7, # 8, # 11, and # 12. As a countermeasure, for example, the change of the spreading time of the fertilizer, the confirmation of the soil of the field FD, the check of the waterway for supplying water to the field FD, the water gate, etc. are performed.
- the display unit 31 displays the field FD of # 1, # 7, and # 8 above the approximate curve AC in FIG. 9 and # 11 and below the approximate curve AC.
- the # 12 field FD is displayed by different markings.
- the user can easily recognize that the measures to be taken for the # 1, # 7 and # 8 field FDs are different from the measures to be taken for the # 11 and # 12 field FDs. it can.
- the coverage rate is low relative to the height of the NDVI, and it can be expected that the user will have a poor rooting due to, for example, a temperature decrease after planting seedlings, within the standard range NR. It is possible to take measures to spread the same amount of fertilizer as the amount of fertilizer (standard amount) of the field FD at a later time than the field FD in the standard range NR.
- the NDVI is low relative to the height of the coverage rate, and the user can expect, for example, a large number of stems but low leaf chlorophyll concentration. It is possible to take measures to spray the same amount of fertilizer as the amount of fertilizer (standard amount) of the field FD earlier than the field FD in the standard range NR. Incidentally, showing the fertilizer per 1 m 2 The "amount fertilizer".
- the scatter diagram 100 and the maps 200 and 210 are simultaneously displayed as a list on the display unit 31.
- the user can easily grasp the situation of each field FD and the position of the field FD having an abnormal point.
- one parameter may consist of the growth index of the NDVI or the vegetation coverage, and the other parameter may consist of time such as month or year.
- the scatter diagram 100 is expressed by two-dimensional orthogonal coordinates, but instead, one-dimensional coordinates using average values of growth indicators such as field FD units, farmer units, and region units NDVI May be represented by
- the imaging unit 2 may be configured by a far infrared camera or the like to capture a thermal image of the field FD.
- a three-dimensional measuring instrument for example, a scanning laser distance meter
- LIDAR Laser Imaging Detection and Ranging
- the plant height (height information) of the crop PL may be used as a growth index or parameter.
- the imaging unit 2 (cultivation information output unit that outputs NDVI (cultivation information, parameters) and plant coverage (cultivation information, parameters) for the crop PL separately for a plurality of fields FD (cultivation area) for cultivating the crop PL And growth index derivation unit 37 (cultivation information output unit), and a comparison unit 38 that compares the standard range NR with the NDVI and the coverage ratio based on the correlation between the NDVI and the coverage rate for each field FD, and the comparison unit 38 And a display unit 31 for displaying by field FD whether or not the NDVI and the coverage rate are within the standard range NR based on the result.
- NDVI vegetativation information, parameters
- plant coverage plant coverage
- the user can easily recognize the field FD where the NDVI and the coverage rate deviate from the standard range NR. Therefore, the user can easily judge whether or not the situation of each farmland FD is correct, and can take measures for the farmland FD where the situation is bad (having an abnormal place or the like). As a result, the usability of the crop cultivation support device 1 can be improved.
- the display part 31 is displaying according to farmland FD, you may display according to a farmer and an area.
- the cultivation information output unit for detecting the light of the predetermined wavelength contained in the sunlight reflected by the field FD and the cultivation information output unit
- the growth index deriving unit 37 for deriving the plant coverage (growth index) indicating the growth state of the crop PL in the field FD, and the cultivation information on the crop comprises the NDVI and the coverage.
- the display unit 31 forms a scatter diagram 100 having the NDVI (parameter) and the coverage (parameter) as coordinate axes.
- the display unit 31 displays the field FD in the standard range NR and the field FD outside the standard range NR with different markings for the NDVI and the coverage rate. This allows the user to more easily recognize the unsettled field FD.
- the display unit 31 may display the field FD in the standard range NR and the field FD outside the standard range NR by marking in different colors with the NDVI and the coverage rate.
- the field FD in the standard range NR may be displayed by a black marking
- the field FD outside the standard range NR may be displayed by a red marking.
- the display part 31 forms the maps 200 and 210 of several field FD.
- the display unit 31 displays the marking on the field FD in which the NDVI and the coverage rate are outside the standard range NR. Thereby, the user can easily grasp the position of the field FD in a bad situation. Further, the user can predict whether or not an abnormal place or the like in the field FD where the situation is poor originates in the position of the field FD.
- the comparison unit 38 derives an approximate curve AC that approximates the relationship between the NDVI (parameter) and the coverage (parameter), and sets the range of a predetermined displacement amount from the approximate curve AC as a standard range NR.
- the standard range NR can be easily determined.
- the NDVI (parameters) and the vegetation coverage (parameters) consist of cultivation information on the crop PL.
- the standard range NR based on the correlation of parameters relating to the crop PL can be determined, and the user can more accurately determine the availability of the field FD.
- one parameter may consist of cultivation information, and another parameter may consist of time, such as a month or a year.
- time such as a month or a year.
- a visible imaging unit 20 imaging unit
- a near infrared imaging unit 21 imaging unit for imaging the field FD by moving above the field FD (cultivation region) where the crop PL is cultivated
- the visible imaging unit 20 Based on the position detection unit 48 for detecting the position of the near-infrared imaging unit 21 and a plurality of captured images FI obtained by imaging the point image PI of the same point SP of the field FD with the visible imaging unit 20 and the near-infrared imaging unit 21
- a combining unit configured to combine the plurality of point images PI.
- a defect detection unit 36 that detects a defect area DR having a defect on the captured image FI is provided, and the point image PI is formed excluding the defect area DR detected by the defect detection unit 36 by the combining unit 34.
- the point image PI from which the defect area DR is removed is formed, and a plurality of point images PI are synthesized. Therefore, the quality of the synthetic image of the whole field FD is improved, and an image useful for determining the growth state of the crop PL can be provided.
- the defect detection unit 36 relatively compares NDVI (characteristic values) of a plurality of regions obtained by dividing one captured image FI to detect the defect region DR. Thereby, the defect detection unit 36 can easily detect the defect area DR.
- the defect detection unit 36 may detect the defect region DR by relatively comparing NDVI (characteristic values) of a plurality of regions with respect to the same point SP of the plurality of captured images FI. Even in this case, the defect detection unit 36 can easily detect the defect area DR.
- NDVI characteristic values
- the defect area DR may be detected by comparing the characteristic values of a plurality of areas obtained by dividing the one captured image FI with a predetermined threshold value. Even in this case, the defect detection unit 36 can easily detect the defect area DR.
- the defect detection unit 36 may determine that the peripheral part Ph of each captured image FI is the defect region DR. As a result, it is possible to easily prevent the quality deterioration of the composite image CI due to a shading error in which the NDVI of the peripheral part Ph of the captured image FI is lower than the NDVI of the central part CP.
- the defect detection unit 36 compares the pixels of the visible image with the pixels of the near infrared image.
- An area where the amount of deviation is larger than a predetermined amount may be determined as the defect area DR.
- control unit 39 derives the position of the point image PI based on the positions of the visible imaging unit 20 and the near infrared imaging unit 21, the angle of view, and the number of pixels.
- the position of the point image PI can be easily derived.
- the information terminal 3 may be connected to a predetermined network such as the Internet, and a storage unit that stores the captured image FI, the spot image PI, and the composite image CI may be provided on the network. Thereby, the capacity of the storage unit 33 can be reduced.
- FIG. 10 is a figure which shows the display process of the crop cultivation assistance apparatus 1 of 2nd Embodiment.
- FIG. 11 is a view showing an example of the data display screen DS of the display unit 31 of the second embodiment.
- the same parts as those in the first embodiment shown in FIGS. 1 to 9 are given the same reference numerals.
- the coordinate axes of the scatter diagram 100 displayed on the display unit 31 are different from those in the first embodiment.
- both the maps 200 and 210 were displayed on the display part 31 in 1st Embodiment, in this embodiment, only the map 200 is displayed among these.
- the other parts are the same as in the first embodiment.
- the display process of the present embodiment includes a cultivation information input process, an approximate curve readout process, a standard range determination process, a scatter diagram formation process, and a map formation process.
- the cultivation information input process the yield difference (cultivation information, parameters) and the fertilization amount difference (cultivation information, parameters) of the field FD of # 1 to # 12 are inputted through the operation unit 32. That is, the operation unit 32 receives and outputs the input operation of the yield difference and the fertilization amount difference.
- the cultivation information output unit has the operation unit 32.
- the difference in yield indicates the difference in yield of the crop PL (unit: kg / field) in the last two years to compare, and the difference in fertilization amount is the difference in the amount of fertilizer applied (amount of fertilizer applied) in the last two years to compare / M 2 ) is shown.
- the correlation between the yield difference and the fertilization amount difference is known, and an approximate curve AC that approximates the relationship between the yield difference and the fertilization amount difference is stored in the storage unit 33 in advance.
- the comparison unit 38 reads out from the storage unit 33 an approximate curve AC that approximates the relationship between the yield difference and the fertilization amount difference.
- the comparison unit 38 determines a range of a predetermined displacement amount from the approximate curve AC as a standard range NR.
- the display unit 31 forms a scatter diagram 100 in which the yield difference and the fertilization amount difference are used as coordinate axes.
- the scatter diagram 100 is represented by two-dimensional orthogonal coordinates in which the fertilization amount difference and the yield difference are taken as the horizontal axis and the vertical axis, respectively.
- the display unit 31 displays the fields FD of # 2 to # 6, # 9, and # 10 in the standard range NR with differences in yield and fertilization amount by white circles (marking). Further, the display unit 31 displays the field FD of # 1, # 7, # 8, # 11, and # 12 outside the standard range NR by using a black circle (marking). That is, the display unit 31 displays the field FD in the standard range NR and the field FD in which the yield difference and the fertilization amount difference are outside the standard range NR with different markings.
- the display unit 31 creates the current map 200. Then, as in the first embodiment, the display unit 31 displays a black circle mark on the field FD of # 1, # 7, # 8, # 11, and # 12 where the NDVI is outside the standard range NR.
- the cultivation information output unit has the operation unit 32 that receives and outputs the input operation of the yield difference (cultivation information) and the fertilization amount difference (cultivation information).
- the user can input desired cultivation information, and the display unit 31 can display whether or not the cultivation information is within the standard range NR for each field FD.
- an approximate curve AC that approximates the relationship between the yield difference (parameter) and the fertilization amount difference (parameter) is stored in advance in the storage unit 33, and the comparison unit 38 standardizes the range of a predetermined deviation amount from the approximate curve AC. Assume NR. This makes it possible to omit the approximate curve deriving step of the first embodiment by using known correlations of a plurality of parameters.
- the display unit 31 may display both of the maps 200 and 210, or may display the map 210 instead of the map 200.
- the display unit 31 simultaneously displays the scatter diagram 100 and the map 200 as a list, but only the scatter diagram 100 may be displayed or only the map 200 may be displayed. Good.
- the display unit 31 simultaneously displays the scatter diagram 100 and the map 200 as a list, it is more preferable because the user can easily grasp the situation of the field FD and the position of the field FD having an abnormal part.
- the crop cultivation support device of each embodiment described above may be expressed as follows.
- the crop cultivation support device described above outputs a cultivation information output unit that outputs predetermined cultivation information on a crop for each of a plurality of cultivation regions for cultivating a crop, and a predetermined based on a correlation of a plurality of parameters including the cultivation information.
- a comparison unit that compares a standard range and the cultivation information for each of the cultivation regions, and a display unit that displays whether or not the cultivation information is within the standard range based on the comparison result of the comparison unit. Equipped with
- the cultivation information output unit detects the light of a predetermined wavelength contained in the sunlight reflected by the cultivation area, and the cultivation area based on the detection result of the optical sensor. It is preferable that the above-mentioned cultivation information comprises the above-mentioned growth index, and it has a growth index derivation part which derives the growth index which shows the growth state of the inside of a crop.
- the cultivation information output unit preferably includes an operation unit that receives and outputs an input operation of the cultivation information.
- the display unit forms a scatter diagram having a plurality of the parameters as coordinate axes, and the cultivation information includes the cultivation area within the standard range and the cultivation area outside the standard range. It is preferable to display by different markings.
- the display unit forms a map of a plurality of the cultivation areas, and the cultivation information displays a predetermined marking on the cultivation area outside the standard range.
- the comparison unit derives an approximate curve that approximates the relationship between a plurality of the parameters, and set a range of a predetermined deviation amount from the approximate curve as the standard range.
- an approximate curve that approximates the relationship between a plurality of the parameters be stored in advance, and the comparison unit set a range of a predetermined deviation amount from the approximate curve as the standard range.
- a plurality of the parameters each consist of the cultivation information.
- one of the parameters comprises the cultivation information and the other comprises time.
- the present invention can be used for a crop cultivation support device that supports crop cultivation.
- Reference Signs List 1 crop cultivation support apparatus 2 imaging unit 3 information terminal 4 flying object 20 visible imaging unit 21 near infrared imaging unit 31 display unit 32 operation unit 33 storage unit 34 combining unit 35 connection unit 36 defect detection unit 37 growth index deriving unit 38 comparison Part 43 Storage part 45 Connection part 48 Position detection part 100 Scattering chart 200, 210 Map DR fault area FD Field FI Captured image PI Point image PL Crop SP Same point
Landscapes
- Life Sciences & Earth Sciences (AREA)
- Engineering & Computer Science (AREA)
- Business, Economics & Management (AREA)
- Health & Medical Sciences (AREA)
- General Health & Medical Sciences (AREA)
- Environmental Sciences (AREA)
- Ecology (AREA)
- Agronomy & Crop Science (AREA)
- Animal Husbandry (AREA)
- Marine Sciences & Fisheries (AREA)
- Mining & Mineral Resources (AREA)
- Botany (AREA)
- Biodiversity & Conservation Biology (AREA)
- Economics (AREA)
- Forests & Forestry (AREA)
- Human Resources & Organizations (AREA)
- Marketing (AREA)
- Primary Health Care (AREA)
- Strategic Management (AREA)
- Tourism & Hospitality (AREA)
- Physics & Mathematics (AREA)
- General Business, Economics & Management (AREA)
- General Physics & Mathematics (AREA)
- Theoretical Computer Science (AREA)
- Image Processing (AREA)
- Management, Administration, Business Operations System, And Electronic Commerce (AREA)
Abstract
作物栽培支援装置は、作物(PL)を栽培する複数の圃場(FD)(栽培領域)別に作物(PL)に関する所定の栽培情報を出力する栽培情報出力部と、栽培情報を含む複数のパラメータの相関に基づく所定の標準範囲(NR)と栽培情報とを圃場(FD)毎に比較する比較部(38)と、比較部(38)の比較結果に基づいて栽培情報が標準範囲(NR)内か否かを圃場(FD)別に表示する表示部(31)と、を備える。
Description
本発明は、作物の栽培を支援する作物栽培支援装置に関する。
従来の作物栽培支援装置は特許文献1に開示されている。この作物栽培支援装置は、データベース、生長曲線生成部、キータイム抽出部、高次元分析モデル生成部、トレンド予測部及び表示部を有する。データベースは、作物の植生生長の複数サイクルの時系列の衛星画像による衛星データと、時系列の温度を含む気象データとを記憶する。生長曲線生成部は、データベースから読み出した衛星データ及び気象データに基づき、圃場毎及び時期毎の植物の植生指標及び予め定めた基準時期からの有効積算温度を算出し、植生指標対有効積算温度を表す植生生長曲線を圃場毎の過去の複数サイクルの対象作物について複数作成する。
キータイム抽出部は、作成した植生生長曲線に対して、植生特有の生長重要時期を表す予め定められたキータイムに対する植生指標(NDVI)を抽出する。高次元分析モデル生成部は、複数のキータイムの植生指標を各軸とした高次元植生分析座標に植生生長曲線毎の各キータイムの植生指標をプロットした高次元分析モデルを圃場毎の過去の複数サイクルの対象作物について複数生成する。
トレンド予測部は、予測対象となる圃場の作物についての複数の高次元分析モデルに基づき、予測年・予測サイクルの植生生長曲線における取得済みのキータイムの植生指標に従い未取得のキータイムの予測植生指標を求める。これにより、トレンド予測部は対象作物の取得済み以後の植生生長曲線を予測する。これにより、作物栽培支援装置は所定の圃場の作物の生長状況及び収量予測を行うことができる。
近年、作物の栽培方法の多様化のため、同一品種の作物であっても作物の生育状況は圃場、農家、地域等によって異なることがある。例えば、通常量よりも低い量の肥料で米を栽培する圃場の米は、通常量の肥料を用いて米を栽培する圃場の米よりも生育が遅い。このため、上記従来の作物栽培支援装置を用いて、栽培方法の異なる圃場間で作物の植生生長曲線を比較しても、各圃場での作物の生長状況を予測することはできても圃場の状況の可否(異常箇所の有無)を判断することは困難である。すなわち、圃場の状況について絶対的な判断が困難である。したがって、使用者は圃場の状況を正確に判断することができず、作物栽培支援装置の使用性が低下する問題があった。
本発明は使用性を向上できる作物栽培支援装置を提供することを目的とする。
上記目的を達成するために、本発明の一側面に係る作物栽培支援装置は、作物を栽培する複数の栽培領域別に作物に関する所定の栽培情報を出力する栽培情報出力部と、前記栽培情報を含む複数のパラメータの相関に基づく所定の標準範囲と前記栽培情報とを前記栽培領域毎に比較する比較部と、前記比較部の比較結果に基づいて前記栽培情報が前記標準範囲内か否かを前記栽培領域別に表示する表示部と、を備える。
本発明によると、作物栽培支援装置は、作物を栽培する複数の栽培領域別に作物に関する所定の栽培情報を出力する栽培情報出力部と、栽培情報を含む複数のパラメータの相関に基づく所定の標準範囲と栽培情報とを栽培領域毎に比較する比較部と、比較部の比較結果に基づいて栽培情報が標準範囲内か否かを栽培領域別に表示する表示部と、を備える。これにより、圃場の状況について絶対的な判断をせずに相対的な判断を行って、使用者は状況の悪い栽培領域(異常箇所を有する栽培領域)を容易に認識することができる。したがって、作物栽培支援装置の使用性を向上させることができる。
<第1実施形態>
以下に図面を参照して本発明の実施形態について説明する。図1は第1実施形態の作物栽培支援装置の概略構成を示す図である。作物栽培支援装置1は撮像部2及び情報端末3を備え、圃場FD(栽培領域)での作物PLの栽培を支援する。なお、圃場FDとは例えば平面視略矩形形状で四辺に畦畔が設けられ、畦畔で囲まれた水田または畑を示す。
以下に図面を参照して本発明の実施形態について説明する。図1は第1実施形態の作物栽培支援装置の概略構成を示す図である。作物栽培支援装置1は撮像部2及び情報端末3を備え、圃場FD(栽培領域)での作物PLの栽培を支援する。なお、圃場FDとは例えば平面視略矩形形状で四辺に畦畔が設けられ、畦畔で囲まれた水田または畑を示す。
撮像部2は例えばマルチスペクトルカメラにより構成され、飛行体4に取り付けられる。撮像部2は可視撮像部20(図2参照)及び近赤外撮像部21(図2参照)を有する。可視撮像部20と近赤外撮像部21とは圃場FDに平行な面内で所定間隔をあけて配置される。
可視撮像部20は可視光の画像(可視画像)を形成する。可視撮像部20は、第1バンドパスフィルタ、第1結像光学系、第1イメージセンサ(光学センサ)及び第1デジタルシグナルプロセッサ等を有する(いずれも不図示)。第1バンドパスフィルタは例えば波長650nmを中心波長とする比較的狭帯域で光を透過させる。第1結像光学系は、第1バンドパスフィルタを透過した測定対象の可視光の光学像を所定の第1結像面上に結像する。第1イメージセンサは第1結像面に受光面を一致させて配置され、圃場FDで反射する太陽光に含まれる波長650nmを中心波長とする比較的狭帯域の光を検知し、測定対象の可視光の光学像を電気的な信号に変換する。第1デジタルシグナルプロセッサは第1イメージセンサの出力に対して画像処理を施し、可視画像を形成する。
近赤外撮像部21は近赤外光の画像(近赤外画像)を形成する。近赤外撮像部20は、第2バンドパスフィルタ、第2結像光学系、第2イメージセンサ(光学センサ)及び第2デジタルシグナルプロセッサを有する(いずれも不図示)。第2バンドパスフィルタは750nm以上の所定波長(例えば波長800nm)を中心波長とする比較的狭帯域で光を透過させる。第2結像光学系は、第2バンドパスフィルタを透過した測定対象の近赤外光の光学像を所定の第2結像面上に結像する。第2イメージセンサは第2結像面に受光面を一致させて配置され、圃場FDで反射する太陽光に含まれる波長800nmを中心波長とする比較的狭帯域の光を検知し、測定対象の近赤外光の光学像を電気的な信号に変換する。第2デジタルシグナルプロセッサは第2イメージセンサの出力に対して画像処理を施し、近赤外画像を形成する。なお、第1イメージセンサ及び第2イメージセンサとして例えばVGAタイプ(640画素×480画素)のイメージセンサを用いることができる。
なお、撮像部2は近赤外撮像部21を省き、可視撮像部20により構成されてもよい。この場合、可視撮像部20は、第1結像光学系と、第1イメージセンサと、第1イメージセンサ上に配置されたR/G/B/IrまたはW/Y/R/Irとを備えて構成される(例えば特許第5168353号公報参照)。上記「R」、「G」、「B」はそれぞれ主に赤色光、緑色光、青色光を透過させるフィルタである。上記「Ir」は主に近赤外光を透過させるフィルタである。上記「W」は主に白色光を透過させるフィルタであり、上記「Y」は主に黄色光を透過させるフィルタである。
飛行体4は自律飛行可能な無人航空機(ドローン)により構成され、圃場FDの上空を飛行する。飛行体4は複数(例えば8個)の水平回転翼42を設けたハウジング41を有する。撮像部2はハウジング41の下面に取り付けられた筐体25内に配置される。移動機構(不図示)により筐体25は開口部(不図示)を有する下面が鉛直下方に向く方向と正面を向く方向とに移動可能に構成される。これにより、可視撮像部20及び近赤外撮像部21は開口部を介して鉛直下方を向く方向と正面を向く方向とを移動可能になっている。また、ハウジング41の下面から下方に向かって複数の脚部46が突設される。飛行体4の着陸の際に脚部46が地面に接触する。
飛行体4に対して事前のプログラミングによって飛行経路及び飛行高度等を設定すると、使用者が無線コントローラ(不図示)等を用いて操縦しなくても飛行体4は水平回転翼42を回転させて自律飛行することができる。飛行体4が飛行する際には可視撮像部20及び近赤外撮像部21は鉛直下方を向く。これにより、可視撮像部20及び近赤外撮像部21は圃場FDの上空を移動して圃場FDを撮像することができる。飛行体4が着陸する際には可視撮像部20及び近赤外撮像部21は正面方向を向く。これにより、可視撮像部20及び近赤外撮像部21のレンズ(不図示)等の地面への衝突による破損を防止することができる。なお、飛行体4は使用者による無線操縦飛行(誘導飛行)可能に構成されてもよい。
また、飛行体4は例えば気球、飛行船、飛行機、ヘリコプター等であってもよい。また、飛行体4に替えて、地上から筐体25を吊り上げるクレーン等の吊上げ装置(不図示)を用いてもよい。この時、吊り下げた筐体25を水平方向に移動させる。
情報端末3は例えばパーソナルコンピュータにより構成される。情報端末3は接続部35、45(図2参照)を介して飛行体4及び撮像部2と通信可能に構成され、表示部31及び操作部32を有する。表示部31は例えば液晶パネル等から成り、操作メニュー、飛行体4との通信状況、後述の合成画像CI、後述の散布図100、後述のマップ200、210等を表示する。操作部32はキーボード32a及びマウス32bを有し、各種データの入力操作を受け付けて出力する。なお、情報端末3はスマートフォン等の携帯電話機またはタブレットPCにより構成されてもよい。
図2は作物栽培支援装置1の構成を示すブロック図である。情報端末3及び飛行体4はそれぞれの各部を制御するCPUから成る制御部39、49をそれぞれ有する。制御部39と制御部49とは接続部35、45を介して無線接続される。制御部39には表示部31、操作部32、記憶部33、合成部34、接続部35、不具合検出部36、生育指標導出部37及び比較部38が接続される。
記憶部33は各種プログラム及び各種データを記憶する。各種プログラムには情報端末3の全体動作を制御するプログラム等が含まれる。各種データには可視画像、近赤外画像、撮像画像FI、地点画像PI及び合成画像CI等が含まれる。撮像画像FIは本実施形態では可視画像及び近赤外画像の両方、または近赤外画像に基づいて形成された画像である。地点画像PIは撮像画像FI上の地点の画像である。なお、地点画像PIは一または複数画素から成り、一の地点画像PIの大きさは一の撮像画像FIの大きさよりも小さくなっている。合成画像CIは複数の地点画像PIを合成して形成される画像であり、本実施形態では例えば一の圃場FDの全体の画像である。また、本実施形態では撮像画像FI、地点画像PI及び合成画像CIは後述のNDVI画像及び植被率画像により形成される。
合成部34は地点画像PIを複数(本実施形態では6枚)の撮像画像FIに基づいて形成する。また、合成部34は複数の地点画像PIを合成する。これにより、合成部34は合成画像CIを形成する。
接続部35、45にはアンテナ(不図示)が設けられる。接続部35、45はアンテナを介して無線電波により通信データの送受信を行う。通信データには可視撮像部20及び近赤外撮像部21がそれぞれ撮像した可視画像及び近赤外画像が含まれる。
不具合検出部36は、撮像画像FI上の後述の不具合を有した不具合領域DR(図6参照)を検出する。合成部34は後述のように不具合領域DRを除いて地点画像PIを形成する。
生育指標導出部37は、可視撮像部20で撮像した可視画像及び近赤外撮像部21で撮像した近赤外画像に基づいて、圃場FD内の作物PLの生育状態を示す生育指標を導出する。本実施形態では生育指標として、NDVI(Normalized Difference Vegetation Index、正規化差植生指数)を用いている。NDVIで表示した画像であるNDVI画像は可視画像及び近赤外画像に基づいて形成される。可視画像の画素値をRvとし、近赤外画像の画素値をRiとすると、可視画像及び近赤外画像の画素値に対応するNDVI画像の画素値がNDVIに相当し、NDVI=(Ri-Rv)/(Ri+Rv)と表される。NDVIが大きいほど植生が濃いことを表す。
例えばNDVI画像の画素位置(10,15)における画素値は、可視画像の画素位置(10,15)における画素値及び近赤外画像の画素位置(10,15)における画素値から導出される。なお、可視撮像部20と近赤外撮像部21との視差が考慮され、可視画像の画素位置及び近赤外画像の画素位置のうちの少なくとも一方の画素位置が視差を修正するようにシフトされた上で、NDVIが導出されてもよい。また、可視撮像部20の第1結像光学系と近赤外撮像部21の第2結像光学系は画角及び歪曲収差等の光学特性が互いに同等である。
なお、生育指標として、RVI(Ratio Vegetation Index、比植生指数、RVI=Ri/Rv)、DVI(Difference Vegetation Index、差植生指数、DVI=Ri-Rv)、TVI(Transformed Vegetation Index、TVI=NDVI+0.5)0.5)、またはIPVI(Infrared Percentage Vegetation Index、IPVI=Ri/(Ri+Rv)=(NDVI+1)/2)等を用いてもよい。
また、本実施形態では、生育指標としてNDVIに加えて、圃場FDの地表面を作物PLが覆っている割合を示す植被率を用いている。例えば、近赤外撮像部21で撮像した圃場FDの近赤外画像に基づいて生育指標導出部37は二値化処理を行い、白色と黒色の二値化画像を形成する。この時、白色部分が作物PLに相当し、黒色部分が土壌に相当する。そして、生育指標導出部37は二値化画像において白色部分が占める割合を示す植被率を導出する。本実施形態において、植被率で表した画像を植被率画像と呼ぶ。
撮像部2及び生育指標導出部37により、作物PLに関する所定の栽培情報を出力する栽培情報出力部が構成される。
比較部38は、NDVI(栽培情報、パラメータ)と植被率(栽培情報、パラメータ)との相関に基づく後述の標準範囲NR(図9参照)と、NDVI及び植被率とを各圃場FD毎に比較する。また、比較部38は、NDVIと植被率との関係を近似する近似曲線AC(図9参照)を導出し、所定の偏位量の範囲を標準範囲NRとする。
飛行体4の制御部49には記憶部43、接続部45、水平回転翼42、方位測定部47及び位置検出部48が接続される。また、制御部49には可視撮像部20及び近赤外撮像部21が接続される。記憶部43には飛行体4の制御プログラム(自律飛行プログラムを含む)、撮像部2の制御プログラム及び各種データが記憶される。記憶部43が記憶する各種データには飛行体4の飛行経路及び高度等の飛行データ等が含まれる。
位置検出部48は例えばGPS(Global Positioning System、全地球測位システム)を備える。なお、GPSはDGPS(Differential GPS)等の誤差を補正する補正機能を有するGPSであってもよい。位置検出部48により撮像部2(可視撮像部20及び近赤外撮像部21)の位置(緯度X、経度Y、高度Z)が検出される。方位測定部47は例えば3軸方位計(3軸地磁気センサ)により構成され、撮像部2の地球上における方位を測定する。また、制御部39は、撮像部2の位置、画角及び画素数から地点画像PIの位置を導出する。
図3は合成画像CIを形成する工程を示す図である。合成画像CIを形成する工程は撮影工程、生育指標画像形成工程、不具合検出工程、地点画像形成工程及び画像合成工程を有する。本実施形態では、合成画像CIは一の圃場FDの画像を例として説明する。なお、植被率画像の合成画像CIも同様に形成されるため、ここではNDVI画像の合成画像CIの形成を例として説明する。
図4は撮像工程を示す平面図である。上記構成の作物栽培支援装置1において、水平回転翼42の回転により飛行体4が自律飛行し、圃場FDの上空に到達する。飛行体4は圃場FDの上空を設定高度H(本実施形態では30m)及び設定速度(本実施形態では15km/h)で、矢印FCで示すように平面視で九十九折りに飛行する。具体的には、飛行体4は圃場FDの長手方向に沿って長手方向の一方端部から他方端部に向かって飛行し、他方端部に到達すると圃場FDの短手方向に沿って所定距離飛行した後に長手方向に沿って長手方向の一方端部に向かって飛行することを繰り返す。飛行体4が圃場FDの上空を飛行している間に可視撮像部20及び近赤外撮像部21は圃場FDを撮像する。
図5は撮像工程の側面図を示している。なお、図5では飛行体4の図示を省略し、矢印FCは飛行体4の飛行方向(撮像部2の移動方向)を示している。撮像工程において、可視撮像部20及び近赤外撮像部21の画角αを45°とすると、撮像範囲Dは約24.85m×約33.13mの領域となる。そして、撮像部2が1秒間に可視画像及び近赤外画像をそれぞれ1枚撮像する場合、圃場FD上の同一地点SPがそれぞれ6回撮像される。可視画像及び近赤外画像は接続部45、35を介して制御部39に送信され、記憶部33に記憶される。この時、各可視画像及び各近赤外画像は撮像部2の位置と関連付けて記憶部33に記憶される。撮像工程の後に、生育指標画像形成工程に移行する。
生育指標画像形成工程では、生育指標導出部37により可視画像の画素及び近赤外画像の画素からNDVIが導出される。これにより、NDVI画像である撮像画像FIが形成される。NDVI画像ではNDVIに応じてR、G、Bで色分けされる。例えば、NDVI画像において、R、G、Bの順にNDVIが低くなる。生育指標画像形成工程の後に不具合検出工程に移行する。
植被率で表した植被率画像を形成する場合には、生育指標画像形成工程において、生育指標導出部37により植被率が導出される。これにより、植被率画像である撮像画像FIが形成される。植被率画像では植被率に応じてR、G、Bで色分けされる。例えば、植被率画像において、R、G、Bの順に植被率が低くなる。
図6は不具合検出工程において、同一地点SPが撮像された複数(本実施形態では6枚)の撮像画像FIを示す図である。「A」~「F」の撮像画像FIには同一地点SPが撮像される。「A」~「F」の撮像画像FIの撮像タイミングはそれぞれ異なり、「A」~「F」の順で時系列に並んでいる。例えば圃場FDが水田の場合には、撮影工程時に水面に映った太陽が可視画像及び近赤外画像に写り込む場合がある。このため、撮像画像FI上に太陽の写り込みに起因する不具合を有した不具合領域DRが生じる場合がある。
また、撮像工程において、例えば撮像部2を収納した筐体25の向きが移動機構の誤作動等によって正面方向(圃場FD以外の方向)に一時的に変更される場合がある。この場合、撮像画像FI上で撮像部2の向きが変更された時の領域が不具合領域DRとなる。
また、撮像工程において、例えば風等により作物PLが倒伏した様子が可視画像及び近赤外画像に写り込む場合がある。この場合、撮像画像FI上で作物PLが倒伏した領域が不具合領域DRとなる。
また、撮像画像FIの周辺部PhのNDVI(特性値)が中心部CPのNDVIよりも低下するシェーディング誤差が発生する場合がある。この場合、撮像画像FIの周辺部Phの領域が不具合領域DRとなる。
また、前述のように可視撮像部20と近赤外撮像部21とは所定距離離れて配置されている。このため、可視撮像部20と近赤外撮像部21との視差に起因する可視画素と近赤外画素とのズレによる誤差が発生する場合がある。この場合、ズレ量が所定値よりも大きい領域が不具合領域DRとなる。
上記例の不具合領域DRのNDVIは不具合のない他の領域(不具合領域DRではない領域)のNDVIよりも低い値を示す。このため、不具合領域DRのNDVIを用いて複数の地点画像PIを合成すると、合成画像CIの品質が低下する。そこで、不具合検出部36は、撮像画像FI上の不具合領域DRを検出し、合成部34は不具合検出部36により検出した不具合領域DRを除いて地点画像PIを形成する。本実施形態では、不具合検出部36は一の撮像画像FI内を区分した複数の領域のNDVIを相対比較して不具合領域DRを検出する。
例えば、図6に示す同一地点SPを撮像した「A」~「F」の撮像画像FIにおいて、圃場FDの水面に映った太陽が写り込んだ場合、不具合検出部36は太陽が写り込んだ領域を不具合領域DRとして検出する。この時、「C」の撮像画像FI上の同一地点SPを含む所定領域の領域画像Prは不具合領域DRと重なっている。なお、領域画像Prの大きさ(範囲)は撮像画像FIの大きさ(範囲)よりも小さい。
次に、合成部34は、同一地点SPを含む6枚の領域画像Prについて、「C」の領域画像Prを使用せずに、残り5枚の領域画像Prを用いて同一地点SPを含む領域画像Pr内の各画素のNDVIの平均値を導出する。これにより、不具合領域DRが除去された同一地点SPの地点画像PI(図7参照)が形成される。その他の同一地点SPの領域画像Prについても同様に不具合領域DRが除去された地点画像PIが形成される。以上により、不具合領域DRが除去された複数の地点画像PIN(図7参照)が形成される。なお、「N」は複数の地点画像PIのそれぞれに割り当てられたシリアル番号であり、複数の地点画像PIの総数がKである場合に1からKまでの整数である。
なお、本実施形態において同一地点SPを含む6枚の領域画像Prについて、不具合領域DRが検出されない場合には合成部34は6枚全ての領域画像Prを用いて同一地点SPを含む領域画像Pr内の各画素のNDVIの平均値を導出する。なお、領域画像Prの画像補正により、不具合領域DRのNDVIを補正できる場合には補正後の領域画像Prを用いてもよい。
次に、複数の地点画像PIを合成して合成画像CIを形成する画像合成工程について説明する。合成部34は、不具合領域DRが除去された複数の地点画像PINの各々における緯度XN、経度YN、高度ZN及び方位θNに基づいて、アフィン変換を行う画像変換行列を導出する。複数の地点画像PINの各々は、地点画像PINを形成する際に用いられた可視画像および近赤外画像の各々の撮像時における可視撮像部20及び近赤外撮像部21の緯度XN、経度YN、高度ZN及び方位θNを備える。合成部34は、複数の地点画像PINの各々について、地点画像PINの画素位置を地点画像PINの備える緯度XN、経度YN、高度ZN及び方位θNに基づくアフィン変換を行う。これにより、地点画像PIの画素位置を合成画像CIにおける画素位置へ変換する。
図7は画像合成工程を説明するための図を示している。図7の上段は複数の地点画像PINを示し、図7の下段は合成画像CIの座標系を示す。アフィン変換は、公知のように線形変換と平行移動(並進)とを組み合わせた変換であり、数式1により表される(例えば、「アフィン変換とは」、[online]、[2017年5月15日検索]、インターネット(URL:http//d.hatena.ne.jp/Zellij/20120523/p1))。

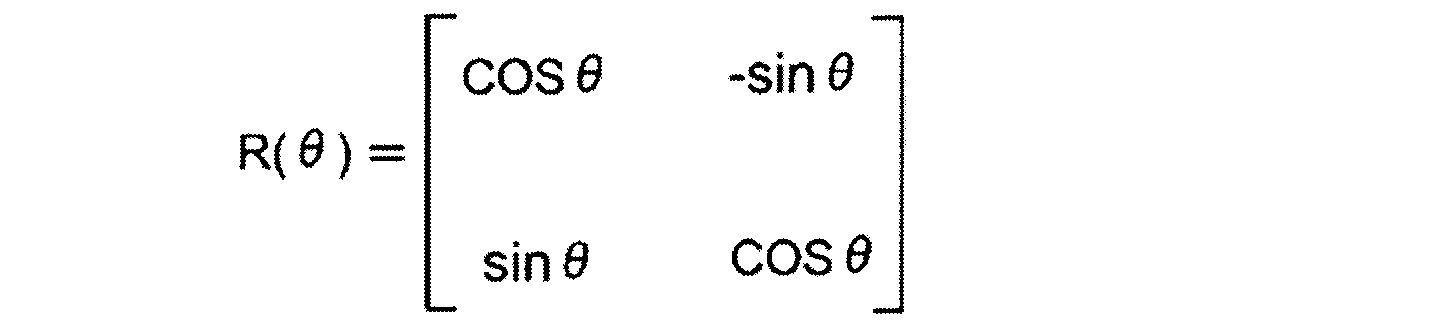
数式1における右辺の列ベクトル(x,y)は図7の上段に示すように地点画像PIでの画素位置であり(N番目の地点画像PINではx=xN、y=yN)、列ベクトル(x´,y´)は図7の下段に示すように合成画像CIの座標系での画素位置を示す。数式1の右辺第1項における1行1列、1行2列、2行1列及び2行2列の各成分a、b、c、dから成る2行2列の行列は回転の変換行列R(θ)を表し、数式1の右辺第2項の列ベクトル(tx,ty)は並進(平行移動)の変換行列を表す。
回転の変換行列R(θ)における各成分a、b、c、dは、方位測定部47の値θから、数式2によって与えられる(N番目の地点画像PINではθ=θN)。なお、撮像工程時の撮像部2の実際の高度が基準高度(設定高度H、図5参照)と異なる場合には、回転行列R(θ)に撮像工程時の撮像部2の実際の高度が基準高度と同等になるように撮像工程時の実際の高度に応じたスケーリング係数が乗算される。例えば、成分aはcosθにスケーリング係数を乗算した値である。
そして、並進(平行移動)の変換行列における各成分tx、tyは数式3及び数式4で与えられる。数式3及び数式4では、合成画像CIの座標系における原点(0,0)からの距離d[m]と、水平方向(x軸)との角度φ[rad]を緯度X及び経度Yから導出して画素数に変換する。


数式3及び数式4の係数kはメートルを画素数に変換する係数である。例えば、第1イメージセンサ及び第2イメージセンサの画素数が480画素の場合には係数k=24.85[m]/480[画素]≒0.052[m/画素]となる。また、距離d[m]及び角度φ[rad]の算出方法は公知であり、数式5及び数式6によって与えられる(例えば「2地点間の距離と方位角」、[online]、[2017年5月22日検索]、インターネット(URL:http//keisan.casio.jp/exec/system/1257670779))。
なお、数式5及び数式6のX1及びY1はそれぞれA地点の緯度及び経度であり、数式5及び数式6のX2及びY2はそれぞれB地点の緯度及び経度である。数式5のrは地球を球体とみなした際の赤道半径(=6378.137km)である。ここでは、A地点またはB地点が合成画像CIの座標系における原点(0,0)となる。


また、数式1の回転行列と並進(平行移動)の変換行列とを単一の行列M(3行3列の行列)にまとめて数式7のように表現することができる。
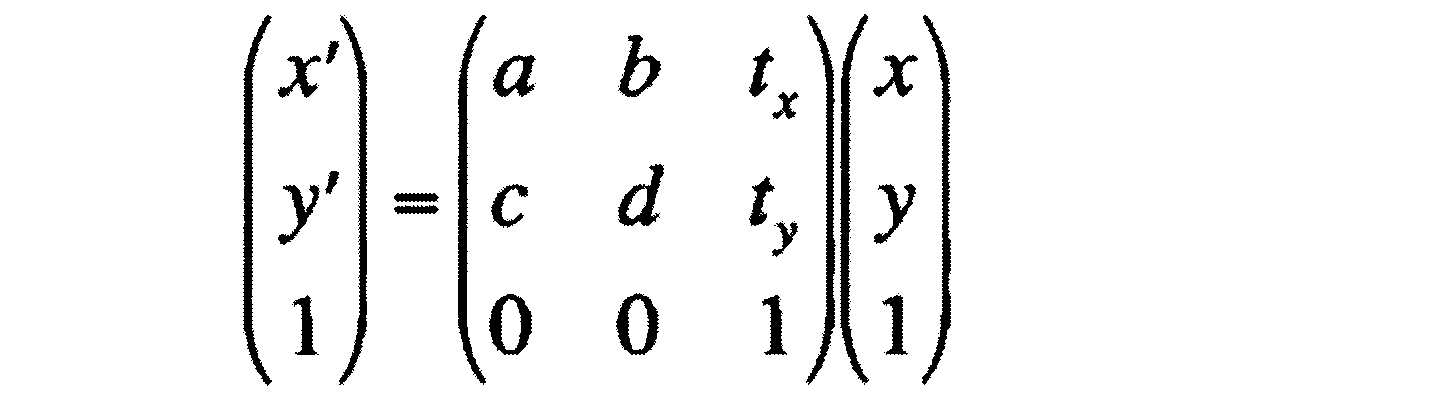
なお、変換後の位置(x´,y´)における画素のNDVIを実際に求める際には、まず行列Mの逆行列であるM-1を導出し、変換後の(x´,y´)の対応位置(x、y)を数式8により導出する。
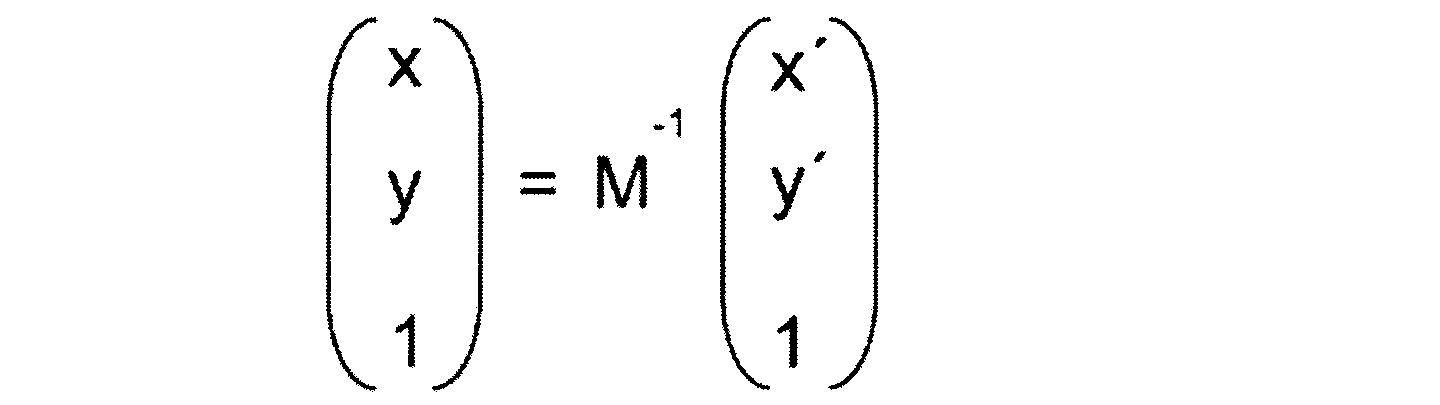
そして、数式8により得られる変換前の位置(x,y)における画素のNDVIまたは当該位置近傍に存在する複数の画素のNDVIによって補間(線形補間等)されるNDVIを変換後の位置(x´,y´)における画素のNDVIとして決定する。
以上の合成画像CIの形成工程により、一の圃場FDの全体画像を得ることができる。なお、他の圃場FDについても同様に全体画像を得ることができる。
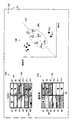
次に、NDVI(栽培情報)及び植被率(栽培情報)が標準範囲NR内か否かを圃場FD(栽培領域)別に表示部31に表示する表示工程について説明する。図8は表示工程を示す図である。図9は表示工程の完了時に表示部31に表示されるデータ表示画面DSの一例を示す図である。表示工程は、読込工程、近似曲線導出工程、標準範囲決定工程、散布図形成工程及びマップ形成工程を有する。
読込工程では比較部38は記憶部33から複数の圃場FD(本実施形態では、#1~#12の圃場FD)の合成画像CIの全画素に対応するNDVI及び植被率を読み込む。なお、#1~#12の圃場FDでは同一品種の作物PL(例えば、こしひかり米)を栽培しており、栽培方法は同じになっている。近似曲線導出工程では、比較部38は各圃場FDについてNDVI及び植被率の平均値をそれぞれ導出する。そして、複数の圃場FDに関して、各圃場FDのNDVIの平均値及び植被率の平均値に基づいて例えば最小二乗法を用いて近似曲線AC(近似直線を含む)を導出する。すなわち、比較部38は2個のパラメータ(NDVI、植被率)の関係を近似する近似曲線ACを導出する。なお、本実施形態では、2個のパラメータ(NDVI、植被率)の関係を近似する近似曲線ACは近似直線となっている。
標準範囲決定工程では比較部38は近似曲線ACから所定の偏位量の範囲を標準範囲NR(図9において破線で囲まれた領域)として決定する。偏位量は例えば近似曲線ACからの距離になる。すなわち、標準範囲NRはNDVI(パラメータ)と植被率(パラメータ)との相関に基づいている。なお、パラメータの種類によっては近似曲線ACは一次関数ではなく二次関数等で表現される場合がある。この場合には、当該パラメータの二乗値を「パラメータ」とする。
散布図形成工程では、表示部31はNDVI及び植被率を座標軸とする散布図100を形成する。散布図100はNDVI及び植被率をそれぞれ横軸及び縦軸とする二次元直交座標で表されている。この時、表示部31はNDVI及び植被率が標準範囲NR内の#2、#4の圃場FDを三角印(マーキング)により表示し、NDVI及び植被率が標準範囲NR内の#3、#10の圃場FDを四角印(マーキング)により表示し、NDVI及び植被率が標準範囲NR内の#5、#6、#9の圃場FDを丸印(マーキング)により表示している。すなわち、表示部31は標準範囲NR内でNDVI及び植被率が低い圃場FD、中程度の圃場FD及び高い圃場FDをそれぞれ三角印、四角印及び丸印により表示する。これにより、使用者は標準範囲NR内の圃場FDでの作物PLの生育の速さの違いを容易に認識することができる。なお、散布図100において標準範囲NR内の圃場FDのNDVI及び植被率は肥料量等の増減により近似曲線ACに沿って移動する可能性が高くなっており、標準範囲NR内の圃場FDでは異常箇所(例えば土壌流失や水門の故障等)のある可能性は低くなっている。
なお、表示部31は標準範囲NR内の圃場FDをすべて同じ印により表示してもよい。
また、表示部31はNDVI及び植被率が標準範囲NR外の#1、#7、#8の圃場FDを菱形印(マーキング)により表示し、NDVI及び植被率が標準範囲NR外の#11、#12の圃場FDを星形印(マーキング)により表示する。すなわち、表示部31はNDVI及び植被率が標準範囲NR内の圃場FDと標準範囲NR外の圃場FDとを異なるマーキングにより表示する。
マップ形成工程では、表示部31は、記憶部33に記憶されている#1~#12の圃場FDの合成画像CI(NDVI画像及び植被率画像)に基づいて、NDVI及び植被率で表した#1~#12の圃場FDのマップ200、210(図9参照)をそれぞれ形成する。マップ200において等高線A1、A2、A3の順にNDVIが高くなり、マップ210において等高線B1、B2、B3の順に植被率が高くなっている。なお、マップ200、210はアフィン変換等を用いて形成される。散布図100及びマップ200、210のデータは記憶部33に記憶される。
また、表示部31は、マップ200、210において、NDVI及び植被率が標準範囲NR外の圃場FD上にマーキングを表示する。本実施形態では散布図100と同様にマップ200、210の#1、#7、#8の圃場FD上に菱形印を表示し、マップ200、210の#11、#12の圃場FD上に星形印を表示している。
散布図100及びマップ200、210により使用者は#1、#7、#8、#11、#12の圃場FDのNDVI及び植被率が標準範囲NRから逸脱していることを容易に認識することができる。すなわち、#1、#7、#8、#11、#12の圃場FDでは作物の生育状態が#1~#12の圃場FDで予測される作物PLの生育状態から外れており、使用者は圃場FDの状況が悪い(圃場FDに異常箇所等がある)ことを容易に認識することができる。そして、使用者は#1、#7、#8、#11、#12の圃場FDについて対策を講じることができる。対策としては例えば肥料の散布時期の変更、圃場FDの土壌の確認、圃場FDに水を供給する用水路や水門の点検等である。
また、表示部31は、標準範囲NR外の圃場FDについて、図9において近似曲線ACよりも上側の#1、#7、#8の圃場FDと、近似曲線ACよりも下側の#11、#12の圃場FDとを異なるマーキングにより表示している。これにより、#1、#7、#8の圃場FDに対して講ずべき対策と、#11、#12の圃場FDに対して講ずべき対策とが異なることを使用者は容易に認識することができる。
具体的には、#11、#12の圃場FDではNDVIの高さに対して植被率が低く、使用者は例えば苗の植え付け後の気温低下等で根づきが悪いと予想でき、標準範囲NR内の圃場FDの肥料量(標準量)と同じ量の肥料を標準範囲NR内の圃場FDよりも遅い時期に散布するという対策を講ずることができる。一方、#1、#7、#8の圃場FDでは植被率の高さに対してNDVIが低く、使用者は例えば茎数は多いが葉の葉緑素濃度が低いと予想でき、標準範囲NR内の圃場FDの肥料量(標準量)と同じ量の肥料を標準範囲NR内の圃場FDよりも早い時期に散布するという対策を講ずることができる。なお、「肥料量」とは1m2当たりの肥料量を示す。
また、本実施形態では、散布図100及びマップ200、210が表示部31に同時に一覧表示される。これにより、使用者は各圃場FDの状況及び異常箇所を有する圃場FDの位置を容易に把握することができる。
なお、本実施形態ではパラメータとしてNDVI及び植被率を用いているが、一のパラメータがNDVIまたは植被率の生育指標から成り、他のパラメータが月または年等の時間から成ってもよい。
また、本実施形態では散布図100は二次元直交座標により表現されているが、これに替えて、圃場FD単位、農家単位、地域単位のNDVI等の生育指標の平均値を用いた1次元座標により表わされてもよい。
また、撮像部2を遠赤外カメラ等により構成し、圃場FDの熱画像を撮像してもよい。熱画像の温度値(生育指標、パラメータ)が高いほど作物PLの葉の蒸散が大きいことを表し、熱画像の温度値と作物PLの病気や根の張り具合(栄養素の吸収率)との間には正の相関関係が成立する。
また、LIDAR(Laser Imaging Detection and Ranging)技術を用いた3次元計測器(例えばスキャン型レーザー距離計)を使用し、作物PLの草丈(高さ情報)を生育指標、パラメータとしてもよい。
本実施形態によると、作物PLを栽培する複数の圃場FD(栽培領域)別に作物PLに関するNDVI(栽培情報、パラメータ)及び植被率(栽培情報、パラメータ)を出力する撮像部2(栽培情報出力部)及び生育指標導出部37(栽培情報出力部)と、NDVIと植被率との相関に基づく標準範囲NRとNDVI及び植被率とを圃場FD毎に比較する比較部38と、比較部38の比較結果に基づいてNDVI及び植被率が標準範囲NR内か否かを圃場FD別に表示する表示部31と、を備えている。これにより、使用者はNDVI及び植被率が標準範囲NRから逸脱している圃場FDを容易に認識することができる。したがって、使用者は各圃場FDの状況の可否を容易に判断することができ、状況の悪い(異常箇所等を有する)圃場FDについて対策を講じることができる。その結果、作物栽培支援装置1の使用性を向上させることができる。
なお、本実施形態において、表示部31は圃場FD別に表示しているが、農家別や地域別に表示してもよい。
また、栽培情報出力部が、圃場FDで反射する太陽光に含まれる所定波長の光を検知する第1、第2イメージセンサ(光学センサ)と、第1、第2イメージセンサの検知結果に基づいて圃場FD内の作物PLの生育状態を示すNDVI(生育指標)及び植被率(生育指標)を導出する生育指標導出部37とを有し、作物に関する栽培情報がNDVI及び植被率から成る。これにより、生育指標を用いることで使用者は圃場FDの状況をより正確に把握することができる。
また、表示部31はNDVI(パラメータ)及び植被率(パラメータ)を座標軸とする散布図100を形成する。表示部31はNDVI及び植被率が標準範囲NR内の圃場FDと標準範囲NR外の圃場FDとを異なるマーキングにより表示する。これにより、使用者は状況の悪い圃場FDをより容易に認識することができる。
なお、表示部31はNDVI及び植被率が標準範囲NR内の圃場FDと標準範囲NR外の圃場FDとを異なる色のマーキングにより表示してもよい。例えば、標準範囲NR内の圃場FDを黒色のマーキングにより表示し、標準範囲NR外の圃場FDを赤色のマーキングにより表示してもよい。
また、表示部31は複数の圃場FDのマップ200、210を形成する。表示部31はNDVI及び植被率が標準範囲NR外の圃場FD上にマーキングを表示する。これにより、使用者は状況の悪い圃場FDの位置を容易に把握することができる。また、状況の悪い圃場FDの異常箇所等がその圃場FDの位置に起因するか否かを使用者は予測することができる。
また、比較部38がNDVI(パラメータ)と植被率(パラメータ)との関係を近似する近似曲線ACを導出し、近似曲線ACから所定の偏位量の範囲を標準範囲NRとする。これにより、標準範囲NRを容易に決定することができる。
また、NDVI(パラメータ)及び植被率(パラメータ)は作物PLに関する栽培情報から成る。これにより、作物PLに関するパラメータの相関に基づく標準範囲NRを決定することができ、使用者は圃場FDの状況の可否をより正確に判断することができる。
なお、一のパラメータが栽培情報から成り、他のパラメータが月または年等の時間から成ってもよい。これにより、使用者は時系列で圃場FDの状況の可否をより正確に判断することができる。
また、作物PLを栽培する圃場FD(栽培領域)の上空を移動して圃場FDを撮像する可視撮像部20(撮像部)及び近赤外撮像部21(撮像部)と、可視撮像部20及び近赤外撮像部21の位置を検出する位置検出部48と、圃場FDの同一地点SPの地点画像PIを可視撮像部20及び近赤外撮像部21で撮像した複数の撮像画像FIに基づいて形成するとともに複数の地点画像PIを合成する合成部34とを備える。また、撮像画像FI上の不具合を有した不具合領域DRを検出する不具合検出部36を設け、合成部34が不具合検出部36により検出した不具合領域DRを除いて地点画像PIを形成する。
これにより、不具合領域DRが除かれた地点画像PIを形成し、複数の地点画像PIを合成する。したがって、圃場FD全体の合成画像の品質が向上し、作物PLの生育状態の判断に有用な画像を提供することができる。
また、不具合検出部36が一の撮像画像FI内を区分した複数の領域のNDVI(特性値)を相対比較して不具合領域DRを検出する。これにより、不具合検出部36は不具合領域DRを容易に検出することができる。
なお、不具合検出部36が複数の撮像画像FIの同一地点SPに対する複数の領域のNDVI(特性値)を相対比較して不具合領域DRを検出してもよい。この場合でも、不具合検出部36は不具合領域DRを容易に検出することができる。
また、不具合検出部36が一の撮像画像FI内を区分した複数の領域の特性値と所定の閾値とを比較して不具合領域DRを検出してもよい。この場合でも、不具合検出部36は不具合領域DRを容易に検出することができる。
また、不具合検出部36が各撮像画像FIの周部Phを不具合領域DRと判定してもよい。これにより、撮像画像FIの周辺部PhのNDVIが中心部CPのNDVIよりも低下するシェーディング誤差による合成画像CIの品質低下を容易に防止することができる。
また、可視画像を撮像する可視撮像部20と、近赤外画像を撮像する近赤外撮像部21とを有し、不具合検出部36は、可視画像の画素と近赤外画像の画素とのずれ量が所定量よりも大きい領域を不具合領域DRと判定してもよい。これにより、可視撮像部20と近赤外撮像部21との視差による可視画素と近赤外画素とのズレによる誤差に起因する合成画像CIの品質低下を容易に防止することができる。
また、制御部39は可視撮像部20及び近赤外撮像部21の位置、画角及び画素数に基づいて地点画像PIの位置を導出する。これにより、地点画像PIの位置を容易に導出することができる。
なお、情報端末3がインターネット等の所定のネットワークに接続され、撮像画像FI、地点画像PI及び合成画像CIを記憶する記憶部がネットワーク上に設けられてもよい。これにより、記憶部33の容量を小さくすることができる。
<第2実施形態>
次に、本発明の第2実施形態について説明する。図10は第2実施形態の作物栽培支援装置1の表示工程を示す図である。図11は第2実施形態の表示部31のデータ表示画面DSの一例を示す図である。説明の便宜上、図1~図9に示す第1実施形態と同様の部分には同一の符号を付している。本実施形態では、表示部31に表示される散布図100の座標軸が第1実施形態とは異なっている。また、第1実施形態では表示部31にマップ200、210の両方を表示したが、本実施形態ではこのうちマップ200のみを表示している。その他の部分は第1実施形態と同様である。
次に、本発明の第2実施形態について説明する。図10は第2実施形態の作物栽培支援装置1の表示工程を示す図である。図11は第2実施形態の表示部31のデータ表示画面DSの一例を示す図である。説明の便宜上、図1~図9に示す第1実施形態と同様の部分には同一の符号を付している。本実施形態では、表示部31に表示される散布図100の座標軸が第1実施形態とは異なっている。また、第1実施形態では表示部31にマップ200、210の両方を表示したが、本実施形態ではこのうちマップ200のみを表示している。その他の部分は第1実施形態と同様である。
本実施形態の表示工程は、栽培情報入力工程、近似曲線読出工程、標準範囲決定工程、散布図形成工程及びマップ形成工程を有する。栽培情報入力工程では操作部32を介して#1~#12の圃場FDの収量差(栽培情報、パラメータ)及び施肥量差(栽培情報、パラメータ)が入力される。すなわち、操作部32は収量差及び施肥量差の入力操作を受け付けて出力する。これにより、栽培情報出力部は操作部32を有する。収量差は比較する直近2年間の作物PLの収量の差(単位:kg/圃場)を示し、施肥量差は比較する直近2年間の施肥量(散布した肥料の量)の差(単位:kg/m2)を示している。
本実施形態において、収量差と施肥量差との相関関係は公知であり、収量差と施肥量差との関係を近似する近似曲線ACは記憶部33に予め記憶されている。近似曲線読出工程では、比較部38が記憶部33から収量差と施肥量差との関係を近似する近似曲線ACを読み出す。標準範囲決定工程では、第1実施形態と同様に、比較部38は該近似曲線ACから所定の偏位量の範囲を標準範囲NRと決定する。
散布図形成工程では、表示部31は収量差及び施肥量差を座標軸とする散布図100を形成する。散布図100は施肥量差及び収量差をそれぞれ横軸及び縦軸とする二次元直交座標により表される。この時、表示部31は収量差及び施肥量差が標準範囲NR内の#2~#6、#9、#10の圃場FDを白丸印(マーキング)により表示する。また、表示部31は標準範囲NR外の#1、#7、#8、#11、#12の圃場FDを黒丸印(マーキング)により表示する。すなわち、表示部31は収量差及び施肥量差が標準範囲NR内の圃場FDと標準範囲NR外の圃場FDとを異なるマーキングにより表示する。
マップ形成工程では、表示部31は現状のマップ200を作成する。そして、第1実施形態と同様に、表示部31はNDVIが標準範囲NR外の#1、#7、#8、#11、#12の圃場FD上に黒丸印を表示する。
本実施形態によると、第1実施形態と同様の効果を得ることができる。また、栽培情報出力部が、収量差(栽培情報)及び施肥量差(栽培情報)の入力操作を受け付けて出力する操作部32を有する。これにより、使用者は所望の栽培情報を入力し、表示部31は栽培情報が標準範囲NR内か否かを圃場FD別に表示することができる。
また、収量差(パラメータ)と施肥量差(パラメータ)との関係を近似する近似曲線ACが予め記憶部33に記憶され、比較部38が近似曲線ACから所定の偏位量の範囲を標準範囲NRとする。これにより、複数のパラメータの公知の相関関係を利用し、第1実施形態の近似曲線導出工程を省くことができる。
なお、第2実施形態において、表示部31はマップ200、210の両方を表示してもよく、マップ200に替えてマップ210を表示してもよい。
また、第1実施形態及び第2実施形態において、表示部31は散布図100、マップ200を同時に一覧表示しているが、散布図100のみを表示してもよくマップ200のみを表示してもよい。表示部31が散布図100及びマップ200を同時に一覧表示すると、使用者は圃場FDの状況及び異常箇所を有する圃場FDの位置を容易に把握できるためより望ましい。
<その他>
以上で説明した各実施形態の作物栽培支援装置は、以下のように表現されてもよい。
以上で説明した各実施形態の作物栽培支援装置は、以下のように表現されてもよい。
すなわち、以上で説明した作物栽培支援装置は、作物を栽培する複数の栽培領域別に作物に関する所定の栽培情報を出力する栽培情報出力部と、前記栽培情報を含む複数のパラメータの相関に基づく所定の標準範囲と前記栽培情報とを前記栽培領域毎に比較する比較部と、前記比較部の比較結果に基づいて前記栽培情報が前記標準範囲内か否かを前記栽培領域別に表示する表示部と、を備える。
上記構成の作物栽培支援装置において、前記栽培情報出力部が、前記栽培領域で反射する太陽光に含まれる所定波長の光を検知する光学センサと、前記光学センサの検知結果に基づいて前記栽培領域内の作物の生育状態を示す生育指標を導出する生育指標導出部とを有し、前記栽培情報が前記生育指標から成ることが好ましい。
上記構成の作物栽培支援装置において、前記栽培情報出力部が、前記栽培情報の入力操作を受け付けて出力する操作部を有することが好ましい。
上記構成の作物栽培支援装置において、前記表示部は複数の前記パラメータを座標軸とする散布図を形成し、前記栽培情報が前記標準範囲内の前記栽培領域と前記標準範囲外の前記栽培領域とを異なるマーキングにより表示することが好ましい。
上記構成の作物栽培支援装置において、前記表示部は複数の前記栽培領域のマップを形成し、前記栽培情報が前記標準範囲外の前記栽培領域上に所定のマーキングを表示することが好ましい。
上記構成の作物栽培支援装置において、前記比較部が複数の前記パラメータの関係を近似する近似曲線を導出し、前記近似曲線から所定の偏位量の範囲を前記標準範囲とすることが好ましい。
上記構成の作物栽培支援装置において、複数の前記パラメータの関係を近似する近似曲線が予め記憶され、前記比較部が前記近似曲線から所定の偏位量の範囲を前記標準範囲とすることが好ましい。
上記構成の作物栽培支援装置において、複数の前記パラメータがそれぞれ前記栽培情報から成ることが好ましい。
上記構成の作物栽培支援装置において、一の前記パラメータが前記栽培情報から成り、他の前記パラメータが時間から成ることが好ましい。
以上、本発明の実施形態につき説明したが、本発明の範囲はこれに限定されるものではなく、発明の主旨を逸脱しない範囲で種々の変更を加えて実施することができる。
本発明は、作物の栽培を支援する作物栽培支援装置に利用することができる。
1 作物栽培支援装置
2 撮像部
3 情報端末
4 飛行体
20 可視撮像部
21 近赤外撮像部
31 表示部
32 操作部
33 記憶部
34 合成部
35 接続部
36 不具合検出部
37 生育指標導出部
38 比較部
43 記憶部
45 接続部
48 位置検出部
100 散布図
200、210 マップ
DR 不具合領域
FD 圃場
FI 撮像画像
PI 地点画像
PL 作物
SP 同一地点
2 撮像部
3 情報端末
4 飛行体
20 可視撮像部
21 近赤外撮像部
31 表示部
32 操作部
33 記憶部
34 合成部
35 接続部
36 不具合検出部
37 生育指標導出部
38 比較部
43 記憶部
45 接続部
48 位置検出部
100 散布図
200、210 マップ
DR 不具合領域
FD 圃場
FI 撮像画像
PI 地点画像
PL 作物
SP 同一地点
Claims (9)
- 作物を栽培する複数の栽培領域別に作物に関する所定の栽培情報を出力する栽培情報出力部と、
前記栽培情報を含む複数のパラメータの相関に基づく所定の標準範囲と前記栽培情報とを前記栽培領域毎に比較する比較部と、
前記比較部の比較結果に基づいて前記栽培情報が前記標準範囲内か否かを前記栽培領域別に表示する表示部と、
を備えた、作物栽培支援装置。 - 前記栽培情報出力部が、前記栽培領域で反射する太陽光に含まれる所定波長の光を検知する光学センサと、前記光学センサの検知結果に基づいて前記栽培領域内の作物の生育状態を示す生育指標を導出する生育指標導出部とを有し、前記栽培情報が前記生育指標から成る、請求項1に記載の作物栽培支援装置。
- 前記栽培情報出力部が、前記栽培情報の入力操作を受け付けて出力する操作部を有する、請求項1または請求項2に記載の作物栽培支援装置。
- 前記表示部は複数の前記パラメータを座標軸とする散布図を形成し、前記栽培情報が前記標準範囲内の前記栽培領域と前記標準範囲外の前記栽培領域とを異なるマーキングにより表示する、請求項1~請求項3のいずれかに記載の作物栽培支援装置。
- 前記表示部は複数の前記栽培領域のマップを形成し、前記栽培情報が前記標準範囲外の前記栽培領域上に所定のマーキングを表示する、請求項1~請求項4のいずれかに記載の作物栽培支援装置。
- 前記比較部が複数の前記パラメータの関係を近似する近似曲線を導出し、前記近似曲線から所定の偏位量の範囲を前記標準範囲とする、請求項1~請求項5のいずれかに記載の作物栽培支援装置。
- 複数の前記パラメータの関係を近似する近似曲線が予め記憶され、前記比較部が前記近似曲線から所定の偏位量の範囲を前記標準範囲とする、請求項1~請求項5のいずれかに記載の作物栽培支援装置。
- 複数の前記パラメータがそれぞれ前記栽培情報から成る、請求項1~請求項7のいずれかに記載の作物栽培支援装置。
- 一の前記パラメータが前記栽培情報から成り、他の前記パラメータが時間から成る、請求項1~請求項7のいずれかに記載の作物栽培支援装置。
Priority Applications (2)
| Application Number | Priority Date | Filing Date | Title |
|---|---|---|---|
| CN201880054787.6A CN111095339A (zh) | 2017-09-01 | 2018-07-19 | 作物栽培支持装置 |
| JP2019539050A JP6996560B2 (ja) | 2017-09-01 | 2018-07-19 | 作物栽培支援装置 |
Applications Claiming Priority (2)
| Application Number | Priority Date | Filing Date | Title |
|---|---|---|---|
| JP2017168585 | 2017-09-01 | ||
| JP2017-168585 | 2017-09-01 |
Publications (1)
| Publication Number | Publication Date |
|---|---|
| WO2019044244A1 true WO2019044244A1 (ja) | 2019-03-07 |
Family
ID=65526303
Family Applications (1)
| Application Number | Title | Priority Date | Filing Date |
|---|---|---|---|
| PCT/JP2018/027072 Ceased WO2019044244A1 (ja) | 2017-09-01 | 2018-07-19 | 作物栽培支援装置 |
Country Status (3)
| Country | Link |
|---|---|
| JP (1) | JP6996560B2 (ja) |
| CN (1) | CN111095339A (ja) |
| WO (1) | WO2019044244A1 (ja) |
Cited By (9)
| Publication number | Priority date | Publication date | Assignee | Title |
|---|---|---|---|---|
| JP2021058136A (ja) * | 2019-10-07 | 2021-04-15 | Ckd株式会社 | 混成栽培システム |
| JP2021078409A (ja) * | 2019-11-19 | 2021-05-27 | キヤノン株式会社 | 撮像装置、情報処理装置、情報処理システム、データの生成方法、およびプログラム |
| WO2021132276A1 (ja) * | 2019-12-27 | 2021-07-01 | 株式会社クボタ | 農業支援システム |
| JPWO2021193442A1 (ja) * | 2020-03-27 | 2021-09-30 | ||
| JP2022119973A (ja) * | 2022-05-23 | 2022-08-17 | 珠海翔翼航空技術有限公司 | 画像識別に基づく飛行体強制着陸経路計画方法、システムおよび装置 |
| JP2023031167A (ja) * | 2021-08-24 | 2023-03-08 | エヌ・ティ・ティ・コミュニケーションズ株式会社 | 芝管理サーバ、芝管理方法及び芝管理プログラム |
| JP2023077236A (ja) * | 2021-11-24 | 2023-06-05 | ヤンマーホールディングス株式会社 | 圃場管理方法、圃場管理システムおよび圃場管理プログラム |
| JP2023119943A (ja) * | 2022-02-17 | 2023-08-29 | 国立研究開発法人農業・食品産業技術総合研究機構 | 栽培環境調査方法及び栽培環境調査プログラム、並びに栽培管理方法及び栽培管理プログラム |
| JP2024519053A (ja) * | 2021-05-19 | 2024-05-08 | ビーエーエスエフ アグロ トレードマークス ゲーエムベーハー | 薬剤による圃場処理のための区域固有散布マップを生成する方法 |
Families Citing this family (2)
| Publication number | Priority date | Publication date | Assignee | Title |
|---|---|---|---|---|
| WO2021226273A1 (en) * | 2020-05-07 | 2021-11-11 | E. & J. Gallo Winery | System and method for managing and processing agricultural field data |
| CN112987779A (zh) * | 2021-02-03 | 2021-06-18 | 湖南祥柏生态环保科技有限公司 | 基于环形作业的种植区 |
Citations (2)
| Publication number | Priority date | Publication date | Assignee | Title |
|---|---|---|---|---|
| JP2007310463A (ja) * | 2006-05-16 | 2007-11-29 | Hitachi Software Eng Co Ltd | 圃場管理支援方法及びシステム |
| US20160223506A1 (en) * | 2015-01-30 | 2016-08-04 | AgriSight, Inc. | System and method for crop health monitoring |
Family Cites Families (4)
| Publication number | Priority date | Publication date | Assignee | Title |
|---|---|---|---|---|
| CN103971199B (zh) * | 2014-04-08 | 2017-09-05 | 武汉禾讯农业信息科技有限公司 | 一种大范围农作物长势的遥感评级方法 |
| JP2016049102A (ja) * | 2014-08-29 | 2016-04-11 | 株式会社リコー | 圃場管理システム、圃場管理方法、プログラム |
| JP6507927B2 (ja) * | 2015-08-12 | 2019-05-08 | コニカミノルタ株式会社 | 植物生育指標測定装置、該方法および該プログラム |
| CN106780091B (zh) * | 2016-12-30 | 2020-11-06 | 中国科学院东北地理与农业生态研究所 | 基于植被指数时空间统计特征的农业灾害信息遥感提取方法 |
-
2018
- 2018-07-19 CN CN201880054787.6A patent/CN111095339A/zh active Pending
- 2018-07-19 WO PCT/JP2018/027072 patent/WO2019044244A1/ja not_active Ceased
- 2018-07-19 JP JP2019539050A patent/JP6996560B2/ja not_active Expired - Fee Related
Patent Citations (2)
| Publication number | Priority date | Publication date | Assignee | Title |
|---|---|---|---|---|
| JP2007310463A (ja) * | 2006-05-16 | 2007-11-29 | Hitachi Software Eng Co Ltd | 圃場管理支援方法及びシステム |
| US20160223506A1 (en) * | 2015-01-30 | 2016-08-04 | AgriSight, Inc. | System and method for crop health monitoring |
Cited By (18)
| Publication number | Priority date | Publication date | Assignee | Title |
|---|---|---|---|---|
| JP7215984B2 (ja) | 2019-10-07 | 2023-01-31 | Ckd株式会社 | 混成栽培システム |
| JP2021058136A (ja) * | 2019-10-07 | 2021-04-15 | Ckd株式会社 | 混成栽培システム |
| JP2021078409A (ja) * | 2019-11-19 | 2021-05-27 | キヤノン株式会社 | 撮像装置、情報処理装置、情報処理システム、データの生成方法、およびプログラム |
| JP7330867B2 (ja) | 2019-11-19 | 2023-08-22 | キヤノン株式会社 | 撮像装置、情報処理装置、情報処理システム、データの生成方法、およびプログラム |
| JP7321928B2 (ja) | 2019-12-27 | 2023-08-07 | 株式会社クボタ | 農業支援システム |
| WO2021132276A1 (ja) * | 2019-12-27 | 2021-07-01 | 株式会社クボタ | 農業支援システム |
| JP2021106554A (ja) * | 2019-12-27 | 2021-07-29 | 株式会社クボタ | 農業支援システム |
| JPWO2021193442A1 (ja) * | 2020-03-27 | 2021-09-30 | ||
| JP7439905B2 (ja) | 2020-03-27 | 2024-02-28 | 日本電気株式会社 | 植生観測装置、植生観測システム、植生観測方法及び植生観測プログラム |
| JP2024519053A (ja) * | 2021-05-19 | 2024-05-08 | ビーエーエスエフ アグロ トレードマークス ゲーエムベーハー | 薬剤による圃場処理のための区域固有散布マップを生成する方法 |
| JP2023031167A (ja) * | 2021-08-24 | 2023-03-08 | エヌ・ティ・ティ・コミュニケーションズ株式会社 | 芝管理サーバ、芝管理方法及び芝管理プログラム |
| JP7674197B2 (ja) | 2021-08-24 | 2025-05-09 | エヌ・ティ・ティ・コミュニケーションズ株式会社 | 芝管理サーバ、芝管理方法及び芝管理プログラム |
| JP2023077236A (ja) * | 2021-11-24 | 2023-06-05 | ヤンマーホールディングス株式会社 | 圃場管理方法、圃場管理システムおよび圃場管理プログラム |
| JP7813564B2 (ja) | 2021-11-24 | 2026-02-13 | ヤンマーホールディングス株式会社 | 圃場管理方法、圃場管理システムおよび圃場管理プログラム |
| JP2023119943A (ja) * | 2022-02-17 | 2023-08-29 | 国立研究開発法人農業・食品産業技術総合研究機構 | 栽培環境調査方法及び栽培環境調査プログラム、並びに栽培管理方法及び栽培管理プログラム |
| JP7808323B2 (ja) | 2022-02-17 | 2026-01-29 | 国立研究開発法人農業・食品産業技術総合研究機構 | 栽培環境調査方法及び栽培環境調査プログラム、並びに栽培管理方法及び栽培管理プログラム |
| JP7153820B2 (ja) | 2022-05-23 | 2022-10-14 | 珠海翔翼航空技術有限公司 | 画像識別に基づく飛行体強制着陸経路計画方法、システムおよび装置 |
| JP2022119973A (ja) * | 2022-05-23 | 2022-08-17 | 珠海翔翼航空技術有限公司 | 画像識別に基づく飛行体強制着陸経路計画方法、システムおよび装置 |
Also Published As
| Publication number | Publication date |
|---|---|
| CN111095339A (zh) | 2020-05-01 |
| JP6996560B2 (ja) | 2022-01-17 |
| JPWO2019044244A1 (ja) | 2020-08-13 |
Similar Documents
| Publication | Publication Date | Title |
|---|---|---|
| JP6996560B2 (ja) | 作物栽培支援装置 | |
| Gómez-Candón et al. | Assessing the accuracy of mosaics from unmanned aerial vehicle (UAV) imagery for precision agriculture purposes in wheat | |
| US10151839B2 (en) | Systems and methods for determining crop yields with high resolution geo-referenced sensors | |
| JP6384848B1 (ja) | 農業耕作方法 | |
| CN107148633B (zh) | 用于使用无人机系统进行农艺和农业监测的方法 | |
| KR20220049687A (ko) | 저가의 드론 광학 센서를 활용한 식생지수 정확도 평가 방법 | |
| EP3157322A1 (en) | Modular systems and methods for determining crop yields with high resolution geo-referenced sensors | |
| JP7069609B2 (ja) | 作物栽培支援装置 | |
| AU2021351645B2 (en) | Calibration of autonomous farming vehicle image acquisition system | |
| Kavvadias et al. | Precision Agriculture-Comparison and Evaluation of Innovative Very High Resolution (UAV) and LandSat Data. | |
| US20250261578A1 (en) | Precision agriculture using pose georeferenced analtyics | |
| US20210185882A1 (en) | Use Of Aerial Imagery For Vehicle Path Guidance And Associated Devices, Systems, And Methods | |
| Sakamoto et al. | Alternative procedure to improve the positioning accuracy of orthomosaic images acquired with agisoft metashape and DJI P4 multispectral for crop growth observation | |
| Gautam et al. | Footprint determination of a spectroradiometer mounted on an unmanned aircraft system | |
| CN119334892A (zh) | 基于无人机与地面农机的高光谱倾斜摄影系统及方法 | |
| US12236679B2 (en) | Information processing device and information processing method | |
| CN120847115B (zh) | 一种基于多光谱融合的无人机目标识别与定位方法及系统 | |
| Rui et al. | A review of field plant phenotyping platform, sensing and navigation technology | |
| JP2023177352A (ja) | 方法、プログラム及び情報処理装置 | |
| López et al. | Crops diagnosis using digital image processing and precision agriculture technologies | |
| Zhan et al. | AgriLiRa4D: A Multi-Sensor UAV Dataset for Robust SLAM in Challenging Agricultural Fields | |
| Jafarbiglu | Quantitative adjustment of sun-view geometry in areal remote sensing | |
| Izere | Plant height estimation using RTK-GNSS enabled unmanned aerial vehicle (UAV) photogrammetry | |
| CN116543309B (zh) | 一种作物异常信息获取方法、系统、电子设备及介质 | |
| CN118470091A (zh) | 基于无人机遥感的西兰花花球尺寸与位置二维分布实时构建方法及系统 |
Legal Events
| Date | Code | Title | Description |
|---|---|---|---|
| 121 | Ep: the epo has been informed by wipo that ep was designated in this application |
Ref document number: 18850433 Country of ref document: EP Kind code of ref document: A1 |
|
| ENP | Entry into the national phase |
Ref document number: 2019539050 Country of ref document: JP Kind code of ref document: A |
|
| NENP | Non-entry into the national phase |
Ref country code: DE |
|
| 122 | Ep: pct application non-entry in european phase |
Ref document number: 18850433 Country of ref document: EP Kind code of ref document: A1 |