WO2018168807A1 - 血圧測定装置、方法及びプログラム - Google Patents
血圧測定装置、方法及びプログラム Download PDFInfo
- Publication number
- WO2018168807A1 WO2018168807A1 PCT/JP2018/009579 JP2018009579W WO2018168807A1 WO 2018168807 A1 WO2018168807 A1 WO 2018168807A1 JP 2018009579 W JP2018009579 W JP 2018009579W WO 2018168807 A1 WO2018168807 A1 WO 2018168807A1
- Authority
- WO
- WIPO (PCT)
- Prior art keywords
- surge
- blood pressure
- unit
- pressure measurement
- measurement device
- Prior art date
- Legal status (The legal status is an assumption and is not a legal conclusion. Google has not performed a legal analysis and makes no representation as to the accuracy of the status listed.)
- Ceased
Links
Images


Classifications
-
- A—HUMAN NECESSITIES
- A61—MEDICAL OR VETERINARY SCIENCE; HYGIENE
- A61B—DIAGNOSIS; SURGERY; IDENTIFICATION
- A61B5/00—Measuring for diagnostic purposes; Identification of persons
- A61B5/02—Detecting, measuring or recording for evaluating the cardiovascular system, e.g. pulse, heart rate, blood pressure or blood flow
- A61B5/021—Measuring pressure in heart or blood vessels
- A61B5/02108—Measuring pressure in heart or blood vessels from analysis of pulse wave characteristics
- A61B5/02116—Measuring pressure in heart or blood vessels from analysis of pulse wave characteristics of pulse wave amplitude
-
- A—HUMAN NECESSITIES
- A61—MEDICAL OR VETERINARY SCIENCE; HYGIENE
- A61B—DIAGNOSIS; SURGERY; IDENTIFICATION
- A61B5/00—Measuring for diagnostic purposes; Identification of persons
- A61B5/02—Detecting, measuring or recording for evaluating the cardiovascular system, e.g. pulse, heart rate, blood pressure or blood flow
- A61B5/021—Measuring pressure in heart or blood vessels
- A61B5/022—Measuring pressure in heart or blood vessels by applying pressure to close blood vessels, e.g. against the skin; Ophthalmodynamometers
-
- A—HUMAN NECESSITIES
- A61—MEDICAL OR VETERINARY SCIENCE; HYGIENE
- A61B—DIAGNOSIS; SURGERY; IDENTIFICATION
- A61B5/00—Measuring for diagnostic purposes; Identification of persons
- A61B5/02—Detecting, measuring or recording for evaluating the cardiovascular system, e.g. pulse, heart rate, blood pressure or blood flow
- A61B5/021—Measuring pressure in heart or blood vessels
- A61B5/02108—Measuring pressure in heart or blood vessels from analysis of pulse wave characteristics
-
- A—HUMAN NECESSITIES
- A61—MEDICAL OR VETERINARY SCIENCE; HYGIENE
- A61B—DIAGNOSIS; SURGERY; IDENTIFICATION
- A61B5/00—Measuring for diagnostic purposes; Identification of persons
- A61B5/02—Detecting, measuring or recording for evaluating the cardiovascular system, e.g. pulse, heart rate, blood pressure or blood flow
- A61B5/021—Measuring pressure in heart or blood vessels
- A61B5/02141—Details of apparatus construction, e.g. pump units or housings therefor, cuff pressurising systems, arrangements of fluid conduits or circuits
-
- A—HUMAN NECESSITIES
- A61—MEDICAL OR VETERINARY SCIENCE; HYGIENE
- A61B—DIAGNOSIS; SURGERY; IDENTIFICATION
- A61B5/00—Measuring for diagnostic purposes; Identification of persons
- A61B5/72—Signal processing specially adapted for physiological signals or for diagnostic purposes
- A61B5/7235—Details of waveform analysis
- A61B5/7264—Classification of physiological signals or data, e.g. using neural networks, statistical classifiers, expert systems or fuzzy systems
-
- A—HUMAN NECESSITIES
- A61—MEDICAL OR VETERINARY SCIENCE; HYGIENE
- A61B—DIAGNOSIS; SURGERY; IDENTIFICATION
- A61B5/00—Measuring for diagnostic purposes; Identification of persons
- A61B5/74—Details of notification to user or communication with user or patient; User input means
- A61B5/742—Details of notification to user or communication with user or patient; User input means using visual displays
-
- A—HUMAN NECESSITIES
- A61—MEDICAL OR VETERINARY SCIENCE; HYGIENE
- A61B—DIAGNOSIS; SURGERY; IDENTIFICATION
- A61B5/00—Measuring for diagnostic purposes; Identification of persons
- A61B5/02—Detecting, measuring or recording for evaluating the cardiovascular system, e.g. pulse, heart rate, blood pressure or blood flow
- A61B5/02007—Evaluating blood vessel condition, e.g. elasticity, compliance
-
- A—HUMAN NECESSITIES
- A61—MEDICAL OR VETERINARY SCIENCE; HYGIENE
- A61B—DIAGNOSIS; SURGERY; IDENTIFICATION
- A61B5/00—Measuring for diagnostic purposes; Identification of persons
- A61B5/48—Other medical applications
- A61B5/4806—Sleep evaluation
- A61B5/4818—Sleep apnoea
-
- A—HUMAN NECESSITIES
- A61—MEDICAL OR VETERINARY SCIENCE; HYGIENE
- A61B—DIAGNOSIS; SURGERY; IDENTIFICATION
- A61B5/00—Measuring for diagnostic purposes; Identification of persons
- A61B5/68—Arrangements of detecting, measuring or recording means, e.g. sensors, in relation to patient
- A61B5/6801—Arrangements of detecting, measuring or recording means, e.g. sensors, in relation to patient specially adapted to be attached to or worn on the body surface
- A61B5/6813—Specially adapted to be attached to a specific body part
- A61B5/6824—Arm or wrist
-
- A—HUMAN NECESSITIES
- A61—MEDICAL OR VETERINARY SCIENCE; HYGIENE
- A61B—DIAGNOSIS; SURGERY; IDENTIFICATION
- A61B5/00—Measuring for diagnostic purposes; Identification of persons
- A61B5/74—Details of notification to user or communication with user or patient; User input means
- A61B5/746—Alarms related to a physiological condition, e.g. details of setting alarm thresholds or avoiding false alarms
Definitions
- This invention relates to a blood pressure measuring device, method and program for continuously measuring blood pressure values.
- Blood pressure by a tonometry method that can measure biological information such as pulse and blood pressure using information detected by the pressure sensor in a state where the pressure sensor is in direct contact with a living body part through which an artery such as the radial artery of the wrist passes.
- a measuring apparatus is known (for example, see Japanese Patent Application Laid-Open No. 2017-006672).
- the blood pressure measurement device described in Japanese Patent Application Laid-Open No. 2017-006672 can only acquire blood pressure information of a living body and cannot detect an abnormality in blood pressure information.
- the present invention has been made paying attention to the above circumstances, and provides a blood pressure measurement device, method, and program capable of extracting a characteristic amount related to a blood pressure surge (hereinafter referred to as “surge”) that is a rapid blood pressure fluctuation from blood pressure information.
- surge a blood pressure surge
- a first aspect of the present invention is a blood pressure measurement device, comprising: a blood pressure measurement unit that obtains time series data of a blood pressure value that changes in conjunction with a heartbeat; A detection unit that detects one or more surge sections including a surge, an extraction unit that extracts one or more feature values for each surge, and a classification unit that classifies surges based on the feature values.
- the classification unit maps the surge to a space having the number of dimensions with the number of dimensions being equal to or less than the number of the feature quantities and having the dimension quantity corresponding to the dimension as an axis. It is.
- the extraction unit includes a rise time from the start of the surge to the peak of the surge, and a fall time from the peak of the surge to the end of the surge. And the amount of change in blood pressure during the rise time is extracted as the feature amount.
- the detection unit sets a maximum value of systolic blood pressure in the time series data as a peak point, a minimum value immediately before the peak point as a start point, and immediately after the peak point.
- the end point is a point before the local minimum value and the difference from the immediately following local minimum value is less than a certain value
- the blood pressure value at the peak point and the blood pressure value at the start point When the difference is greater than a threshold, greater than a first period in which there is a time difference between the peak point and the previous start point, and greater than a second period in which there is a time difference between the peak point and the end point,
- the section from the start point to the end point across the peak point is detected as a surge section.
- the fifth aspect of the present invention further includes a visualization unit that visualizes the surge classified by the classification unit with the feature quantity as an axis.
- the sixth aspect of the present invention further includes a calculation unit for calculating the statistic of the feature quantity.
- the seventh aspect of the present invention further includes a visualization unit that visualizes the surge classified by the classification unit with the statistic of the feature amount as an axis.
- a determination unit that determines a degree of risk of a living body based on a threshold value that is associated with a risk set in advance corresponding to the statistic and is compared with the statistic. It is to be prepared.
- the ninth aspect of the present invention further includes a visualization unit that visualizes the surge according to the degree of danger, and sets whether or not the surge is dangerous by setting a danger level corresponding to the threshold value.
- the apparatus further includes a determination unit that determines whether the detected surge is during a medication period based on a medication record.
- the eleventh aspect of the present invention further includes a visualization unit that visualizes the surge according to whether or not it is a period of medication.
- the blood pressure measurement unit obtains time-series data for a plurality of users, and the visualization unit visualizes the surge for each user.
- an apnea-hypopnea based on the occurrence frequency from a frequency calculation unit that calculates the occurrence frequency of the surge and a previously acquired relationship between the occurrence frequency of the surge and the apnea-hypopnea index.
- An index calculating unit that calculates an index.
- the blood pressure measurement device obtains time-series data of blood pressure values that change in conjunction with the heartbeat, detects one or more surge sections including one surge from the time-series data, By extracting one or more feature values for each surge and classifying the surges based on the feature values, it is possible to obtain features related to the surge of the living body from which the blood pressure value has been acquired. Based on this feature, when a patient corresponds to this living body, it is possible to determine the necessity of medication or detailed examination for the patient.
- the classifying unit maps the surge to a space of the number of dimensions with the number of features less than or equal to 1 and the number of dimensions as a dimension, and the feature amount corresponding to the dimension as an axis, Since the characteristics of the surge are mapped into the space, the characteristics that differ depending on the area of the space become obvious at a glance, and the characteristics of the surge can be immediately understood. Therefore, it is possible to understand the characteristics of a living body that has generated a surge.
- the extraction unit includes a rise time from the start of the surge to the peak of the surge, a fall time from the peak of the surge to the end of the surge,
- a surge can be mapped on a two-dimensional space with the rise time and the fall time as axes. Therefore, surges can be classified by rising time and falling time, and the characteristics of the living body can be understood based on these two indicators of the living body.
- the degree of load applied to the respiratory organ can be estimated based on the amount of fluctuation, and the surge can be mapped in a three-dimensional space including the amount of fluctuation. As a result, the characteristics of the living body can be understood based on these three indicators of the living body.
- the detection unit sets the maximum value of systolic blood pressure in the time series data as the peak point, sets the minimum value immediately before the peak point as the start point, and sets the minimum value immediately after the peak point.
- the difference between the blood pressure value at the peak point and the blood pressure value at the start point is more The end point with a peak point from the start point when the time point is larger than the first period with a time difference between the peak point and the start point and greater than the second period with a time difference between the peak point and the end point.
- the surge classified by the classification unit is visualized with the feature quantity as an axis, the surgeon classified by the doctor or patient can see the surge. Therefore, it is possible to grasp the patient's condition related to the surge at first glance.
- the statistical quantity of the feature quantity is calculated, it becomes easy to grasp the overall tendency for a certain period.
- the seventh aspect of the present invention since it is visualized by statistics, it becomes easy to grasp at a glance the overall tendency of a certain period.
- the risk level of the living body can be determined by comparing the threshold value associated with the risk and the statistical amount, when statistics are obtained for a plurality of patients, Opinion of each patient's risk level becomes easier to understand.
- the ninth aspect of the present invention it is visualized according to the degree of danger, and since the danger level is set to distinguish whether the surge is dangerous, it is possible to grasp the danger for each surge. In the case of a plurality of users, the danger can be grasped for each user.
- the tenth aspect of the present invention since it is possible to determine whether or not the detected surge is in the period of medication, it is possible to link the feature amount of surge and the presence or absence of medication. . When the patient's condition changes due to the surge feature amount, it is possible to determine the effectiveness of the medication.
- the surge since the surge is visualized separately depending on whether or not it is a medication period, it can be determined whether or not the surge changes depending on whether or not it is a medication period. Therefore, it can be determined at a glance whether the medication has an effect on the surge.
- the surge is visualized for each user, so that the characteristics of the surge can be grasped for each user.
- the occurrence frequency of the blood pressure surge is calculated, and the apnea hypopnea index is calculated based on the occurrence frequency from the previously acquired relationship between the occurrence frequency of the blood pressure surge and the apnea hypopnea index.
- an apnea hypopnea index can be calculated by referring to the blood pressure surge. Therefore, by analyzing the blood pressure surge, the apnea hypopnea index can be calculated, and this index can be obtained more easily than before.
- a blood pressure measurement device, method, and program capable of determining the characteristics of a living body based on biological information.
- FIG. 1 is a block diagram illustrating a blood pressure measurement device according to the first embodiment.
- FIG. 2 is a block diagram showing a blood pressure measurement unit included in the blood pressure measurement device of FIG.
- FIG. 3 is a view showing an example in which the blood pressure measurement device of FIG. 1 is worn on the wrist.
- FIG. 4 is a cross-sectional view of the wrist to which the blood pressure measurement device of FIG. 3 is attached.
- FIG. 5 is a diagram illustrating an example of the arrangement of the sensors in FIGS. 2 to 4.
- FIG. 6 is a diagram illustrating the characteristic amount of surge.
- FIG. 7 is a diagram showing a temporal change in pressure of a pressure pulse wave for each heartbeat and one of the pulse waves.
- FIG. 1 is a block diagram illustrating a blood pressure measurement device according to the first embodiment.
- FIG. 2 is a block diagram showing a blood pressure measurement unit included in the blood pressure measurement device of FIG.
- FIG. 3 is a view showing an example in which the blood pressure measurement
- FIG. 8 is a diagram showing time-series data of continuous blood pressure values in which occurrence of a surge is recognized.
- FIG. 9 is a diagram showing a two-dimensional map for a certain feature amount from the surge of FIG.
- FIG. 10 is a flowchart showing the operation of the blood pressure measurement device of FIG.
- FIG. 11 is a block diagram of a blood pressure measurement device according to the second embodiment.
- FIG. 12 is a diagram showing data stored in the surge detection result DB of FIG.
- FIG. 13 is a diagram showing data stored in the surge statistics DB of FIG.
- FIG. 14 is a diagram showing data stored in the risk threshold DB of FIG.
- FIG. 15 is a diagram showing data stored in the medication record DB of FIG.
- FIG. 16 is a flowchart showing the operation in the first example of FIG.
- FIG. 17 is a diagram illustrating an example of a display when the visualization unit in the first example sets one feature amount as one axis.
- FIG. 18 is a diagram illustrating an example of a display when the visualization unit in the first example uses two feature amounts as two axes.
- FIG. 19 is a flowchart showing the operation in the second example of FIG.
- FIG. 20 is a diagram illustrating an example of a display when the visualization unit in the second example uses two feature amounts as two axes.
- FIG. 21 is a flowchart showing the operation in the third example of FIG.
- FIG. 22 is a diagram illustrating an example of a display when the visualization unit in the third example uses two feature amounts as two axes.
- FIG. 23 is a flowchart showing the operation in the fourth example of FIG. FIG.
- FIG. 24 is a diagram illustrating an example of a display when the visualization unit in the fourth example uses two feature amounts as two axes.
- FIG. 25 is a block diagram showing a blood pressure measurement device according to the third embodiment.
- FIG. 26 is a diagram illustrating a part of the contents of the AHI-SI correlation DB of FIG.
- FIG. 27 is a flowchart showing the operation of the blood pressure measurement device of FIG.
- FIG. 28 is a diagram illustrating an example of the implementation of the blood pressure measurement device according to the embodiment.
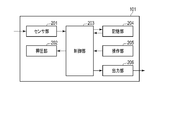
- FIG. 1 is a functional block diagram of the blood pressure measurement device 100, which includes a blood pressure measurement unit 101 that continuously measures in time, a surge section detection unit 102, a surge feature amount extraction unit 103, and a feature amount classification unit 104.
- a storage unit 105 and a display unit 106 are shown.
- FIG. 2 is a functional block diagram of the blood pressure measurement unit 101, which employs a tonometry method to measure blood pressure continuously in time for each heartbeat.
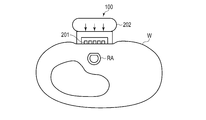
- FIG. 3 is an image diagram in which the blood pressure measurement device 100 is worn, and is a schematic perspective view of the palm as viewed from the side (the direction in which fingers are aligned when the hands are spread).
- FIG. 3 shows an example in which the pressure sensors are arranged in two rows crossing the radial artery.
- FIG. 3 shows a state in which the blood pressure measurement device 100 is placed on the palm side of the arm, but the blood pressure measurement device 100 is wound around the arm and fixed in an actual use state.
- FIG. 4 is a cross-sectional view of the blood pressure measurement device 100 and the wrist W at the position of the sensor unit 201 in a state where the blood pressure measurement device 100 is attached to the wrist.
- FIG. 4 also shows that the radial artery RA is pressed against the blood pressure measurement device 100 and the upper part thereof is flattened.
- FIG. 5 is a view of the blood pressure measurement device 100 as viewed from the side in contact with the living body, and the sensor units 201 are arranged in parallel in two rows on the contacting surface.
- the sensor unit 201 has a plurality of sensors arranged in a direction B intersecting a direction A in which the radial artery extends in a state where the blood pressure measurement device 100 is attached to the wrist W.
- the blood pressure measurement device 100 includes a blood pressure measurement unit 101, a surge section detection unit 102, a surge feature amount extraction unit 103, a feature amount classification unit 104, a storage unit 105, and a display unit 106.
- the blood pressure measurement device 100 is, for example, in the form of a ring, wound around a wrist or the like like a bracelet, and measures blood pressure from biological information. As shown in FIGS. 2 and 3, the blood pressure measurement device 100 is arranged such that the sensor unit 201 (for example, a pressure sensor) is positioned on the radial artery. Moreover, it is preferable to arrange
- the sensor unit 201 for example, a pressure sensor
- the blood pressure measurement unit 101 is, for example, for obtaining time-series data of a waveform of a blood pressure value that changes in conjunction with a heartbeat, and measures the pressure pulse wave pressure for each heartbeat that is temporally continuous by the tonometry method.
- the tonometry method is a method of determining a blood pressure by measuring a pressure pulse wave by compressing a blood vessel with a pressure sensor (for example, a pressure pulse wave sensor). Considering a circular tube with a uniform blood vessel thickness, the blood pressure in the blood vessel and the external pressure of the blood vessel (blood pressure) The relational expression with the pressure of the pressure pulse wave can be derived.
- the blood pressure measuring unit 101 measures the blood pressure value of the living body to be worn for each heartbeat.
- the surge interval detection unit 102 detects a surge interval from time series data of continuous blood pressure values acquired from the blood pressure measurement unit 101.
- Surge means rapid blood pressure fluctuation as described above.
- a section that typically satisfies a surge condition is identified as a surge section. In other words, it is not here to strictly define the conditions for a surge.
- the blood pressure measurement device 100 of the present embodiment can be applied to any condition that causes a surge by simply replacing the condition that causes a surge described here with another condition.
- the following conditions may be considered as conditions in which a part of the time-series data of blood pressure values becomes a typical surge.
- the following conditions are expressed by changes in the value of systolic blood pressure (SBP).
- SBP systolic blood pressure
- the condition may be expressed by a change in at least one of systolic blood pressure, diastolic blood pressure, average blood pressure, and pulse pressure. Since the actual SBP value does not become a smooth curve even if it becomes a continuous value, smoothing processing is performed on the time-series data of blood pressure values so that it can be easily handled in the subsequent processing, for example, continuously smooth Process into a differentiable curve.
- a curve representing time-series data of blood pressure values has been smoothed so as to be smooth and differentiable.
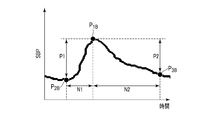
- the peak point P 1B having the maximum value in the time series data of SBP is selected. Usually, a plurality of peak points P 1B are found. Next, locate the minimum point P 2B having a minimum value even before temporally than the peak point P 1B, when the minimum point P 2B is found, proceed to the following conditions. It is determined whether the difference P1 between the blood pressure value of P 1B and the blood pressure value of P 2B is larger than a certain threshold (for example, 20 mmHg). If it is smaller, it is determined that there is no surge.
- a certain threshold for example, 20 mmHg
- a point P 3B at which a differential value becomes larger than a certain value (for example, ⁇ 0.2 mmHg / second) at a time later than the peak point P 1B is obtained.
- a period in which there is a time difference N2 between the point P 1B and the point P 3B (e.g., 7 heartbeats time) greater than or determined than the point P 3B in greater is the end point of the surge determination To do. If it is large, it is determined that a surge is formed at these points P 1B , P 2B , and P 3B . In this case, the surge interval detection unit 102 regards the points P 2B to P 3B as surge intervals.
- the surge feature quantity extraction unit 103 extracts the feature quantity of the detected surge.
- the characteristic amount of the surge corresponds to the blood pressure values and time-related amounts at the points P 1B , P 2B , and P 3B shown in FIG.
- P1, P2, N1, and N2 are P1, P2, N1, and N2.
- P1 is the difference between the blood pressure value at the surge peak point P1B and the blood pressure value at the surge start point P2B .
- P2 is a difference between the blood pressure value at the surge peak point P1B and the blood pressure value at the surge end point P3B (referred to as a blood pressure fluctuation amount).
- N1 is the difference between the time at the start point P 2B time and surge at the peak point P 1B surge, it referred to as rise time.
- N2 is the difference between the time at the surge peak point P1B and the time at the surge end point P3B , and is referred to as the descent time.
- the surge feature amount extraction unit 103 extracts the rise time and the fall time for each surge. That is, the surge feature amount extraction unit 103 extracts the rising time and the falling time for each surge section detected by the surge section detection unit 102.
- the feature quantity classification unit 104 classifies surges based on the feature quantities extracted by the surge feature quantity extraction unit 103. For example, the feature amount classifying unit 104 maps each surge on a two-dimensional plane with the rising time and the falling time as axes, sets a region on the two-dimensional plane, and classifies the surge. The classification by the feature amount classification unit 104 will be described later with reference to FIG. In general, the feature quantity classifying unit 104 classifies surges by mapping surges in a dimension space centered on the feature quantity corresponding to each dimension, with 1 or less being the number of types and less than the number of types of feature quantities. To do.
- the storage unit 105 stores the classification result classified by the feature amount classification unit 104. For example, the storage unit 105 stores the classification results in association with each living body.
- the display unit 106 displays the classification result stored in the storage unit 105. For example, the display unit 106 may display the classification result on a device different from the blood pressure measurement device 100 via the wireless unit.
- the blood pressure measurement unit 101 includes a sensor unit 201, a pressing unit 202, a control unit 203, a storage unit 204, an operation unit 205, and an output unit 206.
- the sensor unit 201 detects the pressure pulse wave continuously in time. For example, the sensor unit 201 detects a pressure pulse wave for each heartbeat.
- the sensor unit 201 includes a sensor for detecting pressure, and is arranged on the palm side as shown in FIG. 3, and is usually arranged in parallel with two rows in the arm extending direction as shown in FIG.
- each column of the sensor array including a plurality of sensors a plurality of (for example, 46) sensors are arranged so as to intersect (substantially orthogonal) the arm extending direction.
- the pressing unit 202 includes a pump, a valve, a pressure sensor, and an air bag. When the air bag swells the sensor portion of the sensor unit 201, it can press the wrist with an appropriate pressure to increase the sensitivity of the sensor. Air is introduced into the air bag by a pump and a valve, the pressure sensor detects the pressure in the air bag, and the control unit 203 monitors and controls to adjust to an appropriate pressure.
- the control unit 203 performs overall control of the blood pressure measurement unit 101, receives pulse wave time-series data from the sensor unit 201, converts this data into blood pressure value time-series data, and stores the data in the storage unit 204.
- the storage unit 204 stores time-series data of blood pressure values, and passes desired data in response to a request from the control unit 203.
- the operation unit 205 receives input from a user or the like from a keyboard, a mouse, a microphone, or the like, or receives an instruction from an external server or the like by wire or wireless.
- the output unit 206 receives time series data of blood pressure values stored in the storage unit 204 via the control unit 203 and passes it to the outside of the blood pressure measurement unit 101.
- the blood pressure measuring device 100 is arranged on the palm side of the wrist as shown in FIGS. 3 and 4 and the sensor unit 201 of the blood pressure measuring unit 101 is arranged on the radial artery RA. As shown by the arrows in FIG. 4, the pressing unit 202 presses the sensor unit 201 against the wrist W, and the radial artery RA is compressed. Although not shown in FIGS. 3 and 4, the blood pressure measurement device 100 has an annular shape and wraps around a wrist or the like like a bracelet and measures blood pressure.
- FIG. 5 shows a surface of the sensor unit 201 on the side in contact with the wrist W.
- the sensor unit 201 includes one or more (two in this example) sensor arrays, and each of the sensor arrays has a plurality of sensors arranged in the direction B.
- the direction B is a direction that intersects the direction A in which the radial artery extends in a state in which the blood pressure measurement device 100 is attached to the measurement subject.
- direction A and direction B may be orthogonal.
- 46 sensors referred to as having 46 channels
- the sensor is given a channel number.
- the arrangement of the sensors is not limited to the example shown in FIG.
- Each sensor measures pressure and generates pressure data.
- an element that converts pressure into an electrical signal can be used as the sensor.
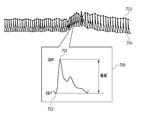
- a pressure waveform as shown in FIG. 7 is obtained as pressure data.
- the measurement result of the pressure pulse wave is generated based on pressure data output from one sensor (active channel) adaptively selected from the sensors.
- the maximum value in the waveform of the pressure pulse wave for one heartbeat corresponds to SBP
- the minimum value in the waveform of the pressure pulse wave for one heartbeat corresponds to diastolic blood pressure (DBP).
- DBP diastolic blood pressure
- the blood pressure data can include pressure data output from each sensor together with the measurement result of the pressure pulse wave.
- the measurement result of the pulse wave may not be generated in the blood pressure measurement unit 101 but may be generated based on the pressure data by the control unit 203 including the information processing unit in the blood pressure measurement device 100.
- the blood pressure measurement device 100 may calculate time-series data of blood pressure values from the measurement results of pressure pulse waves, and may output time-series data of blood pressure values instead of the measurement results of pulse waves.
- FIG. 7 shows time-series data of blood pressure calculated from the pressure pulse wave pressure when the pressure pulse wave pressure for each heartbeat is measured.
- FIG. 7 shows a blood pressure waveform 700 based on one of the pressure pulse waves.
- the blood pressure based on the pressure pulse wave is detected for each heartbeat as a waveform as shown in FIG. 7, and the blood pressure based on each pressure pulse wave is continuously detected.
- a waveform 700 in FIG. 7 is a blood pressure waveform based on a pressure pulse wave of one heartbeat, and a pressure value of 701 corresponds to SBP and a pressure value of 702 corresponds to DBP.
- the SBP 703 and the DBP 704 of the blood pressure waveform usually vary for each heartbeat.
- the surge interval detector 102 detects the peak point of the surge. This peak point is found at times t 2 , t 5 , t 8 , and t 11 , and in FIG. 8, the inside of the rectangle indicates the peak point. And the surge area detection part 102 detects the starting point of a surge. The start point of this surge has been found at times t 1 , t 4 , t 7 , t 10 .
- the end points of surges are found at times t 3 , t 6 , t 9 , t 12 .
- Reference numerals 801 and 802 are shown for reference, and show a REM sleep state and a wakefulness reaction, respectively, which are detected by other detection devices.
- the method for finding the start point of the surge is, for example, after finding the peak point, looking for the point that becomes the minimum value at the time before the peak point, and the difference between the minimum blood pressure value and the blood pressure value at the peak point.
- the point having the minimum value is set as the starting point of the surge when the value is greater than a certain value.
- the start point is a point that is at a time before the peak point and has a value that is lower than the peak value and that has a difference.
- the method of finding the end point of the surge is, for example, after finding the start point of the surge and ending the point that is at a time later than the peak point and that has a difference that is lower than the peak value. There is a way to make a point.
- the surge feature quantity extraction unit 103 acquires the rise time and the fall time for each surge, and the feature quantity classification unit 104 classifies these feature quantities.
- is an absolute value operator.
- SI Surge Index
- the feature amount classification unit 104 classifies according to the rise time and the fall time that are feature amounts extracted by the surge feature amount extraction unit 103.
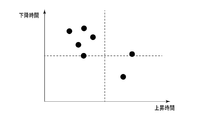
- FIG. 9 shows a two-dimensional mapping of the rise time and the fall time by the feature amount classification unit 104. Each point shown in FIG. 9 corresponds to one surge.
- the feature amount classifying unit 104 divides into two types according to whether the rising time and the falling time are both greater than or less than a certain threshold value, so that the two-dimensional map is classified into four regions and characterized.
- the section corresponding to the surge rise time represents the adjustment power of the autonomic nervous system
- the section corresponding to the surge fall time represents the blood pressure adjustment power. That is, the longer the rise time, the stronger the autonomic nerve adjustment force, and the shorter the fall time, the stronger the blood pressure adjustment force.
- a threshold value is set for each axis. In FIG. 9, the first quadrant where the rising time and the falling time are both equal to or higher than the threshold value, the second quadrant where the rising time is equal to or lower than the threshold value, and the rising time is equal to or higher than the threshold value.
- the fourth quadrant is classified into a third quadrant where both the fall time is equal to or less than the threshold value, and a fourth quadrant where the rise time is equal to or greater than the threshold value and the fall time is equal to or less than the threshold value.
- the feature amount classifying unit 104 classifies the autonomic nerve adjustment power as weak or strong on the rise time axis and the blood pressure adjustment force as strong or weak on the fall time axis with the threshold as a boundary.
- the first quadrant indicates that the autonomic nerve adjustment force is strong but the blood pressure adjustment force is weak
- the second quadrant indicates that the autonomic nerve adjustment force is weak and the blood pressure adjustment force is also weak
- the third quadrant is the autonomic nerve adjustment force.
- the fourth quadrant indicates that the autonomic nerve adjustment force is strong and the blood pressure adjustment force is also strong.
- there are 0 events in the first quadrant, 4 events in the second quadrant, and 1 event in the fourth quadrant, and 1 near the boundary is between the second and third quadrants. There is one event between the event and the first and fourth quadrants.
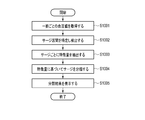
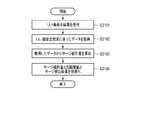
- FIG. 10 is a flowchart showing a typical example of the operation of the blood pressure measurement device 100.
- the blood pressure measurement unit 101 acquires blood pressure value time-series data from the living body and passes it to the surge interval detection unit 102 (step S1001).
- the blood pressure measurement unit 101 passes the time series data to the storage unit 105, and the storage unit 105 sequentially records the time series data of the blood pressure values.
- step S1002 the surge interval detection unit 102 detects a surge interval from the time series data of the blood pressure value, and passes the time series data together with the information of the surge interval to the surge feature quantity extraction unit 103.
- step S1003 the surge feature amount extraction unit 103 extracts a surge feature amount for each surge specified from the surge section.
- the rise time and the fall time in the surge section are extracted as feature amounts, but any feature amount can be used as long as it can be extracted from the surge.
- the feature amount classification unit 104 classifies surges based on the extracted feature amounts.
- the feature quantity classification unit 104 maps surges corresponding to feature quantities in a multidimensional space according to the type of feature quantity to be noticed. In this case, the number of dimensions corresponds to 1 or more below the type of feature quantity.
- the number of dimensions corresponds to 1 or more below the type of feature quantity.
- FIG. 9 since there are two types of feature amounts, an ascending time and a descending time, points corresponding to surges specified by the two feature amounts are mapped in the two-dimensional space. Data mapped in the multidimensional space by the feature quantity classification unit 104 is stored in the storage unit 105.
- step S1005 the display unit 106 receives and displays the data mapped to the multidimensional space stored in the storage unit 105. For example, FIG. 9 is displayed. If feature quantities representing each adjustment ability for each living body are mapped on a multidimensional space as shown in FIG. 9, it is obvious which part has a problem, and can be used, for example, for a doctor's treatment policy.
- one or more surge sections including one surge are detected from the time-series data of blood pressure values, one or more feature amounts are extracted for each surge, and the feature amounts are extracted.
- the feature amounts are extracted.
- the surge feature is mapped to the space, so that the features that differ depending on the area of the space become obvious at a glance, and the surge feature can be understood immediately. become able to. Therefore, it is possible to understand the characteristics of a living body that has generated a surge, and for example, a doctor can make use of the treatment policy.
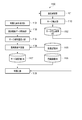
- FIG. 11 is a block diagram of a blood pressure measurement device according to the second embodiment.
- the blood pressure measurement device according to the second embodiment is different from the blood pressure measurement device according to the first embodiment in that surge statistics are calculated. Furthermore, in the blood pressure measurement device of the second embodiment, the medication record is taken into account and the visualization is changed accordingly.
- the blood pressure measurement device 1100 of this embodiment includes a blood pressure measurement unit 101, a surge detection unit 1110, a visualization condition reception unit 1101, a surge detection result database (also referred to as DB) 1102, a detection result data acquisition unit 1103, and a surge statistic calculation unit 1104. , A medication record DB 1105, a pre- and post-medication determination unit 1106, a surge statistic DB 1107, a risk threshold DB 1108, and a visualization unit 1109.
- the surge detection unit 1110 is a combination of the surge section detection unit 102 and the surge feature amount extraction unit 103. That is, the surge detector 1110 detects a surge interval from time series data of continuous blood pressure values acquired from the blood pressure measurement unit 101. Then, the surge detection unit 1110 extracts a feature amount of the detected surge.
- the characteristic amount of the surge corresponds to the blood pressure values and time-related amounts at the points P 1B , P 2B , and P 3B shown in FIG.
- the characteristic amount of surge includes blood pressure fluctuation amount, rise time, and fall time.
- the blood pressure fluctuation amount is an amount by which the blood pressure fluctuates during the rise time, and is said to represent the degree of load applied to the respiratory organs. The greater the blood pressure fluctuation amount, the greater the load.
- the rise time and the fall time are as described in the first embodiment.
- the visualization condition accepting unit 1101 accepts a visualization condition indicating what content is to be visualized (for example, displayed on a display screen) by using which feature amount of the surge feature amount as a variable.
- the visualization include a one-dimensional plot with a surge index (also referred to as SI) as a variable, a two-dimensional plot with a rise time and a fall time as variables, and the like.
- the surge index is the number of occurrences of surge per hour.
- One opportunity is referred to as one opportunity, and indicates one time from the start to the end of continuous blood pressure measurement of the subject.
- one opportunity is assumed to be overnight.
- the surge detection unit 1110 accepts any of the following four contents, (first example) a plot that summarizes the results of one person and one opportunity, (second example) An example is a plot in which the results are aggregated, (third example) all result plots for one opportunity per person, and (fourth example) results of one opportunity for each subject, and a plot for all members.
- the surge detection result DB 1102 records data of feature points and feature amounts detected by 101 and the surge detection unit 1110. In the present embodiment, there are one personal opportunity, multiple personal opportunities, and one opportunity for all the subjects.
- the feature points and feature amounts are the same as those described in the first embodiment. An example of data stored in the surge detection result DB 1102 will be described later with reference to FIG.
- the detection result data acquisition unit 1103 acquires detection result data from the surge detection result DB 1102 based on the visualization condition from the visualization condition reception unit 1101.
- the surge statistic calculation unit 1104 calculates the surge statistic of the detection result data acquired by the detection result data acquisition unit 1103.
- the surge statistics include, for example, surge index, rise time average, fall time average, blood pressure fluctuation amount average, and standard deviation (also referred to as SD).
- the medication record DB 1105 records data about when and what medications were administered to each subject. In the medication record DB 1105, for example, information about the medication start date and medication is recorded. An example of data stored in the medication record DB 1105 will be described later with reference to FIG.
- the pre- and post-medication determination unit 1106 determines whether the surge statistic (that is, the detected surge) from the surge statistic calculation unit 1104 is pre-medication or post-medication, with reference to the medication record DB 1105.
- the term “before medication” refers to a state prior to the start of medication and is not administered
- the term “after medication” refers to a state after medication has been started and continues to be administered.
- the surge statistic DB 1107 records the surge statistic calculated by the surge statistic calculation unit 1104 for each subject. An example of data stored in the surge statistic DB 1107 will be described with reference to FIG.
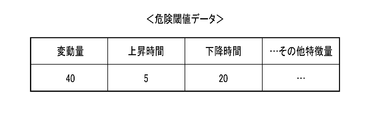
- the danger threshold value DB 1108 stores in advance threshold values associated with danger corresponding to surge statistics.
- the risk threshold DB 1108 may set and store a threshold based on a deviation from an average of a certain subject's surge statistics. . For example, when one standard deviation from the average value is set as a threshold value, it is determined to be dangerous if it is more than one standard deviation from the average value.
- An example of data stored in the danger threshold DB 1108 will be described later with reference to FIG.
- the visualization unit 1109 may perform the comparison between the threshold value and the surge statistic, for example.
- the visualization unit 1109 visualizes the surge feature quantity as a variable of one dimension or more with a variable on one axis or more. It displays so that it can be identified by changing the color before and after medication for each subject, for each drug.
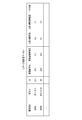
- the surge detection result data stored in the surge detection result DB 1102 is, for example, a subject ID, a surge start time, a surge peak time, a surge end time, a fluctuation amount, and an ascending time as shown in FIG.
- the surge statistic data stored in the surge statistic DB 1107 includes, for example, a subject ID, measurement date, SI, variation average, variation standard deviation, rise time average, and rise time standard deviation as shown in FIG.
- the surge statistic data is in one row for one opportunity per person (first example) and one person per opportunity all data (second example). In the case of multiple opportunities for one person (second example), the number of rows is equal to the measured opportunity. In the fourth example, one person's opportunity is equal to the number of subjects.
- the danger threshold data stored in the danger threshold DB 1108 includes, for example, a fluctuation amount, an ascending time, and a descending time as shown in FIG. In the example shown below, only one type of threshold value is assumed, but there may be a plurality of threshold levels. As shown in FIG. 15, the medication record data stored in the medication record DB 1105 includes, for example, a medication date, a drug, an opportunity dose, and a medication period. In the example shown below, only one type is assumed, but a plurality of pieces of drug information may be stored.
- the first example is a case where the results of one opportunity per person are aggregated and plotted.
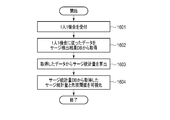
- the visualization condition reception unit 1101 receives one opportunity per person, and passes to the detection result data acquisition unit 1103 that a subject is visualized for overnight surge detection (step S1601).
- the detection result data acquisition unit 1103 acquires data according to one opportunity per person from the surge detection result DB 1102 (step S1602).
- the surge statistic calculation unit 1104 calculates the surge statistic from the surge detection result data (step S1603).
- the surge statistic calculation unit 1104 calculates, for example, statistics related to the surge index, the fall time, and the rise time shown in FIGS. 17 and 18 and records them in the surge statistics DB 1107. Since the data per person is only one night, the pre- and post-medication determination unit 1106 does not determine.
- the visualization unit 1109 visualizes the surge statistics acquired from the surge statistics DB 1107 and the risk threshold acquired from the risk threshold DB 1108 (step S1604).
- the visualization unit 1109 plots, for example, as shown in FIGS. Although one-dimensional and two-dimensional plots are shown here, three-dimensional plots may be combined. In addition, the blood pressure fluctuation amount may be plotted in a multidimensional manner.
- the visualization condition reception unit 1101 receives a plurality of opportunities for one person, and passes to the detection result data acquisition unit 1103 that a certain subject is visualized for a plurality of nighttime surge detections (step S1901).
- the detection result data acquisition unit 1103 acquires data according to one or more opportunities from the surge detection result DB 1102 (step S1902).
- the surge statistic calculation unit 1104 calculates the surge statistic from the surge detection result data (step S1903).
- the pre- and post-medication determination unit 1106 determines whether the surge statistic calculated by the surge statistic calculation unit 1104 is before or after the administration with reference to the administration record DB 1105, and the surge statistic including the determination result Is recorded in the surge statistics DB 1107 (step S1904).
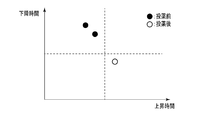
- the visualization unit 1109 acquires and visualizes the surge statistic acquired from the surge statistic DB 1107, the result of determining before and after medication, and the risk threshold from the risk threshold DB 1108 (step S1905).
- An example visualized by the visualization unit 1109 is shown in FIG. According to FIG. 20, it is possible to compare before and after medication, and it can be seen that the fall time after medication is shorter than before medication. Since the possibility that blood pressure adjustment power is excellent as the fall time is small is high, it can be interpreted that there is a high possibility that there was an effect of the medicine. Thus, according to the result of one opportunity multiple opportunities, the transition after starting treatment and the effect of medication can be understood.
- the third example is a case where all the results for one opportunity per person are aggregated and plotted. All results are results that include not only statistics but also feature values for each surge.
- the visualization condition accepting unit 1101 accepts instructions for all results per person, and the detection result data obtaining unit 1103 indicates that not only the statistics but also the feature amount of each surge is visualized for a certain subject for overnight surge detection. Pass (step S2101).
- the detection result data acquisition unit 1103 acquires data in accordance with the instruction for one opportunity per person from the surge detection result DB 1102 (step S2102).
- the surge statistic calculation unit 1104 calculates a surge statistic from the acquired surge detection result data, and records the calculated surge statistic in the surge statistic DB 1107 (step S2103).
- the visualization unit 1109 acquires and visualizes the surge statistic acquired from the surge statistic DB 1107, the risk threshold acquired from the risk threshold DB 1108, and the feature amount for each surge acquired from the surge detection result DB 1102 (step S2104).
- the visualization unit 1109 plots, for example, as shown in FIG. 22, and displays the characteristic amount (in this case, rise time and fall time) of each surge and a representative value (eg, average, median) that is a surge statistic. Note that, as in the first example, the data before and after the medication is not determined by the pre- and post-medication determination unit 1106 because the data is for only one night per person.
- the third example since the total surges are plotted overnight, not only the statistics but also the distribution of the surges themselves can be confirmed. As a result, it is possible to grasp whether the fluctuation of the surge feature amount does not follow the normal distribution.
- the fourth example is a case where the results of one opportunity for each subject are aggregated and all the members are plotted. The degree of risk can be estimated for each subject, and comparison with others becomes easy. The tendency of the entire subject can be confirmed.
- the visualization condition accepting unit 1101 accepts instructions for all the results of each person and passes to the detection result data obtaining unit 1103 that the statistics are visualized for overnight surge detection for all the subjects (step S2301).
- the detection result data acquisition unit 1103 acquires data according to the instruction for all the results of one person and one opportunity from the surge detection result DB 1102 (step S2302). Further, the detection result data acquisition unit 1103 classifies the data for each user, and passes the surge detection result for each user to the surge statistic calculation unit 1104 (step S2303).
- the surge statistic calculation unit 1104 receives the surge detection result and calculates the surge statistic for each user (step S2304). In the surge detection result DB 1102, when there are a plurality of subjects, a plurality of different subject IDs are recorded.
- the visualization unit 1109 determines a subject having a high risk level based on a surge statistic for each user and a threshold value from the risk threshold DB 1108. For example, a test subject having the highest risk level (most likely risk) is identified. (Step S2305). Further, the visualization unit 1109 visualizes each subject and the subject with the highest degree of risk as shown in FIG. 24 (step S2306). The visualization unit 1109 visualizes the surge according to the risk level, sets a risk level corresponding to the threshold value, and distinguishes whether the surge is dangerous.
- the surge statistics are obtained and the medication status data is also taken into account, so that the treatment is started. Transition, medication can determine the effectiveness of the patient. Since the data of a plurality of patients are plotted, the risk level for each patient can be visualized. Therefore, the tendency of the whole patient can be grasped.
- the blood pressure measurement device 2500 includes, in the blood pressure measurement device 1100 according to the second embodiment, an SI (Surge Index) calculation unit 2501 and an AHI (Apnea Hypopnea Index) calculation unit. 2502 and an AHI-SI correlation DB 2503 are added. Other than these three additional devices, the operation is the same as that of the second embodiment. That is, it may be visualized using SI or estimated AHI as a feature quantity. AHI is closely related to the symptoms of SAS, and the larger AHI, the more severe the SAS.
- FIG. 25 is a block diagram of blood pressure measurement device 2500.
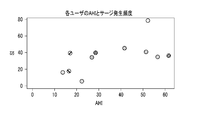
- FIG. 26 shows AHI and SI measured for each user. AHI is measured by, for example, PSG (Polysomnography), which is different from the apparatus of the present embodiment.
- PSG Polysomnography
- the SI calculation unit 2501 obtains, for each user, a surge index that is the blood pressure surge occurrence frequency per hour (for example, the number of blood pressure surge occurrences per hour) from the data of the surge detection result DB 1102.
- the AHI calculation unit 2502 obtains the AHI based on the surge index from the SI calculation unit 2501 and the correlation data stored in the AHI-SI correlation DB 2503.
- AHI is an apnea hypopnea index, which is the total number of apneas and hypopneas per hour of sleep. Note that hypopnea indicates a state where arterial vascular oxygen saturation (SpO2) has decreased by 3-4% or more, or a state accompanied by arousal.
- the AHI-SI correlation DB 2503 stores data indicating the correlation between AHI and SI. Data of AHI and SI is plotted in advance for each user as shown in FIG. 26, and data indicating the correlation derived therefrom is stored in the AHI-SI correlation DB 2503.
- FIG. 26 Collect data as shown in FIG. 26, and calculate the correlation between AHI and SI based on this data.
- the correlation coefficient is 0.59, indicating that there is a moderate correlation. Accordingly, since there is a correlation between AHI and SI, based on the data shown in FIG. 26, only SI may be used as a severity index, or AHI may be estimated.
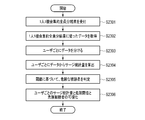
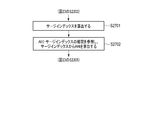
- step S2303 the operation of the blood pressure measurement device 2500 of FIG. 25 will be described with reference to FIG.
- the process branches from step S2303 in FIG. 23, and passes through steps S2701 and S2702 to join the operation of the fourth embodiment (fourth example) in step S2305 in FIG.
- step S2701 the SI calculation unit 2501 calculates a surge index by referring to the blood pressure surge detection result data detected and stored in step S2303.
- step S2702 the AHI-SI correlation DB 2503 storing the correlation information between the AHI and the surge index is referred to, and the AHI is calculated from the surge index obtained in step S2701.
- the third embodiment described above if it is known that there is a correlation between the occurrence frequency and the AHI, it is possible to determine the AHI simply by measuring the blood pressure surge. Severity may be easily known.
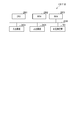
- the blood pressure measurement devices 100 and 1100 include a CPU 2801, a ROM 2802, a RAM 2803, an input device 2804, an output device 2805, and a blood pressure measurement unit 101, which are connected to each other via a bus system 2806.
- the above-described functions of the blood pressure measurement devices 100 and 1100 can be realized by the CPU 2801 reading and executing a program stored in a computer-readable recording medium (ROM 2802).
- the RAM 2803 is used as a work memory by the CPU 2801.
- an auxiliary storage device includes, for example, a hard disk drive (HDD) or a solid state drive (SDD), a storage unit 105, a surge detection result DB 1102, a medication record DB 1105, a surge statistics DB 1107, and a risk threshold DB 1108. , And AHI-SI correlation DB 2503, and may further store a program.
- HDD hard disk drive
- SDD solid state drive
- storage unit 105 includes, for example, a hard disk drive (HDD) or a solid state drive (SDD), a storage unit 105, a surge detection result DB 1102, a medication record DB 1105, a surge statistics DB 1107, and a risk threshold DB 1108.
- AHI-SI correlation DB 2503 and may further store a program.
- the input device 2804 includes, for example, a keyboard, a mouse, and a microphone, and accepts an operation from the user.
- the input device 2804 includes an operation button for causing the blood pressure measurement unit 101 to start measurement, an operation button for performing calibration, and an operation button for starting or stopping communication.
- the output device 2805 includes, for example, a display device such as a liquid crystal display device and a speaker.
- the blood pressure measurement unit 101 transmits / receives a signal to / from another computer using a communication device, for example, and receives measurement data from the blood pressure measurement device, for example.
- the communication device often uses a communication method capable of exchanging data with each other at a short distance, for example, using a short-range wireless communication method, specifically, Bluetooth (registered trademark), Transform Jet (registered trademark), There are communication systems such as ZigBee (registered trademark) and IRDA (registered trademark).
- Bluetooth registered trademark
- Transform Jet registered trademark
- ZigBee registered trademark
- IRDA registered trademark
- the blood pressure measurement unit 101 detects, for example, the pressure pulse wave of the radial artery passing through the measurement site (for example, the left wrist) (tonometry method).
- the blood pressure measurement unit 101 may detect the pulse wave of the radial artery passing through the measurement site (for example, the left wrist) as a change in impedance (impedance method).
- the blood pressure measurement unit 101 includes a light emitting element that irradiates light toward an artery passing through a corresponding portion of the measurement site, and a light receiving element that receives reflected light (or transmitted light) of the light.
- the pulse wave may be detected as a change in volume (photoelectric method).
- the blood pressure measurement unit 101 may include a piezoelectric sensor that is in contact with the measurement site, and may detect distortion due to the pressure of the artery passing through the corresponding portion of the measurement site as a change in electrical resistance (piezoelectric). method). Further, the blood pressure measurement unit 101 includes a transmitting element that transmits a radio wave (transmitted wave) toward an artery passing through a corresponding portion of the measurement site, and a receiving element that receives a reflected wave of the radio wave. A change in the distance between the artery and the sensor due to the pulse wave may be detected as a phase shift between the transmitted wave and the reflected wave (radio wave irradiation method). It should be noted that other methods may be applied as long as a physical quantity capable of calculating blood pressure can be observed.
- surge section detection unit 102 surge feature amount extraction unit 103, feature amount classification unit 104, visualization condition reception unit 1101, detection result data acquisition unit 1103, surge statistic calculation unit 1104, pre-dose determination unit 1106, visualization
- a program for executing the operation performed by the unit 1109 may be stored in the ROM 2802 or the auxiliary storage device, and the CPU 2801 may execute the program.
- the program may be stored in a server or the like different from the blood pressure measurement device 100, and a CPU such as the server may execute the program.
- the time series data (or time series data of blood pressure values) of the pressure pulse wave measured by the blood pressure measurement unit 101 can be transmitted to the server and processed by the server to obtain the reliability.
- the processing speed may increase. Furthermore, since the device sections of the surge section detection unit 102, the surge feature amount extraction unit 103, and the feature amount classification unit 104 are removed from the blood pressure measurement device 100, the size and mass of the blood pressure measurement device 100 are reduced, and the sensor is accurately set. It can be easily placed at a position where it can be measured. As a result, the burden on the user is reduced, and accurate blood pressure measurement can be performed easily.
- the apparatus of the present invention can be realized by a computer and a program, and can be recorded on a recording medium or provided through a network.
- Each of the above devices and their device portions can be implemented with either a hardware configuration or a combined configuration of hardware resources and software.
- As the software of the combined configuration a program for causing the computer to realize the functions of each device by being installed in a computer from a network or a computer-readable recording medium in advance and executed by a processor of the computer is used.
- the present invention is not limited to the above-described embodiment as it is, and can be embodied by modifying the constituent elements without departing from the scope of the invention in the implementation stage. Further, various inventions can be formed by appropriately combining a plurality of constituent elements disclosed in the embodiment. For example, some components may be deleted from all the components shown in the embodiment. Furthermore, you may combine suitably the component covering different embodiment.
- a blood pressure measurement device comprising a hardware processor and a memory
- the hardware processor is Obtain time-series data of blood pressure values that change in conjunction with the heartbeat, Detect one or more surge sections including one surge from the time series data, Extract one or more features for each surge, Configured to classify surges based on the feature quantities;
- the memory is A blood pressure measurement device comprising: a storage unit that stores classified surges.
- At least one hardware processor uses at least one hardware processor, obtain time-series data of blood pressure values that change in conjunction with the heartbeat, Using at least one hardware processor to detect one or more surge sections including one surge from the time series data; Using at least one hardware processor to extract one or more features for each surge; A blood pressure measurement method comprising classifying a surge based on the feature amount using at least one hardware processor.
Landscapes
- Health & Medical Sciences (AREA)
- Life Sciences & Earth Sciences (AREA)
- Cardiology (AREA)
- Engineering & Computer Science (AREA)
- Physics & Mathematics (AREA)
- Medical Informatics (AREA)
- General Health & Medical Sciences (AREA)
- Biophysics (AREA)
- Pathology (AREA)
- Veterinary Medicine (AREA)
- Biomedical Technology (AREA)
- Heart & Thoracic Surgery (AREA)
- Public Health (AREA)
- Molecular Biology (AREA)
- Surgery (AREA)
- Animal Behavior & Ethology (AREA)
- Vascular Medicine (AREA)
- Physiology (AREA)
- Ophthalmology & Optometry (AREA)
- Artificial Intelligence (AREA)
- Evolutionary Computation (AREA)
- Fuzzy Systems (AREA)
- Mathematical Physics (AREA)
- Computer Vision & Pattern Recognition (AREA)
- Psychiatry (AREA)
- Signal Processing (AREA)
- Measuring Pulse, Heart Rate, Blood Pressure Or Blood Flow (AREA)
Priority Applications (3)
| Application Number | Priority Date | Filing Date | Title |
|---|---|---|---|
| CN201880017461.6A CN110402104B (zh) | 2017-03-15 | 2018-03-12 | 血压测量装置、方法以及程序 |
| DE112018001363.4T DE112018001363T5 (de) | 2017-03-15 | 2018-03-12 | Blutdruckmessvorrichtung, verfahren und programm |
| US16/561,728 US20190387979A1 (en) | 2017-03-15 | 2019-09-05 | Blood pressure measurement apparatus, method, and program |
Applications Claiming Priority (2)
| Application Number | Priority Date | Filing Date | Title |
|---|---|---|---|
| JP2017-050650 | 2017-03-15 | ||
| JP2017050650A JP7056002B2 (ja) | 2017-03-15 | 2017-03-15 | 血圧測定装置、方法及びプログラム |
Related Child Applications (1)
| Application Number | Title | Priority Date | Filing Date |
|---|---|---|---|
| US16/561,728 Continuation US20190387979A1 (en) | 2017-03-15 | 2019-09-05 | Blood pressure measurement apparatus, method, and program |
Publications (1)
| Publication Number | Publication Date |
|---|---|
| WO2018168807A1 true WO2018168807A1 (ja) | 2018-09-20 |
Family
ID=63522092
Family Applications (1)
| Application Number | Title | Priority Date | Filing Date |
|---|---|---|---|
| PCT/JP2018/009579 Ceased WO2018168807A1 (ja) | 2017-03-15 | 2018-03-12 | 血圧測定装置、方法及びプログラム |
Country Status (5)
| Country | Link |
|---|---|
| US (1) | US20190387979A1 (enExample) |
| JP (1) | JP7056002B2 (enExample) |
| CN (1) | CN110402104B (enExample) |
| DE (1) | DE112018001363T5 (enExample) |
| WO (1) | WO2018168807A1 (enExample) |
Families Citing this family (4)
| Publication number | Priority date | Publication date | Assignee | Title |
|---|---|---|---|---|
| JP7256049B2 (ja) * | 2019-03-25 | 2023-04-11 | オムロンヘルスケア株式会社 | 血圧関連情報表示装置、血圧関連情報表示方法、およびプログラム |
| JP7253419B2 (ja) * | 2019-03-25 | 2023-04-06 | オムロンヘルスケア株式会社 | 血圧関連情報表示装置、血圧関連情報表示方法、およびプログラム |
| KR102112699B1 (ko) * | 2019-06-12 | 2020-05-19 | 주식회사 뷰노 | 시계열적 신호 시각화 방법 및 이를 이용한 장치 |
| JP2021040969A (ja) * | 2019-09-11 | 2021-03-18 | オムロンヘルスケア株式会社 | 判定アルゴリズムを生成する方法、判定アルゴリズム、判定システム、判定方法、プログラム、および記録媒体 |
Citations (7)
| Publication number | Priority date | Publication date | Assignee | Title |
|---|---|---|---|---|
| JPH10295657A (ja) * | 1997-04-24 | 1998-11-10 | Matsushita Electric Ind Co Ltd | 血圧測定装置 |
| JP2005066087A (ja) * | 2003-08-26 | 2005-03-17 | Matsushita Electric Works Ltd | 循環器機能判定装置 |
| JP2006212218A (ja) * | 2005-02-03 | 2006-08-17 | Toshiba Corp | 健康管理装置、健康管理システム、健康管理方法および健康管理プログラム |
| JP2006280392A (ja) * | 2005-03-31 | 2006-10-19 | Terumo Corp | 血圧測定システム |
| JP2010540127A (ja) * | 2007-10-03 | 2010-12-24 | オタワ ヘルス リサーチ インスティチュート | 1つ以上の臓器の経時的生理的パラメータ変動を監視するための方法および装置 |
| JP2013099505A (ja) * | 2011-10-19 | 2013-05-23 | Panasonic Corp | 循環動態測定装置 |
| JP2016064125A (ja) * | 2014-09-19 | 2016-04-28 | シナノケンシ株式会社 | 脳血管疾患の発症危険度予測システム |
Family Cites Families (21)
| Publication number | Priority date | Publication date | Assignee | Title |
|---|---|---|---|---|
| US3754545A (en) * | 1968-08-01 | 1973-08-28 | Bio Medical Sciences Inc | Blood pressure recording device with improved record |
| JP3530888B2 (ja) * | 1995-12-20 | 2004-05-24 | コーリンメディカルテクノロジー株式会社 | 血圧監視装置 |
| JP3583495B2 (ja) * | 1995-03-06 | 2004-11-04 | コーリンメディカルテクノロジー株式会社 | 心筋虚血評価装置 |
| JPH09215664A (ja) * | 1996-02-13 | 1997-08-19 | Nippon Colin Co Ltd | 自律神経機能評価装置 |
| JP4096376B2 (ja) * | 1996-07-09 | 2008-06-04 | セイコーエプソン株式会社 | リラックス指導装置 |
| JPH11318841A (ja) * | 1998-03-09 | 1999-11-24 | Nippon Colin Co Ltd | 血圧監視装置 |
| DE10243265A1 (de) * | 2002-09-17 | 2004-03-25 | Andreas Nuske | Bioelektrischer Herzdiagnostikhandschuh |
| JP3838201B2 (ja) * | 2003-01-21 | 2006-10-25 | オムロンヘルスケア株式会社 | 脈波検出装置 |
| EP1711104B1 (en) * | 2004-01-16 | 2014-03-12 | Compumedics Limited | Method and apparatus for ecg-derived sleep disordered breathing monitoring, detection and classification |
| CN1698535A (zh) * | 2004-05-18 | 2005-11-23 | 香港中文大学 | 测量血压变化率的方法 |
| US10478076B2 (en) * | 2009-12-28 | 2019-11-19 | Gambro Lundia Ab | Monitoring a property of the cardiovascular system of a subject |
| US8668649B2 (en) * | 2010-02-04 | 2014-03-11 | Siemens Medical Solutions Usa, Inc. | System for cardiac status determination |
| JP5364038B2 (ja) * | 2010-05-21 | 2013-12-11 | 日本光電工業株式会社 | 血圧測定装置および血圧測定方法 |
| JP5738673B2 (ja) * | 2011-05-24 | 2015-06-24 | オムロンヘルスケア株式会社 | 血圧測定装置 |
| JP5408751B2 (ja) * | 2012-03-27 | 2014-02-05 | 国立大学法人東北大学 | 自律神経機能測定装置 |
| JP5858157B2 (ja) * | 2012-06-27 | 2016-02-10 | 日産自動車株式会社 | ストレス状態推定装置 |
| JP6003487B2 (ja) * | 2012-09-28 | 2016-10-05 | オムロンヘルスケア株式会社 | 血圧測定装置、血圧測定方法、血圧測定プログラム |
| US20150196209A1 (en) * | 2014-01-15 | 2015-07-16 | Microsoft Corporation | Cardiovascular risk factor sensing device |
| US10610113B2 (en) * | 2014-03-31 | 2020-04-07 | The Regents Of The University Of Michigan | Miniature piezoelectric cardiovascular monitoring system |
| CN105147268A (zh) * | 2015-06-15 | 2015-12-16 | 辛勤 | 一种健康监测方法及装置 |
| US10420475B2 (en) * | 2015-06-15 | 2019-09-24 | Vital Labs, Inc. | Method and system for cardiovascular disease assessment and management |
-
2017
- 2017-03-15 JP JP2017050650A patent/JP7056002B2/ja active Active
-
2018
- 2018-03-12 CN CN201880017461.6A patent/CN110402104B/zh active Active
- 2018-03-12 WO PCT/JP2018/009579 patent/WO2018168807A1/ja not_active Ceased
- 2018-03-12 DE DE112018001363.4T patent/DE112018001363T5/de active Pending
-
2019
- 2019-09-05 US US16/561,728 patent/US20190387979A1/en not_active Abandoned
Patent Citations (7)
| Publication number | Priority date | Publication date | Assignee | Title |
|---|---|---|---|---|
| JPH10295657A (ja) * | 1997-04-24 | 1998-11-10 | Matsushita Electric Ind Co Ltd | 血圧測定装置 |
| JP2005066087A (ja) * | 2003-08-26 | 2005-03-17 | Matsushita Electric Works Ltd | 循環器機能判定装置 |
| JP2006212218A (ja) * | 2005-02-03 | 2006-08-17 | Toshiba Corp | 健康管理装置、健康管理システム、健康管理方法および健康管理プログラム |
| JP2006280392A (ja) * | 2005-03-31 | 2006-10-19 | Terumo Corp | 血圧測定システム |
| JP2010540127A (ja) * | 2007-10-03 | 2010-12-24 | オタワ ヘルス リサーチ インスティチュート | 1つ以上の臓器の経時的生理的パラメータ変動を監視するための方法および装置 |
| JP2013099505A (ja) * | 2011-10-19 | 2013-05-23 | Panasonic Corp | 循環動態測定装置 |
| JP2016064125A (ja) * | 2014-09-19 | 2016-04-28 | シナノケンシ株式会社 | 脳血管疾患の発症危険度予測システム |
Also Published As
| Publication number | Publication date |
|---|---|
| CN110402104B (zh) | 2023-02-28 |
| US20190387979A1 (en) | 2019-12-26 |
| JP2018153269A (ja) | 2018-10-04 |
| CN110402104A (zh) | 2019-11-01 |
| JP7056002B2 (ja) | 2022-04-19 |
| DE112018001363T5 (de) | 2019-11-21 |
Similar Documents
| Publication | Publication Date | Title |
|---|---|---|
| AU2010239127B2 (en) | Discrimination of Cheyne -Stokes breathing patterns by use of oximetry signals | |
| US10512429B2 (en) | Discrimination of cheyne-stokes breathing patterns by use of oximetry signals | |
| US20120203087A1 (en) | Systems and methods for monitoring depth of consciousness | |
| US12029590B2 (en) | Blood pressure surge pattern detection system | |
| WO2018168807A1 (ja) | 血圧測定装置、方法及びプログラム | |
| US20230293082A1 (en) | Systems and methods for measuring hemodynamic parameters with wearable cardiovascular sensing | |
| WO2022147271A1 (en) | Health monitoring and management system using ectopic beats as early cardiac health marker | |
| Han et al. | Detection of apneic events from single channel nasal airflow using 2nd derivative method | |
| JP6766710B2 (ja) | 血圧測定装置、方法及びプログラム | |
| JP6547838B2 (ja) | 診断支援装置、診断支援方法、診断支援プログラム | |
| US10327648B2 (en) | Blood vessel mechanical signal analysis | |
| Alshaer | New technologies for the diagnosis of sleep apnea | |
| US20220071495A1 (en) | Blood pressure-related information display device, blood pressure-related information display method, and a non-transitory computer-readable computer medium | |
| AU2013221962C1 (en) | Discrimination of Cheyne-Stokes Breathing Patterns by Use of Oximetry Signals | |
| US12186112B2 (en) | Blood pressure-related display device, blood pressure-related information display method, and computer-readable recording medium |
Legal Events
| Date | Code | Title | Description |
|---|---|---|---|
| 121 | Ep: the epo has been informed by wipo that ep was designated in this application |
Ref document number: 18768074 Country of ref document: EP Kind code of ref document: A1 |
|
| 122 | Ep: pct application non-entry in european phase |
Ref document number: 18768074 Country of ref document: EP Kind code of ref document: A1 |