WO2018100724A1 - スポットアレイ基板、核酸解析方法、及び核酸解析装置 - Google Patents
スポットアレイ基板、核酸解析方法、及び核酸解析装置 Download PDFInfo
- Publication number
- WO2018100724A1 WO2018100724A1 PCT/JP2016/085823 JP2016085823W WO2018100724A1 WO 2018100724 A1 WO2018100724 A1 WO 2018100724A1 JP 2016085823 W JP2016085823 W JP 2016085823W WO 2018100724 A1 WO2018100724 A1 WO 2018100724A1
- Authority
- WO
- WIPO (PCT)
- Prior art keywords
- spot
- array substrate
- nucleic acid
- substrate
- acid analysis
- Prior art date
Links
Images


Classifications
-
- C—CHEMISTRY; METALLURGY
- C12—BIOCHEMISTRY; BEER; SPIRITS; WINE; VINEGAR; MICROBIOLOGY; ENZYMOLOGY; MUTATION OR GENETIC ENGINEERING
- C12M—APPARATUS FOR ENZYMOLOGY OR MICROBIOLOGY; APPARATUS FOR CULTURING MICROORGANISMS FOR PRODUCING BIOMASS, FOR GROWING CELLS OR FOR OBTAINING FERMENTATION OR METABOLIC PRODUCTS, i.e. BIOREACTORS OR FERMENTERS
- C12M1/00—Apparatus for enzymology or microbiology
-
- C—CHEMISTRY; METALLURGY
- C12—BIOCHEMISTRY; BEER; SPIRITS; WINE; VINEGAR; MICROBIOLOGY; ENZYMOLOGY; MUTATION OR GENETIC ENGINEERING
- C12N—MICROORGANISMS OR ENZYMES; COMPOSITIONS THEREOF; PROPAGATING, PRESERVING, OR MAINTAINING MICROORGANISMS; MUTATION OR GENETIC ENGINEERING; CULTURE MEDIA
- C12N15/00—Mutation or genetic engineering; DNA or RNA concerning genetic engineering, vectors, e.g. plasmids, or their isolation, preparation or purification; Use of hosts therefor
- C12N15/09—Recombinant DNA-technology
-
- C—CHEMISTRY; METALLURGY
- C12—BIOCHEMISTRY; BEER; SPIRITS; WINE; VINEGAR; MICROBIOLOGY; ENZYMOLOGY; MUTATION OR GENETIC ENGINEERING
- C12Q—MEASURING OR TESTING PROCESSES INVOLVING ENZYMES, NUCLEIC ACIDS OR MICROORGANISMS; COMPOSITIONS OR TEST PAPERS THEREFOR; PROCESSES OF PREPARING SUCH COMPOSITIONS; CONDITION-RESPONSIVE CONTROL IN MICROBIOLOGICAL OR ENZYMOLOGICAL PROCESSES
- C12Q1/00—Measuring or testing processes involving enzymes, nucleic acids or microorganisms; Compositions therefor; Processes of preparing such compositions
- C12Q1/68—Measuring or testing processes involving enzymes, nucleic acids or microorganisms; Compositions therefor; Processes of preparing such compositions involving nucleic acids
-
- G—PHYSICS
- G01—MEASURING; TESTING
- G01N—INVESTIGATING OR ANALYSING MATERIALS BY DETERMINING THEIR CHEMICAL OR PHYSICAL PROPERTIES
- G01N21/00—Investigating or analysing materials by the use of optical means, i.e. using sub-millimetre waves, infrared, visible or ultraviolet light
- G01N21/62—Systems in which the material investigated is excited whereby it emits light or causes a change in wavelength of the incident light
- G01N21/63—Systems in which the material investigated is excited whereby it emits light or causes a change in wavelength of the incident light optically excited
- G01N21/64—Fluorescence; Phosphorescence
-
- G—PHYSICS
- G01—MEASURING; TESTING
- G01N—INVESTIGATING OR ANALYSING MATERIALS BY DETERMINING THEIR CHEMICAL OR PHYSICAL PROPERTIES
- G01N33/00—Investigating or analysing materials by specific methods not covered by groups G01N1/00 - G01N31/00
- G01N33/48—Biological material, e.g. blood, urine; Haemocytometers
- G01N33/50—Chemical analysis of biological material, e.g. blood, urine; Testing involving biospecific ligand binding methods; Immunological testing
-
- G—PHYSICS
- G01—MEASURING; TESTING
- G01N—INVESTIGATING OR ANALYSING MATERIALS BY DETERMINING THEIR CHEMICAL OR PHYSICAL PROPERTIES
- G01N37/00—Details not covered by any other group of this subclass
Definitions
- the present disclosure relates to a spot array substrate, a nucleic acid analysis method, and a nucleic acid analysis apparatus.
- Patent Document 1 describes a method of analyzing a single molecule of nucleic acid such as DNA.
- An optical confinement array (array density> 40 k / mm) in which an optical waveguide (hole) having a specific size is formed in a metal film.
- a fluorescent signal can be detected with high sensitivity by confining the intended reaction product in the optical confinement structure using 2 ).
- a porous material can be used for the portion of the optical confinement element (the waveguide portion that propagates light).
- Patent Documents 2 to 4 describe a method for analyzing the base sequence of DNA by an electrical measurement method, and a field effect transistor having a floating gate for analyzing DNA by measuring a change in potential. There is a description that a substrate having an array of openings (well structure) that reaches the upper surface of the member having the floating gate potential and is arranged in an array with the members having the floating gate potential facing the upper surface can be used.
- Patent Document 5 describes a method for analyzing the base sequence of DNA. Using a substrate having the function of an optical filter, light in a certain wavelength band is transmitted, while desired light in a certain wavelength band is transmitted. There is a description that reaction errors can be reduced by reflecting (light in a wavelength band that contributes to the reaction) and irradiating light that induces the reaction also from the back side of the sample bead that is the measurement target.
- the fluorescence-type DNA sequencer decodes a base by analyzing fluorescence generated when a reagent containing a fluorescent dye or an enzyme is reacted with DNA. Research and elucidation of the causal relationship between base sequence information and pathology revealed by such nucleic acid analysis technology is expected to expand the application to medical diagnosis. However, at present, the rate of use for research purposes is still high, and there is room for improvement in analysis accuracy and throughput.
- a fluorescent DNA sequencer measures fluorescence emitted by a reaction in a state in which analysis objects are randomly distributed on a flat analysis chip, and bases the data on the analysis of the fluorescence bright spots at random positions. Practical use was started from the form to identify.
- a replication DNA cluster formed on a bead in advance by another apparatus such as an emulsion PCR apparatus can be dispersed on the substrate, or after the DNA fragments are dispersed on the substrate, Replicating DNA clusters can also be formed.
- Patent Document 5 in such a system in which the objects to be analyzed are randomly distributed, an optical functional film (optical filter) is provided on the substrate, and the reaction error is reduced by sufficiently performing a reaction for DNA analysis.
- An optical functional film optical filter
- a method for improving the analysis accuracy of DNA and increasing the read length is disclosed.
- the reaction error can be improved by the method described in Patent Document 5, but since the analysis target is randomly fixed on the flat substrate, the analysis target is a coincidence. There are areas that do not exist and areas where adjacent analysis objects are too close to each other and the fluorescence overlaps and cannot be analyzed, and the efficiency of use of the area on the substrate of the flow cell where reaction events occur is low. As a result, a useless sample to be analyzed that does not contribute to analysis (beads that are not effective because the fluorescence overlaps with each other or mixed DNA clusters that are not effective) is generated, and therefore, it is separated from events in adjacent regions. In order to obtain a sufficient amount of data, the area of the analytical flow cell has to be widened.
- An integrated array has been considered as one of the promising methods for solving this problem. It will be one of the general concepts for performing tasks with high efficiency in the smallest possible area.
- the unit substrate area is minimized while minimizing the interference with the fluorescent events of the adjacent spots.
- the data acquisition amount per hit can be increased.
- Patent Document 1 discloses a method of detecting a fluorescence signal with high sensitivity by light confinement using a structure in which a waveguide (hole) having a specific size is formed in a metal film. The fluorescence intensity emitted by a single molecule is improved by using the principle of improving the light intensity by a waveguide (hole) having a special dimension.
- the electric signal measured for base identification is the charge of ions, and in order to increase the signal intensity, the loss of ions due to ion recombination reaction in solution is minimized. Therefore, measures different from the fluorescence measurement method, such as shortening the distance between the analysis target and the floating gate for ion measurement, are required. Also, with regard to crosstalk, adjacent wells are electrically insulated (for example, deeply separated from wells) rather than preventing light mixed in from adjacent wells by means such as light shielding, light absorption, and light reflection prevention (optical function film).
- Patent Documents 2 to 4 disclose a form in which a well is formed, but the well carries a replica DNA cluster bead prepared by a user with another device such as emPCR (held in a physically fitted state). And the ions released during the reaction for analysis are confined so as not to diffuse into the solution.
- the improvement of the signal S from the minute spot and the reduction of the background signal B due to crosstalk etc. are performed simultaneously. It is desirable to clarify the configuration of the substrate that can be realized.
- the present disclosure has been made in view of such a situation, and provides a spot array substrate for nucleic acid analysis that can arrange analysis targets for analyzing a base sequence with a high degree of integration and can prevent deterioration in signal acquisition performance. It is to provide.
- the nucleic acid analysis spot array substrate is a nucleic acid analysis spot array substrate used in a DNA sequencer for identifying a base sequence, and is formed of a first material and a plurality of spots arranged in an array. Is provided.
- the substrate has a coating layer made of a second material different from the first material in a region other than a region where a plurality of spots are arranged.
- each of the plurality of spots has a surface area increasing structure having a height difference with respect to the vertical direction of the substrate, and the actual surface area of each of the plurality of spots is the spot when the spot is viewed from above the substrate. It is larger than the area defined by the outer contour.
- a spot array substrate for nucleic acid analysis that can arrange analysis targets for analyzing a base sequence with a high degree of integration and that can prevent a decrease in signal acquisition performance.
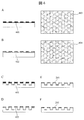
- FIG. 2A is a cross-sectional view and a fluorescent image of a spot array substrate as a comparative example in Example 1.
- 2B to 2D are diagrams showing a cross-sectional view of a prototype surface area increasing structure and corresponding fluorescent images.
- 6 is a diagram for explaining a configuration example of a spot array substrate for nucleic acid analysis according to Example 2.
- FIG. FIG. 1 is a cross-sectional view and a fluorescent image of a spot array substrate as a comparative example in Example 1.
- 2B to 2D are diagrams showing a cross-sectional view of a prototype surface area increasing structure and corresponding fluorescent images. 6 is a diagram for explaining a configuration example of a spot array substrate for nucleic acid analysis according to Example 2.
- FIG. 3A shows a cross-sectional structure of an array substrate of wells having an inner diameter of ⁇ 1 ⁇ m and a fluorescent image obtained using the substrate having the structure.
- FIG. 3B shows a cross-sectional structure of an array substrate of a well whose inner diameter is expanded to 2 ⁇ m in order to improve the fluorescence intensity, and a fluorescent image obtained using the substrate having the structure.
- FIG. 3C shows a cross-sectional structure of the array substrate additionally provided with the light shielding film 301 and a fluorescent image obtained therefrom.
- FIG. 10 is a diagram for explaining a configuration example of a spot array substrate according to a third embodiment.
- FIG. 10 is a diagram for explaining a configuration example of a spot array substrate according to a third embodiment.
- FIG. 4A shows a cross-sectional structure of a substrate in which a light-absorbing film 401 is additionally provided in a lower layer of a non-specific adsorption preventing film covering a flat portion other than a spot in a substrate having roughness on the surface of the spot, and the structure The fluorescence image obtained using the board
- FIG. 4B shows a substrate in which a porous material is used as a spot material, in which a film 402 having an antireflection function due to light interference is additionally provided below the non-specific adsorption prevention film covering a flat portion other than the spot.
- a cross-sectional structure and a fluorescent image obtained using a substrate having the structure are shown.
- FIG. 4C to 4F show the configuration of a spot array substrate for nucleic acid analysis according to a modification of Example 3.
- FIG. It is the schematic which shows the structural example of the nucleic acid analyzer 500 which can use the spot array substrate for nucleic acid analysis by Example 1 thru
- FIG. 6A shows an example of an observation result of fluorescence emitted by exciting with a light source 514 after causing an extension reaction in a spot on a substrate incorporated in the flow cell 501.
- FIG. 6B shows an example of an observation result of fluorescence emitted by exciting with a light source 514 after causing an extension reaction in a spot on a substrate incorporated in the flow cell 502.
- FIG. 6C shows an example of an observation result of fluorescence emitted by exciting with a light source 514 after causing an extension reaction in a spot on a substrate incorporated in the flow cell 503.
- Embodiments according to the present disclosure relate to a biomolecule analysis, particularly a nucleic acid analysis spot array substrate for decoding a nucleic acid base sequence with high efficiency and high accuracy, and a nucleic acid analysis system using the spot array substrate.
- the spot array substrate for nucleic acid analysis according to the embodiment is provided with a plurality of spots, and each spot has a surface area increasing structure.
- the surface increasing structure include a structure in which a well is dug, a structure in which roughness is formed, and a structure in which spots are formed with a porous material.
- FIG. 1A is a diagram showing a state (example) in which a replicated DNA cluster is formed on a flat substrate (substrate without a spot array) incorporated in a general flow cell.
- FIG. 1A is intended to outline a typical example of a general flow cell used in a fluorescent DNA sequencer.
- FIG. 1B is a diagram showing a configuration of a general spot array substrate and a state (example) in which a replicated DNA cluster is formed.
- FIG. 1A shows a state in which replicated DNA clusters are formed on a flat substrate.
- the surface of the flat substrate 101 is surface-modified 102 with functional groups + oligo DNA so that DNA can be immobilized on the substrate.
- the surface of the spot array substrate 103 is subjected to surface modification 102 with the same functional group + oligo DNA, and a non-specific adsorption preventing film is used to prevent non-specific adsorption of DNA on a flat portion other than the spot. 104 is given.
- FIG. 1B shows a state in which replicated DNA clusters are formed on a spot array substrate with a low integration degree (0.29 M / cm 2 , 20 ⁇ m pitch, spot size ⁇ 7 ⁇ m) incorporated in the flow cell.
- the spot array substrate 103 is used, the replicated DNA cluster 105 can be formed on the spots arrayed at a constant pitch. For this reason, it becomes possible to analyze using the area
- FIG. 1B since there is a spot 108 where a duplicate DNA cluster is not formed by chance, such an example is also shown in FIG. 1B.
- the degree of integration is low, the spot size is sufficiently large as ⁇ 7 ⁇ m, and the distance between adjacent spots is sufficiently wide as 13 ⁇ m. Therefore, it is possible to clearly separate adjacent replication DNA clusters and perform fluorescence observation and analysis.
- the substrate is configured in an array arrangement, in order to further increase the integration, it is necessary not only to reduce the pitch between spots but also to reduce the spot size. If the spot size is reduced, the number of DNA replicas that can be immobilized on the spot decreases, and the fluorescent signal S obtained from the spot becomes weak. On the other hand, if the pitch is reduced, the distances approach each other so that fluorescent signals from adjacent spots overlap, and the background signal B (note that the background signal (also referred to as background light) B is other than the target spot). (Consisting of signals from dark places).
- the S / B ratio decreases when the integration is high, there is a limit to the high integration when a general substrate (conventional technology) is used. Therefore, in order to further improve the throughput, it is necessary to prevent a decrease in the S / B ratio due to high integration, improve the accuracy of data, and increase the number of effective clusters that can be used for analysis.
- FIG. 2 is a diagram for describing a configuration example of the spot array substrate for nucleic acid analysis according to the first embodiment of the present disclosure.
- spot array substrate for nucleic acid analysis In a spot array (general spot array substrate) with a low degree of integration as shown in FIG. 1B, the spot size is sufficiently large as ⁇ 7 ⁇ m and the pitch is sufficiently wide as 20 ⁇ m. For this reason, the fluorescence intensity from the spot is sufficiently high, and the influence of crosstalk due to overlapping with the fluorescence of the adjacent spot is also sufficiently low. If a spot array with a low integration level of this level is used, it is possible to easily measure each spot separately. Then, in order to examine further higher integration, substrates with a pitch reduced to 4.2 ⁇ m and a spot size reduced to ⁇ 1 ⁇ m were prepared, and formation of replicated DNA clusters on these spots was attempted.
- a substrate material for example, plastic, glass, silicon, quartz, sapphire, amorphous carbon, or the like can be used.
- FIG. 2A is a cross-sectional view and a fluorescent image of a spot array substrate as a comparative example in Example 1. Similar to the one shown in FIG. 1B, planar spots 202 are formed in an array on the substrate 201 so as to be capable of forming a replicating DNA cluster. Further, the flat portion other than the spot is covered with the non-specific adsorption preventing film 203. Using this substrate, a replicated DNA cluster was formed, and the fluorescence image was observed. Then, at first, there was some overlap with the fluorescence of the adjacent spot, but after that, when the lens parts of the optical system were replaced and the optical axis and focus were readjusted, the fluorescence image 204 that did not overlap with the adjacent spot was obtained. It was able to be acquired (FIG. 2A right figure).
- 2B to 2D are diagrams showing a cross-sectional view of a prototype surface area increasing structure and corresponding fluorescent images.
- the material of the substrate 201 and the material of the non-specific adsorption preventing film 203 are exactly the same as those shown in FIG. 2A, and only the structure of the spot portion is different.
- the structure of the spot portion to which the surface area increasing structure is applied is the structure 205 in which a well is dug in FIG. 2B, the structure 206 in which roughness is formed in FIG. 2C, and the porous material 207 (material in FIG. The structure itself has many holes). Details of the roughness processing and the porous material will be described later.
- Fluorescence images obtained in each case are shown in the right diagrams of FIGS. 2B to 2D.
- each of the increased surface area structures shown in FIGS. The actual surface area is larger than the apparent occupied area defined by the outer contour of the spot when the spot is viewed from the top of the substrate by digging, forming the surface roughness, or utilizing the porous material. It is thought that the fluorescence signal became stronger as the number of replicating DNA immobilized was increased.
- the improvement rate of the fluorescence intensity depends on the well depth, the degree of roughness, the porosity of the porous material, etc., and thus cannot be generally stated, but in this experimental evaluation, among the three types of FIG. 2B to FIG. Then, a relatively strong fluorescence signal was obtained particularly in the form of FIG. 2C provided with roughness.
- the outer contour 208 of the fluorescent image has a relatively small spread with respect to the outer contour of the spot when the spot is viewed from above the substrate. Since the portion where the surface area is increased is the inner side surface of the well, it is considered that the influence of the fluorescent image spreading from the spot to the outside is relatively small.
- the outer contours 209 and 210 of the fluorescent image are slightly expanded at the same time as the fluorescence from the spot becomes brighter. found. It is considered that the effective surface area of the spot is increased by utilizing the surface roughness and the surface of the porous material, so that the number of DNA replicas immobilized on the spot is increased, and the fluorescence intensity is thereby increased. Further, in the configuration of FIG. 2C in which roughness is formed and in the configuration of FIG. 2D in which a porous material is used, a part of light is simultaneously scattered on the spot surface and spreads around the spot, and the outer contour of the fluorescent image is slightly outside. It is presumed that it was observed.
- Roughness processing is a processing method for forming a roughness structure in a spot portion.
- the roughness processing method include a method of roughening the surface by dry etching. If the material to be processed is, for example, silicon, a general dry etching (plasma etching) apparatus is introduced with a gas containing halogen such as chlorine or fluorine and an additive gas containing oxygen or carbon. In this state, an electrical bias is applied to the wafer, and ion species in the plasma are incident on the wafer to process silicon (can be dug in a direction perpendicular to the wafer). In a general semiconductor process, this additive gas is added to prevent the mask material and other materials constituting the wafer from being processed unexpectedly (in the processing of silicon and other materials). It is a role to improve selectivity).
- plasma etching plasma etching
- the processed finish surface can be roughened by adjusting the amount of additive gas and the bias applied to the wafer as described above. it can.
- the amount of added gas and the wafer bias it is possible to cleanly process the surface or roughen the surface depending on conditions. This fact is generally known in the processing process of semiconductor materials, and in the embodiment of the present disclosure, the surface area is increased under the condition that the surface roughness that is undesirable in many of the general semiconductor processes is increased. A surface structure can be used.
- porous material for example, a porous low-k material that has been researched and developed for applications such as reducing the dielectric constant of an interlayer insulating film that insulates between wirings of semiconductor devices and between wiring layers can be used.
- a porous film has been developed as one candidate for a material having a low dielectric constant to prevent this.
- An example of a method for producing a porous film is to apply a raw material of the film flatly and then heat-treat, thereby volatilizing a part of the components constituting the film and forming a porous material film having many pores. And so on.
- the dielectric constant is low
- the wiring layers of semiconductor integrated devices stacked in multiple layers have problems in thermal conductivity (heat dissipation of wiring heat generation), mechanical strength, and the like as compared with normal dense materials.
- heat generation of wiring as in a general semiconductor device, mechanical strength of a multilayer structure having a large total number, and the like. For this reason, it can be simply used as a film having a larger surface area than a dense film.
- Example 1 ⁇ Summary of Example 1> As described above, according to Example 1, in the fluorescence DNA sequencer, when the number of DNA replicas immobilized on a spot is increased using an integrated spot array substrate with an increased effective surface area of the spot, It was confirmed that the signal strength could be improved.
- the fluorescence signal from each spot is collected using a lens.
- the depth of the well formed on the substrate, the roughness structure and the thickness of the porous structure depth difference in the depth direction
- the fluorescence signal from a location far from the focal point of the lens will be blurred.
- the height difference in the depth direction of the surface area increasing structure formed on the substrate so as to increase the surface area of the spot needs to be adjusted appropriately so as not to become too large.
- a surface area having a height difference in the depth direction using a substrate having a spot array layout with a sufficiently wide pitch of 20 ⁇ m and a sufficiently large spot size of ⁇ 7 ⁇ m When the increase structure is provided, the intensity of the fluorescence signal is improved with an increase in the height difference when the height difference is in the range of 0 to 2 ⁇ m. However, when the height difference is 2 ⁇ m or more, the improvement in intensity is saturated (fluorescence) The signal intensity is less likely to improve). Thus, it was found that there is a particularly remarkable effect of improving the fluorescence signal in the range where the height difference in the depth direction of the surface area increasing structure is 2 ⁇ m or less.
- the well structure is applied to the spot portion as an example, and the signal acquisition performance is confirmed in the same manner.
- the range of the height difference in which the signal acquisition performance can be obtained is shallower than that in the case of the above spot size ⁇ 7 ⁇ m (2 ⁇ m), especially in the range where the height difference of the well structure is 0 to 500 nm. It was confirmed that the fluorescence signal increased with the increase.
- the spot size is reduced and the fluorescence microscope magnification for observing the spot is increased, so that the focal length is shortened, and accordingly, the surface area increasing structure in which the high signal acquisition performance can be obtained in the depth direction. It is thought that the range of the height difference became narrow.
- Another reason is that, for example, in the case of a well structure, such as the side surface thereof, a portion that is difficult to see when viewed from above the substrate (roughness inclined surface for a roughness structure, interior of a pore structure for a porous structure, etc.) ), There is a possibility that the excitation efficiency for exciting the fluorescent dye is lower than in the case of the planar spot.
- the fluorescence signal was increased as the height difference was increased at the depth where the height difference was 1 ⁇ 2 of the spot diameter. It was found that the improvement in the intensity of the fluorescent signal tends to saturate when the difference in height increases to 1 ⁇ 2 or more. Probably, when the height difference is larger than 1 ⁇ 2 of the spot diameter, as described above, the number of portions that are difficult to be irradiated with excitation light increases, and the excitation efficiency of the portion that is difficult to see when viewed from above the substrate is increased. It is thought that it will decline. As described above, it was found that the effect of improving the intensity of the fluorescence signal is particularly high when the height difference in the depth direction of the surface area increasing structure is in the range up to 1 ⁇ 2 of the diameter of the spot viewed from above.
- the expression “well structure” is used, but this expression does not limit the shape of the depression (well structure).
- a cylindrical well may be dug into the substrate, and the shape may be composed of a side surface standing perpendicular to the bottom surface horizontal to the substrate, and the side surface may vary depending on the conditions of well processing during substrate fabrication. Even if it becomes a forward taper and an inverted frustoconical depression, it does not change that the surface area increases compared to a planar spot.
- the well structure may have an inverted conical shape in which the bottom of the well structure is pointed downward, or the bottom is rounded (generally It is not always necessary to have a circular shape when viewed from above, such as a cylinder, an inverted truncated cone, and an inverted cone. Even if it is a table, an inverted pyramid, or various other shapes, the same effect of increasing the surface area can be obtained as long as some concave depressions are arrayed on the substrate.
- Example 2 The spot array substrate for nucleic acid analysis according to Example 2 relates to a configuration example that can increase the intensity of a fluorescent spot and at the same time prevent the spread of the outer contour by applying a surface area increasing structure to the spot portion. It is.
- FIG. 3 is a diagram for explaining a configuration example of the spot array substrate for nucleic acid analysis according to the second embodiment.
- S / B ratio is further improved by using a structure in which a well is dug in the spot portion.
- Example 2 As described in Example 1, in the spot array substrate for nucleic acid analysis in FIG. 2B in which wells are dug in the spot portion, the fluorescence image is more out of the configuration according to FIGS. 2C and 2D using roughness formation or porous material. The outline spread is slightly small. For this reason, it was speculated that the influence of crosstalk with adjacent spots would be relatively small among the three types. Therefore, in Example 2, a spot array substrate having a specification in which wells were dug in the spot portion was selected, and further enlargement of the surface area and prevention of crosstalk were studied.
- FIG. 3A shows the cross-sectional structure of a spot substrate of a well having an inner diameter of ⁇ 1 ⁇ m and a fluorescent image obtained using the substrate having the structure, as in FIG. 2B.
- FIG. 3B shows a cross-sectional structure of a spot substrate in which the well inner diameter is enlarged to ⁇ 2 ⁇ m in order to improve the fluorescence intensity, and a fluorescence image obtained using the substrate having the structure.
- the number of DNA replicas that can be immobilized also increases by increasing the inner diameter of the well, and the fluorescence intensity of the spot increased.
- FIG. 3C shows a cross section of a spot substrate additionally provided with a light shielding film 301 and a fluorescent image obtained therefrom.
- the well inner diameter is enlarged to 2 ⁇ m, but the diameter of the opening of the light shielding film 301 is 1 ⁇ m.
- the outer contour 303 of the fluorescent image shown in FIG. 3C can be reduced as in the case of FIG. 3A as compared with the outer contour 304 of the fluorescent image of FIG. 3A in which the well opening is simply 1 ⁇ m. It was found that the fluorescence intensity is stronger than that in FIG. 3A and is advantageous over a simple well having an inner diameter of 1 ⁇ m.
- FIG. 3C shows a structure in which the diameter of the well dug into the substrate below the opening diameter of the light shielding film additionally provided in the lower layer of the non-specific adsorption preventing film covering the flat portion other than the spot is expanded. It is shown.
- a structure can be manufactured by controlling bias application by dry etching.
- bias application by dry etching it is required that the material exposed in the opening of the mask be processed faithfully with respect to the dimensions of the mask.
- an electrical bias is applied to the wafer so that ion species in the plasma are incident on the wafer perpendicularly, and the workpiece material is dug in a direction perpendicular to the wafer.
- processing isotropically proceeds in the lateral direction as well.
- a metal light-shielding film on a silicon substrate, a water-repellent film and a resist mask pattern are formed thereon. First, the water-repellent film and the metal light-shielding film are opened with a smaller diameter.
- the processing is performed by lowering the wafer bias and increasing the temperature of the substrate than the normal processing condition in the direction perpendicular to the substrate.
- Silicon can be etched not only in the direction perpendicular to the substrate (downward in the cross-sectional structure in the figure) but also in the lateral direction of the substrate to form the structure as shown.
- the mask pattern and dimensions are shifted, which is not preferable. Side etching, undercut, etc. Often called and strives to reduce this.
- the metal light shielding film even if the well structure is laterally expanded in the lower layer of the metal light shielding film as described above, the well inner surface area is ensured widely, and the metal light shielding film appropriately prevents crosstalk with adjacent spots. It can be used as a form to prevent.
- the wells are dug into the spot portions to increase the surface area to fix the analysis target, and the contours of the fluorescent images from the spots are adjacent.
- it is effective to adopt a configuration (the state shown in FIG. 3A) that does not overlap the contour of the fluorescent image from the spot to be performed.
- it is possible to further increase the fluorescence intensity by further expanding the inner diameter of the well. However, if only the inner diameter is increased, the outline of the fluorescence from the spot will overlap with the outline of the fluorescence from the adjacent spot (Fig. 3B state).
- Example 3 relates to another configuration example of a spot array substrate in which each spot portion has a surface area increasing structure, thereby increasing the intensity of fluorescence and at the same time preventing the expansion of the outer contour of the fluorescence.
- S / B ratio is further improved by using a configuration in which roughness is formed in a spot portion and a configuration using a porous material.
- FIG. 4 is a diagram for explaining a configuration example of the spot array substrate according to the third embodiment.
- FIG. 4A shows a cross-sectional structure of a substrate in which a light absorption film 401 is additionally provided in a lower layer of a non-specific adsorption prevention film covering a flat portion other than a spot in a substrate having roughness formed in a spot portion, and the structure The fluorescence image obtained using the board
- a film 402 having an antireflection function due to light interference is additionally provided below the nonspecific adsorption preventing film covering the flat portion other than the spot.
- a cross-sectional structure of the substrate and a fluorescent image obtained using the substrate having the structure are shown.
- Example 1 in both the spot array substrate subjected to the roughness processing and the spot array substrate using the porous material, the fluorescence from the spot became bright and the outer contour of the fluorescent image was It has spread.
- Example 3 using the optical functional film the light absorbing film 401 or the film 402 having an antireflection function due to optical interference
- a spot array substrate in which the roughness is applied to the spot portion, and the porous
- the spread of the fluorescent image is prevented by suppressing the scattered light by the optical functional film (the light absorbing film 401 or the film 402 having an antireflection function by light interference).
- the crosstalk can be reduced and the S / B ratio can be increased.
- the well opening is simply 1 ⁇ m
- the outer contour 403 of the fluorescent image shown in FIG. 4A and the outer contour of the fluorescent image shown in FIG. 4B. 404 can be reduced to the same extent.
- the fluorescence it was confirmed that a stronger intensity was maintained than in the case of FIG. 3A.
- the optical functional film may be provided only in the peripheral portion of the spot without being formed in the entire lower layer of the non-specific absorption preventing film covering the region other than the spot. That is, at least the optical functional film may be provided in a range in which the fluorescence from each spot does not cause crosstalk.
- ⁇ Modification> 4C to 4F show the configuration of a spot array substrate for nucleic acid analysis according to a modification of Example 3.
- FIG. As a modified example, a well is formed at each spot of the substrate and the bottom surface thereof is subjected to roughness processing (see FIGS. 4C and E), or a well is formed at each spot of the substrate and the bottom surface is porous. A configuration using materials (see FIGS. 4D and F) is conceivable.
- the modification shown in FIGS. 4C and 4D includes the configuration in which wells are dug in each spot of the substrate shown in Example 1 and Example 2, and the configuration or porous material subjected to roughness processing shown in Example 3.
- the present invention relates to a combination of the configuration used and an optical function film (light absorption film 401 or film 402 having an antireflection function due to light interference). By adopting such a configuration, compared to a simple spot structure in which the surface area is not increased, an effect of brightening fluorescence and reducing crosstalk with adjacent spots can be obtained.
- 4E and 4F relate to a combination of a configuration in which a well is dug in a spot of a substrate and a configuration in which roughness processing is performed or a configuration using a porous material shown in Example 3.
- the spot whose surface area is increased is surrounded by the side wall of the well, and there is an effect of suppressing the spread of fluorescence from the spot. For this reason, even if it is a form only of the nonspecific adsorption
- the roughness material and the porous material for increasing the surface area are arranged on the bottom surface of the well dug to suppress the spread of fluorescence from the spot.
- the side wall of the well surrounding these surface area increasing structures can suppress the spread of fluorescence from the spot if it is a material that is opaque to some extent, such as silicon, and has an effect of light shielding and light reflection. can get.
- the substrate material is a material that has a light-shielding or light-reflecting effect that can reduce crosstalk with adjacent spots
- the side wall of the well or the side wall of the well such as the upper part of the side wall
- the effect of reducing crosstalk with adjacent spots can also be obtained by using, for example, a configuration using an optical functional film having a light-shielding and light-reflecting effect such as a metal film as an example.
- the method of enlarging the well interior shown in Example 2 in the lateral direction to occupy the surface area occupies space in the lateral direction, which is a limitation in promoting higher integration in the future.
- Example 4 In Example 4, an example of analysis using a flow cell that can incorporate the spot array substrate for nucleic acid analysis according to Examples 1 to 3 described above will be described.
- FIG. 5 is a schematic diagram illustrating a configuration example of a nucleic acid analysis apparatus 500 that can use the spot array substrate for nucleic acid analysis according to the first to third embodiments.
- a flow cell for comparison, a flow cell 501 incorporating a spot array substrate (4.2 ⁇ m pitch, spot diameter ⁇ 1 ⁇ m) in which spots are planar and areas other than the spots are covered with a non-specific adsorption preventing film, the spots are planar.
- a flow cell 502 incorporating a spot array substrate (1.2 ⁇ m pitch, spot diameter ⁇ 0.8 ⁇ m) in which a region other than a spot is covered with a non-specific adsorption preventing film, and the spot portion has a roughness structure and other than a spot
- Three types of flow cell 503 incorporating a spot array substrate (1.2 ⁇ m pitch, spot diameter ⁇ 0.8 ⁇ m) additionally provided with a light absorbing film under the non-specific adsorption preventing film covering the flat part are prepared, A comparative evaluation was performed.
- the solution introduced through the solution introduction ports of the flow cells 501 to 503 flows through the inside of the flow cell incorporating each of the spot array substrates described above, and is discharged from the solution discharge port to the waste liquid container 518.
- the flow cell 501 was used for evaluation.
- a template DNA having an unknown sequence at least in part to be analyzed is immobilized on an array spot that is surface-modified with an oligo DNA on an amino group-modified surface, and then replicated on the spot. (Replicated DNA cluster) was analyzed by fluorescence measurement, and the base sequence was decoded.
- the temperature of the flow cell 501 can be controlled by the temperature adjustment function 504.
- a reaction reagent unit 505 for supplying several reaction reagents is installed at a temperature at which the reaction does not proceed in the reagent, and is connected to the flow cell 501 by a piping tube.
- the reaction reagent unit 505 is configured to supply five types of reagents 506 and 508 to 511.
- Reagent 506 includes a reagent (template DNA with a complementary sequence) in which a template DNA having an unknown sequence in at least a part to be analyzed is bound to a sequence complementary to an oligo DNA (known sequence) on an array spot It is.
- the reagent 508 is a reagent for duplicating on the array spot, including dATP, dGTP, dCTP, dTTP, and an enzyme.
- the reagent 509 is a reagent containing dATP-fluorescent dye 1, dGTP-fluorescent dye 2, dCTP-fluorescent dye 3, dTTP-fluorescent dye 4, and an extension reaction enzyme.
- the reagent 510 is a dye-binding cleaving reagent that cleaves the bond between the four types of dNTPs and the fluorescent dye.
- the reagent 511 is an aqueous electrolyte solution for use in replacement and washing of the liquid in the flow cell.
- an electrolyte aqueous solution 513 that is equivalent to isopropyl alcohol 512 and reagent 511 was prepared. These solutions are pipetted into the flow cell.
- Isopropyl alcohol 512 is used for solution replacement in the flow cell and may be another alcohol such as ethyl alcohol.
- a light source 514 that generates excitation light for exciting various fluorescent dyes included in the reagent 509, an optical system 515 for measuring fluorescence from the fluorescent dye, and a photodetector 516 are installed. Yes. Even an opaque substrate can be irradiated with excitation light or detected from the top, and can be excited and detected from below the substrate if it is a transparent substrate.
- the upper and lower arrangement of the detector is not particularly limited. As long as temperature control, light excitation, and fluorescence observation can be performed, the optical system may be arranged either above or below the flow cell.
- the fluorescence signal received by the photodetector 516 is converted into an electrical signal and transferred to the analysis device 517.
- the analysis device 517 performs analysis such as base identification and fragment data joining from the transferred signal, and decodes the base sequence of the nucleic acid.
- fluorescent dyes 1 to 4 contained in the reagent 509 various fluorescent dyes such as Alexa488, Cy3, Cy5, Cy5.5, Alexa555, Alexa647, Alexa680, dR6G, dR110, dTAMRA, and dROX are commercially available. It is well known that an appropriate one can be selected and used so that the wavelengths do not partially overlap. It is also well known that at least one or more suitable wavelengths can be selected as the wavelength of the light source 514 for efficiently exciting the fluorescent dye according to the selection of these dyes.
- the flow cell 501 was set in the nucleic acid analyzer in a state where it was filled with the aqueous electrolyte solution 513 and the bubbles were removed. As described above, the flow cell was set in the DNA sequencer, and the preparation was completed.
- the reagent 506 containing the template DNA with complementary sequence 507 is automatically injected into the flow cell 501 by the liquid feeding unit, and in this state, the liquid feeding is stopped once, set to the optimum temperature and left for 10 minutes, Hybridized and immobilized on an oligo DNA modified spot array. Since the flat portion other than the spot on the substrate was covered with the nonspecific adsorption preventing material, the template DNA 507 with complementary sequence was not adsorbed outside the spot array, and the nonspecific adsorption was not a problem.
- a spot array modified with oligo DNA is arranged on a substrate incorporated in the flow cell 501, and among these, a duplicate DNA cluster of a template DNA 507 with a complementary sequence is formed on a certain percentage of spots determined by probability theory. I was able to. The rate at which replicated DNA clusters can be formed with respect to all spots varies depending on the concentration of template DNA in reagent 506.
- the temperature was set to an appropriate temperature, and the reagent 509 was supplied to the flow cell to cause an elongation reaction with the enzyme.
- the reaction once stops after the extension reaction to the first base species of the template DNA occurs.
- excitation light was emitted from the light source 514, and the fluorescence emitted at this time was measured by the optical system 515 and the photodetector 516.
- the flow cell 503 has a pitch reduced to 1.2 ⁇ m, and a spot in which a light absorption film is additionally provided under the non-specific adsorption preventing film that employs a roughness structure on the surface of the spot and covers a flat portion other than the spot. An array substrate is incorporated.
- the procedure of fluorescence measurement is exactly the same as the procedure performed in the flow cell 501.
- FIG. 6 is a diagram showing a result of measurement using each flow cell by the nucleic acid analyzer 500.
- FIG. 6A shows fluorescence emitted by excitation with a light source 514 after causing an extension reaction in an array spot on a substrate (4.2 ⁇ m pitch, spot diameter ⁇ 1 ⁇ m) incorporated in the flow cell 501.
- a substrate 4.2 ⁇ m pitch, spot diameter ⁇ 1 ⁇ m
- FIG. 6A shows the outer contour of the fluorescent image outside the fluorescent image of the adjacent spot. An image separated from the neighbor could be obtained without overlapping the outline.
- FIG. 6B is generated by exciting the light source 514 after causing an extension reaction in an array spot on a substrate (1.2 ⁇ m pitch, spot diameter ⁇ 0.8 ⁇ m) incorporated in the flow cell 502. 2 shows an example of the observation result of fluorescence. Since the flow cell 502 has a 1.2 ⁇ m pitch and the pitch interval is reduced, the outer contour of the fluorescent image overlaps with the outer contour of the fluorescent image of the adjacent spot, as shown in FIG. 6B. As a result, the background signal B is increased.
- FIG. 6C shows a substrate (1.2 ⁇ m pitch, spot diameter ⁇ 0.8 ⁇ m, non-specific adsorption preventing film in which the spot portion covers a flat portion other than the roughness structure + spot) incorporated in the flow cell 503.
- An example of the observation result of the fluorescence emitted by exciting with the light source 514 after causing the extension reaction in the array spot on the upper layer) is shown.
- the pitch interval of the flow cell 503 is reduced to 1.2 ⁇ m, as shown in FIG. 6C, not only the intensity S of the fluorescent image is improved, but also the outer contour of the fluorescent image is a fluorescent image of an adjacent spot. It became clear that the background signal B can be reduced without overlapping with the outer contour of.
- the dye 510 is dyed at an appropriate temperature with a reagent 510 containing a dye-binding cleaving reagent that cleaves the bond between the four dNTPs and the fluorescent dye.
- the liquid in the flow cell containing the cleaved dye was once washed away with the electrolyte solution of the reagent 511. Thereafter, the reagent 509 was automatically injected again, and the measurement and analysis of fluorescence by the second and subsequent bases were similarly repeated.
- the base sequence was also analyzed by such a procedure, and the difference depending on the flow cell was evaluated. As a result, in the case where the background light from the adjacent replicated DNA cluster was mixed, naturally, errors were frequently generated even when the wavelength and intensity of the obtained fluorescence were analyzed.
- the replication of the template DNA immobilized on one array spot modified with the oligo DNA needs to be a replication of one type of template DNA.
- a spot where the template DNA could not be immobilized stochastically as a defective spot other than one type of template DNA replicated on one spot.
- two different types of template DNA are replicated on one spot.
- a base signal cannot be obtained, or two types of signals are obtained simultaneously, and cannot be used as data.
- Other methods have been devised, such as adjusting the concentration of aqueous solution to reduce defective spots where two types of template DNA have been replicated, and re-immobilizing template DNA to spots where template DNA has not been immobilized.
- the effective rate of data obtained from the array spot can be improved.
- a protocol for replicating template DNA on a substrate a method described in US ⁇ 2012/0156728 A1 can be used.
- the details of the on-substrate replication technology are not particularly limited, and details of the protocol are not particularly shown.
- Example 4 using a flow cell incorporating a spot array substrate according to the present disclosure, DNA replication was performed on the array spot of the substrate, and DNA containing an unknown sequence in a part to be analyzed was decoded.
- the flow cell incorporating the spot array substrate of the present disclosure can be applied not only to DNA but also to decoding of other nucleic acids such as RNA.
- the heater filament mark and the convex lens mark are symbolically used for the temperature control function and the optical system, but the temperature control function is cooled by air cooling, water cooling, a cooling element, or the like. In addition to its functions, it can be controlled to a constant temperature by a general temperature control method such as PID control, and the optical system has a spectral function such as a spectroscope and a color filter in addition to a convex lens. Needless to say, it is a general thing to be able to distinguish.
- the spot pitch is 20 ⁇ m and the spot size is ⁇ 7 ⁇ m
- the spot is sufficiently large so that the fluorescent signal from the spot is strong and the pitch is sufficiently wide so that the adjacent spot There is no interference with the signal from.
- the pitch of the spot is reduced to 4.2 ⁇ m (in the example, to a minimum of 1.2 ⁇ m)
- the spot becomes smaller and the intensity of the fluorescent signal becomes weaker. Interference (crosstalk) with the signal from becomes a problem.
- the present invention relates to a spot array substrate for improving the intensity of a fluorescent signal and the separability between adjacent spots for the purpose of miniaturization to such a size range or less and high integration.
- the spot array substrate according to each example is a spot array substrate for nucleic acid analysis used for analyzing and identifying a base sequence using fluorescence.
- the spot array substrate for nucleic acid analysis is formed of plastic, glass, silicon, quartz, sapphire, amorphous carbon or the like (first material), and a plurality of spots are arrayed on the surface.
- a non-specific adsorption preventing film (a coating layer made of the second material) can be provided in a region other than a region where a plurality of spots are arranged.
- Each spot has a surface area increasing structure (a concave dent structure, a roughness structure, or a surface structure formed using a porous material) having a height difference with respect to the vertical direction of the substrate.
- a surface area increasing structure a concave dent structure, a roughness structure, or a surface structure formed using a porous material
- the actual surface area of each spot is larger than the area defined by the outer contour of the spot when the spot is viewed from above the substrate.
- an optical functional film (a light-shielding film, a light-absorbing film, or a film having an anti-reflection function due to optical interference: a third material) may be provided between the substrate and the nonspecific adsorption-preventing film. It can. By doing in this way, generation
- the optical functional film does not need to be provided over the entire lower layer of the region where the nonspecific adsorption preventing film is provided, and may be provided at least in the peripheral portion of each spot.
- the present disclosure provides a flow cell for nucleic acid analysis.
- the flow cell for nucleic acid analysis incorporates a spot array substrate for nucleic acid analysis having the above-described configuration, and includes at least one liquid inlet and at least one liquid outlet.
- the pitch is reduced with higher integration, and the occupied space of the spot (the outer contour size of the spot) ) Is reduced, the effective surface area for immobilizing the replicating DNA cluster can be gained to prevent a decrease in the intensity of the signal S, and crosstalk (background signal B) between adjacent spots can be reduced.
- the S / B ratio in fluorescence observation can be kept high.
- by using a substrate that can maintain a high S / B ratio despite the increase in the degree of integration it is possible to increase the number of effective clusters that can be used for analysis by obtaining highly accurate data. And high throughput nucleic acid analysis can be realized.
- the present disclosure is not limited to the above-described embodiments, and includes various modifications.
- the above-described embodiments have been described in detail for easy understanding of the present disclosure, and are not necessarily limited to those having all the configurations described.
- a part of the configuration of one embodiment can be replaced with the configuration of another embodiment, and the configuration of another embodiment can be added to the configuration of one embodiment.
- the spread of the fluorescent image may be further improved by improving the optical system.
- light scattering at spots on the substrate should be addressed by devising the substrate. it is conceivable that.
- the method of the present disclosure that is devised on the substrate side is useful for further high integration.
Abstract
スポットアレイ基板の高集積化に伴うS/B低下を防止して核酸解析スループットを向上する。 本開示は、第1の材料の表面にスポットがアレイ配置され、スポット以外の領域が第2の材料で被覆されている基板において、スポットを基板上方より見込んだときのスポットの外輪郭が規定する面積よりも実際の表面積が大きくなるように、基板に垂直な方向に対して高低差のある表面積増加構造をスポットの部分に形成した、核酸分析用スポットアレイ基板を提案する。
Description
本開示は、スポットアレイ基板、核酸解析方法、及び核酸解析装置に関する。
特許文献1には、DNAなど核酸の単一分子を解析する方法が記載されており、金属膜に特定の寸法の光導波路(穴)を形成した光閉じ込め構造のアレイ(アレイ密度>40k/mm2)を用いて、意図した反応生成物を光閉じ込め構造内に閉じ込めることにより、高感度に蛍光信号を検出することができるとの記載がある。また、光閉じ込め素子の部分(光を伝播する導波路部分)に多孔材料を用いることができるとの記載がある。
特許文献2乃至4には、電気的な計測方式によりDNAの塩基配列を解析する方法が記載されており、電位の変化を測定することによってDNAを解析するために、浮遊ゲートを有する電界効果トランジスタの浮遊ゲート電位の部材を上面に向けてアレイ配置し、その浮遊ゲート電位の部材の上面まで到達する開口部(ウェル構造)のアレイを有する基板を用いることができるとの記載がある。
特許文献5には、DNAの塩基配列を解析する方法が記載されており、光学フィルタの機能を備えた基板を用いて、ある波長帯の光は透過させ、一方、ある波長帯の所望の光(反応に寄与する波長帯の光)を反射させ、反応を誘起する光を測定対象である検体ビーズの裏面方向からも照射して、反応エラーを低減することができるとの記載がある。
DNAやRNAなどの核酸を解析する方法として、塩基を光学的に計測し識別する方法や電気的に計測し識別する方法など、様々な方式が検討されている。その一つとして、蛍光方式DNAシーケンサは、蛍光色素や酵素を含む試薬をDNAと反応させた際に発生する蛍光を解析することにより塩基を解読するものである。このような核酸の解析技術により明らかになった塩基配列情報と病理の因果関係を研究し、解明していけば、医療診断への応用が拡がっていくものと期待される。しかし、現状は、まだ、研究用途に使用される割合が高く、解析精度やスループットには改善の余地がある。医療診断技術として、将来、広く普及していくためには、解析精度やスループットの更なる向上が望まれる。高いスループットでデータを取得することができれば、診断結果を早く出せるだけでなく、豊富なデータを用いて、より精度の高い解析(確度の高い診断)が可能となり、データあたり、診断結果あたりにかかるコストの低減にも繋がると期待できる。また、同じ量の検体サンプルから同じ時間内に、より精度の高いデータをより多く取得できるようになれば、検体サンプルの少量化にもつながると考えられる。これに対し、大量のデータを高いスループットで取得するためのデータ取得効率の向上や、これらのデータの信頼性を向上するための蛍光信号の強度の向上などに向けた研究開発が継続的に進められている。
データ取得効率を向上するためには、蛍光計測用フローセル内の分析用チップ上において、分析対象である複製DNAクラスターをできるだけ高密度に形成し、できるだけ多くのデータを並列して取得する必要がある。従来、蛍光方式のDNAシーケンサは、平面状の分析用チップ上に分析対象がランダムにばらまかれた状態において、反応により発せられた蛍光を計測し、ランダム位置の蛍光の輝点のデータ解析から塩基を識別する形態より実用化が開始された。分析対象としては、例えば、予め、エマルジョンPCR装置などの別装置によってビーズ上に複製DNAクラスターを形成したものを基板上にばらまくこともでき、また、基板上にDNA断片をばらまいた後に基板上で複製DNAクラスターを形成することもできる。特許文献5には、このように分析対象をランダムにばらまく方式において、基板に光学機能膜(光学フィルター)を設け、DNAの分析のための反応を十分に行わせることにより反応エラーを低減してDNAの解析精度を向上し、リード長を長くする方法が開示されている。
基板上の複製DNAクラスターの配置がランダムとなる方式では、反応エラーは特許文献5に記載の方法で改善できるが、フラットな基板上にランダムに分析対象を固定化しているため、分析対象が偶然存在しない領域や、隣接した分析対象が接近しすぎることにより蛍光が隣同士重なって混ざってしまい解析ができない領域が存在し、反応イベントがおこるフローセルの基板上の領域の利用効率が低かった。結果として、解析に寄与しない無駄になる分析対象サンプル(蛍光が隣同士重なって混ざってしまうため有効でないビーズ、あるいは、有効でない複製DNAクラスター)が発生してしまい、従って、隣接領域のイベントと分離された十分な量のデータを取得するためには分析用フローセルの面積を広くせざるを得なかった。
これを解決する有望な方法の一つとして、集積アレイ化が考えられてきた。できるだけ狭い面積で高効率にタスクを実行するための一般的な概念の1つであろう。フローセルの基板上に分析対象が固定化できるスポットを隣接スポットと一定間隔のピッチを保って離散的かつできるだけ密に配置することにより、隣接スポットの蛍光イベントとの干渉をできるだけ抑えながら、単位基板面積当たりのデータ取得量を増加させることができる。
しかし、集積アレイ化により、分析対象が固定化できるスポットを隣接スポットと一定間隔のピッチを保って配置したとしても、今後さらにデータ取得効率を増していくために高集積化を進めていくためには、分析対象を固定化するスポットのサイズも縮小せざるを得ない。このため、スポットに固定化できる、あるいは、スポット上に形成できるDNAの複製数が減少し、スポットから発せられる蛍光信号は弱くなってしまう。また、同時に、隣接スポット同士の間隔も狭くなっていくため、隣接スポットからの蛍光の重なりの影響も増加していくことになる。今後、さらなる高集積化を進めていくためには、スポットサイズが小さくなっても十分な強度の蛍光信号が得られ、かつ、隣接スポットからの蛍光の重なりの影響(クロストーク)をできるだけ抑制できるフローセル用チップの開発が必要である。
また、分析対象としてビーズ上や基板上に複製DNAクラスターを形成してDNAを解析する方式ではなく、単分子DNAシーケンサにおいて、信号強度を向上するために光学機能膜を活用している技術がある。例えば、特許文献1には、金属膜に特定の寸法の導波路(穴)を形成した構造を用いて光閉じ込めにより高感度に蛍光信号を検出する方法が開示されている。特殊な寸法の導波路(穴)により光強度を向上する原理を用いることによって単分子の発する蛍光強度を向上している。
さらに、複製DNAクラスターアレイからの蛍光を計測する方式のシーケンサや、蛍光計測方式の単分子DNAシーケンサだけでなく、電気的計測方式のシーケンサにおいても、高集積アレイの適用が進められている。例えば、特許文献2~4には、浮遊ゲートを有する電界効果トランジスタの浮遊ゲート電位の部材を上面に向けてアレイ状に配置し、その浮遊ゲート電位の部材の上面まで到達する開口部(ウェル構造)のアレイを有する基板を用いて塩基配列を解読する方法が開示されている。
しかし、電気的計測方式の場合には、塩基識別のために計測する電気信号がイオンの持つ電荷であり、信号強度を増すためには溶液中でのイオン再結合反応によるイオンの消失をできるだけ少なくするために分析対象とイオン計測用の浮遊ゲートの距離を短くするなど、蛍光計測方式とは異なる対策が必要となる。また、クロストークについても、遮光、光吸収、光反射防止といった手段(光学機能膜)による隣接ウェルから混入する光を防止するのではなく、隣接ウェル同士を電気的に絶縁する(例えばウェルを深くして絶縁距離を広げ、隣接ウェル同士の絶縁性を高める)ことが効果的であり、蛍光計測方式のDNAシーケンサとは、改善のための施策が根本的に異なる。特許文献2~4には、ウェルを形成した形態を開示しているが、ウェルはemPCRなどの別の装置でユーザーが作製した複製DNAクラスタービーズを担持する(物理的に嵌め込んだ状態で保持する)ための役割や分析のための反応時に放出されたイオンが溶液中に拡散しないように閉じ込める役割を果たしているものである。
以上のように、さらなる微細化と高集積化の必要なDNAシーケンサでは、できるだけ多くのデータを同時並列に取得してスループットを向上するためにアレイの集積度を向上する必要がある。そのためには、分析対象であるDNAクラスターを固定化あるいは形成するために設けたスポットの間隔(ピッチ)を狭くするだけでなく、スポットのサイズも小さくしなければならない。このため、スポット上に形成されるDNAクラスター内の複製数が少なくなりスポットからの信号が弱くなる、あるいは、DNAクラスターが固定化されて信号を発する有効なスポットの数が少なくなる等により、解析の性能は低下してしまうであろう。一方、もし、ピッチを狭くしたにもかかわらず、スポットのサイズを小さくしないのであれば、隣接スポットとの間隔(=ピッチ-スポット径)が狭くなってしまい、隣接スポット間の干渉(クロストーク)が増大してしまうであろう。スポットアレイ基板において、スポットからの信号の強度や有効スポット率が低下しないように、高集積化を進めるためには、微小スポットからの信号Sの向上とクロストーク等による背景信号Bの低減を同時に実現できる基板の構成を明らかにしていくことが望まれる。
本開示はこのような状況に鑑みてなされたものであり、塩基配列を解析するための分析対象を高い集積度で配列でき、かつ、信号取得性能の低下を防止できる核酸分析用スポットアレイ基板を提供するものである。
本開示はこのような状況に鑑みてなされたものであり、塩基配列を解析するための分析対象を高い集積度で配列でき、かつ、信号取得性能の低下を防止できる核酸分析用スポットアレイ基板を提供するものである。
上記課題を解決するために、本開示では、新規な核酸分析用スポットアレイ基板について提案する。一例として、当該核酸分析用スポットアレイ基板は、塩基配列を識別するDNAシーケンサで用いられる核酸分析用スポットアレイ基板であって、第1の材料で形成され、複数のスポットがアレイ配置されている基板を備える。当該基板は、複数のスポットが配置されている領域以外の領域に、第1の材料とは異なる第2の材料で構成される被覆層を有する。また、複数のスポットのそれぞれは、基板の垂直方向に対して高低差のある表面積増加構造を備え、複数のスポットのそれぞれの実際の表面積は、当該スポットを基板の上方から見込んだときのスポットの外輪郭が規定する面積よりも大きい。
本開示に関連する更なる特徴は、本明細書の記述、添付図面から明らかになるものである。また、本開示の態様は、要素及び多様な要素の組み合わせ及び以降の詳細な記述と添付される特許請求の範囲の様態により達成され実現される。
本明細書の記述は典型的な例示に過ぎず、本開示の特許請求の範囲又は適用例を如何なる意味に於いても限定するものではないことを理解する必要がある。
本明細書の記述は典型的な例示に過ぎず、本開示の特許請求の範囲又は適用例を如何なる意味に於いても限定するものではないことを理解する必要がある。
本開示によれば、塩基配列を解析するための分析対象を高い集積度で配列でき、かつ、信号取得性能の低下を防止できる核酸分析用スポットアレイ基板を実現することが可能となる。
上記した以外の、課題、構成及び効果は、以下の実施形態の説明により明らかにされる。
上記した以外の、課題、構成及び効果は、以下の実施形態の説明により明らかにされる。
本開示による実施形態は、生体分子の解析、特に核酸の塩基配列を高効率、高精度で解読するための核酸分析用スポットアレイ基板、及びそのスポットアレイ基板を用いた核酸解析システムに関する。一例として、当該実施形態による核酸分析用スポットアレイ基板には複数のスポットが設けられ、各スポットが表面積増加構造をなしている。表面増加構造の例としては、ウェルを掘り込んだ構造、ラフネスを形成した構造、多孔材料でスポットを形成した構造などが挙げられる。
以下、添付図面を参照して本開示の実施形態について説明する。添付図面では、機能的に同じ要素は同じ番号で表示される場合もある。なお、添付図面は本開示の原理に則った具体的な実施形態と実装例を示しているが、これらは本開示の理解のためのものであり、材料及び寸法などを厳密に特定するものではなく、決して本開示を限定的に解釈するために用いられるものではない。
本実施形態では、当業者が本開示を実施するのに十分詳細にその説明がなされているが、他の実装・形態も可能で、本開示の技術的思想の範囲と精神を逸脱することなく構成・構造の変更や多様な要素の置き換えが可能であることを理解する必要がある。従って、以降の記述をこれに限定して解釈してはならない。
(1)一般的な基板の構成及びその欠点について
まずは、本開示によるスポットアレイ基板の特徴を明らかにするために、DNAシーケンサで用いられるフローセルに組み込まれる一般的な基板(図1A参照:スポットアレイの無い基板)と、一般的なスポットアレイ基板(図1B参照)について説明する。
まずは、本開示によるスポットアレイ基板の特徴を明らかにするために、DNAシーケンサで用いられるフローセルに組み込まれる一般的な基板(図1A参照:スポットアレイの無い基板)と、一般的なスポットアレイ基板(図1B参照)について説明する。
図1Aは、一般的なフローセルに組み込んだフラット基板(スポットアレイの無い基板)上で複製DNAクラスターを形成した様子(例)を示す図である。図1Aは、蛍光方式DNAシーケンサに用いられる一般的なフローセルの代表例を概説するためのものである。図1Bは、一般的なスポットアレイ基板の構成及び複製DNAクラスターを形成した様子(例)を示す図である。
図1Aには、フラット基板上で複製DNAクラスターを形成した様子が示されている。基板にDNAが固定化できるように、例えば、フラット基板101は、表面に官能基+オリゴDNAでの表面修飾102が施されている。また、スポットアレイ基板103のスポット表面には、同様の官能基+オリゴDNAでの表面修飾102が施されたうえ、スポット以外の平坦部にはDNAが非特異吸着しないように非特異吸着防止膜104が施されている。
図1Aに示すように、フラット基板101を用いた場合には、複製DNAクラスター105が基板上のランダムな位置に形成される。このため、複製DNAクラスターが偶然存在しない領域106や、隣接した複製DNAクラスターが接近しすぎる箇所も形成されることがある。これにより蛍光が隣同士重なって混ざってしまい、解析ができない領域(解析不能領域)107が存在し、フローセルの基板上の領域の利用効率が低くなってしまう。
一方、図1Bには、フローセルに組み込んだ集積度の低い(0.29M個/cm2、20μmピッチ、スポットサイズφ7μm)スポットアレイ基板上で複製DNAクラスターを形成した様子が示されている。スポットアレイ基板103を用いた場合には、一定のピッチでアレイ配列したスポット上に複製DNAクラスター105を形成できる。このため、フローセルに組み込んだ基板上の領域を効率良く用いて解析を行うことが可能となる。但し、偶然に複製DNAクラスターが形成されないスポット108も存在するため、図1Bにはそのような例も示されている。図1Bの例では、集積度が低いため、スポットサイズもφ7μmと十分に大きく、隣接スポットとの間隔も13μmと十分に広く確保されている。従って、隣接した複製DNAクラスターを明確に分離して蛍光観察、解析を行うことが可能である。
しかしながら、たとえアレイ配列で基板を構成したとしても、さらに高集積化を進めていくためには、スポット間のピッチを小さくしていくだけでなく、スポットサイズも小さくしていく必要がある。もし、スポットサイズを小さくすると、スポットに固定化できるDNA複製数が減少し、スポットより得られる蛍光信号Sは弱くなってしまう。一方、もし、ピッチを小さくすると、距離が接近することにより、隣接スポットからの蛍光信号が重なり合うようになり、背景信号B(なお、背景信号(背景光ともいう)Bは、対象のスポット以外の箇所(暗い部分も含む)からの信号で構成される)が増加してしまう。このように、高集積化するとS/B比が低下してしまうため、一般的な基板(従来技術)を用いる場合には高集積化に限界がある。従って、さらなるスループットの向上のためには、高集積化に伴うS/B比の低下を防止して、データの精度を向上し、解析に用いることができる有効クラスター数を増加させる必要がある。
(2)実施例1
図2は、本開示の実施例1による核酸分析用スポットアレイ基板の構成例を説明するための図である。
図2は、本開示の実施例1による核酸分析用スポットアレイ基板の構成例を説明するための図である。
<核酸分析用スポットアレイ基板の構成例>
図1Bに示すような集積度の低いスポットアレイ(一般的なスポットアレイ基板)では、スポットサイズはφ7μmと十分大きく、ピッチは20μmと十分広い。このため、スポットからの蛍光強度は十分高く、また、隣接スポットの蛍光と重なることによるクロストークの影響も十分に低い。このレベルの低集積度のスポットアレイを用いるのであれば、スポットごとに分離した計測が容易に可能である。そこで、次に、さらなる高集積化を検討するために、ピッチを4.2μmまで縮め、スポットサイズをφ1μmまで縮小した基板を作製し、これらのスポット上に複製DNAクラスターの形成を試みた。なお、基板の材料としては、例えば、プラスティック、ガラス、シリコン、石英、サファイア、アモルファスカーボン等を用いることができる。
図1Bに示すような集積度の低いスポットアレイ(一般的なスポットアレイ基板)では、スポットサイズはφ7μmと十分大きく、ピッチは20μmと十分広い。このため、スポットからの蛍光強度は十分高く、また、隣接スポットの蛍光と重なることによるクロストークの影響も十分に低い。このレベルの低集積度のスポットアレイを用いるのであれば、スポットごとに分離した計測が容易に可能である。そこで、次に、さらなる高集積化を検討するために、ピッチを4.2μmまで縮め、スポットサイズをφ1μmまで縮小した基板を作製し、これらのスポット上に複製DNAクラスターの形成を試みた。なお、基板の材料としては、例えば、プラスティック、ガラス、シリコン、石英、サファイア、アモルファスカーボン等を用いることができる。
図2Aは、実施例1における比較例としてのスポットアレイ基板の断面図と蛍光像を示す図である。図1Bに示したものと同様に、基板201上に複製DNAクラスターの形成ができるように表面修飾した平面型スポット202がアレイ状に形成されている。また、スポット以外の平坦部は、非特異吸着防止膜203により被覆されている。この基板を用いて、複製DNAクラスターを形成し、その蛍光像を観察した。すると、初めは隣接スポットの蛍光との重なりが若干みられたが、その後、光学系のレンズ部品の交換や、光軸、焦点の再調整を行ったところ、隣接スポットと重ならない蛍光像204を取得することができた(図2A右図)。
次に、スポットからの蛍光信号の増大に対する表面積増加構造の効果を検討するために、3種の表面積増加構造を試作した。図2B~Dは、試作した表面積増加構造の断面図と対応する蛍光像を示す図である。この例では、基板201の材料や非特異吸着防止膜203の材料は、図2Aに示したものと全く同じであり、スポット部分の構造のみが異なっている。平面型スポット202と比較して、表面積増加構造を適用したスポット部分の構造は、図2Bではウェルを掘り込んだ構造205、図2Cではラフネスを形成した構造206、図2Dでは多孔材料207(材料自体に多くの孔が存在する構造)となっている。なお、ラフネス加工、及び多孔材料の詳細については後述する。
それぞれにおいて得られた蛍光像を図2B乃至Dの右図に示す。図2Aに示した平坦なスポットの基板により得られた結果と比較して、図2B乃至Dに示されるそれぞれの表面積増加構造では、いずれも蛍光像が明るくなった。掘り込みや表面ラフネスの形成、あるいは、多孔材料の活用により、スポットを基板上方から見込んだときのスポットの外輪郭によって規定される見かけの占有面積よりも、実際の表面積が大きくなったことにより、複製DNAの固定化数が増加して蛍光信号が強くなったものと考えられる。
なお、蛍光強度の向上率については、ウェル深さやラフネスの程度、多孔材料の多孔率などに依存するので、一概には言えないが、今回の実験評価では、図2B乃至Dの3種の中では、特にラフネスを設けた図2Cの形態で比較的強い蛍光信号が得られた。また、その他の特徴として、ウェルを掘り込んだ図2Bでは、スポットを基板上方から見込んだときのスポットの外輪郭に対して蛍光像の外輪郭208の拡がりが比較的小さかった。表面積が増加した部分がウェルの内側の側面であるため、蛍光像がスポットから外側に拡がる影響が比較的小さかったことによるものと考えられる。一方、ラフネスを形成した図2Cの構成、及び多孔材料を活用した図2Dの構成では、スポットからの蛍光が明るくなったのと同時に、蛍光像の外輪郭209、210がやや拡がっていることが判明した。表面ラフネスや多孔材料表面の活用により、スポットの実効的な表面積が増大したため、スポットに固定化されたDNA複製数は増大し、これにより蛍光強度は増大したと考えられる。また、ラフネスを形成した図2Cの構成、及び多孔材料を活用した図2Dの構成では、同時にスポット表面で一部の光が散乱して、スポット周辺部に拡がり、蛍光像の外輪郭がやや外側に拡がって観測されたものと推定される。
<ラフネス加工の概要>
ラフネス加工は、スポットの部分にラフネス構造を形成するための加工方法である。ラフネス加工方法としては、例えば、ドライエッチングにより表面を荒らす方法が挙げられる。被加工材料が例えばシリコンであれば、一般的なドライエッチング(プラズマエッチング)装置に、塩素やフッ素などのシリコンを侵食するハロゲンを含むガスと、酸素あるいは炭素などを含む添加ガスが導入される。そして、その状態で、ウェハに電気的なバイアスを印加してプラズマ中のイオン種がウェハに入射され、シリコンが加工される(ウェハに垂直な方向に掘ることができる)。一般的な半導体プロセスでは、この添加ガスは、マスク材料やウェハを構成する他の材料が意に反して加工されてしまうことを防止するために添加されている(シリコンと他の材料の加工の選択性を向上する役割である)。
ラフネス加工は、スポットの部分にラフネス構造を形成するための加工方法である。ラフネス加工方法としては、例えば、ドライエッチングにより表面を荒らす方法が挙げられる。被加工材料が例えばシリコンであれば、一般的なドライエッチング(プラズマエッチング)装置に、塩素やフッ素などのシリコンを侵食するハロゲンを含むガスと、酸素あるいは炭素などを含む添加ガスが導入される。そして、その状態で、ウェハに電気的なバイアスを印加してプラズマ中のイオン種がウェハに入射され、シリコンが加工される(ウェハに垂直な方向に掘ることができる)。一般的な半導体プロセスでは、この添加ガスは、マスク材料やウェハを構成する他の材料が意に反して加工されてしまうことを防止するために添加されている(シリコンと他の材料の加工の選択性を向上する役割である)。
しかしながら、表面に酸化膜や炭素系堆積膜を形成しやすいこれらの添加ガスの導入量を増すと、本来の被加工材料であるシリコン自体も加工されにくくなる(加工速度が遅くなっていく)。また、添加ガスの導入量をさらに過剰に増すと、加工されない部分(ハロゲンガスによる侵食が停止してしまう部分)が、シリコン表面上にまばらに発生しはじめる。さらに、ウェハに印加するバイアスを過剰に増すと、ハロゲンガスによってウェハに垂直方向に深く加工される部分と添加ガスによる阻害によって加工が停止した部分との差が強調され、加工後の表面は荒れた状態となる。一般的な半導体プロセスでは、被加工材料を加工した後の表面は平坦であることが望ましいことが殆どである。このため、あえて加工を阻害する添加ガス量を過剰に増やした上、ウェハに印加するバイアスを過剰に増すことは好ましくない。一方、本実施例のようにあえて荒れた表面を用いたい場合には、上述のような添加ガス量とウェハに印加するバイアスを調整することにより、加工仕上がり表面の荒れた状態に至らせることができる。以上のように、添加ガス量やウェハバイアスを調整すると、条件によって、きれいに平坦な表面に加工することも表面を荒らすこともできる。この事実は、半導体材料の加工プロセスにおいては一般的に知られていることであり、本開示の実施例では、一般の半導体プロセスの多くでは好ましくない表面ラフネスが増してしまう条件で表面積を増した表面構造を用いることができる。
<多孔材料の概要>
多孔材料として、例えば、半導体デバイスの配線間、配線層間を絶縁する層間絶縁膜の低誘電率化などの用途で研究開発されてきたポーラスLow-k材料などを活用することができる。半導体デバイスにおいては、微細化の進行とともに近接する配線同士の距離が短くなることによる配線間の静電容量の増大が、配線を伝わる信号の遅延を引き起こす。このことから、これを防止する誘電率の低い材料の一つの候補として、多孔構造の膜(ポーラス膜)が開発されてきた。多孔構造の膜の製造方法の一例は、膜の原料を平坦に塗布した後に加熱処理することで、膜を構成する成分の一部を揮発させ、多くの空孔を有する多孔材料膜を形成する方法などである。誘電率は低いものの、多層に積み重ねた半導体集積デバイスの配線層においては、通常の緻密な材料と比較して熱伝導性(配線発熱の放熱性)や機械的強度などに課題がある。しかしながら、本開示の実施例では、一般的な半導体デバイスのような配線の発熱や総数の多い多層構造の機械的強度等は課題とならない。このため、単純に、緻密な膜よりも表面積の多い膜として用いることができる。
多孔材料として、例えば、半導体デバイスの配線間、配線層間を絶縁する層間絶縁膜の低誘電率化などの用途で研究開発されてきたポーラスLow-k材料などを活用することができる。半導体デバイスにおいては、微細化の進行とともに近接する配線同士の距離が短くなることによる配線間の静電容量の増大が、配線を伝わる信号の遅延を引き起こす。このことから、これを防止する誘電率の低い材料の一つの候補として、多孔構造の膜(ポーラス膜)が開発されてきた。多孔構造の膜の製造方法の一例は、膜の原料を平坦に塗布した後に加熱処理することで、膜を構成する成分の一部を揮発させ、多くの空孔を有する多孔材料膜を形成する方法などである。誘電率は低いものの、多層に積み重ねた半導体集積デバイスの配線層においては、通常の緻密な材料と比較して熱伝導性(配線発熱の放熱性)や機械的強度などに課題がある。しかしながら、本開示の実施例では、一般的な半導体デバイスのような配線の発熱や総数の多い多層構造の機械的強度等は課題とならない。このため、単純に、緻密な膜よりも表面積の多い膜として用いることができる。
<実施例1のまとめ>
以上のように、実施例1によれば、蛍光方式DNAシーケンサにおいて、スポットの実効的な表面積を増大した集積スポットアレイ基板を用いて、スポットに固定化されるDNA複製数を増加させると、蛍光信号の強度を向上できることが確認された。
以上のように、実施例1によれば、蛍光方式DNAシーケンサにおいて、スポットの実効的な表面積を増大した集積スポットアレイ基板を用いて、スポットに固定化されるDNA複製数を増加させると、蛍光信号の強度を向上できることが確認された。
しかしながら、ここまでの検討では、表面積増加構造の形態によっては、構造物表面形態に起因した光散乱により、隣接スポットに及ぼすクロストークの影響が大きくなる場合があることも判明した。
なお、各スポットからの蛍光信号は、レンズを用いて集光される。この場合、基板に形成されたウェルの深さやラフネス構造ならびにポーラス構造の厚さ(深さ方向の高低差)が大きすぎるとレンズの焦点から遠くにある箇所からの蛍光信号はぼけてしまうため、焦点の合った信号が少なくなってしまう。よって、スポットの表面積を増加させようとして基板に形成する表面積増加構造の深さ方向の高低差は、大きくなり過ぎないように適宜調整する必要がある。
例えば、深さ方向を考慮した信号取得性能を確認するために、ピッチが20μmと十分広く、スポットサイズがφ7μmと十分に大きいスポットアレイのレイアウトの基板を用い、深さ方向に高低差を有する表面積増加構造を設けた場合、その高低差が0~2μmの範囲では蛍光信号の強度は高低差の増大に伴い向上したが、高低差が2μm以上となると、強度の向上は飽和していく(蛍光信号の強度が向上しにくくなる)傾向を示した。このように、表面積増加構造の深さ方向の高低差2μm以下の範囲で、特に顕著な蛍光信号の向上の効果があることがわかった。
一方、これよりもさらに微細化した、ピッチ4.2μm、スポットサイズφ1μmのスポットアレイ基板において、一例として、そのスポット部分にウェル構造を適用して、同様に、信号取得性能を確認したところ、高い信号取得性能が得られる深さ方向の高低差の範囲が、上記のスポットサイズφ7μmの場合(2μm)よりも浅くなり、特に、ウェル構造の高低差が0~500nmまでの範囲において、深さの増大に伴い蛍光信号が増大することが確認された。
この理由として、ひとつは、スポットサイズが小さくなり、スポットを観察するための蛍光顕微鏡倍率を高くしたため、焦点距離が短くなり、これに従って、高い信号取得性能が得られる表面積増加構造の深さ方向の高低差の範囲が狭くなったと考えられる。また、もうひとつの理由として、例えばウェル構造であれば、その側面など、基板の上方から見込んだときに見えにくい部分(ラフネス構造ならばラフネスの傾斜面、多孔構造であれば孔構造の内部など)において、平面型スポットの場合と比較して、蛍光色素を励起する励起効率が低くなっている可能性も考えられる。
スポットサイズと表面積増加構造の深さ方向の高低差との関係をもう少し調べてみたところ、スポットの直径に対して、高低差が1/2となる深さまでは、高低差を増大するに従って蛍光信号の強度は向上していくが、高低差が1/2以上に大きくなると、蛍光信号の強度の向上は飽和する傾向であることがわかった。おそらく、高低差がスポットの直径の1/2よりも大きくなると、上に述べたように、励起光が照射されにくい部分が増加し、基板の上方から見込んだときに見えにくい部分の励起効率が低下していくのではないかと考えられる。このように、表面積増加構造の深さ方向の高低差が、上から見込んだスポットの直径の1/2までの範囲で、特に、蛍光信号の強度の向上効果が高いことがわかった。
なお、基板に何らかの窪みがあることを簡単に表現するために、ウェル構造という表現を用いているが、この表現は、窪み(ウェル構造)の形状を限定するものではない。単純に、基板に対し円柱型のウェルを掘り込んで、基板に対して水平な底面と垂直に立った側面より成る形態であっても良く、また、基板作製時のウェル加工の条件によって側面が順テーパとなり、逆円錐台型の窪みとなっても、平面型スポットより表面積が増加することには変わりない。それ以外にも、基板に対して水平な底面が存在せず、ウェル構造の底部が下方に向かって尖ったような逆円錐型であっても、あるいは、底部に丸みのついた形態(一般的な試験管の底部のような形態)であっても良く、また、円柱、逆円錐台、逆円錐のように、上から見込んだときに円形であることは必ずしも必要ではなく、角錐、逆角錐台、逆角錐であっても良いし、それ以外の様々な形状であっても、基板に何らかの凹型の窪みをアレイ配置したものであれば、同様の表面積増加による効果が得られる。
(3)実施例2
実施例2による核酸分析用スポットアレイ基板は、スポットの部分に表面積増加構造を適用することにより、蛍光スポットの強度を増加させ、同時に外輪郭の拡がりを防止することを可能にする構成例に関するものである。
実施例2による核酸分析用スポットアレイ基板は、スポットの部分に表面積増加構造を適用することにより、蛍光スポットの強度を増加させ、同時に外輪郭の拡がりを防止することを可能にする構成例に関するものである。
<核酸分析用スポットアレイ基板の構成例>
図3は、実施例2による核酸分析用スポットアレイ基板の構成例を説明するための図である。ここでは、スポットの部分にウェルを掘り込んだ構造を用いて、さらにS/B比を向上した例について説明する。
図3は、実施例2による核酸分析用スポットアレイ基板の構成例を説明するための図である。ここでは、スポットの部分にウェルを掘り込んだ構造を用いて、さらにS/B比を向上した例について説明する。
実施例1で述べたように、スポットの部分にウェルを掘り込んだ図2Bの核酸分析用スポットアレイ基板では、ラフネス形成や多孔材料を用いた図2C及び図2Dによる構成よりも蛍光像の外輪郭の拡がりがやや小さい。このため、隣接スポットとのクロストークの影響は、3種の中では比較的小さいのであろうと推測した。そこで、実施例2では、スポット部分にウェルを掘り込んだ仕様のスポットアレイ基板を選択して、さらなる表面積の拡大とクロストークの防止について検討した。
図3Aは、図2Bと同様に、内径φ1μmのウェルのスポット基板の断面構造、及び当該構造の基板を用いて得られた蛍光像を示す。図3Bは、蛍光強度を向上するためにウェル内径をφ2μmまで拡大したスポット基板の断面構造、及び当該構造の基板を用いて得られた蛍光像を示す。両者の蛍光像からも分かるように、ウェル型の構造を持つ表面積増加構造においては、ウェルの内径を拡げることによっても、固定化できるDNA複製数が増加するため、スポットの蛍光強度は増加した。
しかしながら、φ1μm→φ2μmへの拡大では、隣接スポットから観測される蛍光像の外輪郭同士がぎりぎり接してしまうという状況となってしまい、ウェル径を少し拡げ過ぎたと考えられる。
そこで、図3Bに示す4.2μmピッチ、ウェル内径2μmの構成に対し、スポット以外の平坦部を被覆している非特異吸着防止膜の下層に遮光膜301を追設した基板を作製した。図3Cは、遮光膜301を追設したスポット基板の断面及びそれから得られる蛍光像を示している。図3Cに示されるように、ウェル内径は2μmまで拡大されているが、遮光膜301の開口部の直径は1μmとした。遮光膜301を設けることにより、蛍光像の外輪郭303が、図3Bに示した蛍光像の外輪郭302よりも縮小されている。これより、クロストークが低減できることがわかる。また、単純にウェルの開口が1μmである図3Aの蛍光像の外輪郭304と比較して、図3Cに示した蛍光像の外輪郭303は、図3Aの場合と同様に縮小できていると共に、蛍光強度は図3Aの場合よりも強く、内径1μmの単純なウェルよりも有利であることがわかった。
<図3Cのウェルの製造方法について>
以下、図3Cに示されるウェル内部の空間を横方向にも拡げて内部の表面積を広くした構造の製造方法について説明する。
以下、図3Cに示されるウェル内部の空間を横方向にも拡げて内部の表面積を広くした構造の製造方法について説明する。
図3Cには、スポット以外の平坦部を被覆している非特異吸着防止膜の下層に追設した遮光膜の開口径よりも、さらにその下の基板に掘り込んだウェルの直径が拡がった構造が示されている。このような構造は、一例として、ドライエッチングによるバイアス印加の制御で作製することができる。一般的には、ドライエッチングによる加工ではマスクの開口部において露出している材料を、マスクの寸法に対して忠実に加工することが求められる。これを実現するために、ドライエッチングでは一般に、ウェハに電気的なバイアスを印加してプラズマ中のイオン種をウェハに垂直に入射させ、被加工材料をウェハに垂直な方向に掘って加工する。しかしながら、もし、加工時に、ウェハへのバイアス印加を低減、あるいは、ゼロにして、プラズマ中のイオン種のウェハへの入射エネルギーを低下させ、かつ、ウェハ温度をある程度高くすると、ウェハに垂直な方向だけでなく、横方向にも等方的に加工が進行するようになる。例えば、シリコン基板上にメタル遮光膜を成膜してから、その上に撥水膜、レジストマスクパターンを形成し、まず、撥水膜とメタル遮光膜を小さめの径で開口する。次に、開口部において露出した基板のシリコンを加工してウェルを形成する際に、通常基板に垂直方向に加工する条件よりもウェハバイアスを低くし、基板の温度を高くして加工を行うと、シリコンは基板に垂直方向(図中の断面構造では下方向)だけでなく、基板の横方向にもエッチングされて、図示したような構造を形成することができる。一般的な半導体製造プロセスでは、横方向にも加工されてしまうと、マスクパターンと寸法がずれてしまうので好ましくなく、このように横方向にエッチングされてしまうことを、サイドエッチング、アンダーカットなどと呼び、これを低減するように努めることが多い。一方、本開示では、このようにウェル構造がメタル遮光膜の下層で横方向に広がる形態となってもウェル内部表面積が広く確保され、かつ、メタル遮光膜により隣接スポットとのクロストークを適切に防止する形態として活用することができる。
<実施例2のまとめ>
スポットアレイ基板において、高集積化を図るためにはスポット数を増やす必要がある。スポット数を増やすためには、スポット間のピッチを縮小する必要があり、一例としてスポット部分にウェルを掘り込んで、分析対象を固定化する表面積を増しつつ、スポットからの蛍光像の輪郭が隣接するスポットからの蛍光像の輪郭と重ならないような構成(図3Aの状態)をとることは、実施例1にも述べたように有効である。一方、このウェルの内径をさらに拡げることにより、さらに蛍光強度を増すことは可能だが、内径を拡げるだけでは、スポットからの蛍光の輪郭が隣接するスポットからの蛍光の輪郭といずれ重なってしまう(図3Bの状態)。
スポットアレイ基板において、高集積化を図るためにはスポット数を増やす必要がある。スポット数を増やすためには、スポット間のピッチを縮小する必要があり、一例としてスポット部分にウェルを掘り込んで、分析対象を固定化する表面積を増しつつ、スポットからの蛍光像の輪郭が隣接するスポットからの蛍光像の輪郭と重ならないような構成(図3Aの状態)をとることは、実施例1にも述べたように有効である。一方、このウェルの内径をさらに拡げることにより、さらに蛍光強度を増すことは可能だが、内径を拡げるだけでは、スポットからの蛍光の輪郭が隣接するスポットからの蛍光の輪郭といずれ重なってしまう(図3Bの状態)。
そこで、深さ方向にウェルを掘り込み、さらに、ウェルの内径を拡げた構成でも、隣接スポットからの蛍光像と重ならないように遮光膜で蛍光像の重なりを適切に制限する構成(図3Cの状態)のスポットアレイ基板構造が提案された。
図3Cに示されるように、ウェルを基板の下方に向かって掘り込むだけでなく、ウェルの直径を拡げることでも表面積が増加して蛍光強度が増大し、あわせて、ウェル以外の部分をうまく遮光してクロストークを低減することにより、単純にウェルを掘り込んだものよりもさらにS/B比を向上できることが明らかになった。
(4)実施例3
<核酸分析用スポットアレイ基板の構成例>
実施例3は、各スポットの部分を表面積増加構造とすることにより、蛍光の強度を増したうえ、同時に蛍光の外輪郭の拡がりを防止できるスポットアレイ基板の別の構成例に関する。ここでは、スポットの部分にラフネスを形成した構成、多孔材料を用いた構成を用いることにより、さらにS/B比を向上した例について説明する。図4は、実施例3によるスポットアレイ基板の構成例を説明するための図である。
<核酸分析用スポットアレイ基板の構成例>
実施例3は、各スポットの部分を表面積増加構造とすることにより、蛍光の強度を増したうえ、同時に蛍光の外輪郭の拡がりを防止できるスポットアレイ基板の別の構成例に関する。ここでは、スポットの部分にラフネスを形成した構成、多孔材料を用いた構成を用いることにより、さらにS/B比を向上した例について説明する。図4は、実施例3によるスポットアレイ基板の構成例を説明するための図である。
実施例1で述べたように、各スポットの部分にラフネス加工を施した基板(図2C参照)、及びスポットの部分に多孔材料を用いた基板(図2D参照)では、おそらく表面構造の影響により、蛍光像の外輪郭の拡がりがやや大きめであった。そこで、実施例3では、スポットの部分にラフネスを形成した基板、スポットの部分に多孔材料を用いた基板を用いて、クロストークの防止について検討する。
図4Aは、スポットの部分にラフネスを形成した基板において、スポット以外の平坦部を被覆している非特異吸着防止膜の下層に光吸収膜401を追設した基板の断面構造、及びその構造の基板を用いて得られた蛍光像を示している。また、図4Bは、スポットの部分に多孔材料を用いた基板において、スポット以外の平坦部を被覆している非特異吸着防止膜の下層に光干渉による反射防止機能を有する膜402を追設した基板の断面構造と、その構造の基板を用いて得られた蛍光像を示している。実施例1で示した結果では、ラフネス加工を施したスポットアレイ基板、及び多孔材料を用いたスポットアレイ基板のいずれにおいても、スポットからの蛍光が明るくなったのと同時に、蛍光像の外輪郭が拡がってしまっていた。しかし、光学機能膜(光吸収膜401或いは光干渉による反射防止機能を有する膜402)を用いた実施例3においては、スポットの部分にラフネス加工を施したスポットアレイ基板(図4A)、及び多孔材料を用いたスポットアレイ基板(図4B)のいずれにおいても、光学機能膜(光吸収膜401或いは光干渉による反射防止機能を有する膜402)による散乱光の抑制により蛍光像の拡がりが防止されており、クロストークを低減してS/B比をかせぐことができることが分かった。
また、図3Aに示した単純にウェルの開口が1μmである蛍光像の外輪郭304と比較して、図4Aに示した蛍光像の外輪郭403、及び図4Bに示した蛍光像の外輪郭404は、それと同程度まで縮小できている。また、蛍光に関しては、図3Aの場合よりも強い強度を保っていることが確認された。
なお、光学機能膜は、スポット以外の領域を被覆している非特異吸収防止膜の下層の全体に形成せずに、スポット周辺部分のみに設けるようにしても良い。つまり、少なくとも、各スポットからの蛍光のそれぞれがクロストークを発生させない範囲で光学機能膜を設ければよい。
<変形例>
図4C乃至Fは、実施例3の変形例による核酸分析用スポットアレイ基板の構成について示している。変形例として、基板の各スポットにウェルを形成し、かつ、その底面にラフネス加工を施した構成(図4C及びE参照)や、基板の各スポットにウェルを形成し、かつ、その底面に多孔材料を用いた構成(図4D及びF参照)が考えられる。
図4C乃至Fは、実施例3の変形例による核酸分析用スポットアレイ基板の構成について示している。変形例として、基板の各スポットにウェルを形成し、かつ、その底面にラフネス加工を施した構成(図4C及びE参照)や、基板の各スポットにウェルを形成し、かつ、その底面に多孔材料を用いた構成(図4D及びF参照)が考えられる。
図4C及びDに示す変形例は、実施例1や実施例2に示した、基板の各スポットにウェルを掘り込んだ構成と、実施例3に示す、ラフネス加工を施した構成或いは多孔材料を用いた構成と、光学機能膜(光吸収膜401或いは光干渉による反射防止機能を有する膜402)との組み合わせに関する。このような構成を採用することにより、表面積を増加していない単純なスポット構造の場合と比較して、蛍光を明るくすると同時に隣接スポットとのクロストークを低減する効果が得られる。
また、図4E及びFに示す変形例は、基板のスポットにウェルを掘り込んだ構成と、実施例3に示す、ラフネス加工を施した構成或いは多孔材料を用いた構成との組み合わせに関する。このような構成を採用することにより、ウェルの側壁によって表面積を増加させたスポットが取り囲まれることになり、スポットからの蛍光の拡がりを抑える効果がある。このため、光学機能膜を用いずに非特異吸着防止膜203だけの形態であっても、隣接スポットとのクロストークを低減する効果がある。なお、この図4E及びFに示す変形例では、一例として、表面積を増加させるためのラフネス材料や多孔材料は、掘り込んだウェルの底面に配してあり、スポットからの蛍光の拡がりを抑えるために、これらの表面積増加構造を取り囲んでいるウェルの側壁は、一例として、シリコンのような、ある程度不透明で遮光や光反射の効果がある材料であれば、スポットからの蛍光の拡がりを抑える効果が得られる。あるいは、基板材料が、隣接スポットとのクロストークを低減できるような遮光や光反射の効果がある材料であるかによらず、ウェルの側壁部、あるいは側壁部の上部などのウェルの側壁部の一部分に、一例として金属膜などの遮光や光反射の効果のある光学機能膜をもちいた構成を用いることによっても、隣接スポットとのクロストークを低減する効果が得られる。
<実施例3のまとめ>
以上のように、複製DNAを固定化する実効的な表面積を増すために作製した表面積増加構造として、ラフネス加工を施した構成或いは多孔材料を用いた構成を用いた場合について、これらと光学機能膜や光学機能を有するウェルの側壁を組み合わせて活用したケースにおいて、スポット以外の部分でうまく散乱光を抑えてクロストークを低減することにより、S/B比を向上できることが明らかになった。
以上のように、複製DNAを固定化する実効的な表面積を増すために作製した表面積増加構造として、ラフネス加工を施した構成或いは多孔材料を用いた構成を用いた場合について、これらと光学機能膜や光学機能を有するウェルの側壁を組み合わせて活用したケースにおいて、スポット以外の部分でうまく散乱光を抑えてクロストークを低減することにより、S/B比を向上できることが明らかになった。
実施例2に示したウェル内部を横方向に拡大して表面積を拡大する方法は、横方向にスペースを占有してしまうため、今後高集積化を進める上では制約となるが、実施例3に述べたスポットの部分にラフネス構造を用いる方法、スポットに多孔構造を用いる方法では、光学機能膜により隣接した複製DNAクラスター同士のクロストークを防止すれば、高集積化を進める上では有利である。
(5)実施例4
実施例4においては、上述の実施例1乃至3による核酸分析用スポットアレイ基板を組み込むことができるフローセルを用いた分析の例について説明する。
実施例4においては、上述の実施例1乃至3による核酸分析用スポットアレイ基板を組み込むことができるフローセルを用いた分析の例について説明する。
<核酸解析装置の構成例>
図5は、実施例1乃至3による核酸分析用スポットアレイ基板を用いることができる核酸解析装置500の構成例を示す概略図である。フローセルとしては、比較のため、スポットが平面状でありスポット以外の領域が非特異吸着防止膜により被覆されたスポットアレイ基板(4.2μmピッチ、スポット径φ1μm)を組み込んだフローセル501、スポットが平面状でありスポット以外の領域が非特異吸着防止膜により被覆されたスポットアレイ基板(1.2μmピッチ、スポット径φ0.8μm)を組み込んだフローセル502、及びスポットの部分がラフネス構造でありスポット以外の平坦部を被覆している非特異吸着防止膜の下層に光吸収膜を追設したスポットアレイ基板(1.2μmピッチ、スポット径φ0.8μm)を組み込んだフローセル503の3種を準備して、比較評価を行った。
図5は、実施例1乃至3による核酸分析用スポットアレイ基板を用いることができる核酸解析装置500の構成例を示す概略図である。フローセルとしては、比較のため、スポットが平面状でありスポット以外の領域が非特異吸着防止膜により被覆されたスポットアレイ基板(4.2μmピッチ、スポット径φ1μm)を組み込んだフローセル501、スポットが平面状でありスポット以外の領域が非特異吸着防止膜により被覆されたスポットアレイ基板(1.2μmピッチ、スポット径φ0.8μm)を組み込んだフローセル502、及びスポットの部分がラフネス構造でありスポット以外の平坦部を被覆している非特異吸着防止膜の下層に光吸収膜を追設したスポットアレイ基板(1.2μmピッチ、スポット径φ0.8μm)を組み込んだフローセル503の3種を準備して、比較評価を行った。
フローセル501乃至503の溶液導入口を通して導入された溶液は、上記の各々のスポットアレイ基板を組み込んだフローセルの内部を流れ、溶液排出口から廃液入れ518に排出される。3種類のフローセルのうち、最初に、フローセル501を用いて評価を行った。分析対象となる少なくともその一部に未知の配列を有するテンプレートDNAをアミノ基修飾表面上にオリゴDNAで表面修飾したアレイスポット上に固定化し、その後、スポット上で複製し、このテンプレートDNAの複製(複製DNAクラスター)を蛍光計測により解析し、塩基配列を解読した。
フローセル501は、温調機能504により温度制御が可能となっている。また、いくつかの反応試薬を供給する反応試薬ユニット505が、試薬内で反応が進行しない温度に保たれて設置されており、配管チューブによりフローセル501に結合されている。本実施例では、この反応試薬ユニット505より、5種類の試薬506、508~511を供給することができるように構成される。試薬506は、分析対象となる少なくともその一部に未知の配列を有するテンプレートDNAを、アレイスポット上のオリゴDNA(既知配列)と相補な配列に結合したもの(相補配列付きテンプレートDNA)を含む試薬である。また、試薬508は、dATP、dGTP、dCTP、dTTP、及び酵素を含む、アレイスポット上で複製するための試薬である。試薬509は、dATP-蛍光色素1、dGTP-蛍光色素2、dCTP-蛍光色素3、dTTP-蛍光色素4、伸長反応酵素を含む試薬である。試薬510は、上記4種のdNTPと蛍光色素との結合を切断する色素結合切断試薬である。試薬511は、フローセル内の液の入れ替え、及び洗浄に用いるための電解質水溶液である。また、別途、イソプロピルアルコール512、及び試薬511と同等品である電解質水溶液513を用意した。これらの溶液はピペットによりフローセルに注入される。イソプロピルアルコール512はフローセル内の溶液置換に用いるためのもので、エチルアルコールなど別のアルコールでもよい。
フローセル501の上方には、試薬509に含まれる各種蛍光色素を励起するための励起光を発生する光源514、蛍光色素からの蛍光を計測するための光学系515、光検出器516が設置されている。不透明な基板であっても上方から励起光の照射や蛍光検出が可能であり、また、透明な基板であれば基板の下方からでも励起及び検出は可能であるので、本実施例では光学系や検出器の上下の配置は特に限定しない。温調、光励起、蛍光観察さえできれば、光学系はフローセルの上下どちらに配置しても構わない。また、光検出器516によって受光された蛍光信号は電気信号に変換されて解析装置517に転送される。解析装置517は、転送された信号から塩基の識別や断片データのつなぎ合わせ等の解析を行い、核酸の塩基配列を解読する。
試薬509に含まれる蛍光色素1~4に用いることができるものとしては、Alexa488,Cy3,Cy5,Cy5.5,Alexa555,Alexa647,Alexa680,dR6G,dR110,dTAMRA,dROXなど、様々な蛍光色素が市販されており、波長が一部重なることがないように適切なものを選択して使用することができるのは周知である。また、これら色素の選択に従って、蛍光色素を効率よく励起するための光源514の波長として、少なくとも1種類以上の適切な波長を選択できることも周知である。
<分析手順>
(i)本実施例では、まず、ピペットを用いた手作業により、フローセル501の導入口より、イソプロピルアルコール512を注入して、気泡が無いことを確認したのち、ピペットを用いた手作業により、電解質水溶液513に置換した。アルコール512から電解質水溶液513に置換する作業は、もちろん、電解質水溶液511を用いて、自動送液によって実施することも可能であり、また、場合によっては、フローセルメーカー側で、アルコールから電解質溶液に置換する方法等を用いて、予め液を充填してユーザーに供給することも可能である。いずれにせよ、次に、電解質水溶液513で満たされ気泡が除去された状態でフローセル501を核酸解析装置にセッティングした。以上により、DNAシーケンサにフローセルをセットし、前準備が完了した。
(i)本実施例では、まず、ピペットを用いた手作業により、フローセル501の導入口より、イソプロピルアルコール512を注入して、気泡が無いことを確認したのち、ピペットを用いた手作業により、電解質水溶液513に置換した。アルコール512から電解質水溶液513に置換する作業は、もちろん、電解質水溶液511を用いて、自動送液によって実施することも可能であり、また、場合によっては、フローセルメーカー側で、アルコールから電解質溶液に置換する方法等を用いて、予め液を充填してユーザーに供給することも可能である。いずれにせよ、次に、電解質水溶液513で満たされ気泡が除去された状態でフローセル501を核酸解析装置にセッティングした。以上により、DNAシーケンサにフローセルをセットし、前準備が完了した。
(ii)次に、相補配列付きテンプレートDNA507を含む試薬506を送液ユニットによりフローセル501に自動注入し、その状態で一旦送液を停止して、最適な温度に設定して10分間放置し、ハイブリさせ、オリゴDNA修飾スポットアレイ上に固定化させた。基板上のスポット以外の平坦部を非特異吸着防止材料で被覆しているため、相補配列付きテンプレートDNA507がスポットアレイ以外に吸着した様子はみられず、非特異吸着は問題にならなかった。その後、適切な温度に設定して、アレイスポット上で複製するための試薬508をフローセルに供給し、その状態で一旦送液を停止して、最適な温度に設定して伸長反応と引き剥がし(デネイチャー)を繰り返し、テンプレートDNAをアレイスポット上で複製した。フローセル501に組み込まれている基板上には、オリゴDNA修飾したスポットアレイが配置されているが、このうち、確率論で定まるある割合のスポット上に相補配列付きテンプレートDNA507の複製DNAクラスターを形成することができた。全スポットに対し複製DNAクラスターが形成できる割合は、試薬506中のテンプレートDNAの濃度により異なる。その後、適切な温度に設定して、試薬509をフローセルに供給して酵素による伸長反応を起こさせた。このとき、試薬中のdNTPは蛍光色素により終端されているので、テンプレートDNAの1つ目の塩基種に対する伸長反応が起こった後、一旦、反応は止まる。その後、光源514により、励起光を照射し、このとき発せられた蛍光を、光学系515、光検出器516により計測した。
(iii)3種のフローセルのうち、フローセル502を用いて評価を行った。フローセル501がピッチを4.2μmとしていたのに対し、フローセル502はピッチを1.2μmまで縮小したスポットアレイ基板を組み込んだものである。蛍光計測の手順は、フローセル501において実施した手順と全く同様である。
(iv)最後に、フローセル503を用いて評価を行った。フローセル503はピッチを1.2μmまで縮小したものであり、かつ、スポットの表面にラフネス構造を採用しスポット以外の平坦部を被覆する非特異吸着防止膜の下層に光吸収膜を追設したスポットアレイ基板を組み込んだものである。蛍光計測の手順は、フローセル501において実施した手順と全く同様である。
<測定結果>
図6は、核酸解析装置500によって各フローセルを用いて測定を行った結果を示す図である。
図6は、核酸解析装置500によって各フローセルを用いて測定を行った結果を示す図である。
(i)図6Aは、フローセル501に組み込まれている基板(4.2μmピッチ、スポット径φ1μm)上のアレイスポットにおいて、伸長反応を起こさせた後に、光源514で励起することにより発せられた蛍光の観察結果の一例を示している。準備した3種のフローセルのうち、フローセル501は、4.2μmピッチであり、ピッチ間隔は大きめのものであるため、図6Aに示すように、蛍光像の外輪郭は隣接スポットの蛍光像の外輪郭とは重ならずに、隣と分離された像を取得することができた。
(ii)図6Bは、フローセル502に組み込まれている基板(1.2μmピッチ、スポット径φ0.8μm)上のアレイスポットにおいて、伸長反応を起こさせた後に、光源514で励起することにより発せられた蛍光の観察結果の一例を示している。フローセル502は、1.2μmピッチであり、ピッチ間隔が縮小されているため、図6Bに示すように、蛍光像の外輪郭は隣接スポットの蛍光像の外輪郭と重なり、この状況では隣接スポットからの蛍光が混入して背景信号Bを増加させている。
(iii)図6Cは、フローセル503に組み込まれている基板(1.2μmピッチ、スポット径φ0.8μm、スポットの部分がラフネス構造+スポット以外の平坦部を被覆している非特異吸着防止膜の下層に光吸収膜を追設)上のアレイスポットにおいて、伸長反応を起こさせた後に、光源514で励起することにより発せられた蛍光の観察結果の一例を示している。フローセル503は、1.2μmまでピッチ間隔が縮小されているが、図6(c)に示すように、蛍光像の強度Sが向上しただけでなく、蛍光像の外輪郭が隣接スポットの蛍光像の外輪郭と重ならなくなり、背景信号Bを低減できることが明らかになった。
<実施例4のまとめ:解析精度などについて>
ここまでの結果では、蛍光スポットの強度の向上と拡がりの抑制について、蛍光像を示すことによって本開示の効果を説明してきた。この蛍光スポットの強度の向上と拡がりの抑制は、当然、塩基配列の解析精度にも影響を及ぼす。
ここまでの結果では、蛍光スポットの強度の向上と拡がりの抑制について、蛍光像を示すことによって本開示の効果を説明してきた。この蛍光スポットの強度の向上と拡がりの抑制は、当然、塩基配列の解析精度にも影響を及ぼす。
そこで、塩基配列についても解析結果を比較するために、一回目の蛍光を計測した後、4種のdNTPと蛍光色素との結合を切断する色素結合切断試薬を含む試薬510により適切な温度で色素を切断し、切断された色素を含むフローセル内の液体を、一旦、試薬511の電解質溶液にて洗い流した。そして、その後、再び試薬509を自動注入して、同様に、2つ目以降の塩基による蛍光の計測ならびに解析を繰り返した。このような手順で塩基配列の解析も行い、フローセルによる違いを評価した。その結果、隣接した複製DNAクラスターからの背景光が混入しているケースでは、当然のことながら、得られた蛍光の波長と強度を解析しても、エラーの発生が多かった。
一方、蛍光強度を向上し、隣接した複製DNAクラスターからの背景光を防止しているケースでは、高集積化スポットアレイを用いて同時並列にデータを取得し、高いスループットで計測を行う場合においても、背景信号Bの混入の影響が少ないため、蛍光の波長と強度の解析により、正しい塩基配列情報が得られた。
また、本実施例では、オリゴDNAで修飾した1つのアレイスポット上に固定化したテンプレートDNAの複製は、一種類のテンプレートDNAの複製である必要がある。オリゴDNAで修飾したアレイスポット上での複製においては、1つのスポット上で複製したテンプレートDNAが一種類であるもの以外に、確率論的に、不良スポットとして、テンプレートDNAが固定化できなかったスポットや、異なる2種類のテンプレートDNAが一つのスポット上で複製されてしまったものが存在する。これらにおいては、塩基の信号が得られない、又は、2種類の信号が同時に得られてしまうことになり、データとして使えない。2種類のテンプレートDNAが複製された不良スポットを低減する水溶液の濃度の調整や、テンプレートDNAが固定化されなかったスポットに、改めてテンプレートDNAを固定化する方法などに関しては別の方法が考案されており、アレイスポットから得られるデータの有効率を向上することもできる。例えば、テンプレートDNAの基板上での複製のプロトコールとして、US 2012/0156728 A1などに記載されている方法を用いることができる。本実施例においては、特に、それらの基板上複製技術の詳細を限定するものではなく、そのプロトコールの詳細は特に示さない。
なお、実施例4では、本開示によるスポットアレイ基板を組み込んだフローセルを用いて、基板のアレイスポット上でのDNA複製を行い、分析対象となる一部に未知の配列を含むDNAを解読したが、本開示のスポットアレイ基板を組み込んだフローセルは、DNAだけでなく、RNAなど他の核酸の解読にも応用できることは言うまでもない。
また、本開示の説明に当たり、図面では温調機能や光学系などに、シンボリックにヒータフィラメントのマークや凸レンズのマークを用いているが、温調機能には、空冷、水冷、冷却素子など、冷やす機能も含まれている上、PID制御などの一般的な温調制御方法で一定温度に制御できることや、光学系が凸レンズ以外に分光器やカラーフィルタなどの分光機能を有しており蛍光の色が判別できることなどは一般的なことであり言うまでもない。
(6)まとめ
(i)上述の実施例において、スポットのピッチが20μm、スポットサイズがφ7μmであれば、スポットは十分に大きいためスポットからの蛍光信号は強く、ピッチが十分に広いため隣接するスポットからの信号と干渉することもない。スポットのピッチを、4.2μmまで(実施例内では最小1.2μmまで)縮小した場合には、スポットが小さくなるために蛍光信号の強度は弱くなり、また、ピッチが縮まるために隣接するスポットからの信号との干渉(クロストーク)が問題になる。本発明は、このような寸法レンジ以下まで微細化して高集積化を図ることを目的に、蛍光信号の強度と隣接スポットとの分離性を向上するためのスポットアレイ基板に関するものである。
(i)上述の実施例において、スポットのピッチが20μm、スポットサイズがφ7μmであれば、スポットは十分に大きいためスポットからの蛍光信号は強く、ピッチが十分に広いため隣接するスポットからの信号と干渉することもない。スポットのピッチを、4.2μmまで(実施例内では最小1.2μmまで)縮小した場合には、スポットが小さくなるために蛍光信号の強度は弱くなり、また、ピッチが縮まるために隣接するスポットからの信号との干渉(クロストーク)が問題になる。本発明は、このような寸法レンジ以下まで微細化して高集積化を図ることを目的に、蛍光信号の強度と隣接スポットとの分離性を向上するためのスポットアレイ基板に関するものである。
(ii)各実施例によるスポットアレイ基板は、蛍光を用いて塩基配列を解析、識別するために用いられる核酸分析用スポットアレイ基板である。当該核酸分析用スポットアレイ基板は、プラスティック、ガラス、シリコン、石英、サファイア、アモルファスカーボン等(第1の材料)で形成され、その表面には、複数のスポットがアレイ配置されている。また、基板において、複数のスポットが配置されている領域以外の領域には、非特異吸着防止膜(第2の材料で構成される被覆層)を設けることができる。また、各スポットは、基板の垂直方向に対して高低差のある表面積増加構造(凹型の窪み構造、ラフネス構造、多孔材料を用いて構成された表面構造)を備えている。これによって、各スポットのそれぞれの実際の表面積が、当該スポットを基板の上方から見込んだときのスポットの外輪郭が規定する面積よりも大きくなっている。このようにすることにより、各スポットに固化されるDNA複製数を増加させることができ、蛍光信号の強度を向上させることができるようになる。
また、基板と非特異吸着防止膜との間には、光学機能膜(遮光性の膜、光吸収性の膜、又は光干渉による反射防止機能を有する膜:第3の材料)を設けることができる。このようにすることにより、各スポットからの蛍光信号のクロストークの発生を防止することができるようになる。なお、光学機能膜は、非特異吸着防止膜が設けられている領域の下層全体に亘って設ける必要はなく、少なくとも各スポットの周辺部分に設ければよい。
さらに、本開示は、核酸分析用フローセルを提供する。当該核酸分析用フローセルは、上記構成を備える核酸分析用スポットアレイ基板を組み込んだものであり、少なくとも1箇所以上の液体注入口と少なくとも1箇所以上の液体排出口を含んだ形態である。
(iii)本開示によれば、複製DNAクラスターからの蛍光を計測するためのスポットをアレイ状にパターニングした基板において、高集積化に伴いピッチが縮小され、スポットの占有スペース(スポットの外輪郭サイズ)が縮小されても、複製DNAクラスターを固定化するための実効表面積を稼いで信号Sの強度の低下を防ぐことができ、また、隣接スポット間のクロストーク(背景信号B)を低減することで、蛍光観察におけるS/B比を高く保つことができる。また、このように集積度を増したのにもかかわらずS/B比を高く保てる基板を用いることにより、精度の高いデータを得ることで、解析に用いることのできる有効クラスターを増加させることができ、スループットの高い核酸解析を実現できる。
(iv)なお、本開示は上記した実施例に限定されるものではなく、様々な変形例が含まれる。例えば、上記した実施例は本開示を分かりやすく説明するために詳細に説明したものであり、必ずしも説明した全ての構成を備えるものに限定されるものではない。また、ある実施例の構成の一部を他の実施例の構成に置き換えることが可能であり、また、ある実施例の構成に他の実施例の構成を加えることも可能である。また、各実施例の構成の一部について、他の構成の追加・削除・置換をすることが可能である。
なお、今後、光学系側が進歩すれば、光学系側の改良で蛍光像の拡がりはさらにもう少し改善できるかもしれないが、基板上のスポットでの光散乱は基板への工夫で対策するべきであると考えられる。さらに光学系が改善され、さらなる高集積化が可能になった段階においてでも、基板側への工夫による本開示の方法はさらに高集積化を進めるために役に立つ。
101 フラット基板
102 官能基+オリゴDNAでの表面修飾
103 スポットアレイ基板
104 非特異吸着防止膜
105 複製DNAクラスター
106 複製DNAクラスターが偶然存在しない領域
107 解析不能領域
201 基板
202 表面修飾した平面型スポット
203 非特異吸着防止膜
204 隣接スポットと重ならない蛍光像
205 ウェルを掘り込んだ構造
206 ラフネスを形成した構造
207 多孔材料
208 蛍光像の外輪郭(ウェルを掘り込んだ場合)
209 蛍光像の外輪郭(ラフネスを形成した場合)
210 蛍光像の外輪郭(多孔材料を用いた場合)
301 遮光膜
302 蛍光像の外輪郭(ウェル+遮光膜の場合)
303 蛍光像の外輪郭(ウェル内径を2μmに拡大した場合)
304 蛍光像の外輪郭(ウェル内径が1μmの場合)
401 光吸収膜
402 光干渉による反射防止機能を有する膜
403 蛍光像の外輪郭(ラフネス+光吸収膜の場合)
404 蛍光像の外輪郭(多孔材料+光反射防止膜の場合)
501 フローセル(スポット:平面、4.2μmピッチ)
502 フローセル(スポット:平面、1.2μmピッチ)
503 フローセル(スポット:ラフネス形成、1.2μmピッチ)
504 温調機能
505 反応試薬ユニット
506 試薬(相補配列付きテンプレートDNAを含む)
507 相補配列付きテンプレートDNA
508 試薬(複製DNA形成試薬を含む)
509 試薬(蛍光色素、伸長反応酵素を含む)
510 試薬(色素結合切断試薬を含む)
511 試薬(電解質水溶液)
512 試薬(イソプロピルアルコール)
513 試薬(電解質水溶液)
514 光源
515 光学系
516 光検出器
517 解析装置
518 廃液入れ
Claims (15)
- 塩基配列を識別するDNAシーケンサで用いられる核酸分析用スポットアレイ基板であって、
第1の材料上に複数のスポットがアレイ配置され、
前記複数のスポットのそれぞれは、前記第1の材料の垂直方向に対して高低差のある表面積増加構造を備え、
前記複数のスポットのそれぞれの実際の表面積は、当該スポットを上方から見込んだときの前記スポットの外輪郭が規定する面積よりも大きい、核酸分析用スポットアレイ基板。 - 請求項1において、
さらに、前記複数のスポット以外の領域が、前記第1の材料とは異なる第2の材料で被覆された、核酸分析用スポットアレイ基板。 - 請求項2において、
さらに、前記第1の材料、及び前記第2の材料とは異なる第3の材料によって構成される光学機能膜を備える、核酸分析用スポットアレイ基板。 - 請求項1において、
前記表面積増加構造は、前記スポットに形成された、凹型の窪み構造、ラフネス構造、或いは、多孔構造を用いて構成された表面構造である、核酸分析用スポットアレイ基板。 - 請求項2において、
前記第2の材料による被覆膜が、非特異吸着防止機能を有する膜である、核酸分析用スポットアレイ基板。 - 請求項3において、
前記光学機能膜は、遮光性の膜、光反射性の膜、光吸収性の膜、或いは光干渉による反射防止機能を有する膜である、核酸分析用スポットアレイ基板。 - 請求項3において、
前記光学機能膜は、前記スポット以外の領域において、前記スポットの少なくとも周辺部分に設けられている、或いは、前記スポットに形成された表面積増加構造の表面の少なくとも一部分に設けられている、核酸分析用スポットアレイ基板。 - 請求項7において、
前記スポットに形成された表面積増加構造は、凹型の窪み構造を用いて構成された表面構造であり、前記光学機能膜は、凹型の窪み構造の内部の側面の一部分に設けられている、核酸分析用スポットアレイ基板。 - 請求項1において、
前記表面積増加構造の高低差が2μm以下である核酸分析用スポットアレイ基板。 - 請求項4において、
前記凹型の窪み構造の深さが直径の半分以下である核酸分析用スポットアレイ基板。 - 請求項1において、
前記複数のスポットのアレイ配列における最近接スポットとのピッチが、4.2μm以下である核酸分析用スポットアレイ基板。 - 請求項1に記載の核酸分析用スポットアレイ基板が組み込まれたフローセルと、
前記フローセルに、DNA分子の塩基を識別できる蛍光色素を含む反応試薬、dNTPと色素を切断できる反応試薬、及び前記フローセル内を洗浄するための洗浄試薬を含む複数の試薬を選択的に供給するための試薬供給ユニットと、
前記フローセルの温度を制御する温調部と、
前記スポットアレイ基板に励起光を照射するための光源と、
前記スポットアレイ基板のスポット位置から発生する蛍光を計測する光検出器と、
前記光検出器による検出信号を解析するための解析装置と、
を備える、核酸解析装置。 - 分析対象サンプル由来のDNAを、フローセルに組み込まれた請求項1に記載の核酸分析用スポットアレイ基板のスポット上に固定化する第1の工程と、
前記DNAの1塩基分の伸長反応を、蛍光色素を含む試薬により行わせる第2の工程と、
前記伸長反応の後に励起光を照射することにより前記スポットアレイ基板のスポット位置から発生する蛍光信号を計測する第3の工程と、
蛍光信号を計測した塩基から蛍光色素を切り離す第4の工程と、
切り離した蛍光色素を含む溶液を洗い流す第5の工程と、
前記第3の工程で得られた蛍光信号を解析して前記DNAの塩基配列を決定する第6の工程と、
を含む、核酸の解析方法。 - 請求項2に記載の核酸分析用スポットアレイ基板が組み込まれたフローセルと、
前記フローセルに、DNA分子の塩基を識別できる蛍光色素を含む反応試薬、dNTPと色素を切断できる反応試薬、及び前記フローセル内を洗浄するための洗浄試薬を含む複数の試薬を選択的に供給するための試薬供給ユニットと、
前記フローセルの温度を制御する温調部と、
前記スポットアレイ基板に励起光を照射するための光源と、
前記スポットアレイ基板のスポット位置から発生する蛍光を計測する光検出器と、
前記光検出器による検出信号を解析するための解析装置と、
を備える、核酸解析装置。 - 分析対象サンプル由来のDNAを、フローセルに組み込まれた請求項2に記載の核酸分析用スポットアレイ基板のスポット上に固定化する第1の工程と、
前記DNAの1塩基分の伸長反応を、蛍光色素を含む試薬により行わせる第2の工程と、
前記伸長反応の後に励起光を照射することにより前記スポットアレイ基板のスポット位置から発生する蛍光信号を計測する第3の工程と、
蛍光信号を計測した塩基から蛍光色素を切り離す第4の工程と、
切り離した蛍光色素を含む溶液を洗い流す第5の工程と、
前記第3の工程で得られた蛍光信号を解析して前記DNAの塩基配列を決定する第6の工程と、
を含む、核酸の解析方法。
Priority Applications (1)
| Application Number | Priority Date | Filing Date | Title |
|---|---|---|---|
| PCT/JP2016/085823 WO2018100724A1 (ja) | 2016-12-01 | 2016-12-01 | スポットアレイ基板、核酸解析方法、及び核酸解析装置 |
Applications Claiming Priority (1)
| Application Number | Priority Date | Filing Date | Title |
|---|---|---|---|
| PCT/JP2016/085823 WO2018100724A1 (ja) | 2016-12-01 | 2016-12-01 | スポットアレイ基板、核酸解析方法、及び核酸解析装置 |
Publications (1)
| Publication Number | Publication Date |
|---|---|
| WO2018100724A1 true WO2018100724A1 (ja) | 2018-06-07 |
Family
ID=62241277
Family Applications (1)
| Application Number | Title | Priority Date | Filing Date |
|---|---|---|---|
| PCT/JP2016/085823 WO2018100724A1 (ja) | 2016-12-01 | 2016-12-01 | スポットアレイ基板、核酸解析方法、及び核酸解析装置 |
Country Status (1)
| Country | Link |
|---|---|
| WO (1) | WO2018100724A1 (ja) |
Cited By (1)
| Publication number | Priority date | Publication date | Assignee | Title |
|---|---|---|---|---|
| CN113227342A (zh) * | 2019-01-09 | 2021-08-06 | 株式会社日立高新技术 | 核酸分析用基板、核酸分析用流动池以及图像分析方法 |
Citations (8)
| Publication number | Priority date | Publication date | Assignee | Title |
|---|---|---|---|---|
| JP2002511586A (ja) * | 1998-04-13 | 2002-04-16 | スリーエム イノベイティブ プロパティズ カンパニー | 高密度小型化アレイおよびその製造方法 |
| JP2002267667A (ja) * | 2001-03-08 | 2002-09-18 | Hitachi Software Eng Co Ltd | マイクロアレイ及びマイクロアレイ用基板 |
| JP2003107086A (ja) * | 2001-09-28 | 2003-04-09 | Olympus Optical Co Ltd | フロスト面を有する基板を用いた核酸プローブアレイ |
| JP2004097200A (ja) * | 2001-12-28 | 2004-04-02 | Enplas Corp | プラスチックプレート及びプラスチックプレート組立体 |
| JP2005308407A (ja) * | 2004-04-16 | 2005-11-04 | Olympus Corp | マイクロアレイ用チップと、その製造方法及びその検出方法 |
| JP2007500122A (ja) * | 2003-07-29 | 2007-01-11 | コーニング インコーポレイテッド | 自己蛍光を低減させた多孔性ガラス基板 |
| JP2008513782A (ja) * | 2004-09-17 | 2008-05-01 | パシフィック バイオサイエンシーズ オブ カリフォルニア, インコーポレイテッド | 分子解析のための装置及び方法 |
| WO2016084489A1 (ja) * | 2014-11-27 | 2016-06-02 | 株式会社日立ハイテクノロジーズ | スポットアレイ基板、その製造方法、核酸ポリマー解析方法及び装置 |
-
2016
- 2016-12-01 WO PCT/JP2016/085823 patent/WO2018100724A1/ja active Application Filing
Patent Citations (8)
| Publication number | Priority date | Publication date | Assignee | Title |
|---|---|---|---|---|
| JP2002511586A (ja) * | 1998-04-13 | 2002-04-16 | スリーエム イノベイティブ プロパティズ カンパニー | 高密度小型化アレイおよびその製造方法 |
| JP2002267667A (ja) * | 2001-03-08 | 2002-09-18 | Hitachi Software Eng Co Ltd | マイクロアレイ及びマイクロアレイ用基板 |
| JP2003107086A (ja) * | 2001-09-28 | 2003-04-09 | Olympus Optical Co Ltd | フロスト面を有する基板を用いた核酸プローブアレイ |
| JP2004097200A (ja) * | 2001-12-28 | 2004-04-02 | Enplas Corp | プラスチックプレート及びプラスチックプレート組立体 |
| JP2007500122A (ja) * | 2003-07-29 | 2007-01-11 | コーニング インコーポレイテッド | 自己蛍光を低減させた多孔性ガラス基板 |
| JP2005308407A (ja) * | 2004-04-16 | 2005-11-04 | Olympus Corp | マイクロアレイ用チップと、その製造方法及びその検出方法 |
| JP2008513782A (ja) * | 2004-09-17 | 2008-05-01 | パシフィック バイオサイエンシーズ オブ カリフォルニア, インコーポレイテッド | 分子解析のための装置及び方法 |
| WO2016084489A1 (ja) * | 2014-11-27 | 2016-06-02 | 株式会社日立ハイテクノロジーズ | スポットアレイ基板、その製造方法、核酸ポリマー解析方法及び装置 |
Cited By (1)
| Publication number | Priority date | Publication date | Assignee | Title |
|---|---|---|---|---|
| CN113227342A (zh) * | 2019-01-09 | 2021-08-06 | 株式会社日立高新技术 | 核酸分析用基板、核酸分析用流动池以及图像分析方法 |
Similar Documents
| Publication | Publication Date | Title |
|---|---|---|
| US7170050B2 (en) | Apparatus and methods for optical analysis of molecules | |
| US20210325306A1 (en) | Arrays of integrated analytical devices | |
| CN102227659B (zh) | 超高多路分析系统和方法 | |
| JP5222599B2 (ja) | 核酸分析デバイス及びそれを用いた核酸分析装置 | |
| RU2740733C1 (ru) | Устройства детектирования света с защитной облицовкой и относящиеся к ним способы | |
| JP6710259B2 (ja) | スポットアレイ基板、その製造方法、核酸ポリマー解析方法及び装置 | |
| JP2020534673A (ja) | ウエハレベルのシーケンスフローセルの製造 | |
| RU2737847C1 (ru) | Устройства детектирования света с двойной фильтрацией и относящиеся к ним способы | |
| US8865403B2 (en) | Nucleic acid analyzing device and nucleic acid analyzer | |
| JP3908135B2 (ja) | 生化学的検査用画像処理方法 | |
| WO2018100724A1 (ja) | スポットアレイ基板、核酸解析方法、及び核酸解析装置 | |
| US20050282204A1 (en) | Microarray substrate having patterned thin layer and microarray comprising the same, and methods of producing the microarray substrate and the microarray | |
| JPWO2010137543A1 (ja) | 核酸分析用デバイス、核酸分析装置、及び核酸分析方法 | |
| CN110218628B (zh) | 一种数字pcr芯片及其制备方法 | |
| JP2007101308A (ja) | 標的物質検出素子、標的物質検出装置及び標的物質検出方法 | |
| TWI525353B (zh) | 超高多工分析系統及方法 | |
| JP4296479B2 (ja) | ポリヌクレオチドを固定化するための基体の製造方法 | |
| JP2010014648A (ja) | プローブアレイおよびその製造方法 | |
| WO2023011439A1 (en) | Sequencing systems and methods utilizing three-dimensional substrates | |
| TW202244488A (zh) | 具有縮尺單位單元之整合式分析裝置之陣列 | |
| KR101890477B1 (ko) | 나노구조물이 형성된 형광 기판의 제조방법 및 이에 의해 제작된 형광 기판 | |
| GB2622991A (en) | Detection chip and preparation method therefor, and detection method | |
| JP2009174954A (ja) | コード化粒子 | |
| Visalli et al. | Microarrays as a Tool for Gene Expression Profiling: Application in Ocular and kk |
Legal Events
| Date | Code | Title | Description |
|---|---|---|---|
| 121 | Ep: the epo has been informed by wipo that ep was designated in this application |
Ref document number: 16923086 Country of ref document: EP Kind code of ref document: A1 |
|
| NENP | Non-entry into the national phase |
Ref country code: DE |
|
| 122 | Ep: pct application non-entry in european phase |
Ref document number: 16923086 Country of ref document: EP Kind code of ref document: A1 |
|
| NENP | Non-entry into the national phase |
Ref country code: JP |