WO2018100724A1 - Substrat de réseau de taches, procédé d'analyse d'acide nucléique, et dispositif d'analyse d'acide nucléique - Google Patents
Substrat de réseau de taches, procédé d'analyse d'acide nucléique, et dispositif d'analyse d'acide nucléique Download PDFInfo
- Publication number
- WO2018100724A1 WO2018100724A1 PCT/JP2016/085823 JP2016085823W WO2018100724A1 WO 2018100724 A1 WO2018100724 A1 WO 2018100724A1 JP 2016085823 W JP2016085823 W JP 2016085823W WO 2018100724 A1 WO2018100724 A1 WO 2018100724A1
- Authority
- WO
- WIPO (PCT)
- Prior art keywords
- spot
- array substrate
- nucleic acid
- substrate
- acid analysis
- Prior art date
Links
Images


Classifications
-
- C—CHEMISTRY; METALLURGY
- C12—BIOCHEMISTRY; BEER; SPIRITS; WINE; VINEGAR; MICROBIOLOGY; ENZYMOLOGY; MUTATION OR GENETIC ENGINEERING
- C12M—APPARATUS FOR ENZYMOLOGY OR MICROBIOLOGY; APPARATUS FOR CULTURING MICROORGANISMS FOR PRODUCING BIOMASS, FOR GROWING CELLS OR FOR OBTAINING FERMENTATION OR METABOLIC PRODUCTS, i.e. BIOREACTORS OR FERMENTERS
- C12M1/00—Apparatus for enzymology or microbiology
-
- C—CHEMISTRY; METALLURGY
- C12—BIOCHEMISTRY; BEER; SPIRITS; WINE; VINEGAR; MICROBIOLOGY; ENZYMOLOGY; MUTATION OR GENETIC ENGINEERING
- C12N—MICROORGANISMS OR ENZYMES; COMPOSITIONS THEREOF; PROPAGATING, PRESERVING, OR MAINTAINING MICROORGANISMS; MUTATION OR GENETIC ENGINEERING; CULTURE MEDIA
- C12N15/00—Mutation or genetic engineering; DNA or RNA concerning genetic engineering, vectors, e.g. plasmids, or their isolation, preparation or purification; Use of hosts therefor
- C12N15/09—Recombinant DNA-technology
-
- C—CHEMISTRY; METALLURGY
- C12—BIOCHEMISTRY; BEER; SPIRITS; WINE; VINEGAR; MICROBIOLOGY; ENZYMOLOGY; MUTATION OR GENETIC ENGINEERING
- C12Q—MEASURING OR TESTING PROCESSES INVOLVING ENZYMES, NUCLEIC ACIDS OR MICROORGANISMS; COMPOSITIONS OR TEST PAPERS THEREFOR; PROCESSES OF PREPARING SUCH COMPOSITIONS; CONDITION-RESPONSIVE CONTROL IN MICROBIOLOGICAL OR ENZYMOLOGICAL PROCESSES
- C12Q1/00—Measuring or testing processes involving enzymes, nucleic acids or microorganisms; Compositions therefor; Processes of preparing such compositions
- C12Q1/68—Measuring or testing processes involving enzymes, nucleic acids or microorganisms; Compositions therefor; Processes of preparing such compositions involving nucleic acids
-
- G—PHYSICS
- G01—MEASURING; TESTING
- G01N—INVESTIGATING OR ANALYSING MATERIALS BY DETERMINING THEIR CHEMICAL OR PHYSICAL PROPERTIES
- G01N21/00—Investigating or analysing materials by the use of optical means, i.e. using sub-millimetre waves, infrared, visible or ultraviolet light
- G01N21/62—Systems in which the material investigated is excited whereby it emits light or causes a change in wavelength of the incident light
- G01N21/63—Systems in which the material investigated is excited whereby it emits light or causes a change in wavelength of the incident light optically excited
- G01N21/64—Fluorescence; Phosphorescence
-
- G—PHYSICS
- G01—MEASURING; TESTING
- G01N—INVESTIGATING OR ANALYSING MATERIALS BY DETERMINING THEIR CHEMICAL OR PHYSICAL PROPERTIES
- G01N33/00—Investigating or analysing materials by specific methods not covered by groups G01N1/00 - G01N31/00
- G01N33/48—Biological material, e.g. blood, urine; Haemocytometers
- G01N33/50—Chemical analysis of biological material, e.g. blood, urine; Testing involving biospecific ligand binding methods; Immunological testing
-
- G—PHYSICS
- G01—MEASURING; TESTING
- G01N—INVESTIGATING OR ANALYSING MATERIALS BY DETERMINING THEIR CHEMICAL OR PHYSICAL PROPERTIES
- G01N37/00—Details not covered by any other group of this subclass
Definitions
- the present disclosure relates to a spot array substrate, a nucleic acid analysis method, and a nucleic acid analysis apparatus.
- Patent Document 1 describes a method of analyzing a single molecule of nucleic acid such as DNA.
- An optical confinement array (array density> 40 k / mm) in which an optical waveguide (hole) having a specific size is formed in a metal film.
- a fluorescent signal can be detected with high sensitivity by confining the intended reaction product in the optical confinement structure using 2 ).
- a porous material can be used for the portion of the optical confinement element (the waveguide portion that propagates light).
- Patent Documents 2 to 4 describe a method for analyzing the base sequence of DNA by an electrical measurement method, and a field effect transistor having a floating gate for analyzing DNA by measuring a change in potential. There is a description that a substrate having an array of openings (well structure) that reaches the upper surface of the member having the floating gate potential and is arranged in an array with the members having the floating gate potential facing the upper surface can be used.
- Patent Document 5 describes a method for analyzing the base sequence of DNA. Using a substrate having the function of an optical filter, light in a certain wavelength band is transmitted, while desired light in a certain wavelength band is transmitted. There is a description that reaction errors can be reduced by reflecting (light in a wavelength band that contributes to the reaction) and irradiating light that induces the reaction also from the back side of the sample bead that is the measurement target.
- the fluorescence-type DNA sequencer decodes a base by analyzing fluorescence generated when a reagent containing a fluorescent dye or an enzyme is reacted with DNA. Research and elucidation of the causal relationship between base sequence information and pathology revealed by such nucleic acid analysis technology is expected to expand the application to medical diagnosis. However, at present, the rate of use for research purposes is still high, and there is room for improvement in analysis accuracy and throughput.
- a fluorescent DNA sequencer measures fluorescence emitted by a reaction in a state in which analysis objects are randomly distributed on a flat analysis chip, and bases the data on the analysis of the fluorescence bright spots at random positions. Practical use was started from the form to identify.
- a replication DNA cluster formed on a bead in advance by another apparatus such as an emulsion PCR apparatus can be dispersed on the substrate, or after the DNA fragments are dispersed on the substrate, Replicating DNA clusters can also be formed.
- Patent Document 5 in such a system in which the objects to be analyzed are randomly distributed, an optical functional film (optical filter) is provided on the substrate, and the reaction error is reduced by sufficiently performing a reaction for DNA analysis.
- An optical functional film optical filter
- a method for improving the analysis accuracy of DNA and increasing the read length is disclosed.
- the reaction error can be improved by the method described in Patent Document 5, but since the analysis target is randomly fixed on the flat substrate, the analysis target is a coincidence. There are areas that do not exist and areas where adjacent analysis objects are too close to each other and the fluorescence overlaps and cannot be analyzed, and the efficiency of use of the area on the substrate of the flow cell where reaction events occur is low. As a result, a useless sample to be analyzed that does not contribute to analysis (beads that are not effective because the fluorescence overlaps with each other or mixed DNA clusters that are not effective) is generated, and therefore, it is separated from events in adjacent regions. In order to obtain a sufficient amount of data, the area of the analytical flow cell has to be widened.
- An integrated array has been considered as one of the promising methods for solving this problem. It will be one of the general concepts for performing tasks with high efficiency in the smallest possible area.
- the unit substrate area is minimized while minimizing the interference with the fluorescent events of the adjacent spots.
- the data acquisition amount per hit can be increased.
- Patent Document 1 discloses a method of detecting a fluorescence signal with high sensitivity by light confinement using a structure in which a waveguide (hole) having a specific size is formed in a metal film. The fluorescence intensity emitted by a single molecule is improved by using the principle of improving the light intensity by a waveguide (hole) having a special dimension.
- the electric signal measured for base identification is the charge of ions, and in order to increase the signal intensity, the loss of ions due to ion recombination reaction in solution is minimized. Therefore, measures different from the fluorescence measurement method, such as shortening the distance between the analysis target and the floating gate for ion measurement, are required. Also, with regard to crosstalk, adjacent wells are electrically insulated (for example, deeply separated from wells) rather than preventing light mixed in from adjacent wells by means such as light shielding, light absorption, and light reflection prevention (optical function film).
- Patent Documents 2 to 4 disclose a form in which a well is formed, but the well carries a replica DNA cluster bead prepared by a user with another device such as emPCR (held in a physically fitted state). And the ions released during the reaction for analysis are confined so as not to diffuse into the solution.
- the improvement of the signal S from the minute spot and the reduction of the background signal B due to crosstalk etc. are performed simultaneously. It is desirable to clarify the configuration of the substrate that can be realized.
- the present disclosure has been made in view of such a situation, and provides a spot array substrate for nucleic acid analysis that can arrange analysis targets for analyzing a base sequence with a high degree of integration and can prevent deterioration in signal acquisition performance. It is to provide.
- the nucleic acid analysis spot array substrate is a nucleic acid analysis spot array substrate used in a DNA sequencer for identifying a base sequence, and is formed of a first material and a plurality of spots arranged in an array. Is provided.
- the substrate has a coating layer made of a second material different from the first material in a region other than a region where a plurality of spots are arranged.
- each of the plurality of spots has a surface area increasing structure having a height difference with respect to the vertical direction of the substrate, and the actual surface area of each of the plurality of spots is the spot when the spot is viewed from above the substrate. It is larger than the area defined by the outer contour.
- a spot array substrate for nucleic acid analysis that can arrange analysis targets for analyzing a base sequence with a high degree of integration and that can prevent a decrease in signal acquisition performance.
- FIG. 2A is a cross-sectional view and a fluorescent image of a spot array substrate as a comparative example in Example 1.
- 2B to 2D are diagrams showing a cross-sectional view of a prototype surface area increasing structure and corresponding fluorescent images.
- 6 is a diagram for explaining a configuration example of a spot array substrate for nucleic acid analysis according to Example 2.
- FIG. FIG. 1 is a cross-sectional view and a fluorescent image of a spot array substrate as a comparative example in Example 1.
- 2B to 2D are diagrams showing a cross-sectional view of a prototype surface area increasing structure and corresponding fluorescent images. 6 is a diagram for explaining a configuration example of a spot array substrate for nucleic acid analysis according to Example 2.
- FIG. 3A shows a cross-sectional structure of an array substrate of wells having an inner diameter of ⁇ 1 ⁇ m and a fluorescent image obtained using the substrate having the structure.
- FIG. 3B shows a cross-sectional structure of an array substrate of a well whose inner diameter is expanded to 2 ⁇ m in order to improve the fluorescence intensity, and a fluorescent image obtained using the substrate having the structure.
- FIG. 3C shows a cross-sectional structure of the array substrate additionally provided with the light shielding film 301 and a fluorescent image obtained therefrom.
- FIG. 10 is a diagram for explaining a configuration example of a spot array substrate according to a third embodiment.
- FIG. 10 is a diagram for explaining a configuration example of a spot array substrate according to a third embodiment.
- FIG. 4A shows a cross-sectional structure of a substrate in which a light-absorbing film 401 is additionally provided in a lower layer of a non-specific adsorption preventing film covering a flat portion other than a spot in a substrate having roughness on the surface of the spot, and the structure The fluorescence image obtained using the board
- FIG. 4B shows a substrate in which a porous material is used as a spot material, in which a film 402 having an antireflection function due to light interference is additionally provided below the non-specific adsorption prevention film covering a flat portion other than the spot.
- a cross-sectional structure and a fluorescent image obtained using a substrate having the structure are shown.
- FIG. 4C to 4F show the configuration of a spot array substrate for nucleic acid analysis according to a modification of Example 3.
- FIG. It is the schematic which shows the structural example of the nucleic acid analyzer 500 which can use the spot array substrate for nucleic acid analysis by Example 1 thru
- FIG. 6A shows an example of an observation result of fluorescence emitted by exciting with a light source 514 after causing an extension reaction in a spot on a substrate incorporated in the flow cell 501.
- FIG. 6B shows an example of an observation result of fluorescence emitted by exciting with a light source 514 after causing an extension reaction in a spot on a substrate incorporated in the flow cell 502.
- FIG. 6C shows an example of an observation result of fluorescence emitted by exciting with a light source 514 after causing an extension reaction in a spot on a substrate incorporated in the flow cell 503.
- Embodiments according to the present disclosure relate to a biomolecule analysis, particularly a nucleic acid analysis spot array substrate for decoding a nucleic acid base sequence with high efficiency and high accuracy, and a nucleic acid analysis system using the spot array substrate.
- the spot array substrate for nucleic acid analysis according to the embodiment is provided with a plurality of spots, and each spot has a surface area increasing structure.
- the surface increasing structure include a structure in which a well is dug, a structure in which roughness is formed, and a structure in which spots are formed with a porous material.
- FIG. 1A is a diagram showing a state (example) in which a replicated DNA cluster is formed on a flat substrate (substrate without a spot array) incorporated in a general flow cell.
- FIG. 1A is intended to outline a typical example of a general flow cell used in a fluorescent DNA sequencer.
- FIG. 1B is a diagram showing a configuration of a general spot array substrate and a state (example) in which a replicated DNA cluster is formed.
- FIG. 1A shows a state in which replicated DNA clusters are formed on a flat substrate.
- the surface of the flat substrate 101 is surface-modified 102 with functional groups + oligo DNA so that DNA can be immobilized on the substrate.
- the surface of the spot array substrate 103 is subjected to surface modification 102 with the same functional group + oligo DNA, and a non-specific adsorption preventing film is used to prevent non-specific adsorption of DNA on a flat portion other than the spot. 104 is given.
- FIG. 1B shows a state in which replicated DNA clusters are formed on a spot array substrate with a low integration degree (0.29 M / cm 2 , 20 ⁇ m pitch, spot size ⁇ 7 ⁇ m) incorporated in the flow cell.
- the spot array substrate 103 is used, the replicated DNA cluster 105 can be formed on the spots arrayed at a constant pitch. For this reason, it becomes possible to analyze using the area
- FIG. 1B since there is a spot 108 where a duplicate DNA cluster is not formed by chance, such an example is also shown in FIG. 1B.
- the degree of integration is low, the spot size is sufficiently large as ⁇ 7 ⁇ m, and the distance between adjacent spots is sufficiently wide as 13 ⁇ m. Therefore, it is possible to clearly separate adjacent replication DNA clusters and perform fluorescence observation and analysis.
- the substrate is configured in an array arrangement, in order to further increase the integration, it is necessary not only to reduce the pitch between spots but also to reduce the spot size. If the spot size is reduced, the number of DNA replicas that can be immobilized on the spot decreases, and the fluorescent signal S obtained from the spot becomes weak. On the other hand, if the pitch is reduced, the distances approach each other so that fluorescent signals from adjacent spots overlap, and the background signal B (note that the background signal (also referred to as background light) B is other than the target spot). (Consisting of signals from dark places).
- the S / B ratio decreases when the integration is high, there is a limit to the high integration when a general substrate (conventional technology) is used. Therefore, in order to further improve the throughput, it is necessary to prevent a decrease in the S / B ratio due to high integration, improve the accuracy of data, and increase the number of effective clusters that can be used for analysis.
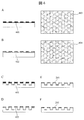
- FIG. 2 is a diagram for describing a configuration example of the spot array substrate for nucleic acid analysis according to the first embodiment of the present disclosure.
- spot array substrate for nucleic acid analysis In a spot array (general spot array substrate) with a low degree of integration as shown in FIG. 1B, the spot size is sufficiently large as ⁇ 7 ⁇ m and the pitch is sufficiently wide as 20 ⁇ m. For this reason, the fluorescence intensity from the spot is sufficiently high, and the influence of crosstalk due to overlapping with the fluorescence of the adjacent spot is also sufficiently low. If a spot array with a low integration level of this level is used, it is possible to easily measure each spot separately. Then, in order to examine further higher integration, substrates with a pitch reduced to 4.2 ⁇ m and a spot size reduced to ⁇ 1 ⁇ m were prepared, and formation of replicated DNA clusters on these spots was attempted.
- a substrate material for example, plastic, glass, silicon, quartz, sapphire, amorphous carbon, or the like can be used.
- FIG. 2A is a cross-sectional view and a fluorescent image of a spot array substrate as a comparative example in Example 1. Similar to the one shown in FIG. 1B, planar spots 202 are formed in an array on the substrate 201 so as to be capable of forming a replicating DNA cluster. Further, the flat portion other than the spot is covered with the non-specific adsorption preventing film 203. Using this substrate, a replicated DNA cluster was formed, and the fluorescence image was observed. Then, at first, there was some overlap with the fluorescence of the adjacent spot, but after that, when the lens parts of the optical system were replaced and the optical axis and focus were readjusted, the fluorescence image 204 that did not overlap with the adjacent spot was obtained. It was able to be acquired (FIG. 2A right figure).
- 2B to 2D are diagrams showing a cross-sectional view of a prototype surface area increasing structure and corresponding fluorescent images.
- the material of the substrate 201 and the material of the non-specific adsorption preventing film 203 are exactly the same as those shown in FIG. 2A, and only the structure of the spot portion is different.
- the structure of the spot portion to which the surface area increasing structure is applied is the structure 205 in which a well is dug in FIG. 2B, the structure 206 in which roughness is formed in FIG. 2C, and the porous material 207 (material in FIG. The structure itself has many holes). Details of the roughness processing and the porous material will be described later.
- Fluorescence images obtained in each case are shown in the right diagrams of FIGS. 2B to 2D.
- each of the increased surface area structures shown in FIGS. The actual surface area is larger than the apparent occupied area defined by the outer contour of the spot when the spot is viewed from the top of the substrate by digging, forming the surface roughness, or utilizing the porous material. It is thought that the fluorescence signal became stronger as the number of replicating DNA immobilized was increased.
- the improvement rate of the fluorescence intensity depends on the well depth, the degree of roughness, the porosity of the porous material, etc., and thus cannot be generally stated, but in this experimental evaluation, among the three types of FIG. 2B to FIG. Then, a relatively strong fluorescence signal was obtained particularly in the form of FIG. 2C provided with roughness.
- the outer contour 208 of the fluorescent image has a relatively small spread with respect to the outer contour of the spot when the spot is viewed from above the substrate. Since the portion where the surface area is increased is the inner side surface of the well, it is considered that the influence of the fluorescent image spreading from the spot to the outside is relatively small.
- the outer contours 209 and 210 of the fluorescent image are slightly expanded at the same time as the fluorescence from the spot becomes brighter. found. It is considered that the effective surface area of the spot is increased by utilizing the surface roughness and the surface of the porous material, so that the number of DNA replicas immobilized on the spot is increased, and the fluorescence intensity is thereby increased. Further, in the configuration of FIG. 2C in which roughness is formed and in the configuration of FIG. 2D in which a porous material is used, a part of light is simultaneously scattered on the spot surface and spreads around the spot, and the outer contour of the fluorescent image is slightly outside. It is presumed that it was observed.
- Roughness processing is a processing method for forming a roughness structure in a spot portion.
- the roughness processing method include a method of roughening the surface by dry etching. If the material to be processed is, for example, silicon, a general dry etching (plasma etching) apparatus is introduced with a gas containing halogen such as chlorine or fluorine and an additive gas containing oxygen or carbon. In this state, an electrical bias is applied to the wafer, and ion species in the plasma are incident on the wafer to process silicon (can be dug in a direction perpendicular to the wafer). In a general semiconductor process, this additive gas is added to prevent the mask material and other materials constituting the wafer from being processed unexpectedly (in the processing of silicon and other materials). It is a role to improve selectivity).
- plasma etching plasma etching
- the processed finish surface can be roughened by adjusting the amount of additive gas and the bias applied to the wafer as described above. it can.
- the amount of added gas and the wafer bias it is possible to cleanly process the surface or roughen the surface depending on conditions. This fact is generally known in the processing process of semiconductor materials, and in the embodiment of the present disclosure, the surface area is increased under the condition that the surface roughness that is undesirable in many of the general semiconductor processes is increased. A surface structure can be used.
- porous material for example, a porous low-k material that has been researched and developed for applications such as reducing the dielectric constant of an interlayer insulating film that insulates between wirings of semiconductor devices and between wiring layers can be used.
- a porous film has been developed as one candidate for a material having a low dielectric constant to prevent this.
- An example of a method for producing a porous film is to apply a raw material of the film flatly and then heat-treat, thereby volatilizing a part of the components constituting the film and forming a porous material film having many pores. And so on.
- the dielectric constant is low
- the wiring layers of semiconductor integrated devices stacked in multiple layers have problems in thermal conductivity (heat dissipation of wiring heat generation), mechanical strength, and the like as compared with normal dense materials.
- heat generation of wiring as in a general semiconductor device, mechanical strength of a multilayer structure having a large total number, and the like. For this reason, it can be simply used as a film having a larger surface area than a dense film.
- Example 1 ⁇ Summary of Example 1> As described above, according to Example 1, in the fluorescence DNA sequencer, when the number of DNA replicas immobilized on a spot is increased using an integrated spot array substrate with an increased effective surface area of the spot, It was confirmed that the signal strength could be improved.
- the fluorescence signal from each spot is collected using a lens.
- the depth of the well formed on the substrate, the roughness structure and the thickness of the porous structure depth difference in the depth direction
- the fluorescence signal from a location far from the focal point of the lens will be blurred.
- the height difference in the depth direction of the surface area increasing structure formed on the substrate so as to increase the surface area of the spot needs to be adjusted appropriately so as not to become too large.
- a surface area having a height difference in the depth direction using a substrate having a spot array layout with a sufficiently wide pitch of 20 ⁇ m and a sufficiently large spot size of ⁇ 7 ⁇ m When the increase structure is provided, the intensity of the fluorescence signal is improved with an increase in the height difference when the height difference is in the range of 0 to 2 ⁇ m. However, when the height difference is 2 ⁇ m or more, the improvement in intensity is saturated (fluorescence) The signal intensity is less likely to improve). Thus, it was found that there is a particularly remarkable effect of improving the fluorescence signal in the range where the height difference in the depth direction of the surface area increasing structure is 2 ⁇ m or less.
- the well structure is applied to the spot portion as an example, and the signal acquisition performance is confirmed in the same manner.
- the range of the height difference in which the signal acquisition performance can be obtained is shallower than that in the case of the above spot size ⁇ 7 ⁇ m (2 ⁇ m), especially in the range where the height difference of the well structure is 0 to 500 nm. It was confirmed that the fluorescence signal increased with the increase.
- the spot size is reduced and the fluorescence microscope magnification for observing the spot is increased, so that the focal length is shortened, and accordingly, the surface area increasing structure in which the high signal acquisition performance can be obtained in the depth direction. It is thought that the range of the height difference became narrow.
- Another reason is that, for example, in the case of a well structure, such as the side surface thereof, a portion that is difficult to see when viewed from above the substrate (roughness inclined surface for a roughness structure, interior of a pore structure for a porous structure, etc.) ), There is a possibility that the excitation efficiency for exciting the fluorescent dye is lower than in the case of the planar spot.
- the fluorescence signal was increased as the height difference was increased at the depth where the height difference was 1 ⁇ 2 of the spot diameter. It was found that the improvement in the intensity of the fluorescent signal tends to saturate when the difference in height increases to 1 ⁇ 2 or more. Probably, when the height difference is larger than 1 ⁇ 2 of the spot diameter, as described above, the number of portions that are difficult to be irradiated with excitation light increases, and the excitation efficiency of the portion that is difficult to see when viewed from above the substrate is increased. It is thought that it will decline. As described above, it was found that the effect of improving the intensity of the fluorescence signal is particularly high when the height difference in the depth direction of the surface area increasing structure is in the range up to 1 ⁇ 2 of the diameter of the spot viewed from above.
- the expression “well structure” is used, but this expression does not limit the shape of the depression (well structure).
- a cylindrical well may be dug into the substrate, and the shape may be composed of a side surface standing perpendicular to the bottom surface horizontal to the substrate, and the side surface may vary depending on the conditions of well processing during substrate fabrication. Even if it becomes a forward taper and an inverted frustoconical depression, it does not change that the surface area increases compared to a planar spot.
- the well structure may have an inverted conical shape in which the bottom of the well structure is pointed downward, or the bottom is rounded (generally It is not always necessary to have a circular shape when viewed from above, such as a cylinder, an inverted truncated cone, and an inverted cone. Even if it is a table, an inverted pyramid, or various other shapes, the same effect of increasing the surface area can be obtained as long as some concave depressions are arrayed on the substrate.
- Example 2 The spot array substrate for nucleic acid analysis according to Example 2 relates to a configuration example that can increase the intensity of a fluorescent spot and at the same time prevent the spread of the outer contour by applying a surface area increasing structure to the spot portion. It is.
- FIG. 3 is a diagram for explaining a configuration example of the spot array substrate for nucleic acid analysis according to the second embodiment.
- S / B ratio is further improved by using a structure in which a well is dug in the spot portion.
- Example 2 As described in Example 1, in the spot array substrate for nucleic acid analysis in FIG. 2B in which wells are dug in the spot portion, the fluorescence image is more out of the configuration according to FIGS. 2C and 2D using roughness formation or porous material. The outline spread is slightly small. For this reason, it was speculated that the influence of crosstalk with adjacent spots would be relatively small among the three types. Therefore, in Example 2, a spot array substrate having a specification in which wells were dug in the spot portion was selected, and further enlargement of the surface area and prevention of crosstalk were studied.
- FIG. 3A shows the cross-sectional structure of a spot substrate of a well having an inner diameter of ⁇ 1 ⁇ m and a fluorescent image obtained using the substrate having the structure, as in FIG. 2B.
- FIG. 3B shows a cross-sectional structure of a spot substrate in which the well inner diameter is enlarged to ⁇ 2 ⁇ m in order to improve the fluorescence intensity, and a fluorescence image obtained using the substrate having the structure.
- the number of DNA replicas that can be immobilized also increases by increasing the inner diameter of the well, and the fluorescence intensity of the spot increased.
- FIG. 3C shows a cross section of a spot substrate additionally provided with a light shielding film 301 and a fluorescent image obtained therefrom.
- the well inner diameter is enlarged to 2 ⁇ m, but the diameter of the opening of the light shielding film 301 is 1 ⁇ m.
- the outer contour 303 of the fluorescent image shown in FIG. 3C can be reduced as in the case of FIG. 3A as compared with the outer contour 304 of the fluorescent image of FIG. 3A in which the well opening is simply 1 ⁇ m. It was found that the fluorescence intensity is stronger than that in FIG. 3A and is advantageous over a simple well having an inner diameter of 1 ⁇ m.
- FIG. 3C shows a structure in which the diameter of the well dug into the substrate below the opening diameter of the light shielding film additionally provided in the lower layer of the non-specific adsorption preventing film covering the flat portion other than the spot is expanded. It is shown.
- a structure can be manufactured by controlling bias application by dry etching.
- bias application by dry etching it is required that the material exposed in the opening of the mask be processed faithfully with respect to the dimensions of the mask.
- an electrical bias is applied to the wafer so that ion species in the plasma are incident on the wafer perpendicularly, and the workpiece material is dug in a direction perpendicular to the wafer.
- processing isotropically proceeds in the lateral direction as well.
- a metal light-shielding film on a silicon substrate, a water-repellent film and a resist mask pattern are formed thereon. First, the water-repellent film and the metal light-shielding film are opened with a smaller diameter.
- the processing is performed by lowering the wafer bias and increasing the temperature of the substrate than the normal processing condition in the direction perpendicular to the substrate.
- Silicon can be etched not only in the direction perpendicular to the substrate (downward in the cross-sectional structure in the figure) but also in the lateral direction of the substrate to form the structure as shown.
- the mask pattern and dimensions are shifted, which is not preferable. Side etching, undercut, etc. Often called and strives to reduce this.
- the metal light shielding film even if the well structure is laterally expanded in the lower layer of the metal light shielding film as described above, the well inner surface area is ensured widely, and the metal light shielding film appropriately prevents crosstalk with adjacent spots. It can be used as a form to prevent.
- the wells are dug into the spot portions to increase the surface area to fix the analysis target, and the contours of the fluorescent images from the spots are adjacent.
- it is effective to adopt a configuration (the state shown in FIG. 3A) that does not overlap the contour of the fluorescent image from the spot to be performed.
- it is possible to further increase the fluorescence intensity by further expanding the inner diameter of the well. However, if only the inner diameter is increased, the outline of the fluorescence from the spot will overlap with the outline of the fluorescence from the adjacent spot (Fig. 3B state).
- Example 3 relates to another configuration example of a spot array substrate in which each spot portion has a surface area increasing structure, thereby increasing the intensity of fluorescence and at the same time preventing the expansion of the outer contour of the fluorescence.
- S / B ratio is further improved by using a configuration in which roughness is formed in a spot portion and a configuration using a porous material.
- FIG. 4 is a diagram for explaining a configuration example of the spot array substrate according to the third embodiment.
- FIG. 4A shows a cross-sectional structure of a substrate in which a light absorption film 401 is additionally provided in a lower layer of a non-specific adsorption prevention film covering a flat portion other than a spot in a substrate having roughness formed in a spot portion, and the structure The fluorescence image obtained using the board
- a film 402 having an antireflection function due to light interference is additionally provided below the nonspecific adsorption preventing film covering the flat portion other than the spot.
- a cross-sectional structure of the substrate and a fluorescent image obtained using the substrate having the structure are shown.
- Example 1 in both the spot array substrate subjected to the roughness processing and the spot array substrate using the porous material, the fluorescence from the spot became bright and the outer contour of the fluorescent image was It has spread.
- Example 3 using the optical functional film the light absorbing film 401 or the film 402 having an antireflection function due to optical interference
- a spot array substrate in which the roughness is applied to the spot portion, and the porous
- the spread of the fluorescent image is prevented by suppressing the scattered light by the optical functional film (the light absorbing film 401 or the film 402 having an antireflection function by light interference).
- the crosstalk can be reduced and the S / B ratio can be increased.
- the well opening is simply 1 ⁇ m
- the outer contour 403 of the fluorescent image shown in FIG. 4A and the outer contour of the fluorescent image shown in FIG. 4B. 404 can be reduced to the same extent.
- the fluorescence it was confirmed that a stronger intensity was maintained than in the case of FIG. 3A.
- the optical functional film may be provided only in the peripheral portion of the spot without being formed in the entire lower layer of the non-specific absorption preventing film covering the region other than the spot. That is, at least the optical functional film may be provided in a range in which the fluorescence from each spot does not cause crosstalk.
- ⁇ Modification> 4C to 4F show the configuration of a spot array substrate for nucleic acid analysis according to a modification of Example 3.
- FIG. As a modified example, a well is formed at each spot of the substrate and the bottom surface thereof is subjected to roughness processing (see FIGS. 4C and E), or a well is formed at each spot of the substrate and the bottom surface is porous. A configuration using materials (see FIGS. 4D and F) is conceivable.
- the modification shown in FIGS. 4C and 4D includes the configuration in which wells are dug in each spot of the substrate shown in Example 1 and Example 2, and the configuration or porous material subjected to roughness processing shown in Example 3.
- the present invention relates to a combination of the configuration used and an optical function film (light absorption film 401 or film 402 having an antireflection function due to light interference). By adopting such a configuration, compared to a simple spot structure in which the surface area is not increased, an effect of brightening fluorescence and reducing crosstalk with adjacent spots can be obtained.
- 4E and 4F relate to a combination of a configuration in which a well is dug in a spot of a substrate and a configuration in which roughness processing is performed or a configuration using a porous material shown in Example 3.
- the spot whose surface area is increased is surrounded by the side wall of the well, and there is an effect of suppressing the spread of fluorescence from the spot. For this reason, even if it is a form only of the nonspecific adsorption
- the roughness material and the porous material for increasing the surface area are arranged on the bottom surface of the well dug to suppress the spread of fluorescence from the spot.
- the side wall of the well surrounding these surface area increasing structures can suppress the spread of fluorescence from the spot if it is a material that is opaque to some extent, such as silicon, and has an effect of light shielding and light reflection. can get.
- the substrate material is a material that has a light-shielding or light-reflecting effect that can reduce crosstalk with adjacent spots
- the side wall of the well or the side wall of the well such as the upper part of the side wall
- the effect of reducing crosstalk with adjacent spots can also be obtained by using, for example, a configuration using an optical functional film having a light-shielding and light-reflecting effect such as a metal film as an example.
- the method of enlarging the well interior shown in Example 2 in the lateral direction to occupy the surface area occupies space in the lateral direction, which is a limitation in promoting higher integration in the future.
- Example 4 In Example 4, an example of analysis using a flow cell that can incorporate the spot array substrate for nucleic acid analysis according to Examples 1 to 3 described above will be described.
- FIG. 5 is a schematic diagram illustrating a configuration example of a nucleic acid analysis apparatus 500 that can use the spot array substrate for nucleic acid analysis according to the first to third embodiments.
- a flow cell for comparison, a flow cell 501 incorporating a spot array substrate (4.2 ⁇ m pitch, spot diameter ⁇ 1 ⁇ m) in which spots are planar and areas other than the spots are covered with a non-specific adsorption preventing film, the spots are planar.
- a flow cell 502 incorporating a spot array substrate (1.2 ⁇ m pitch, spot diameter ⁇ 0.8 ⁇ m) in which a region other than a spot is covered with a non-specific adsorption preventing film, and the spot portion has a roughness structure and other than a spot
- Three types of flow cell 503 incorporating a spot array substrate (1.2 ⁇ m pitch, spot diameter ⁇ 0.8 ⁇ m) additionally provided with a light absorbing film under the non-specific adsorption preventing film covering the flat part are prepared, A comparative evaluation was performed.
- the solution introduced through the solution introduction ports of the flow cells 501 to 503 flows through the inside of the flow cell incorporating each of the spot array substrates described above, and is discharged from the solution discharge port to the waste liquid container 518.
- the flow cell 501 was used for evaluation.
- a template DNA having an unknown sequence at least in part to be analyzed is immobilized on an array spot that is surface-modified with an oligo DNA on an amino group-modified surface, and then replicated on the spot. (Replicated DNA cluster) was analyzed by fluorescence measurement, and the base sequence was decoded.
- the temperature of the flow cell 501 can be controlled by the temperature adjustment function 504.
- a reaction reagent unit 505 for supplying several reaction reagents is installed at a temperature at which the reaction does not proceed in the reagent, and is connected to the flow cell 501 by a piping tube.
- the reaction reagent unit 505 is configured to supply five types of reagents 506 and 508 to 511.
- Reagent 506 includes a reagent (template DNA with a complementary sequence) in which a template DNA having an unknown sequence in at least a part to be analyzed is bound to a sequence complementary to an oligo DNA (known sequence) on an array spot It is.
- the reagent 508 is a reagent for duplicating on the array spot, including dATP, dGTP, dCTP, dTTP, and an enzyme.
- the reagent 509 is a reagent containing dATP-fluorescent dye 1, dGTP-fluorescent dye 2, dCTP-fluorescent dye 3, dTTP-fluorescent dye 4, and an extension reaction enzyme.
- the reagent 510 is a dye-binding cleaving reagent that cleaves the bond between the four types of dNTPs and the fluorescent dye.
- the reagent 511 is an aqueous electrolyte solution for use in replacement and washing of the liquid in the flow cell.
- an electrolyte aqueous solution 513 that is equivalent to isopropyl alcohol 512 and reagent 511 was prepared. These solutions are pipetted into the flow cell.
- Isopropyl alcohol 512 is used for solution replacement in the flow cell and may be another alcohol such as ethyl alcohol.
- a light source 514 that generates excitation light for exciting various fluorescent dyes included in the reagent 509, an optical system 515 for measuring fluorescence from the fluorescent dye, and a photodetector 516 are installed. Yes. Even an opaque substrate can be irradiated with excitation light or detected from the top, and can be excited and detected from below the substrate if it is a transparent substrate.
- the upper and lower arrangement of the detector is not particularly limited. As long as temperature control, light excitation, and fluorescence observation can be performed, the optical system may be arranged either above or below the flow cell.
- the fluorescence signal received by the photodetector 516 is converted into an electrical signal and transferred to the analysis device 517.
- the analysis device 517 performs analysis such as base identification and fragment data joining from the transferred signal, and decodes the base sequence of the nucleic acid.
- fluorescent dyes 1 to 4 contained in the reagent 509 various fluorescent dyes such as Alexa488, Cy3, Cy5, Cy5.5, Alexa555, Alexa647, Alexa680, dR6G, dR110, dTAMRA, and dROX are commercially available. It is well known that an appropriate one can be selected and used so that the wavelengths do not partially overlap. It is also well known that at least one or more suitable wavelengths can be selected as the wavelength of the light source 514 for efficiently exciting the fluorescent dye according to the selection of these dyes.
- the flow cell 501 was set in the nucleic acid analyzer in a state where it was filled with the aqueous electrolyte solution 513 and the bubbles were removed. As described above, the flow cell was set in the DNA sequencer, and the preparation was completed.
- the reagent 506 containing the template DNA with complementary sequence 507 is automatically injected into the flow cell 501 by the liquid feeding unit, and in this state, the liquid feeding is stopped once, set to the optimum temperature and left for 10 minutes, Hybridized and immobilized on an oligo DNA modified spot array. Since the flat portion other than the spot on the substrate was covered with the nonspecific adsorption preventing material, the template DNA 507 with complementary sequence was not adsorbed outside the spot array, and the nonspecific adsorption was not a problem.
- a spot array modified with oligo DNA is arranged on a substrate incorporated in the flow cell 501, and among these, a duplicate DNA cluster of a template DNA 507 with a complementary sequence is formed on a certain percentage of spots determined by probability theory. I was able to. The rate at which replicated DNA clusters can be formed with respect to all spots varies depending on the concentration of template DNA in reagent 506.
- the temperature was set to an appropriate temperature, and the reagent 509 was supplied to the flow cell to cause an elongation reaction with the enzyme.
- the reaction once stops after the extension reaction to the first base species of the template DNA occurs.
- excitation light was emitted from the light source 514, and the fluorescence emitted at this time was measured by the optical system 515 and the photodetector 516.
- the flow cell 503 has a pitch reduced to 1.2 ⁇ m, and a spot in which a light absorption film is additionally provided under the non-specific adsorption preventing film that employs a roughness structure on the surface of the spot and covers a flat portion other than the spot. An array substrate is incorporated.
- the procedure of fluorescence measurement is exactly the same as the procedure performed in the flow cell 501.
- FIG. 6 is a diagram showing a result of measurement using each flow cell by the nucleic acid analyzer 500.
- FIG. 6A shows fluorescence emitted by excitation with a light source 514 after causing an extension reaction in an array spot on a substrate (4.2 ⁇ m pitch, spot diameter ⁇ 1 ⁇ m) incorporated in the flow cell 501.
- a substrate 4.2 ⁇ m pitch, spot diameter ⁇ 1 ⁇ m
- FIG. 6A shows the outer contour of the fluorescent image outside the fluorescent image of the adjacent spot. An image separated from the neighbor could be obtained without overlapping the outline.
- FIG. 6B is generated by exciting the light source 514 after causing an extension reaction in an array spot on a substrate (1.2 ⁇ m pitch, spot diameter ⁇ 0.8 ⁇ m) incorporated in the flow cell 502. 2 shows an example of the observation result of fluorescence. Since the flow cell 502 has a 1.2 ⁇ m pitch and the pitch interval is reduced, the outer contour of the fluorescent image overlaps with the outer contour of the fluorescent image of the adjacent spot, as shown in FIG. 6B. As a result, the background signal B is increased.
- FIG. 6C shows a substrate (1.2 ⁇ m pitch, spot diameter ⁇ 0.8 ⁇ m, non-specific adsorption preventing film in which the spot portion covers a flat portion other than the roughness structure + spot) incorporated in the flow cell 503.
- An example of the observation result of the fluorescence emitted by exciting with the light source 514 after causing the extension reaction in the array spot on the upper layer) is shown.
- the pitch interval of the flow cell 503 is reduced to 1.2 ⁇ m, as shown in FIG. 6C, not only the intensity S of the fluorescent image is improved, but also the outer contour of the fluorescent image is a fluorescent image of an adjacent spot. It became clear that the background signal B can be reduced without overlapping with the outer contour of.
- the dye 510 is dyed at an appropriate temperature with a reagent 510 containing a dye-binding cleaving reagent that cleaves the bond between the four dNTPs and the fluorescent dye.
- the liquid in the flow cell containing the cleaved dye was once washed away with the electrolyte solution of the reagent 511. Thereafter, the reagent 509 was automatically injected again, and the measurement and analysis of fluorescence by the second and subsequent bases were similarly repeated.
- the base sequence was also analyzed by such a procedure, and the difference depending on the flow cell was evaluated. As a result, in the case where the background light from the adjacent replicated DNA cluster was mixed, naturally, errors were frequently generated even when the wavelength and intensity of the obtained fluorescence were analyzed.
- the replication of the template DNA immobilized on one array spot modified with the oligo DNA needs to be a replication of one type of template DNA.
- a spot where the template DNA could not be immobilized stochastically as a defective spot other than one type of template DNA replicated on one spot.
- two different types of template DNA are replicated on one spot.
- a base signal cannot be obtained, or two types of signals are obtained simultaneously, and cannot be used as data.
- Other methods have been devised, such as adjusting the concentration of aqueous solution to reduce defective spots where two types of template DNA have been replicated, and re-immobilizing template DNA to spots where template DNA has not been immobilized.
- the effective rate of data obtained from the array spot can be improved.
- a protocol for replicating template DNA on a substrate a method described in US ⁇ 2012/0156728 A1 can be used.
- the details of the on-substrate replication technology are not particularly limited, and details of the protocol are not particularly shown.
- Example 4 using a flow cell incorporating a spot array substrate according to the present disclosure, DNA replication was performed on the array spot of the substrate, and DNA containing an unknown sequence in a part to be analyzed was decoded.
- the flow cell incorporating the spot array substrate of the present disclosure can be applied not only to DNA but also to decoding of other nucleic acids such as RNA.
- the heater filament mark and the convex lens mark are symbolically used for the temperature control function and the optical system, but the temperature control function is cooled by air cooling, water cooling, a cooling element, or the like. In addition to its functions, it can be controlled to a constant temperature by a general temperature control method such as PID control, and the optical system has a spectral function such as a spectroscope and a color filter in addition to a convex lens. Needless to say, it is a general thing to be able to distinguish.
- the spot pitch is 20 ⁇ m and the spot size is ⁇ 7 ⁇ m
- the spot is sufficiently large so that the fluorescent signal from the spot is strong and the pitch is sufficiently wide so that the adjacent spot There is no interference with the signal from.
- the pitch of the spot is reduced to 4.2 ⁇ m (in the example, to a minimum of 1.2 ⁇ m)
- the spot becomes smaller and the intensity of the fluorescent signal becomes weaker. Interference (crosstalk) with the signal from becomes a problem.
- the present invention relates to a spot array substrate for improving the intensity of a fluorescent signal and the separability between adjacent spots for the purpose of miniaturization to such a size range or less and high integration.
- the spot array substrate according to each example is a spot array substrate for nucleic acid analysis used for analyzing and identifying a base sequence using fluorescence.
- the spot array substrate for nucleic acid analysis is formed of plastic, glass, silicon, quartz, sapphire, amorphous carbon or the like (first material), and a plurality of spots are arrayed on the surface.
- a non-specific adsorption preventing film (a coating layer made of the second material) can be provided in a region other than a region where a plurality of spots are arranged.
- Each spot has a surface area increasing structure (a concave dent structure, a roughness structure, or a surface structure formed using a porous material) having a height difference with respect to the vertical direction of the substrate.
- a surface area increasing structure a concave dent structure, a roughness structure, or a surface structure formed using a porous material
- the actual surface area of each spot is larger than the area defined by the outer contour of the spot when the spot is viewed from above the substrate.
- an optical functional film (a light-shielding film, a light-absorbing film, or a film having an anti-reflection function due to optical interference: a third material) may be provided between the substrate and the nonspecific adsorption-preventing film. It can. By doing in this way, generation
- the optical functional film does not need to be provided over the entire lower layer of the region where the nonspecific adsorption preventing film is provided, and may be provided at least in the peripheral portion of each spot.
- the present disclosure provides a flow cell for nucleic acid analysis.
- the flow cell for nucleic acid analysis incorporates a spot array substrate for nucleic acid analysis having the above-described configuration, and includes at least one liquid inlet and at least one liquid outlet.
- the pitch is reduced with higher integration, and the occupied space of the spot (the outer contour size of the spot) ) Is reduced, the effective surface area for immobilizing the replicating DNA cluster can be gained to prevent a decrease in the intensity of the signal S, and crosstalk (background signal B) between adjacent spots can be reduced.
- the S / B ratio in fluorescence observation can be kept high.
- by using a substrate that can maintain a high S / B ratio despite the increase in the degree of integration it is possible to increase the number of effective clusters that can be used for analysis by obtaining highly accurate data. And high throughput nucleic acid analysis can be realized.
- the present disclosure is not limited to the above-described embodiments, and includes various modifications.
- the above-described embodiments have been described in detail for easy understanding of the present disclosure, and are not necessarily limited to those having all the configurations described.
- a part of the configuration of one embodiment can be replaced with the configuration of another embodiment, and the configuration of another embodiment can be added to the configuration of one embodiment.
- the spread of the fluorescent image may be further improved by improving the optical system.
- light scattering at spots on the substrate should be addressed by devising the substrate. it is conceivable that.
- the method of the present disclosure that is devised on the substrate side is useful for further high integration.
Abstract
La présente invention améliore le débit d'analyse d'acide nucléique en évitant une réduction en S/B associée à une intégration de plus en plus élevée d'un substrat de réseau de taches. La présente invention propose un substrat de réseau de taches pour l'analyse d'acide nucléique, dans laquelle des taches sont disposées en une configuration en réseau sur la surface d'un premier matériau, tandis qu'une région autre que celle où les taches existent est recouverte d'un second matériau, une structure d'accroissement de la surface dans laquelle la hauteur varie dans un sens perpendiculaire au substrat étant formée au niveau de la partie où les taches existent de sorte que la surface réelle devienne supérieure à la surface définie par les contours des taches telles que visualisées depuis le dessus du substrat.
Priority Applications (1)
| Application Number | Priority Date | Filing Date | Title |
|---|---|---|---|
| PCT/JP2016/085823 WO2018100724A1 (fr) | 2016-12-01 | 2016-12-01 | Substrat de réseau de taches, procédé d'analyse d'acide nucléique, et dispositif d'analyse d'acide nucléique |
Applications Claiming Priority (1)
| Application Number | Priority Date | Filing Date | Title |
|---|---|---|---|
| PCT/JP2016/085823 WO2018100724A1 (fr) | 2016-12-01 | 2016-12-01 | Substrat de réseau de taches, procédé d'analyse d'acide nucléique, et dispositif d'analyse d'acide nucléique |
Publications (1)
| Publication Number | Publication Date |
|---|---|
| WO2018100724A1 true WO2018100724A1 (fr) | 2018-06-07 |
Family
ID=62241277
Family Applications (1)
| Application Number | Title | Priority Date | Filing Date |
|---|---|---|---|
| PCT/JP2016/085823 WO2018100724A1 (fr) | 2016-12-01 | 2016-12-01 | Substrat de réseau de taches, procédé d'analyse d'acide nucléique, et dispositif d'analyse d'acide nucléique |
Country Status (1)
| Country | Link |
|---|---|
| WO (1) | WO2018100724A1 (fr) |
Cited By (1)
| Publication number | Priority date | Publication date | Assignee | Title |
|---|---|---|---|---|
| CN113227342A (zh) * | 2019-01-09 | 2021-08-06 | 株式会社日立高新技术 | 核酸分析用基板、核酸分析用流动池以及图像分析方法 |
Citations (8)
| Publication number | Priority date | Publication date | Assignee | Title |
|---|---|---|---|---|
| JP2002511586A (ja) * | 1998-04-13 | 2002-04-16 | スリーエム イノベイティブ プロパティズ カンパニー | 高密度小型化アレイおよびその製造方法 |
| JP2002267667A (ja) * | 2001-03-08 | 2002-09-18 | Hitachi Software Eng Co Ltd | マイクロアレイ及びマイクロアレイ用基板 |
| JP2003107086A (ja) * | 2001-09-28 | 2003-04-09 | Olympus Optical Co Ltd | フロスト面を有する基板を用いた核酸プローブアレイ |
| JP2004097200A (ja) * | 2001-12-28 | 2004-04-02 | Enplas Corp | プラスチックプレート及びプラスチックプレート組立体 |
| JP2005308407A (ja) * | 2004-04-16 | 2005-11-04 | Olympus Corp | マイクロアレイ用チップと、その製造方法及びその検出方法 |
| JP2007500122A (ja) * | 2003-07-29 | 2007-01-11 | コーニング インコーポレイテッド | 自己蛍光を低減させた多孔性ガラス基板 |
| JP2008513782A (ja) * | 2004-09-17 | 2008-05-01 | パシフィック バイオサイエンシーズ オブ カリフォルニア, インコーポレイテッド | 分子解析のための装置及び方法 |
| WO2016084489A1 (fr) * | 2014-11-27 | 2016-06-02 | 株式会社日立ハイテクノロジーズ | Substrat à réseau de points, procédé de fabrication de celui-ci, procédé et dispositif d'analyse de polymère d'acide nucléique |
-
2016
- 2016-12-01 WO PCT/JP2016/085823 patent/WO2018100724A1/fr active Application Filing
Patent Citations (8)
| Publication number | Priority date | Publication date | Assignee | Title |
|---|---|---|---|---|
| JP2002511586A (ja) * | 1998-04-13 | 2002-04-16 | スリーエム イノベイティブ プロパティズ カンパニー | 高密度小型化アレイおよびその製造方法 |
| JP2002267667A (ja) * | 2001-03-08 | 2002-09-18 | Hitachi Software Eng Co Ltd | マイクロアレイ及びマイクロアレイ用基板 |
| JP2003107086A (ja) * | 2001-09-28 | 2003-04-09 | Olympus Optical Co Ltd | フロスト面を有する基板を用いた核酸プローブアレイ |
| JP2004097200A (ja) * | 2001-12-28 | 2004-04-02 | Enplas Corp | プラスチックプレート及びプラスチックプレート組立体 |
| JP2007500122A (ja) * | 2003-07-29 | 2007-01-11 | コーニング インコーポレイテッド | 自己蛍光を低減させた多孔性ガラス基板 |
| JP2005308407A (ja) * | 2004-04-16 | 2005-11-04 | Olympus Corp | マイクロアレイ用チップと、その製造方法及びその検出方法 |
| JP2008513782A (ja) * | 2004-09-17 | 2008-05-01 | パシフィック バイオサイエンシーズ オブ カリフォルニア, インコーポレイテッド | 分子解析のための装置及び方法 |
| WO2016084489A1 (fr) * | 2014-11-27 | 2016-06-02 | 株式会社日立ハイテクノロジーズ | Substrat à réseau de points, procédé de fabrication de celui-ci, procédé et dispositif d'analyse de polymère d'acide nucléique |
Cited By (1)
| Publication number | Priority date | Publication date | Assignee | Title |
|---|---|---|---|---|
| CN113227342A (zh) * | 2019-01-09 | 2021-08-06 | 株式会社日立高新技术 | 核酸分析用基板、核酸分析用流动池以及图像分析方法 |
Similar Documents
| Publication | Publication Date | Title |
|---|---|---|
| US7170050B2 (en) | Apparatus and methods for optical analysis of molecules | |
| US20210325306A1 (en) | Arrays of integrated analytical devices | |
| CN102227659B (zh) | 超高多路分析系统和方法 | |
| JP5222599B2 (ja) | 核酸分析デバイス及びそれを用いた核酸分析装置 | |
| RU2740733C1 (ru) | Устройства детектирования света с защитной облицовкой и относящиеся к ним способы | |
| JP6710259B2 (ja) | スポットアレイ基板、その製造方法、核酸ポリマー解析方法及び装置 | |
| JP2020534673A (ja) | ウエハレベルのシーケンスフローセルの製造 | |
| RU2737847C1 (ru) | Устройства детектирования света с двойной фильтрацией и относящиеся к ним способы | |
| US8865403B2 (en) | Nucleic acid analyzing device and nucleic acid analyzer | |
| JP3908135B2 (ja) | 生化学的検査用画像処理方法 | |
| WO2018100724A1 (fr) | Substrat de réseau de taches, procédé d'analyse d'acide nucléique, et dispositif d'analyse d'acide nucléique | |
| US20050282204A1 (en) | Microarray substrate having patterned thin layer and microarray comprising the same, and methods of producing the microarray substrate and the microarray | |
| JPWO2010137543A1 (ja) | 核酸分析用デバイス、核酸分析装置、及び核酸分析方法 | |
| CN110218628B (zh) | 一种数字pcr芯片及其制备方法 | |
| JP2007101308A (ja) | 標的物質検出素子、標的物質検出装置及び標的物質検出方法 | |
| TWI525353B (zh) | 超高多工分析系統及方法 | |
| JP4296479B2 (ja) | ポリヌクレオチドを固定化するための基体の製造方法 | |
| WO2006134376A2 (fr) | Detection d'une capture chimique sans indicateur | |
| JP2010014648A (ja) | プローブアレイおよびその製造方法 | |
| TW202244488A (zh) | 具有縮尺單位單元之整合式分析裝置之陣列 | |
| KR101890477B1 (ko) | 나노구조물이 형성된 형광 기판의 제조방법 및 이에 의해 제작된 형광 기판 | |
| GB2622991A (en) | Detection chip and preparation method therefor, and detection method | |
| TW202307419A (zh) | 每個像素具有多個反應位點的感測器 | |
| JP2009174954A (ja) | コード化粒子 | |
| Visalli et al. | Microarrays as a Tool for Gene Expression Profiling: Application in Ocular and kk |
Legal Events
| Date | Code | Title | Description |
|---|---|---|---|
| 121 | Ep: the epo has been informed by wipo that ep was designated in this application |
Ref document number: 16923086 Country of ref document: EP Kind code of ref document: A1 |
|
| NENP | Non-entry into the national phase |
Ref country code: DE |
|
| 122 | Ep: pct application non-entry in european phase |
Ref document number: 16923086 Country of ref document: EP Kind code of ref document: A1 |
|
| NENP | Non-entry into the national phase |
Ref country code: JP |