WO2018002995A1 - 生体リズムの検出装置、検出方法、及び、検出プログラム - Google Patents
生体リズムの検出装置、検出方法、及び、検出プログラム Download PDFInfo
- Publication number
- WO2018002995A1 WO2018002995A1 PCT/JP2016/069036 JP2016069036W WO2018002995A1 WO 2018002995 A1 WO2018002995 A1 WO 2018002995A1 JP 2016069036 W JP2016069036 W JP 2016069036W WO 2018002995 A1 WO2018002995 A1 WO 2018002995A1
- Authority
- WO
- WIPO (PCT)
- Prior art keywords
- activity
- data
- subject
- biological rhythm
- frequency
- Prior art date
Links
Images


Classifications
-
- A—HUMAN NECESSITIES
- A61—MEDICAL OR VETERINARY SCIENCE; HYGIENE
- A61B—DIAGNOSIS; SURGERY; IDENTIFICATION
- A61B5/00—Measuring for diagnostic purposes; Identification of persons
- A61B5/48—Other medical applications
- A61B5/4857—Indicating the phase of biorhythm
-
- A—HUMAN NECESSITIES
- A61—MEDICAL OR VETERINARY SCIENCE; HYGIENE
- A61B—DIAGNOSIS; SURGERY; IDENTIFICATION
- A61B5/00—Measuring for diagnostic purposes; Identification of persons
- A61B5/103—Detecting, measuring or recording devices for testing the shape, pattern, colour, size or movement of the body or parts thereof, for diagnostic purposes
- A61B5/11—Measuring movement of the entire body or parts thereof, e.g. head or hand tremor, mobility of a limb
- A61B5/1118—Determining activity level
-
- A—HUMAN NECESSITIES
- A61—MEDICAL OR VETERINARY SCIENCE; HYGIENE
- A61B—DIAGNOSIS; SURGERY; IDENTIFICATION
- A61B5/00—Measuring for diagnostic purposes; Identification of persons
- A61B5/72—Signal processing specially adapted for physiological signals or for diagnostic purposes
- A61B5/7235—Details of waveform analysis
- A61B5/725—Details of waveform analysis using specific filters therefor, e.g. Kalman or adaptive filters
-
- A—HUMAN NECESSITIES
- A61—MEDICAL OR VETERINARY SCIENCE; HYGIENE
- A61B—DIAGNOSIS; SURGERY; IDENTIFICATION
- A61B5/00—Measuring for diagnostic purposes; Identification of persons
- A61B5/74—Details of notification to user or communication with user or patient ; user input means
- A61B5/742—Details of notification to user or communication with user or patient ; user input means using visual displays
- A61B5/7425—Displaying combinations of multiple images regardless of image source, e.g. displaying a reference anatomical image with a live image
-
- A—HUMAN NECESSITIES
- A61—MEDICAL OR VETERINARY SCIENCE; HYGIENE
- A61B—DIAGNOSIS; SURGERY; IDENTIFICATION
- A61B2560/00—Constructional details of operational features of apparatus; Accessories for medical measuring apparatus
- A61B2560/04—Constructional details of apparatus
- A61B2560/0475—Special features of memory means, e.g. removable memory cards
-
- A—HUMAN NECESSITIES
- A61—MEDICAL OR VETERINARY SCIENCE; HYGIENE
- A61B—DIAGNOSIS; SURGERY; IDENTIFICATION
- A61B2562/00—Details of sensors; Constructional details of sensor housings or probes; Accessories for sensors
- A61B2562/02—Details of sensors specially adapted for in-vivo measurements
- A61B2562/0219—Inertial sensors, e.g. accelerometers, gyroscopes, tilt switches
-
- A—HUMAN NECESSITIES
- A61—MEDICAL OR VETERINARY SCIENCE; HYGIENE
- A61B—DIAGNOSIS; SURGERY; IDENTIFICATION
- A61B5/00—Measuring for diagnostic purposes; Identification of persons
- A61B5/72—Signal processing specially adapted for physiological signals or for diagnostic purposes
- A61B5/7235—Details of waveform analysis
- A61B5/7253—Details of waveform analysis characterised by using transforms
- A61B5/7257—Details of waveform analysis characterised by using transforms using Fourier transforms
Definitions
- the technology described in the present specification relates to a biological rhythm detection device, a detection method, and a detection program.
- biological rhythm There is a technique for detecting or estimating a physiological rhythm of a living body (which may be referred to as “biological rhythm”). For example, a technique for estimating a biological rhythm curve by measuring a subject's rectal temperature for 24 hours or more, and a technique for estimating a biological rhythm curve by measuring a subject's heart rate for 24 hours or more are known.
- the subject will experience pain or discomfort due to invasive measurement, and daily life will be hindered by long-term measurement over 24 hours.
- one of the objects of the technology described in this specification is to enable easy detection of a biological rhythm.
- the biological rhythm detection device may include an acquisition unit and a processing unit.
- the acquisition unit may acquire activity amount data indicating the activity amount measured by an activity meter that measures the activity amount of the subject.
- the processing unit may detect the frequency indicating the peak power in the result of frequency analysis of the time waveform of the activity amount data as a frequency derived from the biological rhythm of the subject.
- the biological rhythm detection method acquires activity amount data indicating the activity amount measured by an activity meter that measures an activity amount of a subject, and performs frequency analysis on a time waveform of the activity amount data.
- the frequency indicating the peak power may be detected as a frequency derived from the biological rhythm of the subject.
- the biological rhythm detection program acquires activity amount data indicating the activity amount measured by an activity meter that measures an activity amount of a subject to a computer, and a time waveform of the activity amount data
- a frequency indicating peak power may be detected as a frequency derived from the biological rhythm of the subject.
- the biological rhythm can be easily detected.
- FIGS. 7 to 13 show examples of a subject's daily biological rhythm (frequency f), a time calculated from the biological rhythm, and a time difference with respect to 24 hours obtained from the activity amount data for seven days illustrated in FIGS.
- FIG. It is a figure which shows together the time waveform of a test subject's biological rhythm, and the time waveform of the circadian rhythm used as a reference
- A) is a figure which shows an example of the time waveform of activity amount data for 24 hours
- (B) is an example of the time waveform obtained by filtering the time waveform of (A) with a band pass filter (BPF).
- BPF band pass filter
- FIG. 16 (A) and FIG. 16 (B) It is a figure which shows the example which superimposes and displays the time waveform illustrated to FIG. 16 (A) and FIG. 16 (B). It is a figure which shows an example of the visual display mode of the data regarding a circadian rhythm. It is a figure which shows an example of the visual display mode of the data regarding a circadian rhythm. It is a figure which shows an example of the visual display mode of the data regarding a circadian rhythm. It is a flowchart for demonstrating the operation example which concerns on the modification of one Embodiment. It is a flowchart for demonstrating the operation example which concerns on the modification of one Embodiment.
- the biological rhythm is a periodic rhythm that the living body autonomously engraves.
- physiological fluctuations such as sleep, body temperature, blood pressure, and autonomic nerves are adjusted with about 24 hours as one cycle.
- Human biological rhythm is also called “circadian rhythm” or “circadian rhythm”.
- the circadian rhythm is usually synchronized with the light and dark cycle of morning and night (about 24 hours). If the circadian rhythm is disturbed and out of sync with the 24-hour period (which may be referred to as the “reference rhythm”), it may affect symptoms such as jet lag, sleep disorders, and seasonal depression. It is considered. Therefore, the treatment of circadian rhythm has attracted attention.
- the subject falls asleep because a circadian rhythm releases a hormone (for example, melatonin) that affects sleep, but it is difficult to directly know the secretion of the hormone, for example, by a blood test.
- a hormone for example, melatonin
- an attempt is made to detect periodicity derived from the biological rhythm of the subject from the data indicating the amount of activity including the activity state and the sleep state in the subject's daily life.
- the “activity amount” of the subject may be rephrased as the “movement amount” of the subject.
- the data indicating the activity amount of the subject may be abbreviated as “activity amount data”.
- temporal “undulations” of activity that is, periodicity derived from biological rhythm in a period of about 24 hours.
- time waveform of activity data may be abbreviated as “time waveform of activity data”.
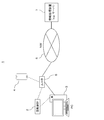
- FIG. 1 is a block diagram illustrating a configuration example of an information processing system according to an embodiment.
- the information processing system 1 illustrated in FIG. 1 may include, for example, an activity meter 2, a personal computer (PC) 3, a mobile terminal 4, a network 5, a router 6, and an information processing device 7.
- PC personal computer
- FIG. 1 may include, for example, an activity meter 2, a personal computer (PC) 3, a mobile terminal 4, a network 5, a router 6, and an information processing device 7.
- PC personal computer
- the activity meter 2 is also referred to as “life coder 2”, and exemplarily measures data indicating an activity amount according to the movement of a human body that is an example of a living body (may be referred to as “activity data”). .
- the activity meter 2 may be a contact type or a non-contact type.
- the “person” that is the object of measurement by the activity meter 2 may be referred to as “user”, “observer”, or “subject”.
- the test subject may be a plurality of persons, and the activity amount of each of the plurality of persons may be measured by the individual activity meter 2.
- the activity meter 2 may be shared by some or all of a plurality of people.
- the activity meter 2 may store the measurement results in a memory or the like for each of the plurality of people.
- the activity data obtained by the activity meter 2 may be input to the PC 3 as appropriate.
- the activity meter 2 may communicate with the PC 3 and input activity amount data to the PC 3.
- the PC may be a desktop PC, a notebook PC (or laptop PC), a tablet PC, or the like.
- the connection between the activity meter 2 and the PC 3 may be a wired connection or a wireless connection.
- the communication between the activity meter 2 and the PC 3 may be communication via the router 6 or direct communication not via the router 6.
- applicable communication cables such as a LAN (local area network) cable and a USB (universal serial bus) cable may be used as a non-limiting example.
- LAN local area network
- USB universal serial bus
- an applicable wireless connection method such as “WiFi (Wireless Fidelity)” (registered trademark), “Bluetooth” (registered trademark), “NFC” (near field communication) may be used.
- the PC 3 may be communicably connected to the router 6 and be able to communicate with the information processing device 7 via the network 5.
- PC is an example of “information processing apparatus”.
- the connection between the PC 3 and the router 6 may be a wired connection or a wireless connection.
- an applicable communication cable such as a LAN cable or a USB cable may be used for the wired connection.
- an applicable wireless connection method such as “WiFi” or “Bluetooth” may be used for the wireless connection.
- the network 5 may be, for example, the Internet, a LAN, a WAN (wide area network), or the like.
- the network 5 may include a radio access network.
- the radio access network may be, for example, a radio access network conforming to 3GPP (3rd generation generation partnership project) LTE (long term evolution) or LTE-Advanced.
- the information processing apparatus 7 may be a PC or a server computer (may be abbreviated as “server”).
- the server may be a cloud server installed in a data center or the like.
- the information processing apparatus 7 is a “server”.
- the server 7 may receive and acquire activity amount data by communicating with the PC 3 via the network 5.
- the server 7 receives and acquires activity data from the activity meter 2 via the network 5 without going through the PC 3. May be.
- the connection between the activity meter 2 and the router 6 may be a wired connection or a wireless connection.
- An applicable communication cable such as a LAN cable or a USB cable may be used for the wired connection.
- applicable wireless connection methods such as “WiFi”, “Bluetooth”, and “NFC” may be used.
- the server 7 may receive and acquire the activity data obtained by the activity meter 2 via the wireless access network without using the router 6.
- the activity amount data may be measured by the mobile terminal 4.
- the mobile terminal 4 may be a mobile phone such as a smartphone or a wearable terminal.
- the activity amount data obtained by the mobile terminal 4 may be received and acquired by the PC 3 or the server 7 through the same communication path as the activity amount data obtained by the activity meter 2.
- the activity amount data provided from the activity meter 2 or the portable terminal 4 to the PC 3 or the server 7 may be data that has been processed or processed in whole or in part in the activity meter 2 or the portable terminal 4.
- Processing activity data may include storing and managing activity data.
- the management of the activity data may include making the activity data into a database (DB).
- DB data may be referred to as “cloud data” or “big data”.
- the PC 3 and the server 7 may detect the biological rhythm of the subject based on the acquired activity data.
- the “detection” of the biological rhythm may be referred to as “measurement”, “determination”, or “estimation”.
- the PC 3 and the server 7 may be referred to as a biological rhythm detection device, a measurement device, a determination device, or an estimation device.
- the PC 3 and the server 7 may be referred to as a “biological rhythm detection device”.
- the function and processing (or algorithm) as the biological rhythm detection device may be realized by a single PC or server, or may be realized by distributed processing of a plurality of PCs or servers.
- activity amount data and biological rhythm detection processing based on activity amount data may be processed or managed by one information processing device, or may be processed or managed in a distributed manner by a plurality of information processing devices. Good.
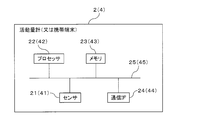
- FIG. 2 (Configuration example of activity meter 2)
- the structural example of the active mass meter 2 is shown.
- the mobile terminal 4 capable of measuring activity data may also have the configuration illustrated in FIG. 2, and the elements of the mobile terminal 4 are indicated by parenthesized symbols.
- elements 21 to 25 of activity meter 2 will be explained.
- the elements of the mobile terminal 4 indicated by parentheses 41 to 45 in FIG. 2 may be regarded as having the same functions as the elements 21 to 25 of the activity meter 2 unless otherwise specified.
- the activity meter 2 may include an activity sensor 21, a processor 22, a memory 23, and a communication interface (IF) 24, for example.
- the activity sensor 21, the processor 22, the memory 23, and the communication IF 24 are illustratively connected to the bus 25 and may be capable of communicating with each other via the processor 22.
- the activity amount sensor 21 may be any sensor that can sense activity amount data corresponding to the activity of the living body.
- the activity data is an example of vital information.
- the activity amount data sensed by the sensor 21 may be referred to as “sensor data” for convenience. “Sensing” may be rephrased as “detection” or “measurement”.
- an inertial sensor As the sensor 21 that can measure the activity data of the living body, an inertial sensor, a radio wave sensor, a heart rate sensor, a pulse sensor, or the like may be applied as a non-limiting example.
- the inertial sensor may be an acceleration sensor or a gyroscope.
- the acceleration sensor for example, any one of a piezoelectric sensor and a capacitance sensor may be applied.
- the gyroscope any of a rotary machine (coma) type, an optical type, and a vibration type sensor may be applied.
- the inertial sensor may have one or a plurality of detection axes.
- the gravity component in the direction along the detection axis may be detected as “acceleration”, for example. By detecting “acceleration”, it is possible to detect the amount of activity data corresponding to the movement and posture of the living body.
- the radio wave sensor can detect a movement of a living body in a non-contact manner based on a change in a reflected wave received by irradiating a radio wave such as a microwave to a sensing object and reflected by the sensing object.
- the reflected wave changes due to the Doppler effect.
- the change in the reflected wave can be viewed as a change in one or both of the amplitude and frequency of the reflected wave.
- the “radio wave sensor” may be referred to as a “microwave sensor”, an “RF (Radio frequency sensor)”, or a “Doppler sensor”.
- the heart rate sensor illustratively detects the pulsation of the blood vessel according to the heartbeat of the living body.
- a heartbeat of a living body can be grasped as a change in electromagnetic waves, pressure, or sound according to the heartbeat.
- the heartbeat can be optically measured as the fluctuation of the reflected light according to the blood flow change.
- a rhythmic movement occurs on the surface of the living body (for example, the skin) according to the heartbeat, and therefore, between the skin and the radio wave transmission source according to the movement.
- the heartbeat of the living body can also be measured as a fluctuation due to the Doppler effect of the reflected wave irradiated to the living body.
- a radio wave sensor can be used as the heart rate sensor.
- the blood pressure (which may be referred to as “blood pressure”) rhythmically fluctuates. It is also possible to measure with a piezoelectric sensor or the like.
- the heart rate can be measured as a change in the potential of the myocardium or a change in sound according to the heartbeat, like an electrocardiograph or a heart sound meter.
- the “heartbeat sensor” may be referred to as a “pulse sensor”.
- the activity meter 2 including the sensor 21 may be referred to as a sensor unit 2 for convenience.
- the sensor unit 2 may be attached in contact with the skin of the human body, or may be attached in a non-contact manner at a position away from the human body within a range where vital information can be sensed.
- the activity data provided from the activity meter 2 or the portable terminal 4 to the PC 3 or the server 7 may be primary data detected by the sensor 21 or secondary data obtained based on the detected data. .
- the activity amount data may be data indicating movement according to the daily activity of the subject.
- the processor 22 is an example of an arithmetic processing device having arithmetic processing capability.
- the arithmetic processing apparatus may be referred to as an arithmetic processing device or an arithmetic processing circuit.
- a CPU central processing unit
- DSP digital signal processor
- MPU micro processing unit
- IC integrated circuit
- the “processor” may be referred to as a “processing unit”, a “control unit”, or a “computer”.
- the processor 22 illustratively realizes the function and processing as the activity meter 2 and controls the operation according to the function and processing.
- Programs and data for realizing functions, processing, and control as the activity meter 2 may be stored in the memory 23.
- Program may be referred to as “software” or “application”.
- data may include activity amount data and data generated according to the operation of the processor 22.
- the processor 22 reads the program and data stored in the memory 23 and operates to implement functions, processing, and control as the activity meter 2.
- the memory 23 is an example of a storage medium, and may be a random access memory (RAM) or a flash memory.
- All or part of the program code constituting the program may be stored in the storage unit, or may be described as part of the operating system (OS).
- OS operating system
- the program and data may be provided in a form recorded on a computer-readable recording medium.
- the recording medium include a flexible disk, CD-ROM, CD-R, CD-RW, MO, DVD, Blu-ray disk, portable hard disk, and the like.
- a semiconductor memory such as a USB (UniversalUniversSerial Bus) memory is also an example of a recording medium.
- the program and data may be provided (for example, downloaded) from the server or the like to the activity meter 2 via the network 5.
- a program and data may be provided to the activity meter 2 through the communication IF 24.
- the communication IF 24 is an example of a communication unit provided in the activity meter 2, and illustratively enables communication with the PC 3, the router 6, and the wireless access network. Activity amount data obtained by the sensor 21 or the processor 22 may be transmitted to the PC 3 or the server 7 via the communication IF 24.
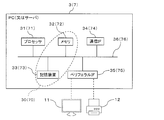
- FIG. 3 shows a configuration example of the PC 3. Since the PC 3 is an example of an information processing apparatus, the configuration may be the same as that of the server 7. Therefore, in FIG. 3, the elements of the server 7 are indicated by reference numerals 71 to 76 with parentheses.
- elements 31 to 36 of PC3 will be described in order to avoid redundant description.
- the elements of the server 7 indicated by parentheses 71 to 76 in FIG. 3 may be regarded as having the same functions as the elements 31 to 36 of the PC 3 unless otherwise specified.
- the PC 3 may include a processor 31, a memory 32, a storage device 33, a communication IF 34, and a peripheral IF 35, for example.
- the processor 31, the memory 32, the storage device 33, the communication IF 34, and the peripheral IF 35 may be connected to the bus 36 and can communicate with each other via the processor 31, for example.
- the processor 31 is an example of an arithmetic processing device having arithmetic processing capability.
- the arithmetic processing apparatus may be referred to as an arithmetic processing device or an arithmetic processing circuit.
- a CPU central processing unit
- DSP digital signal processor
- MPU micro processing unit
- IC integrated circuit
- the “processor” may be referred to as a “processing unit”, a “control unit”, or a “computer”.
- the processor 31 illustratively causes the PC 3 to function or process as a biological rhythm detection device, and controls operations according to the function or processing.
- Programs and data for realizing functions, processing, and control as the biological rhythm detection device 3 may be stored in the memory 32 or the storage device 33.
- the processor 31 reads and operates programs and data stored in the memory 32 and the storage device 33, thereby realizing functions, processing, and control as the biological rhythm detection device 3.
- the memory 32 is an example of a storage medium, and may be a RAM, a flash memory, or the like.
- the storage device 33 may store various data and programs.
- the storage device 33 may be a hard disk drive (HDD), a solid state drive (SSD), a flash memory, or the like.
- the data stored in the storage device 33 may include, for example, activity amount data received by the communication IF 34.
- the data stored in the storage device 33 may be appropriately converted into a database (DB).
- DB data may be referred to as “cloud data” or “big data”.
- the storage device 33 and the memory 32 may be collectively referred to as the “storage unit 30” in the PC 3.
- the storage device 33 and the memory 32 in the server 7 may be collectively referred to as the “storage unit 70”.
- the program stored in the storage unit 30 may include a program for executing processing described later with reference to FIGS. 4, 21, and 22.
- the program may be referred to as a “biological rhythm detection program”.
- All or part of the program code constituting the program may be stored in the storage unit or described as part of the OS.
- the program and data may be provided in a form recorded on a computer-readable recording medium.
- the recording medium include a flexible disk, CD-ROM, CD-R, CD-RW, MO, DVD, Blu-ray disk, portable hard disk, and the like.
- a semiconductor memory such as a USB (UniversalUniversSerial Bus) memory is also an example of a recording medium.
- the program and data may be provided (for example, downloaded) from the server or the like to the activity meter 2 via the network 5.
- a program and data may be provided to the PC 3 through the communication IF 34.
- the communication IF 34 is an example of a communication unit provided in the PC 3, and illustratively enables communication with the activity meter 2, the mobile terminal 4, the router 6, the wireless access network, and the like.
- the communication IF 34 is an example of a reception unit (also referred to as “acquisition unit”) that receives activity amount data obtained by the activity meter 2 or the mobile terminal 4 when attention is focused on reception processing.
- the communication IF 34 is an example of a transmission unit that transmits activity amount data obtained by the activity meter 2 or the portable terminal 4 to the server 7.
- the communication IF 74 of the server 7 can exemplarily transmit data to the activity meter 2, the PC 3, and the mobile terminal 4 via the network 5.
- the data destined for the activity meter 2, the PC 3, and the mobile terminal 4 may exemplarily include a processing result of activity data (for example, a circadian rhythm determination result).
- the peripheral IF 35 is an interface for connecting peripheral devices to the PC 3 exemplarily.
- Peripheral devices may include input devices for inputting information to the PC 3 and output devices for outputting information generated by the PC 3.
- the input device may include a keyboard, a mouse, a touch panel, and the like.
- the output device may include a display 11, a printer 12, and the like, as schematically illustrated in FIG.
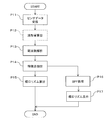
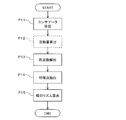
- FIG. 4 is a flowchart showing an operation example of the biological rhythm detection device 3.
- the flowchart illustrated in FIG. 4 may be executed by the processor 31 of the biological rhythm detection device 3 exemplarily.
- the biological rhythm detection device 3 receives the sensor data measured by the activity meter 2 (Process P11).
- the sensor data may be activity data or data that can calculate activity data. If the latter activity amount data can be calculated, the biological rhythm detection device 3 may calculate the activity amount data based on the data (processing P12).
- FIG. 5 shows an example of activity data.
- the horizontal axis represents time (for example, sampling timing), and the vertical axis represents the power of activity.
- the activity amount data is sampled 720 times in 24 hours to obtain 720 sampling data (may be referred to as “time-series data”). It is shown that. In other words, the sampling rate of the activity data is 720 Hz.
- the biological rhythm detection device 3 detects the circadian rhythm of the subject (in other words, a periodicity of about 24 hours to 25 hours) from the activity amount data illustrated in FIG.
- a periodicity of about 24 hours to 25 hours
- FIG. 5 For example, when the 24-hour activity data is smoothed by taking a moving average of 14 sections, for example, as shown in FIG. 6, A certain periodicity appears.
- the biological rhythm detection device 3 (for example, the processor 31) of the present embodiment illustratively performs time analysis on the time-series activity data as a time waveform (processing P13), and detects a feature point in the frequency analysis result. Are extracted (process P14).
- the “characteristic point” is a characteristic frequency indicating the periodicity of the circadian rhythm.
- the “feature point” may be a frequency component having a peak of power spectral density (may be referred to as “peak power”) in the frequency analysis result.
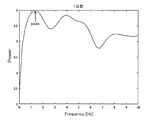
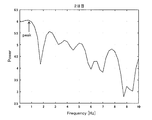
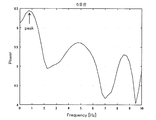
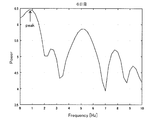
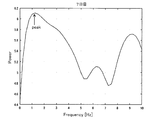
- 7 to 13 show examples of the results of frequency analysis of activity data for one week (seven days). 7 to 13, the horizontal axis represents frequency, and the vertical axis represents power.
- the biological rhythm detection device 3 may search for a frequency having a peak power (see an arrow) in each of the frequency analysis results illustrated in FIGS. 7 to 13 and detect and extract it as a “feature point”.
- a frequency having peak power (which may be referred to as “peak frequency” for convenience) is a frequency having one cycle in the vicinity of 24 hours per day. For example, if 24 hours a day is defined as pseudo 1 Hz, the biological rhythm detection device 3 may search for a peak frequency closest to 1 Hz in the frequency analysis result.
- the activity amount data when the activity amount data is subjected to frequency analysis, the activity amount data for 24 hours is sampled every second to obtain 86400 samples. In other words, if the sampling rate is 86400 Hz, The frequency balance to be obtained is poor. For this reason, the amount of calculation increases for the number of samples.
- one cycle per day is defined as 1 Hz.
- the biological rhythm detection device 3 finds the period of the peak frequency closest to 1 Hz in the frequency analysis result, and thus the circadian rhythm that is the biological rhythm (also referred to as “cycle”) of the subject for one day. Is calculated (process P15 in FIG. 4).
- 1 day is defined as 1 Hz in a pseudo manner, in the result of frequency analysis of activity amount data of a period shorter than 24 hours such as 18 hours (3/4 day) or 12 hours (1/2 day), A frequency lower than 1 Hz may be set as the search frequency.
- the peak frequency closest to 0.75 Hz may be searched, and in the frequency analysis result of activity data of 1/2 day, the frequency analysis result is 0.5 Hz. What is necessary is just to search the nearest peak frequency.
- the activity data or frequency analysis result used for detecting the circadian rhythm may be data of a period of less than 24 hours.
- a subject's circadian rhythm can be reset by exposure of the subject to sunlight, so activity data for several hours after the subject wakes up in the morning may not show the characteristic periodicity of the circadian rhythm. is there.
- the activity data or frequency analysis results corresponding to about 6 hours to 12 hours (1/4 day to 1/2 day) after waking up when 24 hours a day is divided into 4 for 6 hours, etc. You may exclude from the candidate used for calculation of a rhythm. Thereby, the amount of circadian rhythm calculation processing can be reduced, and it can control that circadian rhythm calculation accuracy falls.
- FIG. 14 shows an example of a subject's daily biological rhythm (frequency f) obtained from the activity data for seven days illustrated in FIGS. 7 to 13.
- the circadian rhythm of the subject is longer (stretched) than the standard 24 hours. If the circadian rhythm becomes longer than 24 hours, it may cause symptoms such as difficulty getting up and sleeping at night.
- FIG. 15 shows an example of a time waveform of the rhythm Cir for two days of the subject.
- the waveform indicated by the solid line represents a normal waveform in which the circadian rhythm of the subject is close to 24 hours.
- the waveform indicated by the alternate long and short dash line represents the waveform when the subject's circadian rhythm is shorter than 24 hours
- the waveform indicated by the dotted line represents the waveform when the subject's circadian rhythm is longer than 24 hours. ing.
- the circadian rhythm is ticked with a period of about 24 to 25 hours per day, and if the circadian rhythm is normal, it becomes two wavelengths in two days. If the circadian rhythm becomes longer, it becomes less than two wavelengths, so the rhythm in the body becomes slow, and as described above, it may cause symptoms such as difficulty getting up and sleeping at night. On the other hand, when the circadian rhythm is shortened, since two wavelengths are exceeded in two days, the internal rhythm is accelerated, and as described above, it may cause early morning awakening and the like.
- “date” data and data on any one or two items of “frequency”, “calculation time”, and “time difference with respect to 24 hours” may be output to an external device.
- the “calculation time” data is data indicating a time corresponding to one cycle of the subject's biological rhythm.
- the time corresponding to one period of the biological rhythm of the subject may be represented by one or both of the start time and the end time.
- time waveform data illustrated in FIG. 15 may be output to an external device.
- the biological rhythm detection device 3 performs activity data (before frequency analysis) based on the peak frequency detected in the process P14 in parallel with the circadian rhythm calculation process (P15).
- the time waveform of the original data may be filtered (process P16).
- the time waveform of the activity data is filtered by the BPF having such a transmission band characteristic
- the time waveform of the circadian rhythm of the subject can be detected. For example, when the time waveform of activity amount data for 24 hours a day as illustrated in FIG. 16A is filtered by the BPF having the above-described characteristics, a time waveform as illustrated in FIG. 16B is obtained. It is done.
- the time waveform of FIG. 16B shows the time change of the frequency component derived from the daily biological rhythm of the subject, that is, the circadian rhythm, included in the time waveform of the activity amount data of FIG. Represents.
- the biological rhythm detection device 3 may visually display the time waveform as shown in FIG. 16B obtained by BPF processing of the activity amount data as the circadian rhythm of the subject (processing P17 in FIG. 4). .
- the superimposed display it becomes easy for the subject to recognize the circadian rhythm with respect to the temporal change of the daily activity amount of the subject. For example, when the circadian rhythm is disturbed, it becomes easy to visually recognize the activity time that causes the disturbance in the daily activity.
- the biological rhythm detection device 3 has a display mode in which the deviation (in other words, the difference) between the subject's circadian rhythm and the reference rhythm can be easily recognized, as exemplified in FIGS. 18 to 20, for example.
- a visual display of the data may be performed.
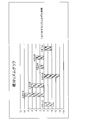
- FIG. 18 is a diagram illustrating an example of a mode of extracting and displaying data on items of “day” and “time difference with respect to 24 hours” among the items in the four columns illustrated in FIG. 14.
- a part of the data (numerical value) of “time difference with respect to 24 hours” is “rounded” by rounding off. Visibility can be improved by “rounding” of numerical values, but “rounding” may not be essential.
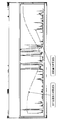
- FIG. 19 is a diagram showing an example of a mode in which data for seven days are graphed and displayed with the two items illustrated in FIG. 18 as the horizontal axis and the vertical axis.
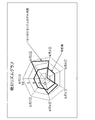
- FIG. 20 is a diagram illustrating an example of a mode in which data for seven days is graphed and displayed for each axis of the radar chart for the two items illustrated in FIG. 18.
- an ideal reference rhythm (ideal value) of the circadian rhythm may be displayed together with the data of the subject. This makes it easier for the subject to visually recognize the difference between the subject's circadian rhythm and the reference rhythm.
- the display modes illustrated in FIGS. 18 to 20 may be combined as appropriate.
- the biological rhythm detection device 3 may perform visual display by combining any two or more of the display modes illustrated in FIGS.
- the display mode of the data related to the circadian rhythm is not limited to the modes illustrated in FIGS. Any display mode may be adopted as long as it allows the subject to easily recognize the deviation from the circadian rhythm or the reference rhythm of the person. Emphasis display and weak gradation display may be used in combination.
- the display destination according to the various display modes described above is not limited to the display 11 of the PC 3 or the server 7, but may be the display of the activity meter 2 or the display of the portable terminal 4.
- the PC 3 or the server 7 may transmit a signal for displaying data related to circadian rhythm to the activity meter 2 or the mobile terminal 4.
- the signal is not limited to data related to circadian rhythm, and may include data for controlling the various display modes described above.
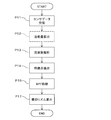
- the biological rhythm detection apparatus 3 may perform the above-described processes P11 to P15 as illustrated in FIG. If the circadian rhythm calculation process is unnecessary, the biological rhythm detection apparatus 3 may perform the above-described processes P11 to P14 and processes P16 and P17 as illustrated in FIG.
- the circadian rhythm of the subject can be easily detected without acquiring the blood and rectal temperature of the subject. Therefore, a deviation between the circadian rhythm of the subject and the reference rhythm can be detected, and comments and advice that improve the deviation can be provided to the subject, which can be used for the health management of the subject.
- the activity meter 2 and the portable terminal 4 may not be attached in a manner of being restrained by the subject for the measurement of the activity data.
- a sensor that can measure the activity amount of the subject in a non-contact manner such as an inertial sensor or a radio wave sensor
- the subject can connect the activity meter 2 or the portable terminal 4 to the activity amount sensor 21 (or 41).
- the amount of activity can be measured by putting it on the waist or in a pocket of clothing.
- the activity meter 2 and the mobile terminal 4 can reach the subject even if the activity meter 2 and the portable terminal 4 are placed away from the subject's body. It is possible to measure the amount of activity within a certain range.
- the activity meter 2 and the portable terminal 4 do not necessarily have to be carried by the subject.
- the activity meter 2 and the portable terminal 4 may be placed in an indoor space where the subject is located.
- the circadian rhythm of the subject can be easily detected without disturbing the daily life of the subject for measurement.
- usability can be improved with respect to circadian rhythm measurement.
- the activity amount of the subject may be measured by combining a plurality of activity amount sensors 21 in terms of time.
- the plurality of activity amount sensors 21 may be a combination of different types of sensors, for example, a combination of a radio wave sensor and an inertial sensor.
- the activity amount of the subject is measured by a radio wave sensor installed indoors, and while the subject is out of the house, the inertia of the activity meter 2 carried by the subject is measured.
- the amount of activity can also be measured by a sensor.
- the biological rhythm detection device 3 is measured by activity data measured by an inertial sensor from 9:00 to 18:00 and by a radio wave sensor installed indoors from 18:00 to 9:00 the next morning.
- the amount of activity data may be connected in time series for frequency analysis.
- the activity amount data illustrated in FIG. 5 and FIG. 16A may be regarded as corresponding to data obtained by connecting the activity amount data obtained by the plurality of activity amount sensors 21 in time series. .
- the biological rhythm detection device 3 may obtain the period derived from the biological rhythm from the active time when the activity data is measured by the activity sensor 21 carried by the subject and the radio wave sensor installed indoors. Good.
- the technique described in the above-mentioned Patent Document 8 may be applied to the technique for obtaining the activity amount data from the measurement value of the radio wave sensor.
- the beat signal corresponding to the Doppler effect which is an output signal of the radio wave sensor, changes in amplitude and frequency corresponding to the magnitude and speed of the subject's movement appear.
- the output signal of the radio wave sensor includes information correlated with the activity amount of the subject
- the activity amount of the subject may be referred to as “exercise intensity” from the measurement value of the radio wave sensor. Can be sought.
- the length of a trajectory drawn in the time domain by changes in amplitude and frequency in accordance with the magnitude and speed of the subject's movement is defined as the “wavelength during extension”.
- the “wavelength during extension” corresponds to the length of a line segment obtained by extending the time waveform of the measurement value of the radio wave sensor linearly in the time domain. Therefore, the “wavelength during extension” is a different concept from the normal “wavelength”.
- the biological rhythm detection device 3 can obtain the activity amount data of the subject from the “extension wavelength” by converting the measurement value of the radio wave sensor into the “extension wavelength”.
- the “wavelength at the time of extension” is illustratively stored in the storage unit 30 (or 70) sequentially in a certain period (which may be referred to as “sampling period”). It can be calculated by adding the amount of change in the amplitude value over a unit time.
- the “wavelength during extension” is obtained by dividing a section of a curve AB in a time waveform that is a measurement value of a radio wave sensor into n minute sections, approximating each minute section with a line segment, It may be calculated by an arithmetic expression for obtaining the sum of.
- Information processing system 1 Information processing system 2 Activity meter 3 Personal computer (PC) 4 Mobile terminal 5 Network 6 Router 7 Information processing device (server) 11 Display 12 Printer 21, 41 Activity amount sensor 22, 31, 42, 71 Processor 23, 32, 43, 72 Memory 24, 34, 44, 74 Communication interface (IF) 25, 36, 45, 76 Bus 30, 70 Storage unit 33, 73 Storage device 35, 75 Peripheral IF
Landscapes
- Health & Medical Sciences (AREA)
- Life Sciences & Earth Sciences (AREA)
- Molecular Biology (AREA)
- Engineering & Computer Science (AREA)
- Veterinary Medicine (AREA)
- Pathology (AREA)
- Biophysics (AREA)
- Biomedical Technology (AREA)
- Heart & Thoracic Surgery (AREA)
- Medical Informatics (AREA)
- Surgery (AREA)
- Animal Behavior & Ethology (AREA)
- General Health & Medical Sciences (AREA)
- Public Health (AREA)
- Physics & Mathematics (AREA)
- Physiology (AREA)
- Dentistry (AREA)
- Oral & Maxillofacial Surgery (AREA)
- Nuclear Medicine, Radiotherapy & Molecular Imaging (AREA)
- Radiology & Medical Imaging (AREA)
- Artificial Intelligence (AREA)
- Computer Vision & Pattern Recognition (AREA)
- Psychiatry (AREA)
- Signal Processing (AREA)
- Measuring And Recording Apparatus For Diagnosis (AREA)
- Measuring Pulse, Heart Rate, Blood Pressure Or Blood Flow (AREA)
- Measurement Of The Respiration, Hearing Ability, Form, And Blood Characteristics Of Living Organisms (AREA)
- Medical Treatment And Welfare Office Work (AREA)
Abstract
被験者の活動量を測定する活動量計(2,4)で測定された活動量データの時間波形を周波数解析した結果において、ピークパワーを示す周波数を前記被験者の生体リズムに由来する周波数として検出する。
Description
本明細書に記載する技術は、生体リズムの検出装置、検出方法、及び、検出プログラムに関する。
生体の生理的なリズム(「生体リズム」と称してよい。)を検出又は推定する技術がある。例えば、被験者の直腸温を24時間以上にわたって測定して生体リズム曲線を推定する技術や、被験者の心拍を24時間以上にわたって測定して生体リズム曲線を推定する技術が知られている。
しかしながら、直腸温の測定では、計測プローブを被験者の直腸に挿入する必要があり、また、心拍の測定では計測パッチを胸部に貼り付ける必要がある。また、生体リズムの推定には、生体情報の24時間以上にわたる連続的な測定が要求される。
そのため、被験者は、侵襲的な測定のために苦痛や不快感等を経験することになり、また、24時間以上にわたる長期間の測定によって日常生活を阻害されてしまう。このように、既知の生体リズムの推定技術では、被験者の生体リズムを簡易に推定又は検出することが難しい。
1つの側面では、本明細書に記載する技術の目的の1つは、生体リズムを簡易に検出できるようにすることにある。
1つの側面において、生体リズムの検出装置は、取得部と、処理部と、を備えてよい。取得部は、被験者の活動量を測定する活動量計で測定された前記活動量を示す活動量データを取得してよい。処理部は、前記活動量データの時間波形を周波数解析した結果においてピークパワーを示す周波数を前記被験者の生体リズムに由来する周波数として検出してよい。
また、1つの側面において、生体リズムの検出方法は、被験者の活動量を測定する活動量計で測定された前記活動量を示す活動量データを取得し、前記活動量データの時間波形を周波数解析した結果においてピークパワーを示す周波数を前記被験者の生体リズムに由来する周波数として検出してよい。
生体リズム検出方法。
生体リズム検出方法。
更に、1つの側面において、生体リズムの検出プログラムは、コンピュータに、被験者の活動量を測定する活動量計で測定された前記活動量を示す活動量データを取得し、前記活動量データの時間波形を周波数解析した結果においてピークパワーを示す周波数を前記被験者の生体リズムに由来する周波数として検出する、処理を実行させてよい。
1つの側面として、生体リズムを簡易に検出することができる。
生体リズムは、生体が自律的に刻む周期的なリズムであり、人の場合であれば、約24時間を1サイクルとして睡眠、体温、血圧、自律神経等の生理的な変動が調節されている。人の生体リズムは「概日リズム」又は「サーカディアンリズム(circadian rhythm)」とも称される。
「概日リズム」は、通常、朝及び夜の明暗の周期(約24時間)に同調している。「概日リズム」に乱れが生じて約24時間の周期(「基準リズム」と称してよい。)に同調しなくなると、時差ぼけ、睡眠障害、季節性鬱等の症状に影響を及ぼし得ると考えられている。そのため、概日リズムの治療が注目されている。
「概日リズム」が基準リズムからずれると、被験者の身体能力の発揮、薬剤の効能にも影響を及ぼし得ると考えられており、例えば、時間薬理学の分野で、概日リズムの正常化による効能等の最大化が注目されている。そのため、被験者の概日リズムを簡易に検出できる技術が期待されている。
例えば、概日リズムを検出するために、被験者の毛根細胞や血液、直腸温等を24時間以上にわたって計測しようとすると、被験者の日常生活に支障をきたすため、日常生活への適用は困難であると考えられる。
また、被験者は、概日リズムによって睡眠に影響のあるホルモン(例えば、メラトニン)が分泌されることで眠りにつくが、例えば血液検査によってホルモンの分泌を直接知ることは困難である。
そこで、本実施形態では、被験者の日常生活における活動状態及び睡眠状態を含む活動量を示すデータから、被験者の生体リズムに由来する周期性を検出することを試みる。なお、被験者の「活動量」は、被験者の「動き量」と言い換えてもよい。また、被験者の活動量を示すデータは、「活動量データ」と略称してよい。
活動量データから生体リズムに由来する周期性を求めるためには、被験者の生理的な変動とは異なる外乱起因(例えば、被験者の身体的な活動に伴う動き)を、活動量データから分離できるとよい。
分離が可能であれば、約24時間という期間において活動量の時間的な「うねり」、つまりは生体リズムに由来する周期性を見つけることが可能である。
そこで、本願発明者は、例えば、活動量データの時間波形において、約24時間の期間で1周期を示す、被験者の身体的な活動に伴う動きに影響されにくい成分を検出することで、被験者の生体リズムを簡易に検出できることを発見した。なお、「活動量データの時間波形」は、「活動量の時間波形」と略称してもよい。
以下、図面を参照して実施の形態を説明する。ただし、以下に説明する実施形態は、あくまでも例示であり、以下に明示しない種々の変形や技術の適用を排除する意図はない。また、以下に説明する各種の例示的態様は、適宜に組み合わせて実施しても構わない。なお、以下の実施形態で用いる図面において、同一符号を付した部分は、特に断らない限り、同一若しくは同様の部分を表す。
図1は、一実施形態に係る情報処理システムの構成例を示すブロック図である。図1に示す情報処理システム1は、例示的に、活動量計2、パーソナルコンピュータ(PC)3、携帯端末4、ネットワーク5、ルータ6、及び、情報処理装置7を備えてよい。
活動量計2は、「ライフコーダ2」とも称され、例示的に、生体の一例である人体の動きに応じた活動量を示すデータ(「活動量データ」と称してよい。)を測定する。活動量計2は、接触式でも非接触式でもよい。活動量計2による測定対象である「人」は、「利用者」、「被観測者」、あるいは「被験者」と称してもよい。
被験者は、複数人であってよく、複数人のそれぞれの活動量が、個別の活動量計2によって測定されてよい。あるいは、活動量計2は、複数人の一部又は全部に兼用されてもよい。1つの活動量計2が複数人に兼用される場合、活動量計2は、複数人の別に、測定結果をメモリ等に記憶してよい。
活動量計2によって得られた活動量データは、適宜に、PC3に入力されてよい。例示的に、活動量計2は、PC3と通信して活動量データをPC3に入力してよい。PCは、デスクトップPCでもよいし、ノートPC(又は、ラップトップPC)やタブレットPC等でもよい。
活動量計2とPC3との接続は、有線接続でもよいし無線接続でもよい。また、活動量計2とPC3との通信は、ルータ6を介した通信でもよいしルータ6を介さないダイレクトな通信でもよい。
有線接続には、非限定的な一例として、LAN(local area network)ケーブルやUSB(universal serial bus)ケーブル等の適用可能な通信ケーブルが用いられてよい。無線接続には、「WiFi(Wireless Fidelity)」(登録商標)や「Bluetooth」(登録商標)、「NFC」(near field communication)等の適用可能な無線接続方式が用いられてよい。
PC3は、ルータ6と通信可能に接続されて、ネットワーク5経由で情報処理装置7と通信することが可能であってよい。なお、「PC」も「情報処理装置」の一例である。
PC3とルータ6との接続は、有線接続でもよいし無線接続でもよい。有線接続には、非限定的な一例として、LANケーブルやUSBケーブル等の適用可能な通信ケーブルが用いられてよい。無線接続には、非限定的な一例として、「WiFi」や「Bluetooth」等の適用可能な無線接続方式が用いられてよい。
ネットワーク5は、例示的に、インターネットや、LAN、WAN(wide area network)等であってよい。また、ネットワーク5には、無線アクセス網が含まれてもよい。無線アクセス網は、例示的に、3GPP(3rd generation partnership project)のLTE(long term evolution)やLTE-Advancedに準拠した無線アクセス網であってよい。
情報処理装置7は、PCでもよいしサーバコンピュータ(「サーバ」と略称してよい。)でもよい。サーバは、データセンタ等に設置されるクラウドサーバであってもよい。以下では、便宜的に、情報処理装置7が「サーバ」であると仮定する。サーバ7は、ネットワーク5経由でPC3と通信することによって、活動量データを受信、取得してよい。
活動量計2が、ネットワーク5に接続されたルータ6と通信可能に接続されていれば、サーバ7は、PC3を介さずに、活動量計2からネットワーク5経由で活動量データを受信、取得してもよい。
活動量計2とルータ6との接続は、有線接続でもよいし無線接続でもよい。有線接続には、LANケーブルやUSBケーブル等の適用可能な通信ケーブルが用いられてよい。無線接続には、「WiFi」や「Bluetooth」、「NFC」等の適用可能な無線接続方式が用いられてよい。
あるいは、サーバ7は、ルータ6を介さずに無線アクセス網を介して活動量計2で得られた活動量データを受信、取得してもよい。
なお、活動量データは、携帯端末4によって測定されてもよい。例えば、活動量計2と同等の機能の全部又は一部が、携帯端末4に備えられてもよい。携帯端末4は、スマートフォン等の携帯電話機であってもよいしウェアラブル端末であってもよい。
携帯端末4で得られた活動量データが、活動量計2で得られた活動量データと同様の通信経路にて、PC3やサーバ7によって受信、取得されてよい。
活動量計2や携帯端末4からPC3やサーバ7へ提供される活動量データは、活動量計2や携帯端末4において全部又は一部が処理されたり加工されたりしたデータであってもよい。
活動量データを取得したPC3やサーバ7は、取得した活動量データを処理する。活動量データを処理することには、活動量データを記憶、管理することが含まれてよい。活動量データの管理には、活動量データをデータベース(DB)化することが含まれてよい。DB化されたデータは、「クラウドデータ」や「ビッグデータ」等と称されてよい。
また、PC3やサーバ7は、取得した活動量データを基に、被験者の生体リズムを検出してよい。生体リズムの「検出」は、「測定」、「判定」又は「推定」と称してもよい。
そのため、PC3やサーバ7は、生体リズムの検出装置、測定装置、判定装置、あるいは、推定装置と称してもよい。以下では、便宜的に、PC3やサーバ7を「生体リズム検出装置」と称することがある。
生体リズム検出装置としての機能や処理(あるいはアルゴリズム)は、単一のPCやサーバによって実現されてもよいし、複数のPCやサーバの分散処理によって実現されてもよい。
別言すると、活動量データや活動量データに基づく生体リズムの検出処理は、1つの情報処理装置によって処理又は管理されてもよいし、複数の情報処理装置によって分散的に処理又は管理されてもよい。
(活動量計2の構成例)
図2に、活動量計2の構成例を示す。なお、活動量データを測定可能な携帯端末4も、図2に例示する構成を有していてよく、携帯端末4のエレメントについては括弧付きの符号を付して示している。
図2に、活動量計2の構成例を示す。なお、活動量データを測定可能な携帯端末4も、図2に例示する構成を有していてよく、携帯端末4のエレメントについては括弧付きの符号を付して示している。
以下では、重複的な説明を避けるために、活動量計2のエレメント21~25について説明する。図2において括弧付きの41~45で表した携帯端末4のエレメントについては、特に断らない限り、それぞれ活動量計2のエレメント21~25と同等の機能を有すると捉えてよい。
図2に示すように、活動量計2は、例示的に、活動量センサ21、プロセッサ22、メモリ23、及び、通信インタフェース(IF)24を備えてよい。活動量センサ21、プロセッサ22、メモリ23、及び、通信IF24は、例示的に、バス25に接続されて、互いにプロセッサ22を介した通信が可能であってよい。
活動量センサ21(以下「センサ21」と略称することがある。)は、例示的に、生体の活動に応じた活動量データをセンシング可能なセンサであればよい。なお、活動量データは、バイタル情報の一例である。センサ21によってセンシングされた活動量データは、便宜的に、「センサデータ」と称されてもよい。「センシング」は、「検出」あるいは「測定」と言い換えてもよい。
生体の活動量データを測定可能なセンサ21としては、非限定的な一例として、慣性センサや電波センサ、心拍センサ、脈拍センサ等が適用されてよい。
慣性センサは、加速度センサでもよいし、ジャイロスコープでもよい。加速度センサには、例示的に、圧電式及び静電容量式のいずれのセンサを適用してもよい。ジャイロスコープには、回転機械(コマ)式、光学式、及び、振動式のいずれのセンサを適用してもよい。
慣性センサは、1又は複数の検出軸を有していてよい。検出軸に沿う方向の重力成分が例えば「加速度」として検出されてよい。「加速度」の検出によって、生体の動きや姿勢等に応じた活動量データを検出することができる。
電波センサは、マイクロ波等の電波をセンシング対象に照射し、センシング対象で反射して受信される反射波の変化を基に、生体の動きを非接触で検出することができる。
例えば、電波センサとセンシング対象との間の距離が変化すると、ドップラー効果によって、反射波に変化が生じる。反射波の変化は、例示的に、反射波の振幅及び周波数の一方又は双方の変化として捉えることができる。「電波センサ」は、「マイクロ波センサ」、「RF(Radio Frequency)センサ」、あるいは、「ドップラーセンサ」と称されてもよい。
心拍センサは、例示的に、生体の心拍に応じた血管の脈動を検出する。例えば、生体の心拍は、心臓の鼓動に応じた、電磁波や圧力、音の変化として捉えることができる。
例示的に、指や耳たぶ等の血管に赤外線等の光を照射すると、血流の律動的な変化と光の吸収特性とによって、反射光が周期的に変動する。したがって、心拍は、血流変化に応じた反射光の変動として光学的に計測することが可能である。
あるいは、生体にマイクロ波等の電波を照射すると、心臓の鼓動に応じて生体表面(例えば、皮膚)に律動的な動きが生じるから、当該動きに応じて皮膚と電波の送信源との間の距離に変化が生じ、反射波にドップラー効果による変化が生じる。
したがって、生体の心拍は、生体に照射した反射波のドップラー効果による変動として計測することも可能である。別言すると、心拍センサに電波センサを用いることもできる。
また、心臓が律動的に収縮と弛緩とを繰り返すと、血管の圧力(「血圧」と称してよい。)が律動的に変動するから、心拍は、血圧の律動的な変動として、圧力センサや圧電センサ等によって計測することも可能である。
更に、心拍は、心電計や心音計のように、心臓の鼓動に応じた心筋の電位変化や音の変化として計測することも可能である。
なお、既述のように、心拍を示す情報は脈拍を示す情報と等価的に扱ってよい場合があるから、「心拍センサ」は「脈拍センサ」と称されてもよい。
センサ21を含む活動量計2は、便宜的に、センサユニット2と称してもよい。センサユニット2は、例示的に、人体の皮膚に接触して取り付けられてもよいし、バイタル情報をセンシング可能な範囲で人体から離れた位置に非接触で取り付けられてもよい。
活動量計2や携帯端末4からPC3やサーバ7に提供される活動量データは、センサ21によって検出された一次データでもよいし、検出されたデータを基にして得られた2次データでもよい。別言すると、活動量データは、被験者の日々の活動に応じた動きを示すデータであればよい。
プロセッサ22は、演算処理能力を備えた演算処理装置の一例である。演算処理装置は、演算処理デバイス又は演算処理回路と称されてもよい。演算処理装置には、例示的に、CPU(central processing unit)、DSP(digital signal processor)、MPU(micro processing unit)、IC(integrated circuit)等が適用されてよい。なお、「プロセッサ」は、「処理部」、「制御部」あるいは「コンピュータ」と称してもよい。
プロセッサ22は、例示的に、活動量計2としての機能や処理を実現し、また、当該機能や処理に応じた動作を制御する。活動量計2としての機能や処理、制御を実現するプログラムやデータがメモリ23に記憶されてよい。
「プログラム」は、「ソフトウェア」あるいは「アプリケーション」と称されてもよい。「データ」には、活動量データやプロセッサ22の動作に応じて生成されたデータが含まれてよい。
プロセッサ22が、メモリ23に記憶されたプログラムやデータを読み取って動作することで、活動量計2としての機能や処理、制御が具現される。なお、メモリ23は、記憶媒体の一例であり、RAM(random access memory)やフラッシュメモリ等であってよい。
プログラムを成すプログラムコードの全部又は一部は、記憶部に記憶されてもよいし、オペレーティングシステム(OS)の一部として記述されてもよい。
プログラムやデータは、コンピュータ読取可能な記録媒体に記録された形態で提供されてよい。記録媒体の一例としては、フレキシブルディスク、CD-ROM,CD-R,CD-RW,MO,DVD、ブルーレイディスク、ポータブルハードディスク等が上げられる。また、USB(Universal Serial Bus)メモリ等の半導体メモリも記録媒体の一例である。
あるいは、プログラムやデータは、サーバ等からネットワーク5経由で活動量計2に提供(例えば、ダウンロード)されてもよい。例えば、通信IF24を通じてプログラムやデータが活動量計2に提供されてよい。
通信IF24は、活動量計2に備えられた通信部の一例であり、例示的に、PC3やルータ6、無線アクセス網との通信を可能にする。センサ21又はプロセッサ22によって得られた活動量データが、通信IF24を介してPC3やサーバ7宛に送信されてよい。
(PC3の構成例)
次に、図3にPC3の構成例を示す。PC3は情報処理装置の一例であるから、サーバ7と構成は同等で構わない。そのため、図3において、サーバ7のエレメントについては括弧付きの符号71~76を付して示している。
次に、図3にPC3の構成例を示す。PC3は情報処理装置の一例であるから、サーバ7と構成は同等で構わない。そのため、図3において、サーバ7のエレメントについては括弧付きの符号71~76を付して示している。
以下では、重複的な説明を避けるために、PC3のエレメント31~36について説明する。図3において括弧付きの71~76で表したサーバ7のエレメントについては、特に断らない限り、それぞれPC3のエレメント31~36と同等の機能を有すると捉えてよい。
図3に示すように、PC3は、例示的に、プロセッサ31、メモリ32、記憶装置33、通信IF34、及び、ペリフェラルIF35を備えてよい。プロセッサ31、メモリ32、記憶装置33、通信IF34、及び、ペリフェラルIF35は、例示的に、バス36に接続されて、互いにプロセッサ31を介した通信が可能であってよい。
プロセッサ31は、演算処理能力を備えた演算処理装置の一例である。演算処理装置は、演算処理デバイス又は演算処理回路と称されてもよい。演算処理装置には、例示的に、CPU(central processing unit)、DSP(digital signal processor)、MPU(micro processing unit)、IC(integrated circuit)等が適用されてよい。なお、「プロセッサ」は、「処理部」、「制御部」あるいは「コンピュータ」と称してもよい。
プロセッサ31は、例示的に、PC3を生体リズム検出装置として機能又は処理させ、また、当該機能や処理に応じた動作を制御する。生体リズム検出装置3としての機能や処理、制御を実現するプログラムやデータがメモリ32や記憶装置33に記憶されてよい。
プロセッサ31が、メモリ32や記憶装置33に記憶されたプログラムやデータを読み取って動作することで、生体リズム検出装置3としての機能や処理、制御が具現される。
メモリ32は、記憶媒体の一例であり、RAMやフラッシュメモリ等であってよい。
記憶装置33は、種々のデータやプログラムを記憶してよい。記憶装置33には、ハードディスクドライブ(HDD)や、ソリッドステートドライブ(SSD)、フラッシュメモリ等が用いられてよい。
記憶装置33に記憶されるデータには、例示的に、通信IF34で受信された活動量データが含まれてよい。記憶装置33に記憶されたデータは、適宜に、データベース(DB)化されてよい。DB化されたデータは、「クラウドデータ」や「ビッグデータ」等と称されてよい。
なお、記憶装置33及びメモリ32は、PC3における「記憶部30」と総称してもよい。サーバ7における記憶装置33及びメモリ32についても、同様に、「記憶部70」と総称してよい。
記憶部30に記憶されるプログラムには、図4や図21、図22にて後述する処理を実行するプログラムが含まれてよい。当該プログラムは、便宜的に、「生体リズム検出プログラム」と称してよい。
プログラムを成すプログラムコードの全部又は一部は、記憶部に記憶されてもよいし、OSの一部として記述されてもよい。
プログラムやデータは、コンピュータ読取可能な記録媒体に記録された形態で提供されてよい。記録媒体の一例としては、フレキシブルディスク、CD-ROM,CD-R,CD-RW,MO,DVD、ブルーレイディスク、ポータブルハードディスク等が上げられる。また、USB(Universal Serial Bus)メモリ等の半導体メモリも記録媒体の一例である。
あるいは、プログラムやデータは、サーバ等からネットワーク5経由で活動量計2に提供(例えば、ダウンロード)されてもよい。例えば、通信IF34を通じてプログラムやデータがPC3に提供されてよい。
通信IF34は、PC3に備えられた通信部の一例であり、例示的に、活動量計2や携帯端末4、ルータ6、無線アクセス網等との通信を可能にする。
通信IF34は、受信処理に着目すれば、活動量計2や携帯端末4で得られた活動量データを受信する受信部(「取得部」と称してもよい。)の一例である。一方、送信処理に着目すれば、通信IF34は、例えば、活動量計2や携帯端末4で得られた活動量データをサーバ7宛に送信する送信部の一例である。
なお、サーバ7の通信IF74については、例示的に、ネットワーク5経由で、活動量計2やPC3、携帯端末4宛にデータを送信することが可能である。活動量計2やPC3、携帯端末4宛のデータには、例示的に、活動量データの処理結果(例えば、概日リズムの判定結果)が含まれてよい。
ペリフェラルIF35は、例示的に、PC3に周辺機器を接続するためのインタフェースである。周辺機器には、PC3に情報を入力するための入力機器や、PC3が生成した情報を出力する出力機器が含まれてよい。
入力機器には、キーボードやマウス、タッチパネル等が含まれてよい。出力機器には、図3に模式的に例示するように、ディスプレイ11やプリンタ12等が含まれてよい。
(動作例)
以下、上述した情報処理システム1の動作例について、図4~図20を参照して説明する。なお、以下の動作例の説明では、便宜的に、PC3が「生体リズム検出装置」として動作して活動量データに基づく概日リズムの検出処理を実施する例について説明する。また、生体リズム検出装置3が処理する活動量データは、活動量計2で測定された活動量データであると仮定する。
以下、上述した情報処理システム1の動作例について、図4~図20を参照して説明する。なお、以下の動作例の説明では、便宜的に、PC3が「生体リズム検出装置」として動作して活動量データに基づく概日リズムの検出処理を実施する例について説明する。また、生体リズム検出装置3が処理する活動量データは、活動量計2で測定された活動量データであると仮定する。
ただし、以下に説明する動作例の全部又は一部は、「生体リズム検出装置」として動作するサーバ7(例えば、プロセッサ71)での動作例に読み替えてよい。また、以下に説明する動作例において、「活動量計2」は「携帯端末4」に読み替えてよい。
図4は、生体リズム検出装置3の動作例を示すフローチャートである。図4に例示するフローチャートは、例示的に、生体リズム検出装置3のプロセッサ31によって実行されてよい。
図4に例示するように、生体リズム検出装置3は、活動量計2で測定されたセンサデータを受信する(処理P11)。
センサデータは、活動量データでもよいし、活動量データを算出可能なデータであってもよい。後者の活動量データを算出可能なデータであれば、生体リズム検出装置3は、当該データを基に活動量データを算出してよい(処理P12)。
図5に、活動量データの一例を示す。図5には、非限定的な一例として、活動量センサ21(又は41)として慣性センサが用いた場合の、被験者の1日(=24時間)の活動量の変化が示されている。
図5の横軸は時間(例示的に、サンプリングタイミング)を表し、縦軸は活動量のパワーを表す。図5の横軸には、非限定的な一例として、活動量データが24時間に720回サンプリングされて720個のサンプリングデータ(「時系列データ」と称してもよい。)が得られていることを示している。別言すると、活動量データのサンプリングレートは720Hzである。
生体リズム検出装置3は、図5に例示するような活動量データから被験者の概日リズム(別言すると、約24時間~25時間の周期性)を検出する。ここで、図5に例示する時系列の活動量データに対して、例えば14区間の移動平均をとることで、24時間の活動量データを平滑化してみると、例えば図6に示すように、一定の周期性が現われる。
しかし、当該周期性は、元の活動量データ(「原データ」と称してよい。)の大小に依存している、別言すると、被験者の活動に伴う動きの大小に依存しているため、概日リズムの周期とは大きく異なる。したがって、活動量データを移動平均によって平滑化しても、概日リズムを検出することは難しい。
そこで、本実施形態の生体リズム検出装置3(例えばプロセッサ31)は、例示的に、時系列の活動量データを時間波形として捉えて周波数解析し(処理P13)、周波数解析結果において特徴点を検出、抽出する(処理P14)。
周波数解析には、高速フーリエ変換(FFT)や離散フーリエ変換(DFT)を適用してよい。「特徴点」は、概日リズムの周期性を示す特徴的な周波数である。例えば、「特徴点」は、周波数解析結果において、パワースペクトル密度のピーク(「ピークパワー」と称してよい。)をもつ周波数成分であってよい。
図7~図13に、1週間(7日)分の活動量データをそれぞれ周波数解析した結果の一例を示す。図7~図13の横軸は周波数を表し、縦軸はパワーを表す。生体リズム検出装置3は、図7~図13に例示する周波数解析結果のそれぞれにおいて、ピークパワーをもつ周波数(矢印参照)を探索して「特徴点」として検出、抽出してよい。
図7~図13に例示するように、ピークパワーをもつ周波数(便宜的に「ピーク周波数」と称してよい。)は、1日24時間の近傍で1周期となる周波数である。例示的に、1日24時間を擬似的に1Hzと定義すると、生体リズム検出装置3は、周波数解析結果において、1Hzに最も近いピーク周波数を探索してよい。
1日24時間を擬似的に1Hzと定義する理由は、次のとおりである。例えば、周期をT[秒]で表すと、波の周波数f[Hz]は、f=1/T[Hz]で表わされる。24時間は、60秒×60×24=86400秒であるから、1日24時間で1波長とすると、f=11.57[μHz]となる。
ここで、活動量データを周波数解析する場合に、24時間の活動量データを1秒毎にサンプリングして86400個のサンプル数を得る、別言すると、サンプリングレートを86400Hzとすると、サンプル数に対して求めようとする周波数のバランスが悪い。そのため、サンプル数の割に計算量が大きくなる。
そこで、1日を擬似的に1秒と見立てて、1日1周期=1Hzと定義する。生体リズム検出装置3は、周波数解析結果において、1Hzに最も近いピーク周波数の周期を見つけることで、被験者の1日の生体的なリズム(「サイクル」と称してもよい。)である概日リズムを算出する(図4の処理P15)。
86400秒を120分の1の720秒に間引いても、あるいは、積算しても同様の結果が得られるため、サンプル数を86400個から720個、つまり、サンプリングレートを720Hzとして処理を行なうことで計算量を大幅に削減することが可能である。
なお、1日を擬似的に1Hzと定義するため、18時間(3/4日)や12時間(1/2日)といった24時間よりも短い期間の活動量データを周波数解析した結果においては、1Hzよりも低い周波数を探索周波数に設定してよい。
例えば、3/4日の活動量データの周波数解析結果では、0.75Hzに最も近いピーク周波数を探索すればよく、また、1/2日の活動量データの周波数解析結果では、0.5Hzに最も近いピーク周波数を探索すればよい。
別言すると、概日リズムの検出に用いる活動量データ又は周波数解析結果は、24時間に満たない期間のデータであっても構わない。
例えば、被験者の概日リズムは、被験者が日光を浴びることでリセットされ得るから、被験者が朝に起床してから数時間の活動量データは概日リズムの特徴的な周期性を示さない場合がある。
そこで、1日24時間を例えば6時間で4分割した場合の、起床から6時間~12時間(1/4日~1/2日)程度に相当する活動量データ又は周波数解析結果は、概日リズムの算出に用いる候補から除外してよい。これにより、概日リズムの算出処理量を削減でき、また、概日リズムの算出精度が低下することを抑制できる。
図14に、図7~図13に例示した7日分の活動量データから求められた、被験者の1日毎の生体リズム(周波数f)の一例を示す。
周波数fに対する1時間(hour)単位のリズムCir(図14の「算出時間」)は、Cir=24/fで表わすことができる。したがって、1日24時間(hour)に対するリズムCirの時間差は、「24-Cir」で求めることができる。
よって、図14に例示したデータから、被験者個人の生体リズムが1日24時間からどの程度ずれているかを検出、判定できる。
例えば、図14において、1日目、4日目、及び、7日目は、周波数fが1Hzよりも高いため、24時間に対するリズムの時間差は「負」の値になる。
したがって、被験者の概日リズムは、基準となる24時間よりも短くなっている(短縮)と判定できる。概日リズムが24時間よりも短くなると、例えば、早朝覚醒の原因になり得る。
一方、図14において、2日目、3日目、5日目、及び、6日目は、周波数fが1Hzよりも低いため、24時間に対するリズムの時間差が「正」の値になる。
したがって、被験者の概日リズムは、基準となる24時間よりも長くなっている(延伸)と判定できる。概日リズムが24時間よりも長くなると、例えば、寝起きが辛かったり夜に眠れないといった症状の原因になり得る。
図15に、被験者の2日分のリズムCirの時間波形の一例を示す。図15において、実線で示す波形が、被験者の概日リズムが24時間に近い正常な波形を表している。これに対し、一点鎖線で示す波形は、被験者の概日リズムが24時間よりも短い場合の波形を表し、点線で示す波形は、被験者の概日リズムが24時間よりも長い場合の波形を表わしている。
概日リズムは、1日約24~25時間の周期でリズムを刻んでおり、概日リズムが正常であれば、2日間で2波長となる。概日リズムが長くなると2波長未満となるため、体内リズムが遅くなり、既述のように、寝起きが辛かったり、夜に眠れない、といった症状の原因になり得る。逆に、概日リズムが短くなると、2日間で2波長を超過するため、体内リズムが早まり、既述のように、早朝覚醒等の原因になり得る。
なお、図14に例示した、「日」、「周波数」、「算出時間」、及び、「24時間に対する時間差」の各項目についてのデータ全部が、外部機器(例えば、ディスプレイ11やプリンタ12)に出力されてよい。
あるいは、「日」のデータと、「周波数」、「算出時間」、及び、「24時間に対する時間差」のいずれか1つ又は2つの項目についてのデータと、が、外部機器に出力されてもよい。
なお、「算出時間」のデータは、被験者の生体リズムの1周期に相当する時間を示すデータである。被験者の生体リズムの1周期に相当する時間は、開始時刻及び終了時刻の一方又は双方よって表わされてもよい。
追加的あるいは代替的に、図15に例示した時間波形のデータが、外部機器に出力されてもよい。
以上のようにして、被験者の概日リズムの基準からのずれを検出、判定することができる。したがって、その判定結果を、例えば、概日リズムが正常なリズムに近づくように(例えば、なるべく1Hzに近づくように)、被験者に、生活習慣や睡眠等に関するコメントやアドバイスを提供するために役立てることができる。
なお、図4に例示するように、生体リズム検出装置3は、概日リズムの算出処理(P15)と並行して、処理P14において検出したピーク周波数に基づいて、周波数解析前の活動量データ(原データ)の時間波形をフィルタリングしてよい(処理P16)。
フィルタリングには、例示的に、バンドパスフィルタ(BPF)が用いられてよい。BPFは、非限定的な一例として、処理P14において検出したピーク周波数を透過中心周波数(fc)に有し、かつ、透過中心周波数fcに対して±0.25Hz程度の透過帯域幅を有するフィルタであってよい。透過中心周波数fcは、可変であってよい。
このような透過帯域特性を有するBPFによって、活動量データの時間波形をフィルタリングすると、被験者の概日リズムの時間波形を検出することができる。例えば図16(A)に例示するような、1日24時間の活動量データの時間波形を、上述した特性を有するBPFにてフィルタリングすると、図16(B)に例示するような時間波形が得られる。
図16(B)の時間波形は、図16(A)の活動量データの時間波形に含まれている、被験者の1日の生体リズム、つまりは概日リズムに由来する周波数成分の時間変化を表している。
生体リズム検出装置3は、活動量データをBPF処理して得られた図16(B)のような時間波形を被験者の概日リズムとして、視覚的に表示してよい(図4の処理P17)。
視覚的な表示は、例示的に、ディスプレイ11(図3参照)への表示であってもよいし、プリンタ12(図3参照)による印刷であってもよい。被験者の概日リズムを視覚的に表示することで、被験者に自身の概日リズムを視認させ易くなる。
また、生体リズム検出装置3は、図16(B)のような概日リズムの時間波形と共に、図16(A)のような原データである活動量データの時間波形を視覚的に表示してもよい。その際、概日リズムの時間波形と原データの時間波形とは、個別的に表示されてもよいし、例えば図17に示すように、重畳して表示されてもよい。
重畳表示によれば、被験者に、当該被験者の1日の活動量の時間変化に対する概日リズムを認識させ易くなる。例えば、概日リズムに乱れが生じている場合に、1日の活動において乱れの原因となるような活動時間を視覚的に認識させ易くなる。
したがって、被験者に、生活習慣や睡眠の改善等に関して、被験者の実生活に応じた、より的確で具体的なコメントやアドバイスを提供し易くなる。
なお、生体リズム検出装置3は、例えば図18~図20に例示するように、被験者の概日リズムと基準リズムとのずれ(別言すると、差分)を視認させ易い表示態様で、概日リズムに関するデータの視覚的な表示を行なってもよい。
図18は、図14に例示した4列の項目のうち、「日」及び「24時間に対する時間差」の項目についてのデータを抜き出して表示する態様の一例を示す図である。ただし、図18において、「24時間に対する時間差」のデータ(数値)の一部は、四捨五入によって「丸め」られている。数値の「丸め」によって見易さを向上できるが、「丸め」は必須でなくても構わない。
図19は、図18に例示した2つの項目を横軸及び縦軸にとって7日分のデータをグラフ化して表示する態様の一例を示す図である。図20は、図18に例示した2つの項目をレーダーチャートの各軸にとって7日分のデータをグラフ化して表示する態様の一例を示す図である。
図20に例示するレーダーチャートには、概日リズムの理想的な基準リズム(理想値)が被験者のデータ共に表示されてよい。これにより、被験者の概日リズムと基準リズムとのずれを被験者に視認させ易くなる。
なお、図18~図20に例示した表示態様は、適宜に組み合わされてよい。例えば、生体リズム検出装置3は、図18~図20に例示した表示態様のいずれか2以上の組み合せによって視覚的な表示を行なってよい。
また、概日リズムに関するデータの表示態様は、図18~図20に例示した態様に限られない。被験者に、本人の概日リズムや基準リズムとのずれを視認させ易い態様であれば、どのような表示態様を採用してもよい。強調表示や弱調表示が併用されてもよい。
上述した各種の表示態様による表示先は、PC3やサーバ7のディスプレイ11に限らず、活動量計2のディスプレイでもよいし、携帯端末4のディスプレイであってもよい。
例えば、PC3やサーバ7は、概日リズムに関するデータを表示させるための信号を活動量計2や携帯端末4宛に送信してよい。当該信号には、概日リズムに関するデータに限らず、上述した各種の表示態様を制御するデータが含まれてもよい。
(変形例)
上述した実施形態では、図4に例示したように、特徴点の抽出処理(P14)後に、概日リズムの算出処理(P15)と、BPF処理(P16)及び概日リズムの表示処理(P17)とを並行して実施した。しかし、処理P15と、処理P16及びP17とは、図21及び図22に例示するように、単独で実施されてもよい。
上述した実施形態では、図4に例示したように、特徴点の抽出処理(P14)後に、概日リズムの算出処理(P15)と、BPF処理(P16)及び概日リズムの表示処理(P17)とを並行して実施した。しかし、処理P15と、処理P16及びP17とは、図21及び図22に例示するように、単独で実施されてもよい。
例えば、概日リズムの表示処理が不要であれば、生体リズム検出装置3は、図21に例示するように、既述の処理P11~P15を実施すればよい。概日リズムの算出処理が不要であれば、生体リズム検出装置3は、図22に例示すように、既述の処理P11~P14並びに処理P16及びP17を実施すればよい。
なお、処理P11~P17は、全部がPC3やサーバ7において実行されなくてもよい。活動量計2のプロセッサ22や携帯端末4のプロセッサ42の処理能力に応じて、一部が活動量計2のプロセッサ22や携帯端末4のプロセッサ42にて実行されてもよい。
以上のように、上述した実施形態及び変形例によれば、被験者の活動量データの時間波形を周波数解析した結果から特徴点に相当するピーク周波数を検出することで、約24時間の期間で1周期を示す、被験者の生体リズムに由来する周波数成分を検出できる。
別言すると、被験者の活動量データの時間波形から、被験者の身体的な活動に伴う動きに影響され易い成分を除去又は抑制して、被験者の生体リズムに由来する周波数成分を検出できる。
したがって、被験者の血液や直腸温度を取得しなくても、被験者の概日リズムを簡易に検出することができる。よって、被験者の概日リズムと基準リズムとのずれを検出でき、ずれを改善するようなコメントやアドバイスを被験者に提供することができ、被験者の健康管理等に役立てることができる。
例えば、概日リズムのずれが小さくなるように、好ましい起床時間や入眠時間等について被験者にアドバイスすることが可能となる。また、概日リズムをコントロールするには、光が有効とされているから、光を浴びる時間や浴びない時間等をコントロールするようなアドバイスを被験者に行なうことも可能となる。
また、活動量計2や携帯端末4は、活動量データの測定のために被験者に拘束される態様で取り付けられなくてもよい。例えば、活動量センサ21(又は41)に、慣性センサや電波センサ等の非接触で被験者の活動量を測定可能なセンサを適用することで、被験者は、活動量計2や携帯端末4を、腰に付けたり、着衣のポケット等に収容しておけば、活動量の測定が可能である。
また、活動量センサ21(又は41)に、電波センサを適用した場合には、活動量計2や携帯端末4は、被験者の身体から離れた場所に置かれていても被験者に電波が到達可能な範囲であれば活動量の測定が可能である。
したがって、活動量計2や携帯端末4は、必ずしも被験者に携行されなくても構わない。例えば、活動量計2や携帯端末4が、被験者の位置する室内空間に置かれていても構わない。
いずれにしても、例えば、センサを被験者に拘束する形態で装着(例えば、皮膚に直接センサを取り付ける等)する必要がないから、活動量測定のために被験者に身体的及び精神的な負担をかけなくて済む。
よって、例えば24時間以上の長時間にわたって活動量を測定する場合であっても、被験者の日常生活を測定のために阻害せずに、被験者の概日リズムを簡易に検出できる。別言すると、概日リズムの測定に関してユーザビリティの向上を図ることができる。
なお、被験者の活動量は、複数の活動量センサ21を時間的に組み合わせて測定されても構わない。複数の活動量センサ21は、異なる種類のセンサの組み合わせ、例えば、電波センサと慣性センサとの組み合わせであってもよい。
例えば、被験者が家の中に居る間は、室内に設置された電波センサによって被験者の活動量を測定し、被験者が家から外出している間は、被験者に携行される活動量計2の慣性センサによって活動量を測定することもできる。
非限定的な一例として、9時から18時までは被験者に携行される活動量計2の慣性センサによって活動量が測定され、18時から翌朝9時までは室内に設置された電波センサによって活動量が測定されたとする。
この場合、生体リズム検出装置3は、9時から18時までの間に慣性センサによって測定された活動量データと、18時から翌朝9時までの間に室内に設置された電波センサによって測定された活動量データとを、時系列でつなぎ合わせて周波数解析してよい。
別言すると、図5や図16(A)に例示した活動量データは、複数の活動量センサ21によって得られた活動量データを時系列につなぎ合わせたデータに相当する、と捉えてもよい。
そして、生体リズム検出装置3は、例えば、1日を擬似的に1秒と見立て、1日1周期=1Hzとして、1Hzに近い被験者の生体リズムを求めることができる。なお、生体リズム検出装置3は、被験者に携行された活動量センサ21、及び、室内に設置された電波センサでそれぞれ活動量データが測定された有効時間から生体リズムに由来する周期を求めてもよい。
なお、電波センサの測定値から活動量データを求める手法には、例えば、前掲の特許文献8に記載された手法が適用されてよい。例えば、電波センサの出力信号である、ドップラー効果に応じたビート信号には、被験者の動きの大きさ及び速さに応じた振幅及び周波数の変化が現れる。
このように、電波センサの出力信号には、被験者の活動量と相関する情報が含まれているから、電波センサの測定値から被験者の活動量(「運動強度」と称してもよい。)を求めることができる。
例えば、被験者の動きの大きさ及び速さに応じた振幅及び周波数の変化が、時間領域において描く軌跡の長さを「伸展時波長」と定義する。別言すると、「伸展時波長」は、電波センサの測定値の時間波形を時間領域において直線に伸ばした線分の長さに相当する。したがって、「伸展時波長」は、通常の「波長」とは異なる概念である。
単位時間あたりの被験者の活動量が多いほど、単位時間あたりの「伸展時波長」は長くなり、逆に、単位時間あたりの被験者の活動量が少ないほど、単位時間あたりの「伸展時波長」は短くなる傾向にある。
したがって、生体リズム検出装置3は、電波センサの測定値を「伸展時波長」に変換することで、「伸展時波長」から被験者の活動量データを求めることができる。
「伸展時波長」は、例示的に、電波センサの測定値を、或る周期(「サンプリング周期」と称してよい。)で、逐次的に、記憶部30(又は70)に記憶してゆき、単位時間にわたって振幅値の変化量を加算することで算出できる。
あるいは、「伸展時波長」は、電波センサの測定値である時間波形における或る曲線A-Bの区間をn個の微小区間に分割し、各微小区間を線分で近似し、その長さの和を求める演算式によって算出されてもよい。
「伸展時波長」の概念は、電波センサの測定値に限らず、被験者の活動量を測定可能なセンサであれば、例えば、慣性センサの測定値や、心拍センサ、脈拍センサ等の他の種類のセンサの測定値に適用されてもよい。
(その他)
なお、上述した実施形態及び変形例では、活動量データの測定対象及び生体リズムの検出対象が「人」である例について説明したが、活動量データの測定対象及び生体リズムの検出対象は、「人」以外の動物に適用されてもよい。
なお、上述した実施形態及び変形例では、活動量データの測定対象及び生体リズムの検出対象が「人」である例について説明したが、活動量データの測定対象及び生体リズムの検出対象は、「人」以外の動物に適用されてもよい。
例えば、ペットや動物園における動物の活動量を測定して生体リズムを簡易に検出することで、ペット等の動物の健康管理に役立てることもできる。
1 情報処理システム
2 活動量計
3 パーソナルコンピュータ(PC)
4 携帯端末
5 ネットワーク
6 ルータ
7 情報処理装置(サーバ)
11 ディスプレイ
12 プリンタ
21,41 活動量センサ
22,31,42,71 プロセッサ
23,32,43,72 メモリ
24,34,44,74 通信インタフェース(IF)
25,36,45,76 バス
30,70 記憶部
33,73 記憶装置
35,75 ペリフェラルIF
2 活動量計
3 パーソナルコンピュータ(PC)
4 携帯端末
5 ネットワーク
6 ルータ
7 情報処理装置(サーバ)
11 ディスプレイ
12 プリンタ
21,41 活動量センサ
22,31,42,71 プロセッサ
23,32,43,72 メモリ
24,34,44,74 通信インタフェース(IF)
25,36,45,76 バス
30,70 記憶部
33,73 記憶装置
35,75 ペリフェラルIF
Claims (9)
- 被験者の活動量を測定する活動量計で測定された前記活動量を示す活動量データを取得する取得部と、
前記活動量データの時間波形を周波数解析した結果においてピークパワーを示す周波数を前記被験者の生体リズムに由来する周波数として検出する処理部と、
を備えた、生体リズムの検出装置。 - 前記処理部は、
24時間を1Hzと定義して、前記周波数解析した結果において1Hzに最も近い前記ピークパワーを探索する、請求項1に記載の生体リズムの検出装置。 - 前記処理部は、
前記生体リズムと、前記生体リズムの基準となる基準リズムと、の差分を示す情報を出力する、請求項2又は3に記載の生体リズムの検出装置。 - 前記処理部は、
前記ピークパワーを示す周波数を透過中心周波数に有するバンドパスフィルタによって前記活動量データの時間波形をフィルタリングする、請求項1~3のいずれか1項に記載の生体リズムの検出装置。 - 前記処理部は、
前記活動量データの時間波形と前記フィルタリングによって得られた時間波形とを出力する、請求項4に記載の生体リズムの検出装置。 - 前記処理部は、
前記各時間波形をディスプレイに出力し、前記ディスプレイにおいて前記各時間波形を重畳して表示させる、請求項5に記載の生体リズムの検出装置。 - 前記活動量計は、慣性センサを有する、請求項1~6のいずれか1項に記載の生体リズムの検出装置。
- 被験者の活動量を測定する活動量計で測定された前記活動量を示す活動量データを取得し、
前記活動量データの時間波形を周波数解析した結果においてピークパワーを示す周波数を前記被験者の生体リズムに由来する周波数として検出する、
生体リズムの検出方法。 - コンピュータに、
被験者の活動量を測定する活動量計で測定された前記活動量を示す活動量データを取得し、
前記活動量データの時間波形を周波数解析した結果においてピークパワーを示す周波数を前記被験者の生体リズムに由来する周波数として検出する、
処理を実行させる、生体リズムの検出プログラム。
Priority Applications (4)
| Application Number | Priority Date | Filing Date | Title |
|---|---|---|---|
| PCT/JP2016/069036 WO2018002995A1 (ja) | 2016-06-27 | 2016-06-27 | 生体リズムの検出装置、検出方法、及び、検出プログラム |
| JP2018524606A JP6597900B2 (ja) | 2016-06-27 | 2016-06-27 | 生体リズムの検出装置、検出方法、及び、検出プログラム |
| EP16907228.7A EP3476292A4 (en) | 2016-06-27 | 2016-06-27 | BIOLOGICAL RHYTHM DETECTION DEVICE, DETECTION METHOD, AND DETECTION PROGRAM |
| US16/209,240 US11191480B2 (en) | 2016-06-27 | 2018-12-04 | Device for biorhythm detection, method for biorhythm detection, and recording medium recording program for biorhythm detection |
Applications Claiming Priority (1)
| Application Number | Priority Date | Filing Date | Title |
|---|---|---|---|
| PCT/JP2016/069036 WO2018002995A1 (ja) | 2016-06-27 | 2016-06-27 | 生体リズムの検出装置、検出方法、及び、検出プログラム |
Related Child Applications (1)
| Application Number | Title | Priority Date | Filing Date |
|---|---|---|---|
| US16/209,240 Continuation US11191480B2 (en) | 2016-06-27 | 2018-12-04 | Device for biorhythm detection, method for biorhythm detection, and recording medium recording program for biorhythm detection |
Publications (1)
| Publication Number | Publication Date |
|---|---|
| WO2018002995A1 true WO2018002995A1 (ja) | 2018-01-04 |
Family
ID=60787087
Family Applications (1)
| Application Number | Title | Priority Date | Filing Date |
|---|---|---|---|
| PCT/JP2016/069036 WO2018002995A1 (ja) | 2016-06-27 | 2016-06-27 | 生体リズムの検出装置、検出方法、及び、検出プログラム |
Country Status (4)
| Country | Link |
|---|---|
| US (1) | US11191480B2 (ja) |
| EP (1) | EP3476292A4 (ja) |
| JP (1) | JP6597900B2 (ja) |
| WO (1) | WO2018002995A1 (ja) |
Cited By (2)
| Publication number | Priority date | Publication date | Assignee | Title |
|---|---|---|---|---|
| JP2020156608A (ja) * | 2019-03-25 | 2020-10-01 | オムロンヘルスケア株式会社 | 血圧関連情報表示装置、血圧関連情報表示方法、およびプログラム |
| AU2020201265A1 (en) * | 2020-02-21 | 2021-09-09 | Cda Research Group, Inc. | Methods of treatment using topical copper ion formulations |
Families Citing this family (1)
| Publication number | Priority date | Publication date | Assignee | Title |
|---|---|---|---|---|
| JPWO2018042512A1 (ja) * | 2016-08-30 | 2019-06-24 | 富士通株式会社 | 活動量処理装置、活動量処理方法、及び、活動量処理プログラム |
Citations (11)
| Publication number | Priority date | Publication date | Assignee | Title |
|---|---|---|---|---|
| JPH04367653A (ja) * | 1991-06-14 | 1992-12-18 | Matsushita Electric Works Ltd | 生体活性度モニターシステム |
| JPH06189914A (ja) | 1992-12-22 | 1994-07-12 | Matsushita Electric Works Ltd | 生体リズム曲線測定装置 |
| JPH06217946A (ja) | 1993-01-26 | 1994-08-09 | Matsushita Electric Works Ltd | 生体リズム曲線測定装置 |
| JPH09313492A (ja) | 1996-05-27 | 1997-12-09 | Kanebo Ltd | 生体リズムを用いたカウンセリングシステム |
| JP2000166877A (ja) * | 1998-12-09 | 2000-06-20 | Mitsubishi Chemicals Corp | 生体リズム検査装置及び生体リズム検査方法 |
| JP2004283523A (ja) * | 2003-03-19 | 2004-10-14 | Yoshihisa Ushiyama | 自律神経リズム解析装置 |
| JP2005198829A (ja) | 2004-01-15 | 2005-07-28 | Seiko Epson Corp | 生体情報解析装置、生体情報解析方法、制御プログラムおよび記録媒体 |
| WO2012011318A1 (ja) | 2010-07-23 | 2012-01-26 | ソニー株式会社 | 生体リズム推定装置、生体リズム推定方法およびプログラム |
| JP2012239799A (ja) | 2011-05-24 | 2012-12-10 | Sony Corp | 生体リズムの乱れ度算出装置、生体リズムの乱れ度算出システム、生体リズムの乱れ度算出方法、プログラム、及び記録媒体 |
| JP2014147595A (ja) * | 2013-02-01 | 2014-08-21 | Daikin Ind Ltd | 生体監視システム |
| JP2015228911A (ja) | 2014-06-03 | 2015-12-21 | 富士通株式会社 | 人活動量測定装置、人活動量測定方法及び人活動量測定プログラム |
Family Cites Families (8)
| Publication number | Priority date | Publication date | Assignee | Title |
|---|---|---|---|---|
| US4883353A (en) * | 1988-02-11 | 1989-11-28 | Puritan-Bennett Corporation | Pulse oximeter |
| US7507207B2 (en) * | 2003-10-07 | 2009-03-24 | Denso Corporation | Portable biological information monitor apparatus and information management apparatus |
| WO2006056907A2 (en) * | 2004-11-23 | 2006-06-01 | Philips Intellectual Property & Standards Gmbh | Depression detection system |
| JP4421507B2 (ja) * | 2005-03-30 | 2010-02-24 | 株式会社東芝 | 眠気予測装置及びそのプログラム |
| WO2009073811A2 (en) * | 2007-12-04 | 2009-06-11 | Rensselaer Polytechnic Institute | System and method to quantify circadian entrainment disruption |
| WO2012158984A1 (en) * | 2011-05-17 | 2012-11-22 | Massachusetts Institute Of Technology | Methods and apparatus for assessment of atypical brain activity |
| EP2926148B1 (en) * | 2012-11-30 | 2019-07-31 | The Nielsen Company (US), LLC | Multiple meter detection and processing using motion data |
| KR20170096323A (ko) * | 2016-02-16 | 2017-08-24 | 삼성전자주식회사 | 사용자의 실제 생활 리듬과 서카디안 리듬 간의 정합도를 제공하는 방법 및 장치 |
-
2016
- 2016-06-27 EP EP16907228.7A patent/EP3476292A4/en not_active Withdrawn
- 2016-06-27 JP JP2018524606A patent/JP6597900B2/ja not_active Expired - Fee Related
- 2016-06-27 WO PCT/JP2016/069036 patent/WO2018002995A1/ja active Application Filing
-
2018
- 2018-12-04 US US16/209,240 patent/US11191480B2/en active Active
Patent Citations (11)
| Publication number | Priority date | Publication date | Assignee | Title |
|---|---|---|---|---|
| JPH04367653A (ja) * | 1991-06-14 | 1992-12-18 | Matsushita Electric Works Ltd | 生体活性度モニターシステム |
| JPH06189914A (ja) | 1992-12-22 | 1994-07-12 | Matsushita Electric Works Ltd | 生体リズム曲線測定装置 |
| JPH06217946A (ja) | 1993-01-26 | 1994-08-09 | Matsushita Electric Works Ltd | 生体リズム曲線測定装置 |
| JPH09313492A (ja) | 1996-05-27 | 1997-12-09 | Kanebo Ltd | 生体リズムを用いたカウンセリングシステム |
| JP2000166877A (ja) * | 1998-12-09 | 2000-06-20 | Mitsubishi Chemicals Corp | 生体リズム検査装置及び生体リズム検査方法 |
| JP2004283523A (ja) * | 2003-03-19 | 2004-10-14 | Yoshihisa Ushiyama | 自律神経リズム解析装置 |
| JP2005198829A (ja) | 2004-01-15 | 2005-07-28 | Seiko Epson Corp | 生体情報解析装置、生体情報解析方法、制御プログラムおよび記録媒体 |
| WO2012011318A1 (ja) | 2010-07-23 | 2012-01-26 | ソニー株式会社 | 生体リズム推定装置、生体リズム推定方法およびプログラム |
| JP2012239799A (ja) | 2011-05-24 | 2012-12-10 | Sony Corp | 生体リズムの乱れ度算出装置、生体リズムの乱れ度算出システム、生体リズムの乱れ度算出方法、プログラム、及び記録媒体 |
| JP2014147595A (ja) * | 2013-02-01 | 2014-08-21 | Daikin Ind Ltd | 生体監視システム |
| JP2015228911A (ja) | 2014-06-03 | 2015-12-21 | 富士通株式会社 | 人活動量測定装置、人活動量測定方法及び人活動量測定プログラム |
Non-Patent Citations (1)
| Title |
|---|
| See also references of EP3476292A4 * |
Cited By (5)
| Publication number | Priority date | Publication date | Assignee | Title |
|---|---|---|---|---|
| JP2020156608A (ja) * | 2019-03-25 | 2020-10-01 | オムロンヘルスケア株式会社 | 血圧関連情報表示装置、血圧関連情報表示方法、およびプログラム |
| WO2020195618A1 (ja) * | 2019-03-25 | 2020-10-01 | オムロンヘルスケア株式会社 | 血圧関連情報表示装置、血圧関連情報表示方法、およびプログラム |
| JP7253419B2 (ja) | 2019-03-25 | 2023-04-06 | オムロンヘルスケア株式会社 | 血圧関連情報表示装置、血圧関連情報表示方法、およびプログラム |
| AU2020201265A1 (en) * | 2020-02-21 | 2021-09-09 | Cda Research Group, Inc. | Methods of treatment using topical copper ion formulations |
| AU2020201265B2 (en) * | 2020-02-21 | 2021-09-16 | Cda Research Group, Inc. | Methods of treatment using topical copper ion formulations |
Also Published As
| Publication number | Publication date |
|---|---|
| JP6597900B2 (ja) | 2019-10-30 |
| EP3476292A1 (en) | 2019-05-01 |
| US20190110742A1 (en) | 2019-04-18 |
| JPWO2018002995A1 (ja) | 2019-02-21 |
| EP3476292A4 (en) | 2019-06-26 |
| US11191480B2 (en) | 2021-12-07 |
Similar Documents
| Publication | Publication Date | Title |
|---|---|---|
| US11672727B2 (en) | Data acquisition and analysis of human sexual response using a personal massaging device | |
| US20200100679A1 (en) | Sleep Monitoring and Stimulation | |
| WO2018042512A1 (ja) | 活動量処理装置、活動量処理方法、及び、活動量処理プログラム | |
| US11622696B2 (en) | Method for improving heart rate estimates by combining multiple measurement modalities | |
| EP3106084B1 (en) | Method and apparatus for evaluating physiological aging level | |
| US10251571B1 (en) | Method for improving accuracy of pulse rate estimation | |
| US9826940B1 (en) | Optical tracking of heart rate using PLL optimization | |
| US20160353996A1 (en) | Systems and methods for real-time signal processing and fitting | |
| CN109788920B (zh) | 信息处理设备、信息处理方法以及程序 | |
| US11534067B2 (en) | Learned monitoring device correction | |
| JP6597900B2 (ja) | 生体リズムの検出装置、検出方法、及び、検出プログラム | |
| Mahmud et al. | SensoRing: An integrated wearable system for continuous measurement of physiological biomarkers | |
| Chauhan et al. | Sensor networks based healthcare monitoring system | |
| WO2016185931A1 (ja) | 生体情報測定装置 | |
| KR101870630B1 (ko) | 생체/운동 신호 기반의 에너지 소모량 측정 방법 및 장치 | |
| JP2016202603A (ja) | 生体情報処理システム、プログラム、生体情報処理システムの制御方法 | |
| JP6524697B2 (ja) | 運動効果提示装置、運動効果提示システム及び運動効果情報生成方法 | |
| Conchell et al. | Design Development and Evaluation of a System to Obtain Electrodermal Activity | |
| KR101464066B1 (ko) | 생체 정보 측정 장치 및 생체 정보 측정 방법 | |
| Yang et al. | Lifetime tracing of cardiopulmonary sounds with low-power sound sensor stick connected to wireless mobile network | |
| US20240164687A1 (en) | System and Method for Blood Pressure Assessment | |
| US20240310298A1 (en) | Method of analyzing two analytes within a prescribed time period for medical purposes using an enhanced noninvasive rf analyte detection device |
Legal Events
| Date | Code | Title | Description |
|---|---|---|---|
| WWE | Wipo information: entry into national phase |
Ref document number: 2018524606 Country of ref document: JP |
|
| 121 | Ep: the epo has been informed by wipo that ep was designated in this application |
Ref document number: 16907228 Country of ref document: EP Kind code of ref document: A1 |
|
| NENP | Non-entry into the national phase |
Ref country code: DE |
|
| ENP | Entry into the national phase |
Ref document number: 2016907228 Country of ref document: EP Effective date: 20190128 |