WO2017170910A1 - 透過型色較正用チャートおよび較正用スライドガラス - Google Patents
透過型色較正用チャートおよび較正用スライドガラス Download PDFInfo
- Publication number
- WO2017170910A1 WO2017170910A1 PCT/JP2017/013358 JP2017013358W WO2017170910A1 WO 2017170910 A1 WO2017170910 A1 WO 2017170910A1 JP 2017013358 W JP2017013358 W JP 2017013358W WO 2017170910 A1 WO2017170910 A1 WO 2017170910A1
- Authority
- WO
- WIPO (PCT)
- Prior art keywords
- color
- color bar
- calibration
- transmission spectrum
- bar
- Prior art date
Links
- 239000011521 glass Substances 0.000 title claims description 123
- 238000000411 transmission spectrum Methods 0.000 claims abstract description 316
- 239000003086 colorant Substances 0.000 claims abstract description 139
- 239000000758 substrate Substances 0.000 claims abstract description 120
- 238000010586 diagram Methods 0.000 claims abstract description 101
- 125000006850 spacer group Chemical group 0.000 claims description 151
- 230000001681 protective effect Effects 0.000 claims description 114
- 239000000463 material Substances 0.000 claims description 108
- 230000005540 biological transmission Effects 0.000 claims description 78
- 238000002834 transmittance Methods 0.000 claims description 65
- 238000005259 measurement Methods 0.000 claims description 33
- 230000003287 optical effect Effects 0.000 claims description 26
- 238000007789 sealing Methods 0.000 claims description 24
- 238000003384 imaging method Methods 0.000 description 106
- 238000000034 method Methods 0.000 description 74
- 230000003595 spectral effect Effects 0.000 description 50
- 239000000853 adhesive Substances 0.000 description 32
- 230000001070 adhesive effect Effects 0.000 description 32
- 238000002156 mixing Methods 0.000 description 25
- 239000010410 layer Substances 0.000 description 22
- 230000000694 effects Effects 0.000 description 18
- 238000001228 spectrum Methods 0.000 description 17
- 238000000926 separation method Methods 0.000 description 16
- 230000008569 process Effects 0.000 description 14
- 239000000975 dye Substances 0.000 description 13
- 230000000295 complement effect Effects 0.000 description 11
- 238000004043 dyeing Methods 0.000 description 11
- 238000011156 evaluation Methods 0.000 description 10
- 239000007788 liquid Substances 0.000 description 10
- 229910052751 metal Inorganic materials 0.000 description 8
- 239000002184 metal Substances 0.000 description 8
- 239000004033 plastic Substances 0.000 description 7
- 229920003023 plastic Polymers 0.000 description 7
- 239000011347 resin Substances 0.000 description 7
- 229920005989 resin Polymers 0.000 description 7
- 238000012937 correction Methods 0.000 description 6
- 230000001575 pathological effect Effects 0.000 description 6
- 238000004080 punching Methods 0.000 description 6
- GGCZERPQGJTIQP-UHFFFAOYSA-N sodium;9,10-dioxoanthracene-2-sulfonic acid Chemical compound [Na+].C1=CC=C2C(=O)C3=CC(S(=O)(=O)O)=CC=C3C(=O)C2=C1 GGCZERPQGJTIQP-UHFFFAOYSA-N 0.000 description 6
- 238000005530 etching Methods 0.000 description 5
- 230000001747 exhibiting effect Effects 0.000 description 5
- 230000035699 permeability Effects 0.000 description 5
- 238000012545 processing Methods 0.000 description 5
- 230000008859 change Effects 0.000 description 4
- 238000013461 design Methods 0.000 description 4
- 239000000839 emulsion Substances 0.000 description 4
- 239000010408 film Substances 0.000 description 4
- 230000007170 pathology Effects 0.000 description 4
- 239000000049 pigment Substances 0.000 description 4
- IOLCXVTUBQKXJR-UHFFFAOYSA-M potassium bromide Chemical compound [K+].[Br-] IOLCXVTUBQKXJR-UHFFFAOYSA-M 0.000 description 4
- SQGYOTSLMSWVJD-UHFFFAOYSA-N silver(1+) nitrate Chemical compound [Ag+].[O-]N(=O)=O SQGYOTSLMSWVJD-UHFFFAOYSA-N 0.000 description 4
- 239000010935 stainless steel Substances 0.000 description 4
- 229910001220 stainless steel Inorganic materials 0.000 description 4
- 229910052720 vanadium Inorganic materials 0.000 description 4
- 108010010803 Gelatin Proteins 0.000 description 3
- CDBYLPFSWZWCQE-UHFFFAOYSA-L Sodium Carbonate Chemical compound [Na+].[Na+].[O-]C([O-])=O CDBYLPFSWZWCQE-UHFFFAOYSA-L 0.000 description 3
- 239000003795 chemical substances by application Substances 0.000 description 3
- 239000006059 cover glass Substances 0.000 description 3
- 238000009826 distribution Methods 0.000 description 3
- 229920000159 gelatin Polymers 0.000 description 3
- 239000008273 gelatin Substances 0.000 description 3
- 235000019322 gelatine Nutrition 0.000 description 3
- 235000011852 gelatine desserts Nutrition 0.000 description 3
- 238000004519 manufacturing process Methods 0.000 description 3
- 239000002904 solvent Substances 0.000 description 3
- 229910001030 Iron–nickel alloy Inorganic materials 0.000 description 2
- 239000000980 acid dye Substances 0.000 description 2
- 229910045601 alloy Inorganic materials 0.000 description 2
- 239000000956 alloy Substances 0.000 description 2
- 230000008901 benefit Effects 0.000 description 2
- 230000015572 biosynthetic process Effects 0.000 description 2
- 239000001045 blue dye Substances 0.000 description 2
- 230000007797 corrosion Effects 0.000 description 2
- 238000005260 corrosion Methods 0.000 description 2
- 238000011161 development Methods 0.000 description 2
- 239000000203 mixture Substances 0.000 description 2
- 238000000465 moulding Methods 0.000 description 2
- 238000010137 moulding (plastic) Methods 0.000 description 2
- 238000010827 pathological analysis Methods 0.000 description 2
- 230000002093 peripheral effect Effects 0.000 description 2
- 229910001961 silver nitrate Inorganic materials 0.000 description 2
- 238000007447 staining method Methods 0.000 description 2
- 238000012360 testing method Methods 0.000 description 2
- 229910052721 tungsten Inorganic materials 0.000 description 2
- VYZAMTAEIAYCRO-UHFFFAOYSA-N Chromium Chemical compound [Cr] VYZAMTAEIAYCRO-UHFFFAOYSA-N 0.000 description 1
- RYGMFSIKBFXOCR-UHFFFAOYSA-N Copper Chemical compound [Cu] RYGMFSIKBFXOCR-UHFFFAOYSA-N 0.000 description 1
- 229910000881 Cu alloy Inorganic materials 0.000 description 1
- VYPSYNLAJGMNEJ-UHFFFAOYSA-N Silicium dioxide Chemical compound O=[Si]=O VYPSYNLAJGMNEJ-UHFFFAOYSA-N 0.000 description 1
- 238000013459 approach Methods 0.000 description 1
- 239000012752 auxiliary agent Substances 0.000 description 1
- 230000033228 biological regulation Effects 0.000 description 1
- 229910052804 chromium Inorganic materials 0.000 description 1
- 239000011651 chromium Substances 0.000 description 1
- 239000011248 coating agent Substances 0.000 description 1
- 238000000576 coating method Methods 0.000 description 1
- 238000011109 contamination Methods 0.000 description 1
- 229910052802 copper Inorganic materials 0.000 description 1
- 239000010949 copper Substances 0.000 description 1
- 238000005520 cutting process Methods 0.000 description 1
- 230000007547 defect Effects 0.000 description 1
- 238000001035 drying Methods 0.000 description 1
- 239000000428 dust Substances 0.000 description 1
- 230000002349 favourable effect Effects 0.000 description 1
- 239000000945 filler Substances 0.000 description 1
- 238000011049 filling Methods 0.000 description 1
- PCHJSUWPFVWCPO-UHFFFAOYSA-N gold Chemical compound [Au] PCHJSUWPFVWCPO-UHFFFAOYSA-N 0.000 description 1
- 229910052737 gold Inorganic materials 0.000 description 1
- 239000010931 gold Substances 0.000 description 1
- 238000007490 hematoxylin and eosin (H&E) staining Methods 0.000 description 1
- 238000010030 laminating Methods 0.000 description 1
- 239000005304 optical glass Substances 0.000 description 1
- 238000000206 photolithography Methods 0.000 description 1
- 125000006239 protecting group Chemical group 0.000 description 1
- 230000009467 reduction Effects 0.000 description 1
- 238000011160 research Methods 0.000 description 1
- 230000035945 sensitivity Effects 0.000 description 1
- 239000002356 single layer Substances 0.000 description 1
- 238000004544 sputter deposition Methods 0.000 description 1
- 239000010409 thin film Substances 0.000 description 1
- 238000012546 transfer Methods 0.000 description 1
- 238000007740 vapor deposition Methods 0.000 description 1
- 239000011800 void material Substances 0.000 description 1
- XLYOFNOQVPJJNP-UHFFFAOYSA-N water Substances O XLYOFNOQVPJJNP-UHFFFAOYSA-N 0.000 description 1
- 239000001043 yellow dye Substances 0.000 description 1
Images


Classifications
-
- G—PHYSICS
- G01—MEASURING; TESTING
- G01J—MEASUREMENT OF INTENSITY, VELOCITY, SPECTRAL CONTENT, POLARISATION, PHASE OR PULSE CHARACTERISTICS OF INFRARED, VISIBLE OR ULTRAVIOLET LIGHT; COLORIMETRY; RADIATION PYROMETRY
- G01J3/00—Spectrometry; Spectrophotometry; Monochromators; Measuring colours
- G01J3/46—Measurement of colour; Colour measuring devices, e.g. colorimeters
- G01J3/52—Measurement of colour; Colour measuring devices, e.g. colorimeters using colour charts
- G01J3/524—Calibration of colorimeters
-
- H—ELECTRICITY
- H04—ELECTRIC COMMUNICATION TECHNIQUE
- H04N—PICTORIAL COMMUNICATION, e.g. TELEVISION
- H04N17/00—Diagnosis, testing or measuring for television systems or their details
- H04N17/002—Diagnosis, testing or measuring for television systems or their details for television cameras
-
- G—PHYSICS
- G01—MEASURING; TESTING
- G01J—MEASUREMENT OF INTENSITY, VELOCITY, SPECTRAL CONTENT, POLARISATION, PHASE OR PULSE CHARACTERISTICS OF INFRARED, VISIBLE OR ULTRAVIOLET LIGHT; COLORIMETRY; RADIATION PYROMETRY
- G01J3/00—Spectrometry; Spectrophotometry; Monochromators; Measuring colours
- G01J3/46—Measurement of colour; Colour measuring devices, e.g. colorimeters
- G01J3/52—Measurement of colour; Colour measuring devices, e.g. colorimeters using colour charts
-
- G—PHYSICS
- G01—MEASURING; TESTING
- G01J—MEASUREMENT OF INTENSITY, VELOCITY, SPECTRAL CONTENT, POLARISATION, PHASE OR PULSE CHARACTERISTICS OF INFRARED, VISIBLE OR ULTRAVIOLET LIGHT; COLORIMETRY; RADIATION PYROMETRY
- G01J3/00—Spectrometry; Spectrophotometry; Monochromators; Measuring colours
- G01J3/02—Details
- G01J3/0297—Constructional arrangements for removing other types of optical noise or for performing calibration
-
- G—PHYSICS
- G01—MEASURING; TESTING
- G01N—INVESTIGATING OR ANALYSING MATERIALS BY DETERMINING THEIR CHEMICAL OR PHYSICAL PROPERTIES
- G01N21/00—Investigating or analysing materials by the use of optical means, i.e. using sub-millimetre waves, infrared, visible or ultraviolet light
- G01N21/17—Systems in which incident light is modified in accordance with the properties of the material investigated
- G01N21/25—Colour; Spectral properties, i.e. comparison of effect of material on the light at two or more different wavelengths or wavelength bands
- G01N21/27—Colour; Spectral properties, i.e. comparison of effect of material on the light at two or more different wavelengths or wavelength bands using photo-electric detection ; circuits for computing concentration
- G01N21/274—Calibration, base line adjustment, drift correction
-
- G—PHYSICS
- G02—OPTICS
- G02B—OPTICAL ELEMENTS, SYSTEMS OR APPARATUS
- G02B21/00—Microscopes
- G02B21/34—Microscope slides, e.g. mounting specimens on microscope slides
-
- G—PHYSICS
- G02—OPTICS
- G02B—OPTICAL ELEMENTS, SYSTEMS OR APPARATUS
- G02B5/00—Optical elements other than lenses
- G02B5/20—Filters
-
- G—PHYSICS
- G02—OPTICS
- G02B—OPTICAL ELEMENTS, SYSTEMS OR APPARATUS
- G02B5/00—Optical elements other than lenses
- G02B5/20—Filters
- G02B5/208—Filters for use with infrared or ultraviolet radiation, e.g. for separating visible light from infrared and/or ultraviolet radiation
-
- G—PHYSICS
- G03—PHOTOGRAPHY; CINEMATOGRAPHY; ANALOGOUS TECHNIQUES USING WAVES OTHER THAN OPTICAL WAVES; ELECTROGRAPHY; HOLOGRAPHY
- G03B—APPARATUS OR ARRANGEMENTS FOR TAKING PHOTOGRAPHS OR FOR PROJECTING OR VIEWING THEM; APPARATUS OR ARRANGEMENTS EMPLOYING ANALOGOUS TECHNIQUES USING WAVES OTHER THAN OPTICAL WAVES; ACCESSORIES THEREFOR
- G03B43/00—Testing correct operation of photographic apparatus or parts thereof
-
- G—PHYSICS
- G09—EDUCATION; CRYPTOGRAPHY; DISPLAY; ADVERTISING; SEALS
- G09B—EDUCATIONAL OR DEMONSTRATION APPLIANCES; APPLIANCES FOR TEACHING, OR COMMUNICATING WITH, THE BLIND, DEAF OR MUTE; MODELS; PLANETARIA; GLOBES; MAPS; DIAGRAMS
- G09B19/00—Teaching not covered by other main groups of this subclass
- G09B19/0023—Colour matching, recognition, analysis, mixture or the like
Definitions
- the present invention relates to a transmission color calibration chart (hereinafter, may be abbreviated as a color chart) for imaging apparatuses, particularly pathological imaging apparatuses, and a calibration slide capable of suppressing the appearance of Newton rings. Related to glass.
- a transmission color calibration chart hereinafter, may be abbreviated as a color chart
- the imaging device uses, for example, a color chart disclosed in Patent Document 1 to compare the reproduction color on the imaging device with the reproduction color on the color chart. If there is a difference in the reproduction color, calibration is performed based on the color chart.
- the color chart used for color calibration is composed of color bars of any color.
- a color bar of three primary colors of red, green, and blue may be used, and the type of color bar may be abbreviated as a color gamut that can be reproduced by an imaging device (hereinafter simply referred to as “color gamut”). ) Can be selected as appropriate.
- the color gamut refers to a specific range in the visible region.
- the XY of the XYZ color system CIE1931-XYZ color system
- CIE International Lighting Commission
- It can be represented using a chromaticity diagram.
- the color gamut can be indicated by a triangle in which chromaticity coordinates that are the vertices of each color of R, G, and B are defined and connected with straight lines.
- the color gamut is conventionally defined by various color gamut standards, and examples thereof include sRGB standard and NTSC standard.
- the sRGB standard is an international standard established by the International Electrotechnical Commission (IEC), and the NTSC standard is an analog television standard color gamut standard created by the US National Television Standards Committee. Recently, new standards such as the Adobe RGB standard and the digital cinema standard projector (D-Cinema Ref.PJ) standard have been developed to cover a wider color gamut.
- the imaging device is designed to be compatible with these color gamut standards, and can reproduce a pointer color included in the color gamut of the imaging device when outputting an image. Pointer color refers to colorimetric data representing the color gamut of the actual surface color.
- the color chart used for color calibration has a color bar group composed of a plurality of color bars.
- a gray scale is used as an image captured by the imaging device.
- a method of uniformly adjusting the brightness of each color bar is known.
- the configuration of the color chart is complicated, for example.
- an imaging device usually has an IR cut filter in the camera.
- the IR cut filter has a different wavelength range to be cut depending on its type. For this reason, the color chart used for color calibration of the imaging device has a problem that the color tone differs depending on the type of IR cut filter provided in the camera, and as a result, accurate color calibration of the imaging device becomes difficult. Arise.
- the present invention has been made in view of the above problems, and by making the brightness of the color bar group uniform and suppressing the influence of the IR cut filter provided in the camera of the imaging device, the accuracy of the imaging device is improved. It is a main object of the present invention to provide a transmission color calibration chart capable of performing accurate color calibration.
- the transmission color calibration chart may be referred to as a color chart.
- the inventors of the present invention have conducted intensive research.
- the transmission spectrum of the color bars constituting the color bar group has, for example, a mountain waveform as shown in FIG.
- the inventors have found that the brightness of the color bar is higher than the brightness of other color bars.
- the transmission spectrum of the color bar is not a chevron waveform
- the wavelength range to be cut changes depending on the type of the IR cut filter, so the color tone of the color bar depends on the type of the IR cut filter. I got the knowledge that it would be affected.
- the inventors of the present invention can make the brightness of the color bar group uniform without using a gray scale by making the transmission spectrum of each color bar constituting the color bar group a mountain-shaped waveform.
- the present invention has provided a transmission color calibration chart that can suppress the influence on the color tone caused by the IR cut filter and can perform accurate color calibration of the imaging device.
- the present invention includes a transparent substrate and a color bar group formed on the transparent substrate, and the color bar group includes a plurality of color bars including at least a first color and a second color.
- the coordinate points of the first color are (0.351, 0.649), (0.547, 0.453), (0.380) on the xy chromaticity diagram. , 0.506), (0.433, 0.464), and the second color coordinate point is (0.125, 0%) On the xy chromaticity diagram. 489), (0.112, 0.229), (0.270, 0.407), and (0.224, 0.242).
- the spectrum and the transmission spectrum of the second color bar have separate peak tops A transmissive color calibration chart is provided.
- red, green, and blue may be referred to as “(three) primary colors”.
- each color may be represented by an abbreviation in parentheses.
- the chromaticity coordinates on the xy chromaticity diagram may be simply referred to as “color coordinates” or “coordinates”.
- the first color may be referred to as yellow (Ye)
- the second color may be referred to as cyan (Cy).
- the transmission spectrum of the first color bar and the transmission spectrum of the second color bar have the peak tops separated from each other, the transmission spectra of the first color bar and the second color bar are obtained. It can be a chevron waveform. Accordingly, it is possible to perform accurate color calibration of the imaging device by making the brightness of the color bar group uniform and suppressing the influence of the IR cut filter provided in the camera of the imaging device.
- the color bar group further includes the three color bars of red, green, and blue, and the transmission spectrum of the red color bar, the transmission spectrum of the green color bar, and the transmission spectrum of the blue color bar are respectively It is preferable to have a separated peak top.
- the transmission spectrum of the five color bars excluding white can be a mountain-shaped waveform. This makes it possible to perform accurate color calibration of the imaging device by making the brightness of the color bar group more uniform and further suppressing the influence of the IR cut filter provided in the camera of the imaging device. Because.
- the chromaticity coordinates on the xy chromaticity diagram of the color bar of at least five colors of red, green, blue, the first color, and the second color are included in a pentagon.
- the pointer color coverage is preferably 74.4% or more.
- the color gamut defined by the coordinates of the five colors sufficiently includes the pointer color, so that the colors in the visible light region can be sufficiently covered. Thereby, the imaging device calibrated using the color chart of the present invention can reproduce the existing object color with high accuracy and sufficient.
- the present invention has a transparent substrate and a color bar group formed on the transparent substrate, and the color bar group includes at least one of red, green, blue, first color, second color, and white.
- the color bar group includes at least one of red, green, blue, first color, second color, and white.
- Six color bars are arranged in a pattern in random order, and the coordinate points of the first color are (0.351, 0.649), (0.547, 0.00) on the xy chromaticity diagram. 453), (0.380, 0.506), (0.433, 0.464), and the second color coordinate point is on the xy chromaticity diagram.
- Red color bar transmission spectrum peak wavelength is in the range of 600nm-680nm
- green color bar transmission spectrum In the range of 495 nm to 570 nm
- the peak wavelength of the transmission spectrum of the blue color bar is in the range of 430 nm to 490 nm
- the peak wavelength of the transmission spectrum of the first color bar is in the range of 540 nm to 595 nm
- the second color Provided is a transmission color calibration chart characterized in that a peak wavelength of a transmission spectrum of a color bar is in a range of 470 nm to 515 nm.
- the present invention includes a transparent substrate and a color bar group formed on the transparent substrate, and the color bar group includes red (R), green (G), blue (B), yellow (Ye), cyan (Cy), and white (W) at least six color bars are arranged in a random pattern, and the peak wavelength of the transmission spectrum of the R color bar is in the range of 600 nm to 680 nm.
- the peak wavelength of the G color bar transmission spectrum is in the range of 495 nm to 570 nm
- the peak wavelength of the transmission spectrum of the B color bar is in the range of 430 nm to 490 nm
- the peak wavelength of the transmission spectrum of the Ye color bar is in the range of 540 nm to 595 nm.
- a transmission color calibration chart characterized in that the peak wavelength of the transmission spectrum of the Cy color bar is in the range of 470 nm to 515 nm. Subjected to.
- the five color bars excluding white have the peak wavelength of the transmission spectrum at a predetermined position, so that the minimum six colors necessary to include the desired pointer color in the xy chromaticity diagram.
- the colors in the visible light region can be covered, and the colors in the visible light region can be reproduced uniformly. Thereby, the color calibration of the imaging device can be accurately performed using the color chart of the present invention.
- the color bar group further includes two color bars of violet (V) and near infrared (NIR), and the transmission spectrum of the V color bar has a wavelength of 415 nm as a reference wavelength, and the reference wavelength.
- the wavelength at which the relative transmittance is 50% when the transmittance at 100% is in the range of 435 nm to 465 nm
- the transmission spectrum of the NIR color bar has a wavelength of 730 nm as a reference wavelength
- the wavelength at which the relative transmittance is 50% when the transmittance is 100% is preferably in the range of 630 nm to 730 nm.
- the color chart of the present invention can sufficiently cover colors in the visible light region by further including violet and near-infrared two color bars showing a predetermined transmission spectrum. Color can be reproduced uniformly. This is because the accuracy of color calibration of the imaging device using the color chart of the present invention can be increased.
- the color bar group preferably further includes an orange (O) color bar
- the peak wavelength of the transmission spectrum of the O color bar is preferably in the range of 575 nm to 620 nm.
- the color chart of the present invention further includes an orange color bar showing a predetermined transmission spectrum, so that an intermediate color between yellow and red having a wide peak wavelength interval can be compensated, and colors in the visible light region can be balanced. This is because the color calibration can be performed in more detail and with high accuracy because it can be sufficiently covered.
- the color bars of at least five of R, G, B, the first color, and the second color are included in a pentagon that connects the chromaticity coordinates on the xy chromaticity diagram with a straight line.
- the pointer color coverage is preferably 90.3% or more.
- the color gamut defined by the coordinates of the five colors sufficiently includes the pointer color, so that the colors in the visible light region can be sufficiently covered. Thereby, the imaging device calibrated using the color chart of the present invention can reproduce the existing object color with high accuracy and sufficient.
- the color bar group preferably further includes a magenta (Mg) color bar.
- Mg magenta
- White is obtained by mixing red and cyan, or blue and yellow, which are symmetrical and in position (complementary color relationship) with respect to the W coordinate on the xy chromaticity diagram.
- Mg magenta
- the color chart of the present invention can perform white calibration more accurately by adjusting the same white according to three criteria using complementary colors.
- the chromaticity coordinates on the xy chromaticity diagram of the Mg color bar are the chromaticity coordinates on the xy chromaticity diagram of the G color bar and the white coordinate of D65 (hereinafter, W (D65) coordinate). It is preferable that it exists on the extension line of the line which ties.
- W (D65) coordinate D65
- the chromaticity coordinates on the xy chromaticity diagram of the G color bar are the chromaticity coordinates on the xy chromaticity diagram of the G color bar and the white coordinate of D65 (hereinafter, W (D65) coordinate). It is preferable that it exists on the extension line of the line which ties.
- red and cyan, blue and yellow, and green and magenta which are complementary colors, respectively. It is possible to reproduce white that becomes D65 by mixing these combinations at an appropriate ratio.
- the color chart of the present invention can perform white calibration and white balance adjustment more accurately.
- the peak wavelength of the transmission spectrum of the R color bar is in the range of 620 nm to 680 nm
- the half width is 100 nm or less
- the peak wavelength of the transmission spectrum of the G color bar is in the range of 510 m to 540 nm.
- the full width at half maximum is preferably 80 nm or less
- the peak wavelength of the transmission spectrum of the B color bar is within the range of 450 nm to 472 nm
- the full width at half maximum is preferably 80 nm or less.
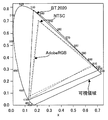
- a color gamut defined by a triangle formed by connecting the chromaticity coordinates of the three primary colors with a straight line on the xy chromaticity diagram is represented by BT.
- the color gamut defined by the coordinates of the three primary colors in the 2020 standard can be approached. Therefore, the color chart of the present invention is BT. This is because it is possible to cope with color calibration of an imaging device to which the 2020 standard is applied. Further, since the waveform of the transmission spectrum can have various waveform shapes for each color coordinate, by setting the half-value width together with the position of the peak wavelength of the transmission spectrum for each color, This is because the color chart can ensure the color reproducibility by the transmission spectrum.
- the chromaticity coordinate on the xy chromaticity diagram of the second color bar is a line connecting the chromaticity coordinate on the xy chromaticity diagram of the R color bar and the W (D65) coordinate.
- the chromaticity coordinates on the xy chromaticity diagram of the first color bar located on the outer periphery of the color gamut prescribed by the 2020 standard or outside the color gamut are on the xy chromaticity diagram of the B color bar.
- the extension line of the line connecting the chromaticity coordinates at W and the W (D65) coordinates, and BT are on the extension line of the line connecting the chromaticity coordinates at W and the W (D65) coordinates.
- the position of the second color coordinate is an extension of the line connecting the W (D65) coordinate and the R coordinate
- the position of the first color coordinate is the line connecting the W (D65) coordinate and the B coordinate.
- the positions of the second color coordinates and the first color coordinates are set to BT. This is because, by being positioned on the outer periphery of the color gamut defined by the 2020 standard or on the outer side of the color gamut, the color gamut capable of color reproduction can be expanded using the color chart of the present invention.
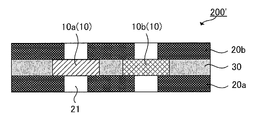
- a calibration pattern having a plurality of calibration pattern chips, a first spacer arranged around the calibration pattern, and the calibration pattern and the first spacer are opposed to each other. And at least one of the pair of protective substrates having at least a transmission part in a region overlapping the calibration pattern in plan view, the first spacer, and the pair of protective substrates. And a second spacer disposed so as to overlap a part of the calibration pattern chip in plan view between the material and the first spacer, and the second spacer includes the calibration pattern.
- a calibration glass slide having at least an opening in a region overlapping in plan view is provided.
- the second spacer since the second spacer has at least an opening in a region overlapping the calibration pattern in plan view, the calibration pattern and at least one of the protective substrates on which the second spacer is disposed Since a gap corresponding to the thickness of the second spacer can be provided between the transmissive portions, a calibration slide glass that can suppress the appearance of Newton rings can be obtained.
- a sealing portion disposed along the outer periphery of the protective base material between the pair of protective base materials. This is because the side surfaces of the first spacer and the second spacer can be prevented from being exposed, so that the mechanical strength can be improved.
- a groove on the surface of the second spacer it is preferable to have a groove on the surface of the second spacer. This is because an increase in thickness due to the adhesive disposed on the surface of the second spacer can be suppressed, and when a liquid adhesive is used, it can be used as a relief groove.
- an origin mark is provided on the surface of one of the pair of protective substrates. This is because the position information and the like of the calibration pattern can be recognized based on the origin mark, so that the calibration slide glass corresponding to the autochanger function can be obtained.
- the transmission part of one of the protection base materials among the pair of protection base materials is disposed in a region of the transmission part of the other protection base material in a plan view. This is because the outline of the calibration pattern chip when the calibration glass slide is observed from a predetermined surface can be clarified, and a high-quality calibration glass slide can be obtained.
- the calibration pattern chips that are the same measurement target among the plurality of calibration pattern chips have a uniform optical path length in the thickness direction of the calibration pattern chip. Since the optical path length in the thickness direction of all the calibration pattern chips that are the same measurement target is uniform, the observation device with the imaging device using the calibration slide glass equipped with the calibration pattern chip is more accurate. It is possible to perform a high measurement.
- the transmission color calibration chart according to the present invention makes the brightness of the color bar group uniform and suppresses the influence on the color tone caused by the IR cut filter provided in the camera of the imaging device, thereby preventing the accurate color of the imaging device. There exists an effect that calibration can be performed.
- the color chart of the first embodiment includes a transparent substrate and a color bar group formed on the transparent substrate, and the color bar group includes a plurality of color bars including at least a first color and a second color.
- the coordinate points of the first color are (0.351, 0.649), (0.547, 0.453), (0%) On the xy chromaticity diagram. 380, 0.506) and (0.433, 0.464), and the second color coordinate point is (0.125, 0) on the xy chromaticity diagram. .489), (0.112, 0.229), (0.270, 0.407), and (0.224, 0.242).
- the transmission spectrum and the transmission spectrum of the second color bar have separate peak tops. It is characterized by that.
- FIG. 1 is a schematic plan view showing an example of the color chart of this aspect.
- FIG. 2 is an image graph showing an example of the spectral transmission spectrum shown by the color chart of this embodiment. 1 and 2 can be the same as the contents described in the section “II. Second Embodiment” to be described later, the description is omitted here.
- a method using a gray scale is known as a method for uniformly adjusting the brightness of each color bar.
- the configuration of the color chart is complicated, for example.
- the imaging device usually has an IR cut filter in the camera.
- the IR cut filter has a different wavelength range to be cut depending on its type.
- the color chart used for color calibration of the imaging device has a problem that the color tone differs depending on the type of IR cut filter provided in the camera, and as a result, accurate color calibration of the imaging device becomes difficult. Arise.
- the inventors of the present aspect have determined that the luminance of the color bar is not a mountain-shaped waveform as shown in FIG. 4C, which will be described later, for example.
- luminance of other color bars was acquired.
- the transmission spectrum of the color bar is not a chevron waveform, the wavelength range to be cut changes depending on the type of the IR cut filter, so the color tone of the color bar depends on the type of the IR cut filter. I got the knowledge that it would be affected.
- This aspect has been made on the basis of such knowledge, and is characterized in that the transmission spectrum of the first color bar and the transmission spectrum of the second color bar each have a separated peak top.
- the brightness of the color bar group can be made uniform, and the influence on the color tone by the IR cut filter provided in the camera of the imaging device can be suppressed. Therefore, in this aspect, accurate color calibration of the imaging device can be performed.
- the colors in the visible light region can be covered, The color in the visible light region can be reproduced uniformly. Thereby, the color calibration of an imaging device can be accurately performed using the color chart of this aspect.
- “having a separated peak top” is a so-called mountain waveform in which the external shape of the transmission spectrum is a mountain shape, for example, a shape as shown in FIG. Point to.
- “the external shape is a mountain shape” means that it is a mountain shape when the entire transmission spectrum in at least the visible region is observed.
- the transmittance (%) is within a range of several percent. Waveforms created when moving up and down do not have a chevron shape.
- the transmission spectrum has one convex portion that is a mountain shape of an external shape, as in the transmission spectrum of each color bar shown in FIG.
- the outer shape is a mountain shape at least in the visible region. It is preferable to have one convex part. Therefore, “the transmission spectrum of each color bar has a separate peak top” means, for example, that each color transmission spectrum has an independent chevron waveform as shown in FIG. To do.
- the color bar group in this embodiment is formed on a transparent substrate.
- the color bar group includes a plurality of color bars including at least a first color and a second color arranged in a pattern in random order.
- the color bar group in this aspect is preferably configured by arranging, for example, at least six color bars of R, G, B, Ye, Cy, and W in random order.
- “Five colors excluding (excluding) W” means five colors of R, G, B, Ye, and Cy.
- 5-color bar means the above-mentioned 5-color bar unless otherwise specified.
- the “six-color bar” means a total of six color bars of the above-mentioned five colors and W unless otherwise specified. As will be described later, the same applies to the case of including color bars of other colors.
- Transmission spectrum The transmission spectrum of the first color bar and the transmission spectrum of the second color bar each have a separate peak top, and can have a chevron waveform.
- the transmission spectra of the R, G, and B color bars also have separate peak tops, and can have a mountain-shaped waveform.
- the R color bar has selective transparency to red light in a light source.
- the transmission spectrum of the R color bar preferably has a separated peak top. That is, it is preferable that the transmission spectrum of the R color bar has an angle waveform. This is because it is possible to perform accurate color calibration of the imaging device by making the brightness of the color bar group more uniform and further suppressing the influence of the IR cut filter provided in the camera of the imaging device. .
- the peak wavelength of the transmission spectrum of the R color bar is, for example, preferably in the range of 600 nm to 680 nm, and more preferably in the range of 610 nm to 680 nm, particularly in the range of 625 nm to 680 nm. This is because when the peak wavelength is not within the above range, when the transmission spectra of five colors excluding W are arranged in a well-balanced manner, the separation of peak tops is not clear, and the interpolated color effect is difficult to occur.
- the G color bar has selective transparency to green light in the light source.
- the transmission spectrum of the G color bar preferably has a separated peak top. That is, it is preferable that the transmission spectrum of the G color bar has an angle waveform. This is because it is possible to perform accurate color calibration of the imaging device by making the brightness of the color bar group more uniform and further suppressing the influence of the IR cut filter provided in the camera of the imaging device. .
- the peak wavelength of the transmission spectrum of the G color bar is, for example, preferably in the range of 495 nm to 570 nm, and more preferably in the range of 505 nm to 550 nm, particularly in the range of 510 nm to 540 nm. This is because when the peak wavelength is not within the above range, when the transmission spectra of five colors excluding W are arranged in a well-balanced manner, the separation of peak tops is not clear, and the interpolated color effect is difficult to occur.
- the B color bar has selective permeability to blue light in a light source.
- the transmission spectrum of the B color bar preferably has a separated peak top. That is, it is preferable that the transmission spectrum of the B color bar has an angle waveform. This is because it is possible to perform accurate color calibration of the imaging device by making the brightness of the color bar group more uniform and further suppressing the influence of the IR cut filter provided in the camera of the imaging device. .
- the peak wavelength of the transmission spectrum of the B color bar is, for example, preferably in the range of 430 nm to 490 nm, and more preferably in the range of 435 nm to 475 nm, particularly in the range of 450 nm to 470 nm. This is because when the peak wavelength is not within the above range, when the transmission spectra of five colors excluding W are arranged in a well-balanced manner, the separation of peak tops is not clear, and the interpolated color effect is difficult to occur.
- B color bar For other detailed description of the B color bar, refer to “II. Second embodiment A. Color bar group 1. Transmission spectrum (2) Spectral characteristics of each color bar (c) Blue (B) color bar” described later. Since it can be the same as the content described in the section, the description here is omitted.
- the coordinate points on the xy chromaticity diagram are (0.351, 0.649), (0.547, 0.453), ( 0.380, 0.506) and (0.433, 0.464), which are within the region surrounded by four points, among which (0.417, 0.583), (0.490, 0.510) ), (0.387, 0.501), (0.421, 0.474), preferably within a region surrounded by four points, in particular, (0.435, 0.565), (0. 472, 0.528), (0.402, 0.504), and (0.421, 0.489).
- the transmission spectrum of the first color bar has a separated peak top. That is, the transmission spectrum of the first color bar is a mountain waveform. This makes it possible to perform accurate color calibration of the imaging device by making the brightness of the color bar group more uniform and further suppressing the influence of the IR cut filter provided in the camera of the imaging device. Because.
- the first color bar may be referred to as a Ye color bar.
- the coordinate points on the xy chromaticity diagram are (0.125, 0.489), (0.112, 0.229), ( 0.270, 0.407) and (0.224, 0.242), but in the region surrounded by four points, (0.123, 0.437), (0.115, 0.296) , (0.254, 0.350), and (0.240, 0.297) are preferably within a region surrounded by four points, and in particular, (0.133, 0.384), (0.130 , 0.320), (0.239, 0.341), and (0.231, 0.312) are preferably in a region surrounded by four points.
- the transmission spectrum of the second color bar has a separated peak top. That is, the transmission spectrum of the second color bar is a mountain waveform. This makes it possible to perform accurate color calibration of the imaging device by making the brightness of the color bar group more uniform and further suppressing the influence of the IR cut filter provided in the camera of the imaging device. Because.
- the second color bar may be referred to as a Cy color bar.
- Cy color bar Group 1 Transmission Spectrum (2) Spectral Characteristics of Each Color Bar (e) Cyan Color (Cy) Color Bar” Since it can be the same as the content described in the section, the description is omitted here.
- (F) White (W) color bar The W color bar is colorless and translucent, and is used as a blank. The W color bar will be described later in the section “II. Second embodiment A. Color bar group 1. Transmission spectrum (2) Spectral characteristics of each color bar (f) White (W) color bar”. Since it can be the same as the contents, description thereof is omitted here.
- the color bar group further includes two color bars of violet (V) and near infrared (NIR) having a predetermined transmission spectrum. It is preferable.
- V violet
- NIR near infrared
- the color chart of this embodiment can sufficiently cover the colors in the visible light region. The color in the visible light region can be reproduced uniformly. Thereby, the precision of the color calibration of the imaging device using the color chart of this aspect can be improved.
- the color bar group preferably further includes an orange (O) color bar having a predetermined transmission spectrum in addition to the six color bars described above.
- the color chart of this aspect further includes an O color bar showing a predetermined transmission spectrum, so that an intermediate color between yellow and red having a wide peak wavelength interval can be supplemented, and the color in the visible light region is sufficiently balanced. Therefore, more detailed and highly accurate color calibration is possible.
- Color bar group 1 Transmission spectrum (2) Spectrum characteristics of each color bar (g) Optional color bar” described later Since the description can be the same as the description using FIGS. 5 to 9 described in the section, the description is omitted here.
- V Violet color (V) color bar Since the transmission spectrum of the V color bar has selective transmission with respect to light shorter than blue light among short wavelength light in the light source, the transmission spectrum of B color bar Is also located on the short wavelength side, and a part thereof preferably overlaps the transmission spectrum of the B color bar.
- the transmission spectrum of the V color bar preferably has a separated peak top. That is, it is preferable that the transmission spectrum of the V color bar has an angle waveform. This is because it is possible to perform accurate color calibration of the imaging device by making the brightness of the color bar group more uniform and further suppressing the influence of the IR cut filter provided in the camera of the imaging device. .
- V color bar group 1 Transmission spectrum (2) Spectral characteristics of each color bar (i) Violet color (V) color bar” Since it can be the same as the content described in the section, the description is omitted here.
- NIR Near-infrared
- NIR color bar For other detailed description of the NIR color bar, see “II. Second Embodiment A. Color Bar Group 1. Transmission Spectrum (2) Spectral Characteristic of Each Color Bar (ii) Gold Infrared Color (NIR) Color” described later. Since it can be the same as the content described in the section of “Bar”, the description is omitted here.
- the transmission spectrum of the O color bar has selective transmission with respect to light shorter than red light among long wavelength light in the light source, the transmission spectrum of the Ye color bar It is preferably located between the transmission spectrum of the R color bar. Since the peak wavelength interval between the transmission spectrum of the Ye color bar and the transmission spectrum of the R color bar is wide, the intermediate color between Ye and R is compensated by the peak wavelength of the transmission spectrum of the O color bar being located at the above position. And the intermediate color can be reproduced.
- the transmission spectrum of the O color bar preferably has a separated peak top. That is, the transmission spectrum of the O color bar is preferably a chevron waveform. This is because it is possible to perform accurate color calibration of the imaging device by making the brightness of the color bar group more uniform and further suppressing the influence of the IR cut filter provided in the camera of the imaging device. .
- the color bar group preferably includes a magenta (Mg) color bar.
- the position of the W coordinate can be specified by the positional relationship between the R coordinate and the Cy coordinate and the positional relationship between the B coordinate and the Ye coordinate.
- the position of the W coordinate of D65 which is the reference color, can be specified more accurately.
- the position of the W (65) coordinate can be accurately adjusted by using the color chart of this aspect including the Mg color bar.
- the Mg color bar has selective permeability for red light and blue light in the light source.
- the transmission spectrum 22 (Mg) of the Mg color bar has a first transmission peak (hereinafter referred to as a first peak wavelength) in the vicinity of the peak wavelength of the transmission spectrum 22 (R) of the R color bar. ) And a second transmission peak (hereinafter referred to as a second peak wavelength) in the vicinity of the peak wavelength of the transmission spectrum 22 (B) of the B color bar.
- the transmission spectrum of the Mg color bar preferably has a separated peak top. That is, it is preferable that the first transmission peak and the second transmission peak of the O color bar have a mountain-shaped waveform. This is because it is possible to perform accurate color calibration of the imaging device by making the brightness of the color bar group more uniform and further suppressing the influence of the IR cut filter provided in the camera of the imaging device. .
- Each color bar may be a member showing a desired transmission spectrum, and for example, a band pass filter or a dye substrate can be used.
- a band pass filter or a dye substrate can be used.
- the structure of the color bar and color bar group in this aspect it is the same as the content described in the section of “II. Second embodiment A.
- Color bar group 3. Structure of color bar and color bar group” described later. The description here is omitted.
- the color chart of this embodiment is usually provided with a light shielding part on the outer periphery of the color bar group on the transparent substrate.
- a light shielding part on the outer periphery of the color bar group on the transparent substrate.
- the transparent substrate is not particularly limited as long as it can support the color bar group and the light-shielding portion and has a desired light transmittance, and a transparent substrate used in a conventionally known color chart The same can be said.
- a transparent substrate used in a conventionally known color chart The same can be said.
- the transparent substrate in this aspect since it can be the same as that of the content described in the term of "II. 2nd embodiment C. transparent substrate" mentioned later, description here is abbreviate
- the color chart of this aspect may have an alignment mark, a recognition code, a cover glass, a color bar holding frame, a transparent protective plate with a light shielding portion, and the like in addition to the above-described configuration.
- description here is abbreviate
- the color chart of this aspect can be used for imaging devices, video devices, and peripheral devices that require color calibration. Among these, it can be suitably used for an imaging device for pathology.
- the color chart of the second embodiment includes a transparent substrate and a color bar group formed on the transparent substrate, and the color bar group includes red, green, blue, first color, second color, and white. At least six color bars are arranged in a pattern in random order, and the coordinate points of the first color are (0.351, 0.649), (0.547, 0) on the xy chromaticity diagram. .453), (0.380, 0.506), and (0.433, 0.464) are within a region surrounded by four points, and the coordinate point of the second color is on the xy chromaticity diagram.
- the peak wavelength of the transmission spectrum of the red color bar is in the range of 600 nm to 680 nm
- the transmission spectrum of the green color bar is The peak wavelength of the spectrum is within the range of 495 nm to 570 nm
- the peak wavelength of the transmission spectrum of the blue color bar is within the range of 430 nm to 490 nm
- the peak wavelength of the transmission spectrum of the first color bar is within the range of 540 nm to 595 nm
- the second The peak wavelength of the transmission spectrum of the color bar is in the range of 470 nm to 515 nm.
- the imaging device for pathology is required to accurately reproduce the color of the output image with a color close to the real thing because it observes a human tissue and performs a pathological diagnosis based on an image taken through a microscope.
- uniform results can be obtained in pathological diagnosis of the same sample based on the output image if there is a difference in the reproduced color due to the difference in spectral sensitivity characteristics of the imaging device. There may not be. Therefore, the reproduced color of the output image needs to be the same regardless of the type and manufacturer of the imaging device.
- the imaging device uses, for example, a color chart disclosed in Patent Document 1 to compare the reproduction color on the imaging device with the reproduction color on the color chart. If there is a difference in the reproduction color, calibration is performed based on the color chart.
- a color chart disclosed in Patent Document 1 to compare the reproduction color on the imaging device with the reproduction color on the color chart. If there is a difference in the reproduction color, calibration is performed based on the color chart.
- the pathological imaging device particularly requires high color reproducibility for the output image as described above, and uniform color reproducibility is required regardless of the type of the imaging device.
- a color chart used for an imaging device for pathology needs to sufficiently cover colors in the visible light region and is required to be able to reproduce colors in the visible light region uniformly.
- This aspect has been made in view of the above-described problems, and can fully reproduce colors uniformly in the visible light region and accurately perform color calibration of an imaging device.
- the main objective is to provide a possible transmissive color calibration chart.
- the transmission spectrum of each color bar excluding W constituting the color bar group is arranged in a balanced manner with peaks at desired intervals in the visible light region. That is, as shown in FIG. 2, the color chart of this embodiment is such that the peak wavelength of the transmission spectrum 22 (R) of the R color bar is in the range of 600 nm to 680 nm, and the peak wavelength of the transmission spectrum 22 (G) of the G color bar. Is in the range of 495 nm to 570 nm, and the peak wavelength of the transmission spectrum 22 (B) of the B color bar is in the range of 430 nm to 490 nm.
- the peak wavelength of the transmission spectrum 22 (Ye) of the Ye color bar is in the range of 540 nm to 595 nm, and the peak wavelength of the transmission spectrum 22 (Cy) of the Cy color bar is in the range of 470 nm to 515 nm.
- the five color bars excluding white have the peak wavelength of the transmission spectrum at a predetermined position, so that the minimum six colors necessary to include the desired pointer color in the xy chromaticity diagram.
- the colors in the visible light region can be covered, and the colors in the visible light region can be reproduced uniformly. Thereby, the color calibration of an imaging device can be accurately performed using the color chart of this aspect.
- the visible light region means a wavelength region of 380 nm to 780 nm. What is described as “within the range of Anm to Bnm (A and B are numerical values)” in the wavelength range defined in this specification can be rephrased as “Anm to Bnm (A and B are numerical values)”. it can.
- the “xy chromaticity diagram” refers to an xy chromaticity diagram of the CIE 1931-XYZ color system.
- separation of peak top means to suppress the overlap of peak tops of transmission spectra of each color.
- spectrum separation means to suppress the occurrence of color mixing due to overlapping of transmission spectra of a plurality of colors.
- FIG. 1 is a schematic plan view showing an example of the color chart of this aspect.
- FIG. 2 is an image graph showing an example of the spectral transmission spectrum shown by the color chart of this embodiment
- FIG. 3 is an xy chromaticity diagram showing the color gamut of the color chart of this embodiment.
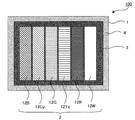
- the color chart 100 of this embodiment includes a transparent substrate 1 and a color bar group 2 formed on the transparent substrate 1.
- a color bar holding frame 4 is provided on the outer periphery of the color bar group 2.
- the color bar group 2 is a pattern in which at least six color bars of a red color bar 12R, a green color bar 12G, a blue color bar 12B, a yellow color bar 12Ye, a cyan color bar 12Cy, and a white color bar 12W are arranged in any order. It is arranged in a shape.
- the white color bar 12W is usually transparent.
- a light shielding portion 3 is provided around each color bar on the transparent substrate 1.
- the color chart 100 of the present embodiment has a spectral transmission spectrum characteristic as shown in FIG. 2, and as shown in FIG. It has an enclosed color gamut L1. Note that L2 in FIG. 3 indicates a color gamut surrounded by a triangle connecting the coordinates of the three colors R, G, and B on the xy chromaticity diagram with straight lines. The same shall apply hereinafter.
- the light incident from the back surface is dispersed according to the selective transmission of the five color bars excluding W constituting the color bar group.
- W constituting the color bar group.
- Transmission spectra of each of the B color bar, Cy color bar, G color bar, Ye color bar, and R color bar appear.
- the transmission spectrum of each color bar excluding W constituting the color bar group is arranged in a balanced manner with peaks at desired intervals in the visible light region. That is, as shown in FIG. 2, the color chart of this embodiment is such that the peak wavelength of the transmission spectrum 22 (R) of the R color bar is in the range of 600 nm to 680 nm, and the peak wavelength of the transmission spectrum 22 (G) of the G color bar. Is in the range of 495 nm to 570 nm, and the peak wavelength of the transmission spectrum 22 (B) of the B color bar is in the range of 430 nm to 490 nm.
- the peak wavelength of the transmission spectrum 22 (Ye) of the Ye color bar is in the range of 540 nm to 595 nm, and the peak wavelength of the transmission spectrum 22 (Cy) of the Cy color bar is in the range of 470 nm to 515 nm.
- the chromaticity coordinates of the five color bars excluding W are distributed as shown in FIG. 3 on the xy chromaticity diagram.
- the color chart of this aspect can reproduce and calibrate the color of the pointer color included in the color gamut L1 surrounded by the pentagon in which the coordinates of the five colors are connected by straight lines on the xy chromaticity diagram. .
- the spectral distribution S_ ( ⁇ ) of the light source is based on the D65 light source.
- W (D65) in FIG. 3 is the white coordinate of D65, and the white indicated by the white coordinate is referred to as “D65 white” in this specification.
- the five color bars excluding white have the peak wavelength of the transmission spectrum at a predetermined position, so that the minimum six colors necessary to include the desired pointer color in the xy chromaticity diagram.
- the colors in the visible light region can be covered, and the colors in the visible light region can be reproduced uniformly. Thereby, the color calibration of an imaging device can be accurately performed using the color chart of this aspect.
- the color bar group in this embodiment is formed on a transparent substrate.
- the color bar group is configured by arranging at least six color bars of R, G, B, Ye, Cy, and W in a random pattern.
- “Five colors excluding (excluding) W” means five colors of R, G, B, Ye, and Cy.
- 5-color bar means the above-mentioned 5-color bar unless otherwise specified.
- the “six-color bar” means a total of six color bars of the above-mentioned five colors and W unless otherwise specified. As will be described later, the same applies to the case of including color bars of other colors.
- Transmission spectrum The transmission spectrum of the five color bars excluding W has a peak wavelength at a predetermined position.
- the transmission spectrum of each color bar appears in a balanced manner so as to cover a desired wavelength region in the visible light region. Further, adjacent transmission spectra partially overlap, and the spectral transmission spectrum of the color chart can cover the entire visible light region.
- the transmission spectrum of the five color bars excluding W has a peak wavelength or a reference wavelength according to the waveform.
- the transmission spectrum of the five color bars excluding W shows a mountain-shaped waveform as shown in FIG. 4A and has a peak wavelength ⁇ P indicating high transmittance.
- the peak wavelength ⁇ P has a relative transmittance of 50 when the maximum value T max of the measured transmittance of the transmission spectrum is specified and the transmittance of the maximum value T max is 100%.
- % Wavelengths ⁇ 1 and ⁇ 2 are specified and set as the center wavelength in the wavelength region from wavelength ⁇ 1 to wavelength ⁇ 2 .
- the measured transmittance T at the peak wavelength ⁇ P is referred to as “transmittance at the peak wavelength (hereinafter sometimes referred to as peak transmittance)”.
- peak transmittance simply refers to the measured transmittance
- relative transmittance refers to the transmittance obtained by converting the measured transmittance at a specific wavelength as 100%.
- the transmission spectrum of each color bar is obtained by measuring the transmittance in the visible light region of 380 nm to 780 nm using Olympus Co., Ltd., microspectrophotometer OSP-SP200, with a colorless (transparent) white color bar as the background. .
- Olympus Co., Ltd., microspectrophotometer OSP-SP200 Olympus Co., Ltd., microspectrophotometer OSP-SP200
- a colorless (transparent) white color bar as the background.
- the D65 light source spectrum data that is already known is used. The same applies to any color bar other than the above five colors.
- the R color bar has selective transparency to red light in a light source.
- the peak wavelength of the transmission spectrum of the R color bar may be in the range of 600 nm to 680 nm, preferably in the range of 610 nm to 680 nm, particularly in the range of 625 nm to 680 nm. This is because when the peak wavelength is not within the above range, when the transmission spectra of five colors excluding W are arranged in a well-balanced manner, the separation of peak tops is not clear, and the interpolated color effect is difficult to occur.
- the half-value width of the transmission spectrum of the R color bar is preferably 120 nm or less, more preferably in the range of 20 nm to 100 nm, and particularly preferably in the range of 30 nm to 80 nm.
- the lower limit of the half width can be set to 10 nm.
- the half-value width of the transmission spectrum refers to the wavelength interval at which the peak transmittance of the transmission spectrum becomes a half value, and is calculated from the measurement result obtained by measuring the transmission spectrum described above (using the Olympus Microspectroscope OSP-SP200). can do. The same applies to the color bars of other colors.
- the transmission spectrum of the R color bar is BT. It is preferably equivalent to the red transmission spectrum defined by the 2020 standard. That is, the peak wavelength of the transmission spectrum of the R color bar is preferably in the range of 620 nm to 680 nm and the half width is preferably 100 nm or less, and the peak wavelength is in the range of 630 nm to 670 nm and the half width is 80 nm or less. More preferably, the peak wavelength is in the range of 630 nm to 660 nm, and the half width is more preferably 70 nm or less.
- the coordinates of the R color bar on the xy chromaticity diagram can be changed to BT. It can be matched or approximated with the red coordinates defined in the 2020 standard. This is because it can be expanded to the red region defined by the 2020 standard.
- the G color bar has selective transparency to green light in the light source.
- the peak wavelength of the transmission spectrum of the G color bar may be in the range of 495 nm to 570 nm, and particularly preferably in the range of 505 nm to 550 nm, particularly in the range of 510 nm to 540 nm. This is because when the peak wavelength is not within the above range, when the transmission spectra of five colors excluding W are arranged in a well-balanced manner, the separation of peak tops is not clear, and the interpolated color effect is difficult to occur.
- the half width of the transmission spectrum of the G color bar it is possible to show a waveform in which the transmission spectrum of the G color bar can partially overlap with the transmission spectrum of the Cy color bar and the transmission spectrum of the Ye color bar. If it is.
- the half width is preferably 100 nm or less, more preferably in the range of 20 nm to 80 nm, and particularly preferably in the range of 30 nm to 60 nm.
- the lower limit of the half width can be set to 10 nm. If the full width at half maximum is not within the above range, there is an overlap region with the transmission spectrum of the color bars of other colors, and it may be difficult to sufficiently widen the green region of the color gamut of the color chart of this aspect. This is because the saturation of reproducible colors may be reduced.
- the transmission spectrum of the G color bar is BT. It is preferably equivalent to the green transmission spectrum defined by the 2020 standard. That is, the peak wavelength of the transmission spectrum of the G color bar is preferably in the range of 510 nm to 540 nm and the half width is preferably 80 nm or less, and the peak wavelength is in the range of 515 nm to 538 nm and the half width is 60 nm or less. It is more preferable that the peak wavelength is in the range of 520 nm to 535 nm and the half width is 40 nm or less.
- the coordinates of the G color bar on the xy chromaticity diagram can be changed to BT. It can be matched or approximated with the green coordinates defined in the 2020 standard, and the green area of the color gamut of the color chart of this aspect is represented by BT. This is because it is possible to expand to the green region defined by the 2020 standard.
- the B color bar has selective permeability to blue light in a light source.
- the peak wavelength of the transmission spectrum of the B color bar may be in the range of 430 nm to 490 nm, and particularly preferably in the range of 435 nm to 475 nm, particularly in the range of 450 nm to 470 nm. This is because when the peak wavelength is not within the above range, when the transmission spectra of five colors excluding W are arranged in a well-balanced manner, the separation of peak tops is not clear, and the interpolated color effect is difficult to occur.
- the half-value width of the transmission spectrum of the B color bar is not limited as long as the transmission spectrum of the B color bar can show a waveform that can partially overlap the transmission spectrum of the Cy color bar.
- the half width is preferably 100 nm or less, more preferably in the range of 20 nm to 85 nm, and particularly preferably in the range of 25 nm to 55 nm.
- the lower limit of the half width can be set to 10 nm. If the full width at half maximum is not within the above range, there is an overlap region with the transmission spectrum of the color bars of other colors, and it may be difficult to sufficiently widen the blue region of the color gamut of the color chart of this aspect. This is because the saturation of reproducible colors may be reduced.
- the transmission spectrum of the B color bar is BT. It is preferable to be equivalent to the blue transmission spectrum defined by the 2020 standard. That is, the peak wavelength of the transmission spectrum of the B color bar is preferably in the range of 450 nm to 472 nm and the half width is preferably 80 nm or less, and the peak wavelength is in the range of 455 nm to 470 nm and the half width is 60 nm or less. More preferably, the peak wavelength is in the range of 458 nm to 468 nm, and the half width is more preferably 40 nm or less.
- the coordinates of the R color bar on the xy chromaticity diagram can be changed to BT. It is possible to match or approximate the blue coordinates defined in the 2020 standard. This is because it is possible to extend to the blue region defined by the 2020 standard.
- the Ye color bar has selective permeability to short wavelength light and long wavelength light in the light source. Further, the transmission spectrum of the Ye color bar is located between the transmission spectrum of the G color bar and the transmission spectrum of the R color bar.
- the peak wavelength of the transmission spectrum of the Ye color bar may be in the range of 540 nm to 595 nm, particularly preferably in the range of 545 nm to 585 nm, particularly in the range of 560 nm to 575 nm. This is because when the peak wavelength is not within the above range, when the transmission spectra of five colors excluding W are arranged in a well-balanced manner, the separation of peak tops is not clear, and the interpolated color effect is difficult to occur.
- the half-value width of the transmission spectrum of the Ye color bar is not limited as long as the transmission spectrum of the Ye color bar can show a waveform that can partially overlap the transmission spectrum of the G color bar.
- the half width is preferably 180 nm or less, more preferably in the range of 20 nm to 170 nm, and particularly preferably in the range of 30 nm to 70 nm.
- the lower limit of the half width can be set to 10 nm. This is because when the half width is not within the above range, an overlapping area with the transmission spectrum of the color bar of another color increases.
- Cyan (Cy) color bar The Cy color bar has selective transparency to short wavelength light and medium wavelength light in the light source.
- the transmission spectrum of the Cy color bar is located between the transmission spectrum of the G color bar and the transmission spectrum of the B color bar.
- the peak wavelength of the transmission spectrum of the Cy color bar may be in the range of 470 nm to 515 nm, and particularly preferably in the range of 480 nm to 505 nm, particularly in the range of 490 nm to 500 nm.
- the peak wavelength of the transmitted light of the Cy color bar is not within the above range, when the transmission spectra of five colors except W are arranged in a well-balanced manner, the separation of the peak tops is not clear, and the interpolated color effect is hardly produced. Because it becomes.
- the transmission spectrum of the Cy color bar shows a waveform that can partially overlap the transmission spectrum of the G color bar and the transmission spectrum of the B color bar. That's fine.
- the half width is preferably 150 nm or less, more preferably in the range of 20 nm to 130 nm, and particularly preferably in the range of 30 nm to 80 nm.
- the lower limit of the half width can be set to 10 nm.
- the W color bar is colorless and translucent, and is used as a blank.
- the W color bar can be a transparent substrate described later.
- an achromatic W color bar for example, an ND filter
- an achromatic W color bar designed so as to be able to uniformly absorb light in a visible range may be disposed on a transparent substrate. It may be used as a transparent substrate.
- the color bar group further includes two color bars of violet (V) and near infrared (NIR) having a predetermined transmission spectrum. It is preferable.
- V violet
- NIR near infrared
- the color chart of this embodiment can sufficiently cover the colors in the visible light region. The color in the visible light region can be reproduced uniformly. Thereby, the precision of the color calibration of the imaging device using the color chart of this aspect can be improved.
- the color bar group preferably further includes an orange (O) color bar having a predetermined transmission spectrum in addition to the above-described six color bars.
- the color chart of this aspect further includes an O color bar showing a predetermined transmission spectrum, so that an intermediate color between yellow and red having a wide peak wavelength interval can be supplemented, and the color in the visible light region is sufficiently balanced. Therefore, more detailed and highly accurate color calibration is possible.
- the group of color bars may be composed of a total of eight colors including the above-described six color bars and two colors of a V color bar and a NIR color bar having a predetermined transmission spectrum. It may be composed of a total of seven colors including a color bar and an O color bar. Further, it may be composed of a total of nine colors including the above-mentioned six color bars and a total of three colors of the V color bar, the NIR color bar, and the O color bar.
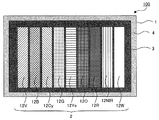
- FIG. 5 is a schematic plan view showing another example of the color chart of this embodiment.
- a total of nine color bars including 12V, a near-infrared color bar 12NIR, and an orange color bar 12O have a color bar group 2 that is arranged in a random pattern.
- the color chart shown in FIG. 5 has spectral transmission spectrum characteristics as shown in FIG. Further, the chromaticity coordinates of the eight color bars excluding W in the color chart shown in FIG. 5 are distributed as shown in FIG. 7 on the xy chromaticity diagram, and the coordinates of the eight colors are connected by a straight line.
- the color of the pointer color included in the color gamut L3 surrounded by the octagon can be reproduced and calibrated.
- the color chart of this aspect is Of the spectral transmission spectrum shown in FIG. 6, the spectral transmission spectrum excluding the transmission spectrum 22 (O) of the O color bar is shown. Further, when the color bar group is composed of a total of seven colors including O color bars having a predetermined transmission spectrum in addition to the six color bars described above, the color chart of this aspect is shown in FIG. Of the spectral transmission spectrum, the spectral transmission spectrum excluding the transmission spectrum 22 (NIR) of the NIR color bar and the transmission spectrum 22 (V) of the V color bar is shown.
- NIR transmission spectrum 22
- V transmission spectrum 22
- the color bar group preferably includes a magenta (Mg) color bar in addition to the six color bars described above.
- White is obtained by mixing R and Cy, or B and Ye, which are symmetrical and in position (with a complementary color relationship) with respect to the W coordinate on the xy chromaticity diagram.
- Mg color bar By including the Mg color bar in the bar group, W can also be obtained by mixing G and Mg having a complementary color relationship at an appropriate ratio.
- the color chart of this aspect is because white can be calibrated more accurately by adjusting the same white according to three criteria using complementary colors.
- the group of color bars may be composed of a total of seven colors including the above-described six color bars and Mg color bar.
- the above six color bars, the V color bar having a predetermined transmission spectrum, and the NIR may be composed of a total of nine colors including two colors of color bars and an Mg color bar. Further, it may be composed of a total of eight colors including the above-described six color bars, an O color bar having a predetermined transmission spectrum, and an Mg color bar. Further, the color bar group has a total of 10 colors including the above-described six color bars, three colors of V color bar, NIR color bar and O color bar having a predetermined transmission spectrum, and Mg color bar. It may be configured.
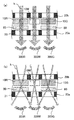
- FIG. 8 is a schematic plan view showing another example of the color chart of this aspect, in addition to the nine color bars 12R, 12G, 12B, 12Ye, 12Cy, 12W, 12V, 12NIR, and 12O shown in FIG.
- a total of 10 color bars including the magenta color bar 12Mg have the color bar group 2 configured in a random pattern.
- the color chart shown in FIG. 8 has spectral transmission spectrum characteristics as shown in FIG. Further, the chromaticity coordinates of the nine color bars excluding W in the color chart shown in FIG. 8 are distributed on the xy chromaticity diagram as shown in FIG. 7, and the chromaticity coordinates of Mg are the above except for Mg. It is included in a color gamut L3 surrounded by an eight shape in which the coordinates of the eight colors are connected by straight lines.
- the color chart of this aspect is the NIR color bar in the spectral transmission spectrum shown in FIG.
- the spectral transmission spectrum excluding the transmission spectrum 22 (NIR), the transmission spectrum 22 (V) of the V color bar, and the transmission spectrum 22 (O) of the O color bar is shown.
- V Violet color (V) color bar Since the transmission spectrum of the V color bar has selective transmission with respect to light shorter than blue light among short wavelength light in the light source, the transmission spectrum of B color bar Is also located on the short wavelength side, and a part thereof preferably overlaps the transmission spectrum of the B color bar.
- the transmission spectrum of the V color bar has a waveform that shows a transmittance equal to or higher than a predetermined transmittance at a certain wavelength or less, as shown in FIG. It may not be a chevron waveform. Therefore, for the transmission spectrum of the V color bar, as shown in FIG. 4B, the wavelength 415 nm is the reference wavelength ⁇ s, and the measured transmittance T at the reference wavelength ⁇ s is expressed as “transmittance at the reference wavelength”. (Hereafter, it may be referred to as a reference transmittance).
- the transmission spectrum of the V color bar has a wavelength (relative wavelength) ⁇ 3 of 435 nm to 465 nm where the relative transmittance is 50% when 415 nm is the reference wavelength ⁇ s and the transmittance at the reference wavelength ⁇ s is 100%.
- it is preferably in the range of 435 to 460 nm, particularly in the range of 440 to 455 nm.
- the transmittance is equal to or higher than a predetermined value in a wavelength region shorter than the reference wavelength.
- the “shorter wavelength region than the reference wavelength” refers to a wavelength region having a wavelength of 380 nm or more, which is the lower limit of the visible light region, and smaller than the reference wavelength of 415 nm.
- the transmission spectrum of the V color bar shows a transmittance of a predetermined value or more in a shorter wavelength region than the reference wavelength. Specifically, the transmittance in the shorter wavelength region than the reference wavelength when the reference transmittance is 100%.
- the relative transmittance is preferably 5% or more, more preferably 8% or more, and even more preferably 10% or more. This is because it is possible to reproduce colors in a shorter wavelength region than the reference wavelength of the transmission spectrum of the V color bar.
- the transmission spectrum of the V color bar preferably has a relative transmittance of 5% or less at a wavelength of 490 nm or more when the reference transmittance is 100%, more preferably 3% or less, particularly preferably 1% or less. . If the relative transmittance in the wavelength region of the transmission spectrum of the V color bar exceeds the above-mentioned range, it is difficult to separate the spectrum from the transmission spectrum of the color bars of other colors on the spectral transmission spectrum, and the xy color. This is because there is a high possibility that the reproducibility with respect to the color coordinates in the degree diagram is extremely low.
- NIR Near-infrared
- the transmission spectrum of the NIR color bar has a waveform indicating a transmittance equal to or higher than a predetermined transmittance at a certain wavelength or more, and may not be a chevron waveform.
- the NIR color bar transmission spectrum has a wavelength 730 nm as the reference wavelength ⁇ t, and the measured transmittance T at the reference wavelength ⁇ t is expressed as “transmittance at the reference wavelength”. (Hereafter, it may be referred to as a reference transmittance).
- the transmission spectrum of the NIR color bar has a wavelength (relative wavelength) ⁇ 4 from 630 nm to a relative transmittance of 50% when the reference wavelength ⁇ t is 730 nm and the transmittance at the reference wavelength ⁇ t is 100%. It is preferably in the range of 730 nm, more preferably in the range of 640 nm to 710 nm, and particularly preferably in the range of 650 nm to 700 nm.
- the relative wavelength within the above range, it is possible to suppress the spread of the spectrum waveform in the shorter wavelength region than the reference wavelength, and to overlap the transmission spectrum of the R color bar with the desired wavelength region.
- the transmission spectrum of the NIR color bar can maintain the overlap of the peak itself while maintaining the separation of the transmission spectrum of the R color bar and the peak top, so the high wavelength side of the visible light region should be evaluated without omission. Because you can.
- the transmittance of the NIR color bar shows a transmittance of a certain value or more in a wavelength region longer than the reference wavelength.
- the “longer wavelength region than the reference wavelength” refers to a wavelength region that is larger than the reference wavelength of 730 nm and has a wavelength of 780 nm or less that is the upper limit of the visible light region.
- the transmission spectrum of the NIR color bar shows a transmittance of a certain value or longer in the wavelength region longer than the reference wavelength. Specifically, in the wavelength region longer than the reference wavelength when the reference transmittance is 100%.
- the relative transmittance is preferably 30% or more, more preferably 50% or more, and still more preferably 80% or more. This is because it is possible to reproduce colors in a wavelength region longer than the reference wavelength of the transmission spectrum of the NIR color bar.
- the transmission spectrum of the NIR color bar preferably has a relative transmittance of 5% or less at a wavelength of 620 nm or less when the reference transmittance is 100%, more preferably 2% or less, particularly preferably 1% or less. . If the relative transmittance in the above wavelength region of the transmission spectrum of the NIR color bar exceeds the above range, it becomes difficult to separate the spectrum from the transmission spectrum of the color bar of other colors on the spectral transmission spectrum, as well as the xy color. This is because there is a high possibility that the reproducibility with respect to the color coordinates in the degree diagram is extremely low.
- the transmission spectrum of the O color bar has selective transmission with respect to light shorter than red light among long wavelength light in the light source, the transmission spectrum of the Ye color bar It is preferably located between the transmission spectrum of the R color bar. Since the peak wavelength interval between the transmission spectrum of the Ye color bar and the transmission spectrum of the R color bar is wide, the intermediate color between Ye and R is compensated by the peak wavelength of the transmission spectrum of the O color bar being located at the above position. And the intermediate color can be reproduced.
- the peak wavelength of the transmission spectrum of the O color bar is preferably in the range of 575 nm to 620 nm, more preferably in the range of 580 nm to 615 nm, and particularly preferably in the range of 585 nm to 610 nm. This is because, when the peak wavelength is not within the above range, when the transmission spectra of eight colors excluding W are arranged in a well-balanced manner, the separation of the peak tops is not clear, and the interpolated color effect is hardly generated.
- the half width of the transmission spectrum of the O color bar it is possible to show a waveform in which the transmission spectrum of the O color bar can partially overlap the transmission spectrum of the Ye color bar and the transmission spectrum of the R color bar. That's fine.
- the half width is preferably 120 nm or less, more preferably in the range of 20 nm to 100 nm, and particularly preferably in the range of 20 nm to 70 nm.
- the lower limit of the half width can be set to 10 nm.
- the transmission spectrum of the O color bar preferably has a relative transmittance of 10% or less at a wavelength of 550 nm or less and 680 nm or more, with a peak transmittance of 100%, particularly 5% or less, particularly 3% or less. Preferably there is.
- the relative transmittance of the transmission spectrum of the O color bar exceeds the above range, the overlapping area with the transmission spectrum of the color bars of other colors increases, and the spectral separation on the spectral transmission spectrum is reduced. This is because it may be difficult. Moreover, it is because the color reproduction accuracy of O by the color chart of this aspect may fall.
- the color bar group preferably includes a magenta (Mg) color bar.
- the position of the W coordinate can be specified by the positional relationship between the R coordinate and the Cy coordinate and the positional relationship between the B coordinate and the Ye coordinate.
- the position of the W coordinate of D65 which is the reference color, can be specified more accurately.
- the position of the W (65) coordinate can be accurately adjusted by using the color chart of this aspect including the Mg color bar.
- the Mg color bar has selective permeability for red light and blue light in the light source.
- the transmission spectrum 22 (Mg) of the Mg color bar has a first transmission peak (hereinafter referred to as a first peak wavelength) in the vicinity of the peak wavelength of the transmission spectrum 22 (R) of the R color bar. ) And a second transmission peak (hereinafter referred to as a second peak wavelength) in the vicinity of the peak wavelength of the transmission spectrum 22 (B) of the B color bar.
- the first peak wavelength is preferably in the range of 567 nm to 780 nm, more preferably in the range of 590 nm to 710 nm, and particularly in the range of 610 nm to 680 nm.
- the second peak wavelength is preferably in the range of 380 nm to 495 nm, more preferably in the range of 400 nm to 485 nm, and particularly preferably in the range of 430 nm to 470 nm.
- the color chart of this aspect can reproduce and calibrate a pointer color included in a color gamut surrounded by a pentagon obtained by connecting each coordinate of five colors with a straight line on the xy chromaticity diagram. According to this aspect, since each color bar which comprises a color bar group shows the above-mentioned transmission spectrum, it can have a color gamut wider than the conventional color chart.
- the coverage rate of the pointer color included in the pentagon obtained by connecting the coordinates on the xy chromaticity diagram of the five color bars excluding white with a straight line is, for example, 90.3% or more. In particular, it is preferably 99.9% or more, more preferably 100%, that is, it is preferable that all the pointer colors are included in the pentagon.
- the pentagon in which the coordinates of five colors except white are connected by straight lines is the color gamut of the color chart of this embodiment, and the color gamut sufficiently covers the colors in the visible light region by sufficiently including the pointer color. be able to. This is because the actual object color can be reproduced more accurately, and color calibration of the imaging device can be performed with high accuracy.
- the chromaticity coordinates of the eight color bars excluding W are shown in FIG. 7 on the xy chromaticity diagram. Distributed as shown.
- V (0.164, 0.013)
- NIR 0.724, 0.272
- O 0.647, 0.352
- the color chart of this aspect can expand the range of the color gamut on the xy chromaticity diagram in accordance with the number of colors included in the color bar group. For example, when the color bar group is composed of a total of 8 colors including a V color bar and an NIR color bar in addition to the 6 color bars, the color chart of this aspect is represented as W on the xy chromaticity diagram. It is possible to reproduce and calibrate a pointer color included in a color gamut surrounded by a heptagon obtained by connecting the coordinates of the seven colors except for.
- the color chart of this aspect has six colors excluding W on the xy chromaticity diagram. It is possible to reproduce and calibrate a pointer color included in a color gamut surrounded by a hexagon in which the coordinates of each are connected by a straight line. Furthermore, when the color bar group is composed of a total of nine colors including a V color bar, an NIR color bar, and an O color bar in addition to the six color bars, the color chart of this aspect has an xy chromaticity diagram.
- the color bar group is composed of the above-described 7 colors, 8 colors, or 9 colors
- the coverage rate of the pointer color included in the polygon connecting the coordinates on the xy chromaticity diagram with a straight line is 5 It can be the same as the coverage ratio of the pointer color included in the pentagon by the color bar of the color.
- the peak wavelength and the half value width of the transmission spectrum of each color bar of R, G, and B are within a predetermined range.
- a color gamut (L2 in FIG. 3) defined by a triangle formed by connecting the coordinates of the three primary colors on the xy chromaticity diagram of the color chart of this embodiment with a straight line is represented by BT. It can be close to the color gamut defined by the coordinates of the three primary colors in the 2020 standard. This is because it is possible to cope with color calibration of an imaging device to which the 2020 standard is applied.
- the waveform of the transmission spectrum can have various waveform shapes for each color coordinate, by setting the half-value width together with the position of the peak wavelength of the transmission spectrum for each color, This is because the color chart can ensure the color reproducibility by the transmission spectrum.
- the coordinates of the Cy color bar on the xy chromaticity diagram are the coordinates (R coordinate) of the R color bar on the xy chromaticity diagram and W ( 65) is an extension of the line connecting the coordinates, and BT.
- the coordinates on the xy chromaticity diagram of the Ye color bar (hereinafter referred to as the Ye coordinate) located on the outer periphery of the color gamut defined by the 2020 standard or outside the color gamut are referred to as the B color bar. It is an extension of the line connecting the coordinates (B coordinate) and W (D65) coordinates on the xy chromaticity diagram, and BT.
- the position of the Cy coordinate is on the extension line of the line connecting the W (D65) coordinate and the R coordinate
- the position of the Ye coordinate is on the extension line of the line connecting the W (D65) coordinate and the B coordinate.
- the Cy coordinate is the intersection of the extension line of the line connecting the R coordinate and the W coordinate and the side of the triangle
- the Ye coordinate is the extension line of the line connecting the B coordinate and the W coordinate and the side of the triangle.
- An intersection is preferred.
- cyan obtained by mixing green and blue at an appropriate mixing ratio is the same as cyan indicated by the Cy color bar of the color chart of this embodiment. It is possible to verify whether white obtained by mixing cyan and red is white of D65.
- Ye when the Ye coordinate is on the triangle on the xy chromaticity diagram, yellow obtained by mixing green and red at an appropriate mixing ratio and the Ye color bar of the color chart of this embodiment.
- the color chart of this embodiment has the same white obtained by mixing cyan and red, and yellow and blue, respectively, by having the Cy coordinate and Ye coordinate on the xy chromaticity diagram in the above position. Can be calibrated to D65 white.
- the coordinates on the xy chromaticity diagram of the Mg color bar are the xy chromaticity diagram of the G color bar. It is preferable to be on an extension line of a line connecting the coordinates (G coordinate) and the W coordinate. Above all, it is preferable to be on the extension line and on the side of the triangle.
- Mg coordinates on the xy chromaticity diagram
- red and cyan, blue and yellow, and green and magenta which are complementary colors, respectively. It is possible to reproduce white that becomes D65 by mixing these combinations at an appropriate ratio. This is because the color chart of this aspect can perform white calibration and white balance adjustment more accurately.
- the Mg coordinate is not included as each color coordinate defining the color gamut.
- the transmission spectrum of each color bar of Cy, Ye, and Mg is designed by appropriately adjusting the peak wavelength position and half-value width according to the position of each coordinate of Cy, Ye, and Mg on the xy chromaticity diagram. can do.
- the transmission spectrum of the Cy color bar includes an extension line obtained by drawing a straight line from the color coordinate position of W (D65) to the target Cy color coordinate and the outer periphery of the xy chromaticity diagram in order to adjust the Cy coordinate.
- the point where the wavelength position along the curve intersects can be used as a guide for the peak position.
- the half width of the transmission spectrum of the Cy color bar can be set so as not to interfere with the peak position of another adjacent transmission spectrum.
- the half width can be changed according to the target coordinate position of Cy.
- the transmission spectrum of the Ye color bar Regarding Mg, the peak wavelength position of the B color bar or V color bar and the peak of the R color bar or NIR color bar that can draw a straight line passing through the target Mg coordinate on the xy chromaticity diagram.
- the first peak and the second peak of the transmission spectrum of the Mg color bar can be set at the wavelength positions, respectively.
- the half width of the transmission spectrum of the Mg color bar can be changed according to the target coordinate position of Mg.
- Each color bar may be a member showing a desired transmission spectrum, and for example, a band pass filter or a dye substrate can be used.
- the dyed substrate can be formed by a dyeing method.
- a silver salt emulsion prepared by adding a solution of potassium bromide and silver nitrate to gelatin is used, and the above silver salt emulsion is coated on a chip substrate such as a glass plate. It can be formed by desilvering from a silver salt photographic plate obtained by drying and dyeing with a dye corresponding to the color of the color bar.
- the dye substrate can also be formed by mixing a dye in advance with gelatin (solution) and applying a predetermined color to a chip substrate such as a glass plate.
- the peak wavelength position of the transmission spectrum of the color bar can be adjusted according to the type of the color bar and its forming method. For example, if a dyed substrate using one kind of dye is used as the color bar, the peak wavelength of the transmission spectrum of the color bar can be adjusted by adjusting the concentration of the dye. If a dyed substrate formed by blending two or more dyes is used as a color bar, the peak wavelength of the transmission spectrum of the color bar can be adjusted by changing the blending ratio of the two dyes. it can.
- the peak wavelength position can be adjusted by increasing the blending ratio of the blue dye.
- the size and the like of the color bar are not particularly limited, and can be appropriately designed so that a desired effect can be easily obtained according to the use of the color chart of this aspect.
- the color bars are arranged in a pattern in random order.
- an arrangement pattern of each color bar as illustrated in FIG. 1, it may be arranged in a line pattern in a line, or although not illustrated, it may be arranged in a lattice pattern or a circle.
- the order of arrangement of the color bars is not particularly limited, and can be appropriately designed so that a desired effect can be easily achieved according to the use of the color chart of this aspect.
- Each color bar can be formed using a conventionally known method such as a vapor deposition method, a dyeing method, a printing method, a transfer method, or an ink jet method. Since the method for forming the color bar by the dyeing method has been described above, the description thereof is omitted here.
- the color bar group can be formed, for example, by arranging each color bar formed by the above-described method in a desired pattern on one side of a transparent substrate described later and sandwiching the transparent substrate and the cover glass. .
- the color chart of this embodiment is usually provided with a light shielding part on the outer periphery of the color bar group on the transparent substrate.
- the light-shielding portion may have any desired light-shielding property, and examples thereof include a metal film such as a chromium thin film, a printed layer formed with black ink, and the like.
- a method for forming the light shielding portion a conventionally known method can be used according to the material to be used.
- the transparent substrate is not particularly limited as long as it can support the color bar group and the light-shielding portion and has a desired light transmittance, and a transparent substrate used in a conventionally known color chart The same can be said.
- an inorganic substrate such as a glass substrate or a resin substrate can be used.
- the resin substrate may be a plate or a film or sheet.
- the color chart of this aspect may have an alignment mark, a recognition code, a cover glass, a color bar holding frame, a transparent protective plate with a light shielding portion, and the like in addition to the above-described configuration.
- the recognition code can be, for example, a code in which information on a test chart is recorded.
- the alignment mark may be a mark in which position information is recorded, but may further function as a recognition code in which information on a test chart or the like is recorded. These may be provided on a transparent protective plate with a light shielding part.
- the color chart of this aspect may have an IR cut filter.
- the transmission spectrum tends to transmit light in a wavelength region of 650 nm or more, and the light transmittance is high.
- dyes used for Ye, O, and R color bars tend not to absorb light on the long wavelength side from around 650 nm. For this reason, the transmission spectra of the respective colors overlap in the long wavelength region.
- the IR cut filter can be selected in consideration of the wavelength region to be blocked in accordance with the transmission spectral characteristics of each color bar. A conventionally known IR cut filter can be used.
- the size of the color chart of this aspect can be designed according to the applied captured image.
- a color bar having a size corresponding to the magnification of the objective lens of the microscope It can be set as the color chart for micro imaging in which the group was formed.
- a color bar group having a size corresponding to the captured image size is formed.
- a color chart for macro imaging can be obtained.
- the color chart of this aspect can be used for imaging devices, video devices, and peripheral devices that require color calibration. Among these, it can be suitably used for an imaging device for pathology.
- the present invention is not limited to the above embodiment.
- the above-described embodiment is an exemplification, and the present invention has substantially the same configuration as the technical idea described in the claims of the present invention, and any device that exhibits the same function and effect is the present invention. It is included in the technical scope of the invention.
- the calibration glass slide of the present invention includes a calibration pattern having a plurality of calibration pattern chips, a first spacer arranged around the calibration pattern, the calibration pattern, and the first spacer. At least one of a pair of protective base materials having at least a transmission part in a region overlapping in plan view with the calibration pattern, the first spacer, and the pair of protective base materials. Between the protective substrate and the first spacer, there is a second spacer arranged so as to overlap a part of the calibration pattern chip in plan view, and the second spacer It has at least an opening in a region overlapping the calibration pattern in plan view.
- an observation apparatus with an imaging apparatus including an imaging apparatus such as a TV camera or a digital camera
- an imaging apparatus with an imaging device a microscope with an imaging device in which the imaging device is attached to a microscope can be mentioned.
- an observation apparatus with an imaging device is used, the effect of being able to record the observation result, and the information input from the microscope can be immediately output to a display or printer, The effect is that it can be evaluated quickly. Therefore, an observation apparatus with an imaging device is suitably used in a wide range of fields such as a medical field.
- Patent Document 1 includes two or more color reference micro color filters for collecting a color as a comparison reference used for color evaluation and color correction of an image on one surface of a protective substrate.
- One or more micro color filter groups are arranged, and two or more color reference micro color filters belonging to the same group among the one or more micro color filter groups do not overlap each other on the surface of the protective substrate.
- the slide glass disclosed in Patent Document 1 has a structure in which a micro color filter is arranged on a protective substrate and the surface of the micro color filter is exposed. Therefore, when such an observation apparatus with an imaging device using a slide glass is used, for example, when a solvent or the like adheres to the surface of the micro color filter or when the dirt attached to the surface of the micro color filter is wiped off, The contact causes problems such as a decrease in the color density of the micro color filter and a change in pigment.
- the inventors of the present invention manufactured a calibration slide glass having a structure in which a calibration pattern chip (micro color filter) is sandwiched between a pair of protective substrates.
- the calibration pattern chips 10a and 10b are arranged so as to face each other via the calibration pattern chips 10a and 10b, and overlap the calibration pattern chips 10a and 10b in plan view.
- the slide glass 100 ′ having the spacer 30 was manufactured.
- the inventors of the present invention have obtained the following knowledge. That is, as shown in FIG. 21, the calibration pattern chip is sandwiched between a pair of protective substrates, so that adhesion of a solvent or the like to the calibration pattern chip surface and physical contact with the calibration pattern chip are prevented. It has been found that it is possible to suppress the occurrence of problems such as a decrease in the color density of the calibration pattern chip and a change in the pigment.
- the present invention has been made in view of the above circumstances, and has as its main object to provide a calibration glass slide that can suppress the appearance of Newton rings.
- FIG. 12 is a schematic plan view showing an example of the slide glass for calibration of the present invention.
- the calibration glass slide 200 of the present invention has a calibration pattern having a plurality of calibration pattern chips.
- FIG. 13 (a) is an enlarged view of a region R1 surrounded by a white broken line of the calibration glass slide 200 of the present invention shown in FIG. 12, and
- FIG. 13 (b) is an A-
- FIG. 13C is a cross-sectional view taken along line A, and
- FIG. 13C is an enlarged view of a region R2 surrounded by a black broken line of the calibration glass slide 200 shown in FIG. 13B.
- the calibration glass slide 200 of the present invention includes a calibration pattern 10 having a plurality of calibration pattern chips 10a, 10b, and 10c, and around the calibration pattern 10.
- a pair of first spacers 30 arranged to face each other via the first spacers 30 and the first spacers 30 and having at least a transmission part 21 in a region overlapping the calibration pattern 10 in plan view.
- the second spacer 40 is provided.
- the calibration slide glass 200 of the present invention is characterized in that the second spacer 40 has at least an opening A in a region overlapping the calibration pattern 10 in plan view.
- a conventional calibration glass slide has a configuration in which a calibration pattern is arranged on a protective substrate.
- the surface of the calibration pattern is exposed, so that the surface of the calibration pattern is contaminated, the color density is lowered due to physical contact, and further the change of the pigment is generated.
- the inventors of the present invention have a configuration in which, for example, as shown in FIG. 21, a calibration pattern 10 is disposed between a pair of protective base materials 20a and 20b to prevent exposure of the surface of the calibration pattern.
- a calibration glass slide was prepared.
- the second spacer has at least an opening in a region overlapping the calibration pattern in plan view, at least one protective group in which the calibration pattern and the second spacer are arranged is provided. Since a gap corresponding to the thickness of the second spacer can be provided between the transmission portions of the material, it is possible to provide a calibration slide glass that can suppress the appearance of Newton rings.
- the calibration glass slide of the present invention has a gap corresponding to the thickness of the second spacer between the calibration pattern chip and the transmission part of at least one protective substrate on which the second spacer is arranged.
- the surface having the gap is usually the observation side. Therefore, when gaps are arranged on both sides of the calibration pattern chip, both sides of the calibration glass slide can be used as the observation side, and on the side of the calibration pattern chip. In the case where a gap is arranged, one side of the calibration glass slide provided with the gap is the observation side.
- the size of the gap is not particularly limited as long as it can suppress the appearance of Newton rings due to the contact between the calibration pattern chip and the protective glass, and is appropriately adjusted according to the design of the calibration slide glass. can do.
- the thickness of the gap is such that the appearance of a Newton ring can be suppressed, and corresponds to the thickness of a second spacer described later.
- the thickness of the void is preferably in the range of 10 ⁇ m to 250 ⁇ m, more preferably in the range of 15 ⁇ m to 150 ⁇ m, and particularly preferably in the range of 20 ⁇ m to 80 ⁇ m.
- the gap thickness is equivalent to the code t 1 shown in FIG. 12 (c).
- the second spacer in the present invention is a part of the calibration pattern chip between the first spacer and at least one of the pair of protective base materials and the first spacer. And a member arranged so as to overlap in plan view.
- the second spacer according to the present invention has at least an opening in a region overlapping the calibration pattern in plan view.
- the first spacer 30 can be laminated around the calibration pattern. Note that the description of FIG. 15 will be described later, so description thereof is omitted here.
- the second spacer 40 is provided between the first spacer 30 and the pair of protective base materials 20 a and 20 b, that is, on both surfaces of the first spacer 30.
- it is preferably arranged so as to overlap a part of the calibration pattern chip 10 in plan view. This is because the gap A can be provided between the protective base materials 20a and 20b and the calibration pattern chip 10 on any surface of the calibration slide glass 200, and the appearance of Newton rings can be suppressed.
- the second spacer when the second spacer is arranged so as to overlap with a part of the calibration pattern chip in plan view, when at least an opening is formed in a region overlapping the calibration pattern in plan view, That is, when a gap is provided between the protective base material and the calibration pattern chip, it is possible to prevent positional deviation such as the calibration pattern chip being shifted into the area to be the gap.
- the second spacer in the present invention has at least an opening in a region overlapping the calibration pattern in plan view.
- the second spacer in the present invention may be arranged in a layered manner so as to overlap with the entire area other than the transmission part of the protective base material in plan view, and is an area other than the transmission part of the protective base material, It may be arranged in layers so that at least a part thereof overlaps with the surrounding area in the protective substrate.
- the 2nd spacer is arrange
- the second spacer has at least an opening in a region overlapping the calibration pattern in plan view, even if a gap is provided between the calibration pattern chip and the protective substrate, the second spacer is protected by pressure. It is possible to suppress a decrease in the strength of the calibration glass slide such that the base material is bent and cracked.
- the thickness of the second spacer in the present invention is not particularly limited and is appropriately adjusted according to the size of the gap to be provided between the calibration pattern chip and the protective substrate.
- the specific thickness of the second spacer is, for example, preferably within a range of 10 ⁇ m to 250 ⁇ m, more preferably within a range of 15 ⁇ m to 150 ⁇ m, and particularly preferably within a range of 20 ⁇ m to 80 ⁇ m. preferable.
- the thickness of the second spacer is within the above range, it is possible to provide a gap that can suppress the appearance of a Newton ring.
- any material can be used for the calibration glass slide of the present invention and can form at least an opening in a region overlapping the calibration pattern in plan view.
- a specific material of the second spacer for example, a material having a predetermined rigidity and easy to process is preferable.
- Metal such as stainless steel, iron-nickel alloy (42 alloy), copper, glass, plastic, etc. Etc.
- it is preferable to use a metal and it is more preferable to use stainless steel from the viewpoint of corrosion resistance and workability.
- the method for forming the second spacer in the present invention is not particularly limited as long as it is a method capable of forming the second spacer having a desired shape. Depending on the type of material used for the second spacer, etc. Can be selected as appropriate.
- the second spacer can be formed by a punching process or etching process of a metal plate, a punching process such as a punching process of a plastic plate, or a molding process such as plastic molding or printing process.
- the second spacer As a method of disposing the second spacer between the first spacer and the protective substrate so as to overlap with a part of the calibration pattern chip in plan view, for example, the second spacer is There is a method of adhering and arranging between the first spacer and the protective substrate so as to overlap a part of the calibration pattern chip in plan view.
- an adhesive is usually used, but in the present invention, it is preferable to use a liquid adhesive. This is because an increase in thickness due to the adhesive can be suppressed and a high adhesive strength can be obtained as compared with the case where an adhesive sheet or the like is used.
- a specific material used as the adhesive can be the same as that of a general material, and thus description thereof is omitted here.
- a groove for arranging the adhesive on the surface of the second spacer.
- a groove 60 for disposing a liquid adhesive on the surface of the second spacer 40 it is preferable to have a groove on a surface of the second spacer other than a region overlapping a part of the calibration pattern chip in plan view.
- the calibration pattern chip is shifted into the space region by the second spacer. Can be effectively prevented.
- the “surface of the second spacer” here refers not only to the surface of the second spacer that contacts the first spacer or the surface that contacts the protective substrate. , Including both a surface that contacts the first spacer and a surface that contacts the protective substrate.
- the depth of the groove is smaller than the thickness of the second spacer, and a liquid adhesive is disposed in the groove so that the second spacer is It is preferable that the depth is such that the spacer can be sufficiently adhered between the spacer and the protective substrate.
- the depth of the groove can be appropriately adjusted in accordance with the thickness of the second spacer.
- the ratio to the thickness of the second spacer is within a range of 10% to 90%. Among these, a range of 20% to 80% is preferable, and a range of 30% to 70% is particularly preferable.
- the specific depth of the groove is preferably in the range of 5 ⁇ m to 130 ⁇ m, for example, preferably in the range of 10 ⁇ m to 80 ⁇ m, and particularly preferably in the range of 10 ⁇ m to 40 ⁇ m. .
- the second spacer, the first spacer, and the protective substrate can be used as an adhesive escape groove when the liquid adhesive is disposed in the groove.
- the adhesive can be prevented from leaking from between the two. Therefore, it is possible to obtain a high quality slide glass for calibration.
- the depth of the grooves for example, corresponds to a code t 2 shown in FIG. 16.
- the size and number of the groove are not particularly limited, but it is preferable to adjust appropriately according to the shape of the opening of the second spacer, the amount of adhesive used, and the like.
- a method of forming a groove on the surface of the second spacer a method capable of forming a groove having a predetermined depth as described above is preferable, and the type of material used for the second spacer, etc. It can be selected as appropriate according to the conditions. For example, a method of forming a desired groove by performing a half etching process on the surface of the second spacer can be used.
- the 1st spacer in this invention is a member arrange
- the calibration pattern chip can be fixed at a predetermined position, and the calibration pattern chip can be prevented from being displaced in the length direction of the pair of protective substrates.
- the first spacer in the present invention is not particularly limited as long as it can be arranged around the calibration pattern, and may be composed of one layer or a plurality of layers.
- a plurality of thin first spacers 30 are stacked as shown in FIG. 15, for example, from the viewpoint of easy processing such as etching processing on the first spacers in forming the first spacers. It is preferable. Note that the description of FIG. 15 will be described later, so description thereof is omitted here.
- the thickness of one layer of the first spacer can be adjusted as appropriate according to the material used for the first spacer.
- a specific thickness of one layer of the first spacer is, for example, preferably in the range of 10 ⁇ m to 250 ⁇ m, more preferably in the range of 20 ⁇ m to 150 ⁇ m, and particularly in the range of 50 ⁇ m to 150 ⁇ m. Preferably there is.
- the thickness of one layer of the first spacer is within the above range, it is possible to easily perform processing such as etching processing in forming the first spacer.
- the total thickness of the first spacer of the present invention is appropriately adjusted according to the thickness of a calibration pattern chip to be described later, and is not particularly limited. For example, it is preferably within a range of 0.02 mm to 0.8 mm, more preferably within a range of 0.07 mm to 0.6 mm, and particularly preferably within a range of 0.1 mm to 0.4 mm. preferable.
- the calibration pattern chip can be sufficiently fixed.
- the material of the first spacer in the present invention is not particularly limited as long as it is a material that can be arranged around the calibration pattern and can fix the calibration pattern chip.
- a specific material of the first spacer for example, a material having a predetermined rigidity and easy to process is preferable.
- a metal such as stainless steel, iron-nickel alloy (42 alloy), copper alloy, glass, Examples include plastics.
- it is preferable to use a metal, and it is more preferable to use stainless steel from the viewpoint of corrosion resistance and workability.
- the method for forming the first spacer in the present invention is not particularly limited as long as it is a method capable of forming the first spacer having a desired shape. Depending on the type of material used for the first spacer, etc. Can be selected as appropriate. Note that a specific method for forming the first spacer can be the same as the method for forming the second spacer described in the section of “1. Second spacer” above. Omitted.
- examples of the method of arranging the first spacer around the calibration pattern include a method of arranging the first spacer by adhering it to a predetermined position of the protective substrate.
- an adhesive is usually used, but in the present invention, it is preferable to use a liquid adhesive. This is because an increase in thickness due to the adhesive can be suppressed and a high adhesive strength can be obtained as compared with the case where an adhesive sheet or the like is used.
- a specific material used as the adhesive can be the same as that of a general material, and thus description thereof is omitted here.
- the surface of the first spacer means the first spacer when the first spacer is composed of a plurality of layers in addition to the surface where the first spacer contacts the protective substrate.
- the surface which contacts each other, the surface where a 1st spacer contacts a 2nd spacer, etc. are included.
- the specific depth, size, formation method, and the like of the groove can be the same as the contents described in the above section “1. Second spacer”, and thus the description thereof is omitted here.
- the calibration pattern in the present invention is a member having a plurality of calibration pattern chips.
- the calibration pattern in the present invention is appropriately selected according to the use of the calibration slide glass of the present invention, and is not particularly limited.
- the calibration pattern used for the calibration slide glass can be used for evaluation of reproducibility of a measurement image by the microscope with an imaging device.
- examples of the calibration pattern in this case include a color chart, a gray scale, a resolution chart, an inmega chart, a cross hatch chart, or a combination thereof.
- the number of calibration patterns in the present invention can be appropriately adjusted according to the number of objective lenses such as a microscope with an imaging device in which the calibration slide glass of the present invention is used.
- calibration patterns are provided at three locations.
- the calibration pattern in the present invention is designed so that the size thereof changes in stages and the patterns are similar.
- the size of the calibration pattern is designed to be able to be accommodated in the field of view of the microscope measurement by the objective lens.
- the shape of the calibration pattern includes a square, a polygon, a circle, and the like.
- the calibration pattern thickness in the present invention is appropriately adjusted according to the design of the calibration slide glass of the present invention, and is not particularly limited.
- the thickness of the specific calibration pattern is preferably, for example, in the range of 0.02 mm to 0.8 mm, more preferably in the range of 0.07 mm to 0.6 mm, particularly 0.1 mm. It is preferably within a range of ⁇ 0.4 mm.
- the calibration pattern in the present invention is an array of calibration pattern chips for each color for color evaluation.
- the calibration pattern chip according to the present invention can be composed of colored portions 10a ′′ and 10b ′′ and transparent portions 10a ′ and 10b ′.
- the arrangement of the colored portion and the transparent portion is not particularly limited.
- it is preferable that the arrangement of the colored portion and the transparent portion is the same in each calibration pattern chip.
- the colored portions 10a "and 10b" are arranged on the surface on the protective base material 20a side, and the colored portions
- the transparent portions 10a ′ and 10b ′ are arranged on the surface of the protective substrate 20b side of 10a ′′ and 10b ′′.
- the following effects can be obtained by aligning the colored portion and the transparent portion with each calibration pattern chip. That is, since the colored portion and the transparent portion have different refractive indexes, light tends to be refracted at the interface between the colored portion and the transparent portion when light passes through the calibration pattern chip. At this time, when the arrangement of the colored portion and the transparent portion is different for each calibration pattern chip, the angle of the light emitted from each calibration pattern chip varies due to the difference in the position of the interface where light refraction occurs. The acquisition of desired color information at the light receiving unit may be difficult. On the other hand, as described above, when the colored portions and the transparent portions are arranged in the respective calibration pattern chips, it is possible to suppress the occurrence of the above problem.
- the calibration pattern chip in the present invention can be obtained by, for example, cutting a color chart formed in a size larger than the size of the calibration pattern chip into a desired size.
- the color chart for example, “Standard Color Bar Chart” manufactured by Dai Nippon Printing Co., Ltd., which is the reference color of the microscope with an imaging device, can be used.
- the “standard color bar chart” is composed of predesigned red (R), green (G), blue (B), yellow (Y) cyan (C), and magenta (M). It is 175 mm x 245 mm.
- the calibration pattern chip in the present invention is used as a reference color for evaluation of reproducibility of a measurement image by a microscope with an imaging device.
- reference colors at this time for example, red (R), green (G), Blue (B), yellow (Y), cyan (C), magenta (M), and the like can be given.
- the colors used as the reference colors are not limited to the six colors described above, and can be appropriately adjusted according to the object to be observed using the microscope with an imaging device.
- the red and green colors stained by hematoxylin and eosin staining which are common staining methods of biological tissues, and other staining methods
- a color selected from a color, a blue color, a cyan color, a magenta color, a yellow color, and other system colors can be used as a reference color.
- the plurality of calibration pattern chips in the calibration pattern may be arranged in a line, may be arranged in a lattice shape, or may be arranged in a circular shape.
- the calibration pattern 10 shows an example in which the calibration pattern chips 10a and 10b are arranged in a 2 ⁇ 5 grid.
- a colorless translucent blank region 10c may be provided between the upper calibration pattern chip and the lower calibration pattern chip. good.
- the gray scale is a scale in which gradation is expressed stepwise by changing the gray reflection density between white and black.
- the transmissive gray scale will be described.
- the gray scale as the calibration pattern can be configured by arranging calibration pattern chips for each gradation having different transmittances. The arrangement can be arranged in a line or in a lattice so that the transmittance changes stepwise.
- a gray scale formation method for example, a sputtering method in which a plurality of metal films having different thicknesses are formed on a support such as glass or film, a gradation on a support, or a coating on a support. Examples thereof include a printing method, an ink jet method, a photolithography method, and the like that can form a halftone dot covering portion having a different area.
- the calibration pattern in the present invention may have an IR cut filter or an ND filter as necessary.
- an IR cut filter 80 for removing a specific wavelength may be provided in a region overlapping the calibration pattern chips 10a and 10b in plan view.
- the IR cut filter 80 it is possible to adjust the hue, saturation, brightness, luminance, and the like for the single-layer calibration pattern chip.
- the second spacer 40 is placed between the calibration pattern chips 10 a and 10 b and the IR cut filter 80 and a part of the calibration pattern chip 10.
- the gap A can be provided so as to overlap in plan view, and generation of Newton rings can be suppressed.
- the calibration pattern chips that are the same measurement target among the plurality of calibration pattern chips have a uniform optical path length in the thickness direction of the calibration pattern chip. Details will be described below.
- the calibration slide glass has a function of providing color information as a reference for comparison when color evaluation or color correction is performed on a sample image captured using an observation apparatus, for example.
- each of the plurality of calibration pattern chips constituting the calibration pattern has color information, and by measuring the plurality of calibration pattern chips and providing the color information, the observation device is It is possible to perform color evaluation and color correction of the sample image picked up.
- the calibration glass slide measures a plurality of calibration pattern chips when providing color information. The plurality of calibration pattern chips measured at this time are measured in the thickness direction of the calibration pattern chip. It is preferable that the optical path length is uniform. Especially, it is preferable that the optical path length of the thickness direction of all the calibration pattern chips which comprise a calibration pattern is uniform.
- the “plurality of calibration pattern chips measured at this time” are calibration pattern chips that are measured by one calibration, and are a plurality of calibration pattern chips that are the same measurement target. For example, when a white calibration pattern chip is used as a reference color and the color information of a pattern chip exhibiting other colors is measured, the white calibration pattern chip and the pattern chip exhibiting other colors are “same measurement”. It becomes "subject”. Further, the calibration pattern has a gray chip for performing luminance adjustment in addition to the calibration pattern chip exhibiting a predetermined color, and the gray chip and the calibration pattern chip can be calibrated once. In the case of measurement, the gray chip and the calibration pattern chip are “same measurement object”.
- the calibration pattern has a resolution chip in addition to the calibration pattern chip exhibiting a predetermined color, it is not always necessary to measure the resolution chip and the calibration pattern chip by one calibration.
- the resolution chart and the calibration pattern chip can be set as “same measurement object” as necessary.
- 22A and 22B have a red calibration pattern chip 10R, a white calibration pattern chip 10W, and a green calibration pattern chip 10G as the calibration pattern chips, and the red calibration pattern chip 10R and the green calibration chip 10G.
- An IR cut filter 80 is disposed in a region overlapping the calibration pattern chip 10G in plan view. Note that the other configurations in FIGS. 22A and 22B are the same as those in FIG. 15 described above, and thus are not described here.
- the first spacer and the second spacer are omitted for the sake of simplicity, and the colored portion and the transparent portion of the calibration pattern chip are also omitted. .
- the parallel light transmitted through the red calibration pattern chip 10R is received by the light receiving unit 300R to obtain a desired color. Information is measured. Further, the parallel light transmitted through the white calibration pattern chip 10W is received by the light receiving unit 300W, and desired color information is measured. Further, the parallel light transmitted through the green calibration pattern chip 10G is received by the light receiving unit 300G, and desired color information is measured.
- the parallel light transmitted through the red calibration pattern chip 10R is received by the light receiving unit 300G, and desired color information is measured.
- the non-parallel light transmitted through the red calibration pattern chip 10R and the green calibration pattern chip 10G is In some cases, the light receiving unit 300R and the light receiving unit 300G do not receive the light sufficiently and it is difficult to measure desired color information. Then, for example, when the white calibration pattern chip 10W is used as a reference color and the red calibration pattern chip 10R and the green calibration pattern chip 10G are measured, the measurement results are misaligned, and accurate calibration is performed. May be difficult to do. As a result, it may be difficult to perform highly accurate measurement by an observation apparatus with an imaging device using a calibration slide glass including a calibration pattern chip. Examples of the “non-parallel light” include an imaging optical system such as a microscope.
- each calibration pattern chip is Based on the difference in the optical path length, it was found that the light to be received by each light receiving portion could not be received sufficiently, and as a result, the color information was shifted. Based on such knowledge, the inventors of the present invention have solved the above problems by making the optical path lengths in the thickness direction uniform for all the calibration pattern chips to be measured. That is, in the present invention, by making uniform the optical path length in the thickness direction of all calibration pattern chips to be measured with the same, with an imaging device using a calibration slide glass having the calibration pattern chip With this observation device, it becomes possible to perform measurement with higher accuracy.
- uniform optical path length means observation with an imaging device using a calibration glass slide For example, the difference in the optical path length in the thickness direction of all the calibration pattern chips that are the same measurement target is at least 15% or less. Among these, 10% or less is preferable.
- FIG. 23 is a schematic diagram showing an example in which the optical path length in the thickness direction of the calibration pattern chip to be the same measurement target is uniformly adjusted in the calibration glass slide shown in FIG. 22 (b) described above.
- the red calibration pattern chip 10R and the green calibration pattern chip 10G have the IR cut filter 80 disposed so as to overlap in plan view, whereas the white calibration pattern chip 10W includes The IR cut filter 80 is not disposed.
- the slide glass for calibration shown in FIG. 22 has an uneven optical path length in this respect. Therefore, in the calibration slide glass shown in FIG.
- the IR cut filter 80 and the adjustment filter 8 ′ having a refractive index close to each other are arranged on the white calibration pattern chip 10W so as to overlap in plan view, and each calibration pattern is arranged.
- the optical path length in the thickness direction of the chip was adjusted uniformly. Accordingly, for example, when the white calibration pattern chip 10W is used as a reference color and the red calibration pattern chip 10R and the green calibration pattern chip 10G are measured, accurate calibration can be performed. As a result, more accurate measurement can be performed by an observation device with an imaging device using a calibration glass slide provided with a calibration pattern chip.
- the adjustment filter 8 ′ used at this time is a member whose material and thickness are adjusted so as to approach the refractive index of the IR cut filter 80.
- a member made of the same material as the base material of the IR cut filter 80 may be used as the adjustment filter 8 ′, or the IR cut filter 80 may be used.
- the adjustment filter 8 ' is the former include soda glass, quartz glass, optical glass BK7, and the like.
- the present invention as a method for making the optical path lengths in the thickness direction uniform for all the calibration pattern chips that are the same measurement target, for example, there is a method of aligning the number of calibration pattern chips that are the same measurement target. .
- aligning the number of layers it is preferable to select materials having similar layers. This is because the optical path length can be made more uniform.
- the number of interfaces through which light is transmitted is reduced. It can be considered that there is an effect that the refraction of light is uniform.
- the red calibration pattern chip 10R and the green calibration pattern chip 10G when the red calibration pattern chip 10R and the green calibration pattern chip 10G are provided, and the white calibration pattern chip 10W has a gap, the red calibration pattern The chip 10R and the green calibration pattern chip 10G have a layer number of 1, whereas the white calibration pattern chip 10W has a layer number of 0, resulting in a difference in the number of layers.
- a layer made of a material having a refractive index close to that of the red calibration pattern chip 10R and the green calibration pattern chip 10G is provided as the white calibration pattern chip 10W.
- the layer made of a material having a refractive index close to that of the red calibration pattern chip 10R and the green calibration pattern chip 10G include soda glass.
- a red calibration pattern chip 10R, a white calibration pattern chip 10W, and a green calibration pattern chip 10G are included, and the red calibration pattern chip 10R and the green calibration pattern chip 10G are included.
- the red calibration pattern chip 10R and the green calibration pattern chip 10G have two layers, whereas the white calibration pattern chip 10W The number of layers is 1, and there is a difference in the number of layers.
- the IR cut filter 80 and the adjustment filter 8 ′ having a refractive index close to the white calibration pattern chip 10W may be arranged so as to overlap in plan view. preferable.
- the calibration pattern glass shown in FIG. 26A in which the calibration pattern chips 10a and 10b and the ND filter 90 are arranged so as to overlap only the calibration pattern chip 10a in plan view, and the calibration The ND filter 90 so as to overlap the pattern chip 10a, 10b, the calibration pattern chip 10a in plan view, and the adjustment filter 90 ′ containing the same material as the ND filter 90 so as to overlap the calibration pattern chip 10b in plan view.
- Soda glass was used for the calibration pattern chip, and a filter designed to have a transmittance of about 60% was used as the ND filter.
- the adjustment filter 90 ′ is made of transparent glass made of the same material as the base material of the ND filter 90.
- the non-parallel light h is irradiated and the light transmitted through the calibration pattern chips 10a and 10b, the ND filter 90, and the adjustment filter 90 ′ is received by the light receiving unit.
- Light was received by 300a and 30b, and the transmittance was measured.
- FIG. 27 in FIG.
- the transmittance is around 10%, which is accurate. Measurement could not be performed.
- the transmittance is about 60% as designed, and accurate measurement can be performed. It was.
- the optical path lengths in the thickness direction of all the calibration pattern chips that are the same measurement target are uniform, and the IR cut filter 80 and the ND filter shown in FIG. 25B and FIG.
- the IR cut filter 80 and the ND filter 90 may be arranged separately for each calibration pattern chip.
- Each calibration pattern chip may be integrally arranged.
- the protective base material in this invention is a member which is arrange
- the “transmission part” refers to an area that transmits at least visible light, for example, an area indicated by reference numeral 20 shown in FIGS. 13B and 13C.
- the shape of the transmission part is usually a rectangular shape as shown in FIGS.
- the protective substrate according to the present invention it is sufficient that at least a transmission part is formed in a region overlapping the calibration pattern in plan view. Specifically, for example, as shown in FIG. 13 (c), the width w 2 smaller width w 1 of the transmission portion than the calibration pattern chip 10a, and the transparent portion than the two ends of the calibration pattern chip It is sufficient if both ends are located inside.
- the protective base material in the present invention is disposed so as to face both surfaces of the calibration pattern.
- the transmitting portions of the pair of opposing protective base materials are formed at the predetermined positions described above.
- the position and the width of the transmission part in each protective substrate may be the same or different.
- the transmissive portion in each protective base material when the position and width of the transmissive portion in each protective base material are different, from the transmissive portion of the protective base material provided on the observation side of the calibration slide glass, It is preferable that a region other than the transmission part of the protective base material provided on the side opposite to the observation side is not observed. That is, in the present invention, for example, as shown in FIG. 17, when the width of the transmissive part 21 in each protective base material 20a, 20b is different, the side indicated by the narrower arrow of the transmissive part 21 is The observation side of the calibration glass slide is preferably used.
- the difference is preferably within 0.2 mm, and more preferably within 0.1 mm. It is preferable that The difference in the position and width of the transmission part in each protective substrate is within the above range, so that the outline of the calibration pattern chip can be clarified when the calibration glass slide is observed from a predetermined surface. High calibration glass slide. Note that the difference between the position and the width of the transmission portion of each protective substrate, for example, corresponds to a code w 3 shown in FIG. 17.
- the width of the transmission part in the protective base material is appropriately adjusted according to the design of the calibration glass slide, and is not particularly limited.
- the size of the protective substrate is appropriately selected according to the size of the calibration slide glass of the present invention, and is not particularly limited. As a specific size of the protective substrate, for example, it is preferable that the short side is 26 ⁇ 0.1 mm and the long side is 76 ⁇ 0.1 mm.
- the thickness of the protective substrate is preferably in the range of 0.2 mm to 0.4 mm, for example.
- the material used for the protective substrate is preferably a material that can protect, for example, a calibration pattern sandwiched between a pair of protective substrates from scratches and dust.
- Specific examples of the material for the protective substrate include glass and plastic.
- glass is usually used as the material for the protective substrate.
- a plastic for the material of a protective base material it is preferable to use the plastic which does not contain a filler etc. from a viewpoint of enabling a more favorable microscope measurement.
- the method for forming the protective substrate is not particularly limited as long as it can form a desired protective substrate having a transmission part.
- a silver salt emulsion is applied to the surface of a colorless and translucent substrate, and a desilvering treatment is performed on a predetermined region to form a transmission portion to form a protective substrate.
- the protective base material may be comprised from 1 layer, and may be comprised from multiple layers.
- sealing part In this invention, it is preferable to have the sealing part arrange
- FIG. 18 is a schematic perspective view showing an example of the slide glass for calibration of the present invention.
- the slide glass for calibration 200 of the present invention has a sealing portion 50 disposed along the outer periphery of the protective base materials 20a and 20b between the pair of protective base materials 20a and 20b. Is preferred.
- the sealing part 50 By having the sealing part 50, it can suppress that the side surface of the 1st spacer 30 and the 2nd spacer 40 is exposed, Therefore It becomes possible to raise the mechanical strength of the slide glass 200 for a calibration. .
- the microscope with an imaging device using the calibration glass slide of the present invention is used at a medical site or the like, it is possible to suppress the entry of a solvent or the like into the calibration glass slide. .
- reference numerals not described in FIG. 18 can be the same as those in FIGS. 13A to 13C, and thus description thereof is omitted here.
- the sealing portion in the present invention is disposed between the pair of protective base materials 20a and 20b along the outer periphery of the protective base materials 20a and 20b, so that the first spacer 30 and the first spacer 30 It is preferable to have a function of preventing the side surface of the second spacer 40 from being exposed.
- the sealing part in this invention can be formed by pouring a hardening
- the sealing part in the present invention can be formed, for example, by processing a sealing layer having a resin material into a predetermined shape.
- the specific curing agent or resin material used for the sealing portion is not particularly limited as long as it is a material capable of forming a desired sealing portion, and examples thereof include general curing agents and resin materials. . Further, the resin material may have transparency or light shielding properties.
- the thickness of the sealing portion in the present invention can be appropriately adjusted according to the configuration of the calibration slide glass of the present invention and is not particularly limited, but usually corresponds to the distance between a pair of protective substrates, and This corresponds to the sum of the thickness of the spacer and the thickness of the second spacer. Therefore, the description about the specific thickness of a sealing part is abbreviate
- the sealing portion is protected.
- position to a base material is mentioned.
- an adhesive is usually used, but in the present invention, it is preferable to use a liquid adhesive. This is because an increase in thickness due to the adhesive can be suppressed and a high adhesive strength can be obtained as compared with the case where an adhesive sheet or the like is used.
- a specific material used as the adhesive can be the same as that of a general material, and thus description thereof is omitted here.
- a groove for arranging the adhesive may be provided on the surface of the sealing portion.
- surface of a sealing part here refers to the surface which contacts a protection base material, it usually points out both surfaces of a sealing part.
- the pair of protective substrates preferably have an origin mark on the surface of one of the protective substrates.
- one protective base material points out the protective base material of the direction used as the observation side of the slide glass for calibration normally.
- the surface of the protective base material here refers to the surface of the side where a pair of protective base material opposes normally.
- the origin mark when the origin mark is provided on the surface of one of the protective base materials, the origin mark usually overlaps the transparent portion of the protective base material, the calibration pattern chip, and the opening of the second spacer in plan view. It is formed in such a position. This is because the origin mark can be illuminated with the transmitted light that passes through the calibration glass slide of the present invention.
- FIG. 19A is a schematic plan view showing an example of the slide glass for calibration of the present invention
- FIG. 19B is an enlarged view of the region R3 in the slide glass for calibration of the present invention shown in FIG. FIG.
- the calibration glass slide 200 of the present invention preferably has an origin mark 60 on the surface.
- the shape and size of the origin mark in the present invention is not particularly limited as long as it can define the x-axis line, the y-axis line, etc., and can be recognized as the origin mark, and is not particularly limited. Can be appropriately adjusted according to the design of the slide glass for use.
- the method of forming the origin mark in the present invention is not particularly limited as long as a desired origin mark can be formed.
- the origin mark can be formed by the same method as that of the transmission part in the protective substrate.
- Alignment Mark In the present invention, it is preferable to form an alignment mark for preventing misalignment on the pair of protective base materials, the first spacer, the second spacer, and the like.
- the position where the alignment mark is formed is not particularly limited as long as it does not overlap with the calibration pattern or the origin mark, and can be appropriately selected according to the configuration of the calibration slide glass. Further, the number of alignment marks is not particularly limited, and can be appropriately adjusted according to the configuration of the calibration slide glass. In the present invention, for example, as shown in FIG. 18, alignment marks 70 can be formed at the four corners of each member.
- 20 (a) to 20 (d) are explanatory views for explaining the alignment mark in the present invention.
- the alignment mark 70 having a predetermined shape is formed, so that the members overlap in plan view based on the alignment mark.
- the positional accuracy during assembly of each member can be improved, and a high-quality calibration slide glass can be obtained.
- the method for forming the alignment mark on each member is not particularly limited as long as it can form a desired alignment mark, and can be appropriately selected according to the material used for each member.
- a method of forming the alignment mark on the protective base material for example, the same forming method as that of the transmission part in the protective base material can be mentioned.
- a method for forming alignment marks on the first spacer and the second spacer for example, a punching process or etching process of a metal plate, a punching process by a punching process of a plastic plate, a plastic molding or a printing process, etc. Examples include molding.
- Example 1 A transmission type color calibration chart comprising six color bars of R, G, B, Ye, Cy, and W and showing the spectral spectrum of FIG. 2 and the xy chromaticity diagram of FIG. 3 was prepared.
- the five color bars other than W are prepared by applying a silver salt emulsion prepared by adding a solution of potassium bromide and silver nitrate to gelatin on a glass plate, and then desilvering the dried silver salt photographic plate.
- a dyed substrate was used in which the substrate was dyed with a dye corresponding to each color.
- the dye an acid dye that is generally used in accordance with the color of each color bar was used.
- the dyeing method is similar to a generally popular production method.
- a dyeing solution in which an acid dye and an auxiliary agent are mixed is prepared, the substrate is immersed in the dyeing solution, and dyeing proceeds to a predetermined concentration.
- the substrate was taken out and washed with water.
- the transmission color calibration chart was formed by laminating a surface to be recognized by the device as an upper surface, and from the uppermost surface in order of a transparent protective plate with a light-shielding portion, each color bar, and a transparent substrate.
- Each color bar (dyed substrate) was arranged on a transparent substrate (glass substrate) in the order of arrangement of B, Cy, G, Ye, R, and W.
- For the W color bar a glass substrate serving as a transparent substrate was disposed.
- the color bars other than W were arranged on the transparent substrate through an IR cut filter.
- Table 1 shows the peak wavelength of each color bar.
- Example 2 In addition to the six color bars of Example 1, it is composed of a total of nine color bars including the three colors V, NIR, and O, and shows the spectral spectrum of FIG. 6 and the xy chromaticity diagram of FIG. A transmission color calibration chart was prepared. Three color bars of V, NIR, and O were obtained by the same method as the method of forming the color bars of the other colors in Example 1. The transmission type color calibration chart was formed in the same manner as in Example 1. Each color bar (dyed substrate) was arranged on a transparent substrate (glass substrate) in the order of arrangement of V, B, Cy, G, Ye, O, R, NIR, and W. For the W color bar, a glass substrate serving as a transparent substrate was disposed.
- color bars other than NIR and W were arranged on a transparent substrate through an IR cut filter.
- the A type 50% 620 nm
- the B type 50% 665 nm
- Example 3 In addition to the nine color bars of Example 2, Mg was added to form a total of 10 color bars, and a transmission type color calibration chart showing the spectral spectrum of FIG. 9 and the xy chromaticity diagram of FIG. 10 was created. .
- the Mg color bar was obtained by the same method as the method for forming the color bars of other colors in Example 1.
- the transmission type color calibration chart was formed in the same manner as in Example 1.
- Each color bar was arranged on the transparent substrate in the order of arrangement of V, B, Cy, G, Ye, O, R, Mg, NIR, and W.
- color bars other than NIR and W were arranged on a transparent substrate through an IR cut filter.
- Table 2 shows the relative wavelengths of the V and NIR color bars and the peak wavelengths of the O and Mg color bars.
- Table 3 shows the coverage ratio of pointer colors included in the color gamut in the xy chromaticity diagram of the transmission color calibration chart obtained in Examples 1 to 3.
- the color gamut is shown in FIG. 3 as a pentagon connecting the coordinates of five colors excluding W, and in FIGS. 7 and 10 an octagon connecting the coordinates of eight colors excluding W and Mg.
Landscapes
- Physics & Mathematics (AREA)
- General Physics & Mathematics (AREA)
- Spectroscopy & Molecular Physics (AREA)
- Chemical & Material Sciences (AREA)
- Analytical Chemistry (AREA)
- Engineering & Computer Science (AREA)
- Optics & Photonics (AREA)
- Health & Medical Sciences (AREA)
- Theoretical Computer Science (AREA)
- General Health & Medical Sciences (AREA)
- Biochemistry (AREA)
- Mathematical Physics (AREA)
- Life Sciences & Earth Sciences (AREA)
- Immunology (AREA)
- Pathology (AREA)
- Business, Economics & Management (AREA)
- Toxicology (AREA)
- Educational Technology (AREA)
- Entrepreneurship & Innovation (AREA)
- Educational Administration (AREA)
- Multimedia (AREA)
- Signal Processing (AREA)
- Biomedical Technology (AREA)
- Spectrometry And Color Measurement (AREA)
- Color Television Image Signal Generators (AREA)
Priority Applications (12)
| Application Number | Priority Date | Filing Date | Title |
|---|---|---|---|
| KR1020217038613A KR102432232B1 (ko) | 2016-03-31 | 2017-03-30 | 투과형 색교정용 차트 |
| EP17775444.7A EP3454024A4 (en) | 2016-03-31 | 2017-03-30 | TRANSMISSION COLOR CALIBRATION DIAGRAM AND SLIDING CALIBRATION GLASS |
| CN202210658889.7A CN114928743A (zh) | 2016-03-31 | 2017-03-30 | 透射型颜色校准用图表以及校准用滑动玻璃 |
| CN202110650456.2A CN113311659B (zh) | 2016-03-31 | 2017-03-30 | 透射型颜色校准用图表以及校准用滑动玻璃 |
| KR1020217011982A KR102286314B1 (ko) | 2016-03-31 | 2017-03-30 | 교정용 슬라이드 글래스 |
| EP20182419.0A EP3739311A1 (en) | 2016-03-31 | 2017-03-30 | Transmission-type color calibration chart and calibration slide glass |
| CN201780020175.0A CN108885135B (zh) | 2016-03-31 | 2017-03-30 | 透射型颜色校准用图表以及校准用滑动玻璃 |
| KR1020187028833A KR102333044B1 (ko) | 2016-03-31 | 2017-03-30 | 투과형 색교정용 차트 및 교정용 슬라이드 글래스 |
| CN202110169944.1A CN112987483B (zh) | 2016-03-31 | 2017-03-30 | 校准用滑动玻璃 |
| US16/084,205 US11340115B2 (en) | 2016-03-31 | 2017-03-30 | Transmission type color calibration chart and calibration slide glass |
| US17/464,389 US11371886B2 (en) | 2016-03-31 | 2021-09-01 | Transmission type color calibration chart and calibration slide glass |
| US17/726,804 US11635329B2 (en) | 2016-03-31 | 2022-04-22 | Transmission type color calibration chart and calibration slide glass |
Applications Claiming Priority (4)
| Application Number | Priority Date | Filing Date | Title |
|---|---|---|---|
| JP2016-071831 | 2016-03-31 | ||
| JP2016071831 | 2016-03-31 | ||
| JP2016-072002 | 2016-03-31 | ||
| JP2016072002 | 2016-03-31 |
Related Child Applications (2)
| Application Number | Title | Priority Date | Filing Date |
|---|---|---|---|
| US16/084,205 A-371-Of-International US11340115B2 (en) | 2016-03-31 | 2017-03-30 | Transmission type color calibration chart and calibration slide glass |
| US17/464,389 Continuation US11371886B2 (en) | 2016-03-31 | 2021-09-01 | Transmission type color calibration chart and calibration slide glass |
Publications (1)
| Publication Number | Publication Date |
|---|---|
| WO2017170910A1 true WO2017170910A1 (ja) | 2017-10-05 |
Family
ID=59965966
Family Applications (1)
| Application Number | Title | Priority Date | Filing Date |
|---|---|---|---|
| PCT/JP2017/013358 WO2017170910A1 (ja) | 2016-03-31 | 2017-03-30 | 透過型色較正用チャートおよび較正用スライドガラス |
Country Status (5)
| Country | Link |
|---|---|
| US (3) | US11340115B2 (zh) |
| EP (2) | EP3739311A1 (zh) |
| KR (3) | KR102333044B1 (zh) |
| CN (4) | CN112987483B (zh) |
| WO (1) | WO2017170910A1 (zh) |
Cited By (3)
| Publication number | Priority date | Publication date | Assignee | Title |
|---|---|---|---|---|
| CN111201425A (zh) * | 2017-10-19 | 2020-05-26 | 大日本印刷株式会社 | 色彩校正用观察器、及使用其的色彩校正套组 |
| WO2020166697A1 (ja) | 2019-02-14 | 2020-08-20 | 大日本印刷株式会社 | 医療機器用色修正装置 |
| WO2021075406A1 (ja) * | 2019-10-15 | 2021-04-22 | 大日本印刷株式会社 | 透過型カラー階調チャート、透過型カラー階調チャート装置及びグレー階調チャート |
Families Citing this family (4)
| Publication number | Priority date | Publication date | Assignee | Title |
|---|---|---|---|---|
| EP3562379B1 (en) * | 2016-12-30 | 2024-01-31 | Barco NV | System and method for camera calibration |
| TWI810247B (zh) * | 2018-02-26 | 2023-08-01 | 瑞士商赫孚孟拉羅股份公司 | 用於校準和使用攝影機來偵測樣品中的分析物之方法及系統 |
| GB2599751B (en) * | 2021-04-17 | 2022-10-12 | Ffei Ltd | Method of forming an imaging calibration device |
| DE102022111476A1 (de) | 2022-05-09 | 2023-11-09 | Tdk Electronics Ag | Kondensatorbauteil, Verwendung eines Kondensatorbauteils und Verfahren zur Herstellung |
Citations (6)
| Publication number | Priority date | Publication date | Assignee | Title |
|---|---|---|---|---|
| JP2003172659A (ja) * | 2001-12-07 | 2003-06-20 | Fuji Photo Film Co Ltd | 透過型高彩度色再現評価用チャート |
| JP2010151830A (ja) * | 1999-10-29 | 2010-07-08 | Cytyc Corp | 画像生成システム内のサンプル中の対象領域の位置を検証する装置および方法 |
| JP2013088226A (ja) * | 2011-10-17 | 2013-05-13 | Nippon Hoso Kyokai <Nhk> | 広色域カラーチャート、広色域カラーチャート装置及び広色域カラーチャートを用いた色再現評価方法 |
| JP2013134170A (ja) * | 2011-12-27 | 2013-07-08 | Nippon Hoso Kyokai <Nhk> | 高彩度色光生成装置及び色再現評価方法 |
| US20130262008A1 (en) * | 2012-03-28 | 2013-10-03 | Nithya Ramanathan | Measurement of light-absorption qualities in the visible spectrum using a camera |
| JP2015102708A (ja) * | 2013-11-26 | 2015-06-04 | 大日本印刷株式会社 | 顕微鏡画像校正用スライドガラス |
Family Cites Families (44)
| Publication number | Priority date | Publication date | Assignee | Title |
|---|---|---|---|---|
| US5571721A (en) * | 1994-05-05 | 1996-11-05 | Erie Scientific Company | Improved biological culture slide and method of making same |
| US6373573B1 (en) * | 2000-03-13 | 2002-04-16 | Lj Laboratories L.L.C. | Apparatus for measuring optical characteristics of a substrate and pigments applied thereto |
| JPH09203865A (ja) | 1996-01-25 | 1997-08-05 | Nikon Corp | 指標ガラス及びそれを用いた蛍光光学機器 |
| JPH11341502A (ja) * | 1998-05-27 | 1999-12-10 | Sony Corp | 固体撮像素子の信号処理回路およびカメラシステム |
| US7570282B1 (en) * | 1998-12-09 | 2009-08-04 | Aptina Imaging Corporation | Color correction of multiple colors using a calibrated technique |
| US6505937B1 (en) * | 2000-03-31 | 2003-01-14 | Titmus Optical, Inc. | Test slide for a vision testing apparatus |
| JP4419265B2 (ja) * | 2000-04-06 | 2010-02-24 | ソニー株式会社 | カメラの性能評価システム及びカメラの性能評価方法 |
| TW554625B (en) * | 2000-12-08 | 2003-09-21 | Silicon Graphics Inc | Compact flat panel color calibration system |
| US7012633B2 (en) * | 2002-03-06 | 2006-03-14 | Radiant Imaging, Inv. | Color calibration method for imaging color measurement device |
| JP3719424B2 (ja) * | 2002-05-09 | 2005-11-24 | セイコーエプソン株式会社 | 画像処理システム、プロジェクタ、画像処理方法、プログラムおよび情報記憶媒体 |
| JP2004021164A (ja) | 2002-06-20 | 2004-01-22 | Matsushita Electric Ind Co Ltd | カラー画像形成装置および濃度検出装置 |
| US20040056965A1 (en) * | 2002-09-20 | 2004-03-25 | Bevans Michael L. | Method for color correction of digital images |
| DE60321159D1 (de) | 2002-10-18 | 2008-07-03 | Hamamatsu Photonics Kk | Schiebeglas, abdeckglas und pathologisches diagnosesystem |
| AU2003283696A1 (en) * | 2002-12-12 | 2004-06-30 | Koninklijke Philips Electronics N.V. | Transformation structures for approximating color matching functions |
| CN2598149Y (zh) * | 2002-12-30 | 2004-01-07 | 胜开科技股份有限公司 | 光传感器封装改良构造 |
| JP4270949B2 (ja) * | 2003-06-10 | 2009-06-03 | 株式会社トプコン | キャリブレーションチャート画像表示装置、キャリブレーション装置、キャリブレーション方法 |
| JP2005347397A (ja) | 2004-06-01 | 2005-12-15 | Fuji Photo Film Co Ltd | 固体撮像装置及びカメラモジュール及び携帯電話機 |
| JP4598439B2 (ja) * | 2004-06-16 | 2010-12-15 | 大日本印刷株式会社 | カラーフィルタおよびその製造方法 |
| JP2006146033A (ja) * | 2004-11-24 | 2006-06-08 | Olympus Corp | 画像表示装置におけるキャリブレーション方法および装置 |
| US20100073766A1 (en) * | 2005-10-26 | 2010-03-25 | Angros Lee H | Microscope slide testing and identification assembly |
| CN100543572C (zh) * | 2005-10-27 | 2009-09-23 | 惠普开发有限公司 | 成像系统,成像器件分析系统,成像器件分析方法,和光束发射方法 |
| JP4473231B2 (ja) | 2006-03-31 | 2010-06-02 | 大日本印刷株式会社 | 光学素子用部材の色度座標の評価方法 |
| TW200809386A (en) * | 2006-08-03 | 2008-02-16 | Benq Corp | Brightness surveying device and surveying method thereof for projectors |
| CN101636775B (zh) * | 2007-03-16 | 2014-05-07 | 夏普株式会社 | 显示装置 |
| JP4329852B2 (ja) * | 2007-07-11 | 2009-09-09 | セイコーエプソン株式会社 | 偏光変換ユニット、偏光変換装置、およびプロジェクタ |
| GB2452716A (en) * | 2007-09-11 | 2009-03-18 | Verivide Ltd | Illumination arrangement for colour assessment apparatus and method |
| US7813891B2 (en) | 2008-09-30 | 2010-10-12 | Xerox Corporation | Methods and systems for detecting spectrophotometer misalignment |
| DE102010004417A1 (de) * | 2009-02-09 | 2010-09-02 | Heidelberger Druckmaschinen Ag | Konvertierung von filterlos gemessenen Farbmesswerten in mit Filtern gemessene Farbmesswerte und umgekehrt |
| JP5630183B2 (ja) | 2009-11-27 | 2014-11-26 | コニカミノルタ株式会社 | 白色校正部材およびそれを用いた光学特性測定システム |
| SE1000314A1 (sv) * | 2010-03-31 | 2011-10-01 | Qpcard Ab | Färgkalibreringskort |
| JP5976654B2 (ja) * | 2010-09-29 | 2016-08-24 | ジーイー・ヘルスケア・バイオサイエンス・コーポレイション | 顕微鏡画像化用の較正目標 |
| CN102486560A (zh) * | 2010-12-04 | 2012-06-06 | 鸿富锦精密工业(深圳)有限公司 | 相机模组 |
| WO2012117492A1 (ja) * | 2011-02-28 | 2012-09-07 | Necディスプレイソリューションズ株式会社 | 表示装置、表示装置の制御方法 |
| WO2013036618A1 (en) * | 2011-09-06 | 2013-03-14 | Canfield Scientific, Incorporated | Systems, devices, and methods for image analysis |
| TWI512274B (zh) * | 2011-09-27 | 2015-12-11 | Ind Tech Res Inst | 影像式彩色分析儀之校正方法及量測裝置 |
| JP6003097B2 (ja) * | 2012-03-02 | 2016-10-05 | 株式会社リコー | 撮像装置、測色装置、測色システム及び画像形成装置 |
| JP2013200412A (ja) | 2012-03-23 | 2013-10-03 | Sharp Corp | 表示装置用基板および表示装置用基板の製造方法 |
| GB201210403D0 (en) * | 2012-06-13 | 2012-07-25 | Ffei Ltd | Mircoscope colour chart |
| US9164015B2 (en) * | 2012-06-29 | 2015-10-20 | General Electric Company | Systems and methods for processing and imaging of biological samples |
| US9368692B2 (en) | 2012-09-14 | 2016-06-14 | Sharp Kabushiki Kaisha | Electronic color-chart device |
| CN103342916B (zh) * | 2013-06-25 | 2014-08-13 | 杭州电子科技大学 | 一种多种颜色混合的废弃胶印油墨回收处理的方法 |
| US20150103401A1 (en) * | 2013-10-11 | 2015-04-16 | Datacolor Holding Ag | Reference color slide for use in color correction of transmission-microscope slides |
| CN103616076A (zh) * | 2013-11-13 | 2014-03-05 | 中国电子科技集团公司第四十一研究所 | 一种覆盖完整色域的颜色校准装置 |
| US9797767B2 (en) * | 2014-08-26 | 2017-10-24 | General Electric Company | Calibration of microscopy systems |
-
2017
- 2017-03-30 US US16/084,205 patent/US11340115B2/en active Active
- 2017-03-30 CN CN202110169944.1A patent/CN112987483B/zh active Active
- 2017-03-30 CN CN201780020175.0A patent/CN108885135B/zh active Active
- 2017-03-30 KR KR1020187028833A patent/KR102333044B1/ko active IP Right Grant
- 2017-03-30 KR KR1020217011982A patent/KR102286314B1/ko active IP Right Grant
- 2017-03-30 EP EP20182419.0A patent/EP3739311A1/en active Pending
- 2017-03-30 CN CN202110650456.2A patent/CN113311659B/zh active Active
- 2017-03-30 WO PCT/JP2017/013358 patent/WO2017170910A1/ja active Application Filing
- 2017-03-30 KR KR1020217038613A patent/KR102432232B1/ko active IP Right Grant
- 2017-03-30 EP EP17775444.7A patent/EP3454024A4/en active Pending
- 2017-03-30 CN CN202210658889.7A patent/CN114928743A/zh active Pending
-
2021
- 2021-09-01 US US17/464,389 patent/US11371886B2/en active Active
-
2022
- 2022-04-22 US US17/726,804 patent/US11635329B2/en active Active
Patent Citations (6)
| Publication number | Priority date | Publication date | Assignee | Title |
|---|---|---|---|---|
| JP2010151830A (ja) * | 1999-10-29 | 2010-07-08 | Cytyc Corp | 画像生成システム内のサンプル中の対象領域の位置を検証する装置および方法 |
| JP2003172659A (ja) * | 2001-12-07 | 2003-06-20 | Fuji Photo Film Co Ltd | 透過型高彩度色再現評価用チャート |
| JP2013088226A (ja) * | 2011-10-17 | 2013-05-13 | Nippon Hoso Kyokai <Nhk> | 広色域カラーチャート、広色域カラーチャート装置及び広色域カラーチャートを用いた色再現評価方法 |
| JP2013134170A (ja) * | 2011-12-27 | 2013-07-08 | Nippon Hoso Kyokai <Nhk> | 高彩度色光生成装置及び色再現評価方法 |
| US20130262008A1 (en) * | 2012-03-28 | 2013-10-03 | Nithya Ramanathan | Measurement of light-absorption qualities in the visible spectrum using a camera |
| JP2015102708A (ja) * | 2013-11-26 | 2015-06-04 | 大日本印刷株式会社 | 顕微鏡画像校正用スライドガラス |
Non-Patent Citations (2)
| Title |
|---|
| KRETKOWSKI, M. ET AL.: "Development of an XYZ Digital Camera with Embedded Color Calibration System for Accurate Color Acquisition", IEICE TRANS. INF. & SYST., vol. 93 -D, no. 3, March 2010 (2010-03-01), pages 651 - 653, XP055429170 * |
| See also references of EP3454024A4 * |
Cited By (7)
| Publication number | Priority date | Publication date | Assignee | Title |
|---|---|---|---|---|
| CN111201425A (zh) * | 2017-10-19 | 2020-05-26 | 大日本印刷株式会社 | 色彩校正用观察器、及使用其的色彩校正套组 |
| JPWO2019078288A1 (ja) * | 2017-10-19 | 2020-11-05 | 大日本印刷株式会社 | 色較正用ビュアー、およびそれを用いた色較正セット |
| EP3699563A4 (en) * | 2017-10-19 | 2021-07-14 | Dai Nippon Printing Co., Ltd. | COLOR CALIBRATION VIEWER AND COLOR CALIBRATION KIT USING THIS |
| US11397110B2 (en) | 2017-10-19 | 2022-07-26 | Dai Nippon Printing Co., Ltd. | Color calibration viewer, and color calibration set in which same is used |
| JP7310607B2 (ja) | 2017-10-19 | 2023-07-19 | 大日本印刷株式会社 | 色較正用ビュアー、およびそれを用いた色較正セット |
| WO2020166697A1 (ja) | 2019-02-14 | 2020-08-20 | 大日本印刷株式会社 | 医療機器用色修正装置 |
| WO2021075406A1 (ja) * | 2019-10-15 | 2021-04-22 | 大日本印刷株式会社 | 透過型カラー階調チャート、透過型カラー階調チャート装置及びグレー階調チャート |
Also Published As
| Publication number | Publication date |
|---|---|
| US20220244105A1 (en) | 2022-08-04 |
| KR102286314B1 (ko) | 2021-08-06 |
| CN113311659B (zh) | 2023-01-13 |
| US20210396582A1 (en) | 2021-12-23 |
| EP3454024A1 (en) | 2019-03-13 |
| US11635329B2 (en) | 2023-04-25 |
| US11340115B2 (en) | 2022-05-24 |
| US20190137340A1 (en) | 2019-05-09 |
| CN108885135A (zh) | 2018-11-23 |
| KR20210048579A (ko) | 2021-05-03 |
| CN114928743A (zh) | 2022-08-19 |
| US11371886B2 (en) | 2022-06-28 |
| EP3739311A1 (en) | 2020-11-18 |
| EP3454024A4 (en) | 2019-12-18 |
| KR20210145858A (ko) | 2021-12-02 |
| CN108885135B (zh) | 2021-06-08 |
| CN112987483B (zh) | 2022-10-21 |
| KR102432232B1 (ko) | 2022-08-16 |
| KR102333044B1 (ko) | 2021-12-01 |
| KR20180124904A (ko) | 2018-11-21 |
| CN112987483A (zh) | 2021-06-18 |
| CN113311659A (zh) | 2021-08-27 |
Similar Documents
| Publication | Publication Date | Title |
|---|---|---|
| WO2017170910A1 (ja) | 透過型色較正用チャートおよび較正用スライドガラス | |
| JP7276405B2 (ja) | 透過型色較正用チャート | |
| JP2012533216A (ja) | 立体像フィルムを作成する方法 | |
| JP7120363B2 (ja) | 較正用スライドガラス | |
| US11397110B2 (en) | Color calibration viewer, and color calibration set in which same is used | |
| JP2008203666A (ja) | 半透過型液晶表示装置用カラーフィルタ | |
| US20220390283A1 (en) | Transmission type color gradation chart, transmission type color gradation chart device and gray gradation chart | |
| JP6769534B2 (ja) | 顕微鏡画像校正用スライドガラス | |
| JP7088250B2 (ja) | 顕微鏡画像校正用スライドガラス | |
| JP2017194721A (ja) | 顕微鏡画像校正用スライドガラス |
Legal Events
| Date | Code | Title | Description |
|---|---|---|---|
| NENP | Non-entry into the national phase |
Ref country code: DE |
|
| ENP | Entry into the national phase |
Ref document number: 20187028833 Country of ref document: KR Kind code of ref document: A |
|
| WWE | Wipo information: entry into national phase |
Ref document number: 2017775444 Country of ref document: EP |
|
| ENP | Entry into the national phase |
Ref document number: 2017775444 Country of ref document: EP Effective date: 20181031 |
|
| 121 | Ep: the epo has been informed by wipo that ep was designated in this application |
Ref document number: 17775444 Country of ref document: EP Kind code of ref document: A1 |