WO2017073757A1 - 検出装置、信号処理方法及びプログラム - Google Patents
検出装置、信号処理方法及びプログラム Download PDFInfo
- Publication number
- WO2017073757A1 WO2017073757A1 PCT/JP2016/082134 JP2016082134W WO2017073757A1 WO 2017073757 A1 WO2017073757 A1 WO 2017073757A1 JP 2016082134 W JP2016082134 W JP 2016082134W WO 2017073757 A1 WO2017073757 A1 WO 2017073757A1
- Authority
- WO
- WIPO (PCT)
- Prior art keywords
- waveform pattern
- signal
- reception
- antenna
- transmission
- Prior art date
- Legal status (The legal status is an assumption and is not a legal conclusion. Google has not performed a legal analysis and makes no representation as to the accuracy of the status listed.)
- Ceased
Links
Images











Classifications
-
- A—HUMAN NECESSITIES
- A61—MEDICAL OR VETERINARY SCIENCE; HYGIENE
- A61B—DIAGNOSIS; SURGERY; IDENTIFICATION
- A61B10/00—Instruments for taking body samples for diagnostic purposes; Other methods or instruments for diagnosis, e.g. for vaccination diagnosis, sex determination or ovulation-period determination; Throat striking implements
Definitions
- the present invention relates to a detection device, a signal processing method, and a program.
- the diagnosis of cancer is generally performed by, for example, taking an image of a target region with an X-ray or a nuclear magnetic resonance apparatus (MRI (Magnetic Resonance Imaging)) and analyzing the taken image (for example, Patent Document 1).
- MRI Magnetic Resonance Imaging
- Patent Document 1 a nuclear magnetic resonance apparatus
- This abnormal tissue detection apparatus that can easily detect an abnormal tissue with a simple configuration without using an X-ray apparatus or an MRI apparatus (for example, see Patent Document 2).
- This abnormal tissue detection apparatus is provided with an antenna array in which antennas are arranged in a matrix.
- This abnormal tissue detection apparatus radiates a microwave impulse signal from one antenna of an antenna array to a living body, and receives a reflected wave of the radiated impulse signal by another antenna of the antenna array.
- This abnormal tissue detection device performs transmission / reception of impulse signals while changing the combination of an antenna that transmits microwave impulse signals and an antenna that receives microwaves, and a plurality of reception signals obtained by combinations of the antennas. Based on the above, an abnormal tissue in the living body is detected.
- the received signal may differ depending on the combination of antennas that transmit and receive radio waves. This is because the level of the received signal varies depending on the environment around each antenna, such as whether the antenna for transmission and reception is on the outer peripheral side or the inner peripheral side of the antenna array. Therefore, an antenna array device is disclosed in which a dummy antenna or the like is provided to change the radio wave transmission / reception state to the same state by combining different antennas (see, for example, Patent Document 3).
- the delay of the received signal may differ depending on the combination of antennas. Due to the difference in the delay of the received signal, the detection accuracy may be reduced.
- the present invention has been made in view of the above circumstances, and an object thereof is to provide a detection device, a signal processing method, and a program capable of improving the detection accuracy of a detection target.
- a detection apparatus provides: A plurality of transmission antennas for transmitting microwave impulse signals; A plurality of receiving antennas for receiving the impulse signal; Control that outputs an impulse signal to a selected transmission antenna while switching a combination of a transmission antenna and a reception antenna to be selected, inputs a reception signal received by the selected reception antenna, and performs signal processing on the input reception signal
- the controller is A time adjustment unit that adjusts a deviation in a time direction of a signal waveform based on a time point of a peak in a signal waveform of a plurality of reception signals received by the reception antenna for a predetermined combination of the transmission antenna and the reception antenna; , A plurality of reception signals adjusted by the time adjustment unit, the plurality of reception signals acquired for the same combination of the transmission antenna and the reception antenna, or the relative distance between the transmission antenna and the reception antenna
- a detection waveform pattern generation unit that generates a detection waveform pattern indicating an average of a plurality of received signals acquired for the same
- the time adjustment unit adjusts the deviation of the signal waveform in the time direction as a predetermined combination of the same combination of the transmission antenna and the reception antenna
- the detected waveform pattern generation unit A set average waveform pattern that averages signal waveforms of a plurality of received signals in the same combination of the same transmitting antenna and the receiving antenna is generated as a detected waveform pattern
- the reference waveform pattern generation unit The same distance average waveform pattern obtained by averaging the average waveform pattern for each set in the same combination of the relative distance between the transmission antenna and the reception antenna is generated as a reference waveform pattern. It is good as well.
- the time adjustment unit adjusts the deviation in the time direction of the signal waveform as a predetermined combination with the same relative distance between the transmission antenna and the reception antenna
- the detected waveform pattern generation unit The same distance average waveform pattern that averages the signal waveform of the received signal in the same combination of the relative distance between the transmitting antenna and the receiving antenna is generated as a detected waveform pattern
- the reference waveform pattern generation unit Generating all signal average waveform patterns obtained by averaging signal waveforms of received signals in all combinations of the transmitting antenna and the receiving antenna as a reference waveform pattern; It is good as well.
- the controller is For combinations with the same relative distance between the transmitting antenna and the receiving antenna, the amplitude of the signal received by the receiving antenna is the same level based on the offset and amplitude of the signal waveform of the signal received by the receiving antenna.
- Signal transmission / reception control for inputting the digital reception signal of a predetermined number of bits output from the selected reception antenna by outputting the impulse signal to the selected transmission antenna a plurality of times for the same combination of the transmission antenna and the reception antenna
- An average waveform pattern generating unit for acquiring an average waveform pattern that expresses an average of digital received signals that are input a plurality of times by a number of bits larger than the predetermined number of bits, as a waveform pattern of a signal waveform of the combination of received signals; and Comprising It is good as well.
- the average waveform pattern generation unit for each set is Of the digital received signals input a plurality of times, exclude the digital received signals whose maximum amplitude is outside the 90% confidence interval of the normal distribution, and generate the average waveform pattern. It is good as well.
- the impulse signal is a Gaussian monocycle pulse; It is good as well.
- the controller is The same distance average waveform pattern generation unit that generates the same distance average waveform pattern indicating the average of the signal waveform of the received signal in the same combination of the relative distance between the transmission antenna and the reception antenna,
- the same distance average waveform pattern generation unit Regarding the waveform pattern of the signal waveform of the reception signal of each combination of the transmission antenna and the reception antenna, when a positive peak appears following a positive peak and a negative peak does not appear, the received signal of the combination Exclude the waveform pattern of the signal waveform from the calculation target, It is good as well.
- the detector is Based on the differential waveform pattern, the propagation time from the transmission of the impulse signal to the reception of the reception signal is obtained for each combination of the same relative distance between the transmission antenna and the reception antenna, Based on the obtained propagation time, estimate the offset included in the propagation time when the relative distance is assumed to be 0, Detecting a position of a detection target based on the propagation time obtained by subtracting an offset included in the propagation time; It is good as well.
- the detector is Obtaining the propagation time based on the first positive or negative peak position of the differential waveform pattern, estimating the offset included in the propagation time, When the offset included in the propagation time is estimated based on the positive peak position, the position of the detection target is detected based on the positive peak position of the differential waveform pattern, When the offset is estimated based on the negative peak position, the position of the detection target is detected based on the negative peak position of the differential waveform pattern. It is good as well.
- a logic circuit that inputs a clock signal, a delay circuit, and a combination circuit of semiconductor switching elements, and a transmission signal generation unit that generates impulse signals to be transmitted to a plurality of transmission antennas using the combination circuit. It is good as well.
- the controller is A band filter for removing low frequency noise and high frequency noise from the differential waveform pattern generated by the differential waveform pattern generation unit, It is good as well.
- the controller is Compensating the differential waveform pattern with a loss equation of a medium through which the impulse signal propagates, It is good as well.
- a signal processing method includes: While switching the combination of a plurality of transmission antennas that transmit microwave impulse signals and a plurality of reception antennas that receive the impulse signals, the impulse signals are output to the selected transmission antennas and received by the selected reception antennas.
- a signal processing method for inputting the received signal and performing signal processing on the input received signal A time adjustment step for adjusting a deviation in a time direction of a signal waveform based on a point in time of a peak in a signal waveform of a plurality of reception signals received by the reception antenna for a predetermined combination of the transmission antenna and the reception antenna; , A plurality of reception signals adjusted in the time adjustment step, the plurality of reception signals acquired for the same combination of the transmission antenna and the reception antenna, or the relative distance between the transmission antenna and the reception antenna
- a detection waveform pattern generating step for generating a detection waveform pattern indicating an average of a plurality of received signals acquired for the same combination;
- a reference waveform pattern generating step including a plurality of received signals used for generating the detected waveform pattern, and generating a reference waveform pattern indicating an average of signal waveforms of a larger number of received signals;
- a differential waveform pattern generation step for generating a differential waveform pattern indicating a difference between the detection waveform pattern
- the program according to the third aspect of the present invention is: Computer While switching the combination of a plurality of transmission antennas that transmit microwave impulse signals and a plurality of reception antennas that receive the impulse signals, the impulse signals are output to the selected transmission antennas and received by the selected reception antennas.
- a control unit that inputs the received signal and performs signal processing on the received signal, For a predetermined combination of the transmission antenna and the reception antenna, a time adjustment unit that adjusts a shift in the time direction of the signal waveform based on a point in time of a peak in a signal waveform of a plurality of reception signals received by the reception antenna; A plurality of reception signals adjusted by the time adjustment unit, the plurality of reception signals acquired for the same combination of the transmission antenna and the reception antenna, or the relative distance between the transmission antenna and the reception antenna A detection waveform pattern generation unit that generates a detection waveform pattern indicating an average of a plurality of received signals acquired for the same combination, A reference waveform pattern generation unit including a plurality of reception signals used for generating the detection waveform pattern, and generating a reference waveform pattern indicating an average of signal waveforms of a larger number of reception signals; A differential waveform pattern generation unit that generates a differential waveform pattern indicating a difference between the detection waveform pattern generated by the detection waveform pattern generation unit and
- the average waveform pattern is calculated and calculated after matching each waveform pattern in the time direction.
- a detection target is detected based on the average waveform pattern. Since the average waveform pattern adjusted in the time direction is a waveform pattern with reduced noise and jitter, detection accuracy of the detection target can be improved by detecting the detection target based on the waveform pattern.
- FIG. 3 is a block diagram illustrating a functional configuration of a control unit according to the first embodiment.
- 3 is a flowchart of signal processing according to the first embodiment.
- 3 is a data flow showing a data flow in the abnormal tissue detection apparatus according to the first embodiment.
- FIG. 10A to 10C are diagrams showing how the waveform pattern is time-adjusted in the combination of the transmitting antenna and the receiving antenna having the same relative distance.
- FIG. 11A and FIG. 11B are diagrams showing how the level of a waveform pattern is adjusted in a combination of a transmission antenna and a reception antenna having the same relative distance.
- FIG. 12A is a diagram illustrating an example of a waveform of a differential waveform pattern when time adjustment is not performed.
- FIG. 12B is a diagram illustrating an example of the waveform of the differential waveform pattern when time adjustment is performed.
- FIG. 13A is a diagram illustrating an example of a waveform of a differential waveform pattern when level adjustment is not performed.
- FIG. 13B is a diagram illustrating an example of a waveform of a differential waveform pattern when level adjustment is performed. It is a graph which shows an example of the relationship between the distance between antennas, and peak time. It is a graph which shows an example of the relationship between the distance between antennas for every transmission antenna, and peak time.
- FIGS. 16A to 16C are diagrams showing detection results of abnormal tissues when time adjustment and level adjustment are not performed.
- FIGS. 17A and 17B are diagrams showing detection results of abnormal tissue when time adjustment and level adjustment are performed. It is a block diagram which shows the function structure of the control part which concerns on Embodiment 2.
- FIG. 6 is a flowchart of signal processing according to the second embodiment.
- FIG. 6 is a data flow showing a data flow in the abnormal tissue detection apparatus according to the second embodiment.
- FIG. 21A is a histogram of the peak value of the received waveform.
- FIG. 21B shows a peak value for each received waveform.
- FIG. 22A is a graph showing an example of a differential waveform pattern.
- FIG. 22B is a graph showing an example of the integral value of the differential waveform pattern.
- FIG. 22C is a graph showing an example of a frequency spectrum obtained by Fourier transforming the differential waveform pattern.
- FIG. 23A is a graph showing an example of a differential waveform pattern to which a bandpass filter is applied.
- FIG. 23B is a graph showing an example of the integrated value of the differential waveform pattern to which the bandpass filter is applied.
- FIG. 21A is a histogram of the peak value of the received waveform.
- FIG. 21B shows a peak value for each received waveform.
- FIG. 22A is a graph showing an example of
- FIG. 24A is a graph showing an example of the integrated value of the differential waveform pattern before loss compensation.
- FIG. 24B is a graph showing an example of the integrated value of the differential waveform pattern after loss compensation.
- FIG. 25A and FIG. 25B are diagrams showing a positive peak position and a negative peak position in the differential waveform pattern.
- FIG. 26A is a diagram showing the detection result of the abnormal tissue when the offset time is estimated at the positive peak position.
- FIG. 26B is a diagram showing the detection result of the abnormal tissue when the offset time is estimated at the negative peak position.
- FIG. 27A is a diagram illustrating an abnormal tissue detection result when the bandpass filter and the loss compensation are not applied.
- FIG. 27B is a diagram illustrating the detection result of the abnormal tissue when the band filter is applied and the loss compensation is not applied.
- FIG. 27C is a diagram illustrating a detection result of an abnormal tissue when a band filter and loss compensation are applied.
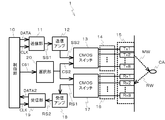
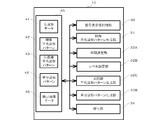
- the abnormal tissue detection apparatus 1 includes a control unit 10, a transmission unit 11, a transmission amplifier 12, a CMOS (Complementary Metal Oxide Semiconductor) switch 13, a wiring unit 14, an antenna array 15, The wiring unit 16, the CMOS switch 17, the reception amplifier 18, the reception unit 19, and the selection unit 20 are provided.
- CMOS Complementary Metal Oxide Semiconductor
- the control unit 10 is a computer (information processing apparatus) including a CPU, a memory, an external storage device, an input / output I / O, a crystal oscillator, and the like.
- the CPU executes a program installed in the external storage device and read into the memory, and writes / reads data to / from the external storage device and external devices via the input / output I / O
- the function of the control unit 10 is realized by performing transmission and reception.
- control unit 10 outputs the data signal DATA and the clock signal CLK to the transmission unit 11.
- the control unit 10 inputs the data signal DATA2 from the reception unit 19 and outputs a clock signal CLK to the reception unit 19. Further, the control unit 10 outputs the control signal CS1 of the CMOS switches 13 and 17 to the selection unit 20.
- the transmission unit 11 as a transmission signal generation unit generates and outputs a transmission signal SS1, which is an impulse-like electric signal as shown in FIG. 2, for example, according to the clock signal CLK input from the control unit 10. It is.
- the transmission signal SS1 is an impulse-like electric signal in which a positive peak and a negative peak continue in a short time. This signal is also called a Gaussian monocycle pulse (GMP).
- GMP is a broadband signal in a microwave band (for example, a center frequency of 6 GHz).
- the transmission signal SS1 is repeatedly transmitted at a repetition frequency (for example, 100 MHz).
- the transmission unit 11 includes a combinational circuit such as a logic circuit, a delay circuit, and a semiconductor switching element. As shown in FIG. 3, the transmitter 11 includes NAND circuits 21A and 21B, NOR circuits 21C and 21D, delay circuits 22A to 22D, OR circuits 23A and 23C, AND circuits 23B and 23D, and a down pulse generator. 24A and 24C, up pulse generators 24B and 24D, and buffer circuits 25A and 25B.
- NAND circuits 21A and 21B are NAND circuits.
- the clock signal CLOCK (CLK) and the data signal DATA are input to the NAND circuit 21A.
- the NAND circuit 21B receives the clock signal CLOCK and the data signal / DATA.
- the NOR circuits 21C and 21D are negative OR logic circuits.
- a clock signal / CLOCK and a data signal / DATA are input to the NOR circuit 21C.
- the clock signal / CLOCK and the data signal DATA are input to the NOR circuit 21D.
- As the data signals DATA and / DATA a BPSK (Binary Phase Shift Keying) signal is input.
- the output of the NAND circuit 21A is input to the delay circuit 22A, and the output of the NAND circuit 21B is input to the delay circuit 22B. Further, the output of the NOR circuit 21C is input to the delay circuit 22C, and the output of the NOR circuit 21D is input to the delay circuit 22D.
- 1 ⁇ represents the delay time of one inverter.
- 1 ⁇ , 2 ⁇ , 3 ⁇ , and 4 ⁇ are outputs of the first, second, third, and fourth inverters, and the delay time of each output is equal to 1 ⁇ , twice, three times, and four times the delay. It will be time.
- the OR circuit 23A inputs the signal delayed by 1 ⁇ by the delay circuit 22A and the signal delayed by 4 ⁇ by the delay circuit 22D.
- the AND circuit 23B receives the signal delayed by 2 ⁇ by the delay circuit 22B and the signal delayed by 3 ⁇ by the delay circuit 22C. Further, the OR circuit 23C receives the signal delayed by 1 ⁇ by the delay circuit 22B and the signal delayed by 4 ⁇ by the delay circuit 22C.
- the AND circuit 23D receives the signal delayed by 2 ⁇ by the delay circuit 22A and the signal delayed by 3 ⁇ by the delay circuit 22D.
- the down pulse generator 24A inputs the signal output from the OR circuit 23A.
- the up pulse generator 24B receives the signal output from the AND circuit 23B.
- the down pulse generator 24C receives the signal output from the OR circuit 23C.
- the up pulse generator 24D receives the signal output from the AND circuit 23D.
- the buffer circuit 25A receives the signal output from the down pulse generator 24A and the signal output from the up pulse generator 24B, and outputs a positive-side output signal OP of the differential output.
- the buffer circuit 25B receives the signal output from the down pulse generator 24C and the signal output from the up pulse generator 24D, and outputs a differential output negative output signal OM.
- the clock signal Ck that is the output signal of the OR circuit 23C has a high level (H) and a low level (L) as shown in FIG. It becomes a periodic signal that repeats.
- the output a (see FIG. 3) of the inverter inside the down pulse generator 24C has a waveform as shown in FIG. 4B, which is delayed and inverted by the delay time 1 ⁇ , and the output b (FIG. 3) of the down pulse generator 24C. (Refer to FIG. 4C).
- the current Id flowing in the switching element on the positive side of the buffer circuit 25B due to the ON output of the down pulse generator 24C has a waveform as shown in FIG.
- the waveform pattern of the output signal OP is the output signal. This is the reverse of the OM waveform pattern.
- the transmission amplifier 12 amplifies the transmission signal SS1 input from the transmission unit 11 and outputs it as the transmission signal SS2.
- the transmission amplifier 12 includes a DC cut filter, an attenuator, a variable gain power amplifier, a STEP attenuator, and the like, and generates a transmission signal SS2 in which the DC component is cut and the gain is amplified.
- the CMOS switch 13 is a single-pole 8-throw switch.
- the CMOS switch 13 receives the transmission signal SS2 from the input end.
- each of a plurality of output ends is connected to a plurality of transmission antennas Tx1, Tx2,.
- the CMOS switch 13 switches the antenna that outputs the input transmission signal SS2 to any one of the plurality of transmission antennas Tx1, Tx2,..., Tx8 in accordance with a control signal CS2 output from the selection unit 20 described later.
- the wiring unit 14 includes eight transmission lines that connect any one of the eight output ends of the CMOS switch 13 and any one of the transmission antennas Tx1 to Tx8 with a wiring having the same length.
- This transmission line is formed by a coaxial cable, a micro strap line, or the like. Since the lengths of the transmission lines that transmit signals to the transmission antennas Tx1 to Tx8 in the wiring section 14 are the same, the time difference between the signals flowing through the transmission lines is almost eliminated.
- the antenna array 15 includes a plurality of transmission antennas Tx1, Tx2, ..., Tx8.
- the plurality of transmission antennas Tx1, Tx2,..., Tx8 transmit a microwave impulse signal MW according to the input transmission signal SS2.
- the impulse signal MW is reflected by the abnormal tissue CA in the body of the subject and becomes a reflected signal RW.
- the antenna array 15 includes a plurality of receiving antennas Rx1, Rx2, ..., Rx8.
- the plurality of receiving antennas Rx1, Rx2,..., Rx8 receive a microwave (reflected signal RW).
- FIG. 5A shows one surface of the antenna array 15, and FIG. 5B shows the other surface of the antenna array 15.
- a plurality of antennas are arranged in a 4 ⁇ 4 matrix.
- the size of the antenna array 15 is, for example, 55.4 mm ⁇ 47 mm, and the thickness is 0.635 mm.
- Each antenna is 11 mm ⁇ 13.1 mm.
- the gap between the antennas is set to 1 mm.
- the transmission antennas Tx1 to Tx4 are arranged side by side in the X axis direction
- the reception antennas Rx1 to Rx4 are arranged side by side in the X axis direction
- the transmission antennas Tx5 to Tx8 are arranged side by side in the X axis direction.
- the receiving antennas Rx5 to Rx8 are arranged side by side in the X-axis direction.
- the transmission antennas Tx1 to Tx4, the reception antennas Rx1 to Rx4, the transmission antennas Tx5 to Tx8, and the reception antennas Rx5 to Rx8 are arranged in this order in the Y-axis direction.
- the reception environment for the wave impulse signal is the same.
- the wiring unit 16 includes eight transmission lines that connect any one of the eight input ends of the CMOS switch 17 and any one of the receiving antennas Rx1 to Rx8 with a wiring having the same length.
- the lengths of the transmission lines for transmitting signals from the receiving antennas Rx1 to Rx8 are the same, so that there is almost no time difference between the signals.
- the CMOS switch 17 is a single-pole 8-throw switch.
- the CMOS switch 17 has eight input terminals and inputs signals received by the plurality of receiving antennas Rx1 to Rx8.
- one output terminal is connected to the reception amplifier 18.
- the CMOS switch 17 switches the signal received in accordance with the control signal CS2 output from the selection unit 20 to any one of a plurality of reception antennas Rx1, Rx2,..., Rx8 that transmit the reception signal RS1 to the reception amplifier 18.
- the reception signal input from the input terminal by the control signal CS2 is output as the reception signal RS1.
- the reception amplifier 18 amplifies the reception signal RS1 and outputs the amplified signal as the reception signal RS2.
- the reception amplifier 18 includes a low noise amplifier, a STEP attenuator, a DC cut filter, and the like, receives the reception signal RS1, and generates and outputs the reception signal RS2 through these internal circuits.
- the reception unit 19 is a hardware circuit that outputs the reception signal RS2 input from the reception amplifier 18 to the control unit 10.
- the reception signal RS2 is converted into a digital data signal DATA2 and input to the control unit 10.
- the data signal DATA2 is a 4-bit signal, for example.
- the selection unit 20 is a hardware circuit that outputs a control signal CS2 for switching the CMOS switches 13 and 17 in accordance with the control signal CS1 output from the control unit 10.
- the switches are switched according to the control signal CS2, and one transmission antenna among the transmission antennas Tx1 to Tx8 of the antenna array 15 and one reception antenna among the reception antennas Rx1 to Rx8 are selected.
- the control unit 10 performs signal processing on the input data signal DATA2 to detect abnormal tissue CA.
- the CMOS switch 13 switches to output the transmission signal SS2 to the transmission antenna Tx2.
- the CMOS switch 17 switches to output the reception signal RS1 received by the reception antenna Rx2 to the reception amplifier 18.
- the microwave impulse signal MW is transmitted and received by a combination of the transmission antenna Tx2 and the reception antenna Rx2.
- the control unit 10 controls the CMOS switches 13 and 17 by the control signal CS2 and outputs the transmission signal SS2 to the CMOS switch 13 while switching the combination of the transmission antennas Tx1 to Tx8 and the reception antennas Rx1 to Rx8, and receives the reception antenna Rx1.
- the received signal RS1 output from ⁇ Rx8 is input via the CMOS switch 17, and signal processing is performed on the input electrical signal.
- a microwave impulse signal is radiated from the transmission antenna Tx1.
- Part of the emitted microwave propagates in the living body.
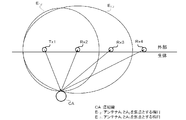
- abnormal tissue CA such as cancer tissue has a dielectric constant about 5 to 10 times higher than that of normal biological tissue. Therefore, when the abnormal tissue CA exists, the microwave is reflected at the interface of the regions having different dielectric constants, that is, the surface of the abnormal tissue CA, and is received by the receiving antennas Rx2 to Rx4.
- T 12 ⁇ c speed of light in the living body
- abnormal tissue CA is a receiving antenna Rx2 and the transmission antennas Tx1 and focus, will be located on an ellipse E12 sum of the distance from the antenna Tx1 and Rx2 is T 12 ⁇ c.
- the same processing is performed on the microwaves received by the antennas Rx3 and Rx4, and the position of the abnormal tissue CA can be obtained by obtaining the intersections of a plurality of ellipses E 12 to E 14 (E 14 is not shown). .
- the time from when the impulse signal is transmitted from the transmitting antenna Txm to when the receiving antenna Rxn receives it is defined as a propagation time T mn .
- the antenna that transmits the impulse signal is switched to the transmission antenna Tx2, the microwave is radiated from the transmission antenna Tx2, and this is received by the reception antennas Rx2 to Rx4, and the same processing is performed. Thereafter, the microwaves are radiated while the transmitting antennas are sequentially switched, the reflected waves are received by the receiving antennas, and the same processing is performed, whereby the position of the abnormal tissue CA can be specified more accurately.
- the abnormal tissue detection apparatus 1 detects the abnormal tissue CA based on the propagation time of the impulse signal transmitted and received between the transmission antennas Tx1 to Tx8 and the reception antennas Rx1 to Rx8. Therefore, the position of the abnormal tissue CA can be accurately detected by eliminating the delay of the impulse signal on the circuit as in the present embodiment.
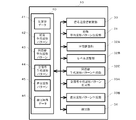
- FIG. 7 shows a functional configuration of the control unit 10.
- the control unit 10 includes a signal transmission / reception control unit 30, an average waveform pattern generation unit 31 for each set, a time adjustment unit 32A, a level adjustment unit 32B, and an equal distance average waveform pattern generation unit 32C. And an all-signal average waveform pattern generation unit 33A, a differential waveform pattern generation unit 33B, a detection unit 34, and a storage unit 40.
- raw waveform data 41, average waveform pattern 42 for each set, average distance average waveform pattern 43, average total signal waveform pattern 44, differential waveform pattern 45, and detected image data 46 are stored. Is done.
- Each unit shown in FIG. 7 is realized by execution of the CPU as described above.
- the signal transmission / reception control unit 30 outputs the impulse signal to the selected transmission antenna while switching the combination of the transmission antenna and the reception antenna to be selected, and inputs the reception signal received by the selected reception antenna.
- the signal transmission / reception control unit 30 outputs the impulse signal to the selected transmission antenna a plurality of times for the same combination of the transmission antenna and the reception antenna, and outputs a digital signal with a quantization bit number of 4 bits output from the selected reception antenna.
- a reception signal (data signal DATA2) is input. This data is stored in the storage unit 40 as raw waveform data 41.
- the average waveform pattern generation unit 31 for each set generates an average waveform pattern that expresses the average of a 4-bit digital received signal input a plurality of times by the number of quantization bits larger than 4 bits, and the signal waveform of the received signal of the combination. Acquired as a waveform pattern.
- the acquired pattern is stored in the storage unit 40 as an average waveform pattern 42 for each set.
- the time adjustment unit 32A adjusts the deviation in the time direction of the signal waveform based on the peak time point in the signal waveform of the reception signal received by the reception antenna for the combination having the same relative distance between the transmission antenna and the reception antenna. Specifically, the time of the signal waveform is adjusted so that the signal waveforms are overlapped so that the peak points coincide.
- the level adjustment unit 32B determines the amplitude of the signal received by the receiving antenna based on the offset Offset and the amplitude of the signal waveform of the signal received by the receiving antenna for the combination having the same relative distance between the transmitting antenna and the receiving antenna.
- the amplitude level of the signal waveform is adjusted so that becomes the same level.
- the scale of each signal waveform is adjusted so that the center and amplitude of each signal waveform are the same.
- the same distance average waveform pattern generation unit 32C as the detection waveform pattern generation unit adjusts the deviation in the time direction of the signal waveform and adjusts the amplitude level of the signal waveform, and the relative distance between the transmission antenna and the reception antenna. Generate the same distance average waveform pattern indicating the average of the signal waveforms of the received signals in the same combination.
- the generated waveform pattern is stored in the storage unit 40 as the same distance average waveform pattern 43.
- the same distance average waveform pattern generation unit 32C has a positive peak that appears after the positive peak and no negative peak in the waveform pattern of the signal waveform of the reception signal of each combination of the transmission antenna and the reception antenna.
- the waveform pattern of the signal waveform of the received signal of the combination is excluded from the calculation target for detecting the detection target.
- the all-signal average waveform pattern generation unit 33A as the reference waveform pattern generation unit generates an all-signal average waveform pattern indicating the average of the signal waveforms of the reception signals at all combinations of the transmission antenna and the reception antenna.
- the generated waveform pattern is stored in the storage unit 40 as an all-signal average waveform pattern 44.
- the differential waveform pattern generation unit 33B includes the same distance average waveform pattern 43 and the all signal average waveform pattern generation unit in the combination in which the relative distance between the transmission antenna and the reception antenna generated by the same distance average waveform pattern generation unit 32C is the same.
- a differential waveform pattern indicating a difference from the all-signal average waveform pattern 44 generated at 33A is generated.
- the generated waveform pattern is stored in the storage unit 40 as the differential waveform pattern 45.
- the detection unit 34 detects a detection target based on the differential waveform pattern 45 generated by the differential waveform pattern generation unit 33B. Based on the differential waveform pattern 45, the detection unit 34 has a propagation time T mn from the transmission of the impulse signal to the reception of the reception signal, with the same relative distance between the transmission antenna and the reception antenna (inter-antenna distance). Ask for each. Then, the detection unit 34 on the basis of the propagation time T mn obtained, the relative distance between the transmit and receive antennas (antenna distance) remains even when it is assumed to be 0, contained in the propagation time T mn The offset TL is estimated (see FIG. 14). Details of the offset TL will be described later. Furthermore, the detection unit 34 detects the position of the detection target based on the propagation time T mn ′ from which the offset TL has been subtracted.
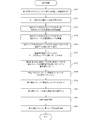
- FIG. 8 shows a flow of operations of the abnormal tissue detection apparatus 1.
- FIG. 9 shows the data flow of the abnormal tissue detection apparatus 1.
- FIG. 8 shows the flow of processing of the control unit 10.
- the control unit 10 (signal transmission / reception control unit 30) transmits and receives microwaves in all combinations to obtain a reception signal (step S11).
- the signal transmission / reception control unit 30 outputs the control signal CS1 for selecting the transmission antenna Tx1 and the reception antenna Rx1, and outputs the data signal DATA to the transmission unit 11 to output the transmission signal SS1.
- signals are transmitted and received between the transmission antenna Tx1 and the reception antenna Rx1, and a signal received by the reception antenna Rx1 is input to the control unit 10.
- the signal transmission / reception control unit 30 stores the received signal as raw waveform data 41 in the storage unit 40.
- the received signal is stored in association with information (Tx1-Rx1) of the transmission antenna and the reception antenna used for transmission / reception.
- the signal transmission / reception control unit 30 performs signal transmission / reception a plurality of times, for example, 16 times, with the same antenna combination (Tx1-Rx1). Accordingly, the storage unit 40 stores 16 pieces of data of the received signal (data signal DATA2) in the same antenna combination (Tx1-Rx1).
- the signal transmission / reception control unit 30 outputs the control signal CS1, causes the selection unit 20 to output the control signal CS2 for selecting the transmission antenna Tx1 and the reception antenna Rx2, and causes the transmission unit 11 to output the transmission signal SS1.
- Signal transmission / reception is performed 16 times, and 16 received signals are acquired for the antenna combination (Tx1-Rx2) and stored in the storage unit 40.
- the control unit 10 calculates an average waveform pattern with the same combination of the transmission antenna and the reception antenna (step S12).
- the average waveform pattern generation unit 31 for each group stores 16 received signals (raw waveform data 41) for each antenna combination.
- the average waveform pattern generation unit 31 for each set calculates an average waveform pattern of the 16 received signals (data signal DATA2) as an average waveform pattern 42 for each set.
- Each received signal (data signal DATA2) is a 4-bit coarse digital signal.
- the control unit 10 excludes the average waveform pattern having no peak in the waveform from the group-specific average waveform pattern 42 in the same combination of the transmission antenna and the reception antenna. (Step S13).
- the same distance average waveform pattern generation unit 32C excludes an average waveform pattern in which a negative peak does not appear after a positive peak from subsequent calculation targets. This exclusion may be performed by another threshold value.
- the control unit 10 performs time adjustment of the average waveform pattern with the combination of the transmission antenna and the reception antenna having the same relative distance (step S14).
- step S14 For example, as a combination of a transmission antenna and a reception antenna having the same relative distance, as shown in FIGS. 5A and 5B, (Tx1-Rx1), (Tx2-Rx2), (Tx3-Rx3), (Tx4-Rx4), (Tx5-Rx5), (Tx6-Rx6), (Tx7-Rx7), (Tx8-Rx8), and the like.
- FIG. 10A shows an average waveform pattern for two combinations of a transmission antenna and a reception antenna having the same relative distance.
- the two average waveform patterns appear to overlap well, but actually, as shown in FIG. 10B in which the vicinity of the peak is enlarged, the peak P1 of the two signal waveforms, P2 is shifted in the time direction. Therefore, the control unit 10 calculates the center time points A1 and A2 of the peaks P1 and P2 of the two signal waveforms as shown in FIG. 10C, which is a further enlarged view of FIG. dT is calculated.
- the centers of the vertices of the peaks P1 and P2 that maintain the maximum values may be set as the central time points A1 and A2.
- the control unit 10 performs level adjustment of the average waveform pattern with the combination of the transmission antenna and the reception antenna having the same relative distance (step S15). Specifically, as shown in FIG. 11A, the level adjustment unit 32B obtains an offset component Offset of two average waveform patterns for a combination of a transmission antenna and a reception antenna having the same relative distance, and FIG. ), The scale ratio of the levels A and B between the maximum value and the minimum value of the two average waveform patterns is obtained.
- control unit 10 uses a combination of a transmission antenna and a reception antenna having the same relative distance based on the obtained shift time dT, the offset Offset, and the scale ratio A / B.
- An average signal pattern is calculated (step S16).
- Time adjustment adjustment of time deviation
- level adjustment are performed, and an average waveform pattern for a combination of a transmission antenna and a reception antenna having the same relative distance is calculated.
- the calculated average waveform pattern is stored in the storage unit 40 as the same distance average waveform pattern 43 (detected waveform pattern) as shown in FIGS.
- control unit 10 all signal average waveform pattern generation unit 33A calculates an average waveform pattern for all combinations of transmission antennas and reception antennas as an all signal average waveform pattern (reference waveform pattern) 44 (step S17). ).
- the living body may include an abnormal tissue CA that changes the received signal.
- an abnormal tissue CA When there is an abnormal tissue CA, the waveform pattern of the reception signal received by each reception antenna Rxn changes. How the received signal received by each receiving antenna Rxn changes depending on the abnormal tissue CA depends on the positional relationship between the receiving antenna Rxn and the abnormal tissue CA. For example, when the transmission antenna Tx1 is for transmission and the reception antenna Rx1 is for reception, the appearance position of the abnormal tissue CA component in the received signal, and when the transmission antenna Tx6 is for transmission and the reception antenna Rx6 is for reception The appearance position of the abnormal tissue CA component in the received signal is different.
- the component of abnormal tissue CA is detected using the average waveform pattern of all signals of the reception signal actually measured using a living body as a reference waveform pattern, while suppressing the component of abnormal tissue CA. .
- the calculated average waveform pattern is stored in the storage unit 40 as an all-signal average waveform pattern (reference waveform pattern) 44 as shown in FIGS.
- the control unit 10 calculates a difference waveform pattern between the same distance average waveform pattern and the reference waveform pattern (step S18).
- the control unit 10 calculates the average signal average waveform pattern (total signal average waveform pattern 43 obtained in step S17) from the average distance average waveform pattern 43 in the combination of the transmission antenna and the reception antenna having the same relative distance obtained in step S16.
- a difference waveform pattern is obtained by subtracting the (reference waveform pattern) 44.
- the differential waveform pattern is obtained for each combination of the transmission antenna and the reception antenna having the same relative distance.
- the calculated differential waveform pattern is stored in the storage unit 40 as a differential waveform pattern 45 as shown in FIGS.
- FIG. 12A shows the same distance average waveform pattern obtained by combining the transmission antenna and the reception antenna having the same relative distance, and the total signal average waveform pattern (reference waveform), which are obtained when the time adjustment in step S14 is not performed.
- the difference waveform pattern obtained when the pattern) is subtracted is shown.
- FIG. 12B shows the same distance average waveform pattern obtained by combining the transmission antenna and the reception antenna having the same relative distance and the average signal average waveform pattern (reference) obtained when the time adjustment in step S14 is performed.
- a differential waveform pattern obtained when the (waveform pattern) is subtracted is shown. As can be seen by comparing FIG. 12A and FIG. 12B, the obtained differential waveform pattern is remarkably different depending on the presence or absence of time adjustment.
- FIG. 13A shows the same distance average waveform pattern obtained by combining the transmission antenna and the reception antenna having the same relative distance and the all signal average waveform pattern (reference waveform), which are obtained when the level adjustment in step S15 is not performed.
- the difference waveform pattern obtained when the pattern) is subtracted is shown.
- FIG. 13B shows the same distance average waveform pattern obtained by the combination of the transmission antenna and the reception antenna having the same relative distance in step S18, which is obtained when the level adjustment in step S15 is performed, and the total average signal waveform.
- a differential waveform pattern obtained when the pattern (reference waveform pattern) is subtracted is shown. As can be seen by comparing FIG. 13A and FIG. 13B, the obtained differential waveform patterns are slightly different.
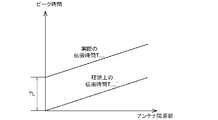
- FIG. 14 shows the relationship of the propagation time (peak time) from the start of transmission of the transmission signal in the differential waveform pattern to the peak with respect to the distance between the antennas of the transmission antenna and the reception antenna. If the distance between the antennas becomes zero, the time until reception of the differential waveform pattern from the start of transmission of the transmission signal should theoretically be zero, but as shown in FIG. Has an offset time TL.
- the offset time TL is considered to be due to the delay of the high-frequency signal from when the impulse current starts to flow to the terminal of the antenna until the electromagnetic wave is actually radiated from the antenna opening surface.
- the offset time TL is an error factor in the detection result of the abnormal tissue CA, it is necessary to remove it from the measured peak time T mn . Since the offset time TL varies due to various factors such as a difference in electronic device characteristics in each component of the detection apparatus and a difference in transmission / reception antenna characteristics, it is necessary to obtain the offset time TL for each measurement. Therefore, in this step, the offset time TL is obtained.
- the detection unit 34 obtains a time T from the start of transmission of a transmission signal to the first peak appearing in the differential waveform pattern by a combination of a transmission antenna and a reception antenna having different distances between the antennas.
- a solid line shown in FIG. 14 is determined based on the points plotted using the least square method. And the position coordinate of the intersection of this solid line and a vertical axis
- the detection unit 34 integrates the differential waveform patterns respectively obtained by combinations of transmission antennas and reception antennas having different antenna distances. Then, for the integrated waveform, a time T from the start of transmission of the transmission signal until the maximum peak appears is obtained, and the time T is plotted on the graph shown in FIG. 14, for example, a point plotted using the least square method The solid line shown in FIG. And the position coordinate of the intersection of this solid line and a vertical axis
- FIG. 15 shows a graph in the case where the time T from the start of transmission of a transmission signal to reception is generated for each transmission antenna.
- the curves (solid lines) for the transmission antennas Tx1, Tx3, and Tx4 are in good agreement, but the curve (dotted line) for the transmission antenna Tx2 is better than the curves of other antennas.
- the slope is also large.
- the measurement result related to the transmission antenna Tx2 may be excluded from the measurement result for detecting the abnormal tissue CA.
- the control unit 10 detects the abnormal tissue CA based on the differential waveform pattern (step S20).
- the time until reception that is, the propagation time (peak time) T mn until the peak appears
- the offset time TL is subtracted.
- the position of the abnormal tissue CA is detected by detecting the intersection of a plurality of ellipses based on the stroke distance of the microwave impulse signal.
- the detected abnormal tissue is imaged and stored in the storage unit 40 as detected image data 46 as shown in FIG. 7 and displayed on the display screen as necessary.
- FIGS. 16 (A) to 16 (C) show detection results (detected images) of abnormal tissue CA when time adjustment and level adjustment are not performed. As shown in FIGS. 16A to 16C, it is difficult to specify the position of the abnormal tissue CA when the time adjustment and the level adjustment are not performed.
- FIG. 17A shows the detection result of the abnormal tissue CA when the time adjustment is performed
- FIG. 17B shows the detection result of the abnormal tissue CA when the time adjustment and level adjustment are performed ( Image).
- abnormal tissue CA appears slightly in the middle and diagonally to the left.
- the position of the abnormal tissue CA can be specified.
- the detection position of the abnormal tissue CA is slightly different between when the level adjustment is performed and when the level adjustment is not performed, and the detection position of the abnormal tissue CA is more accurate when the level adjustment is performed.
- the waveform pattern for each set is matched to the time direction and the amplitude direction.
- the average waveform pattern at the same distance is calculated, and the detection target is detected based on the calculated average waveform pattern. Since the average waveform pattern at the same distance adjusted in the time direction and the amplitude direction is a waveform pattern with reduced noise and jitter, if the detection target is detected based on the waveform pattern, the detection accuracy of the detection target Can be improved.
- the transmission antennas Tx1 to Tx8 have the same positional relationship even if the lengths are slightly different.
- the received signal transmitted and received by the combination of the receiving antennas Rx1 to Rx8 may be calibrated to adjust the difference in the received signal due to the difference in the wiring length.
- the control unit 10 excludes reception signals with large variations in peak values and calculates an average waveform pattern for each set, and a bandpass filter for the difference waveform pattern
- the present embodiment is different from the first embodiment in that a compensation calculation or the like is applied. Moreover, it differs from the said Embodiment 1 by the point which uses the average waveform pattern for every group as a detection waveform pattern, and the same distance waveform pattern as a reference
- the basic functional configuration of the control unit 10 (FIG. 18) is the same as that of the first embodiment shown in FIG. 7 except for the part related to the average waveform pattern of all signals, but the difference between the detected waveform pattern and the reference waveform pattern. Therefore, some functions and processes are different from those in the first embodiment. Hereinafter, functions different from those of the first embodiment will be mainly described.
- the average waveform pattern generation unit 31 for each set excludes outliers from the received signal. Specifically, the average value and the standard deviation of the peak values are obtained from the peak value of each received signal acquired with the same combination of the transmitting antenna and the receiving antenna. Then, after removing received signals whose peak values are out of a certain confidence interval, an average waveform pattern for each set is calculated.
- the differential waveform pattern generation unit 33B includes a band filter for excluding noise from the differential waveform pattern.
- the differential waveform pattern includes high-frequency quantization noise and direct-current component low-frequency noise.
- the differential waveform pattern generation unit 33B applies a bandpass filter to the differential waveform pattern to remove these noises.
- the differential waveform pattern generation unit 33B includes a compensator for amplifying the reception signal attenuated by propagating through the body of the subject. Specifically, compensation is performed by multiplying the integral waveform of the differential waveform pattern by a compensation coefficient C of the following equation.
- ⁇ is the attenuation constant of the following equation
- r is the distance (the speed of light in the living body c ⁇ time t).
- ⁇ represents magnetic permeability
- ⁇ represents dielectric constant
- ⁇ represents angular frequency
- ⁇ represents conductivity.
- FIG. 19 shows a flow of operations of the abnormal tissue detection apparatus 1.
- FIG. 20 shows a data flow of the abnormal tissue detection apparatus 1.
- Step S31 is the same processing as step S11 of the first embodiment, and signals are transmitted and received a plurality of times, for example, 40 times with the same combination of antennas (FIG. 20). Then, the data (raw waveform data 41) of 40 received signals (data signal DATA2) is stored in the storage unit 40 for all combinations of antennas (64 ways).
- the control unit 10 excludes the data of the received signals whose peak values are out of the confidence interval with the constant peak value from the data of the 40 received signals (step S32). . Specifically, the average waveform pattern generation unit 31 for each set calculates the average value and standard deviation of the peak values based on the peak values of each of the 40 received signal data. Then, received signals whose peak values are outliers that are out of a certain confidence interval are excluded.
- the confidence interval for excluding outliers can be arbitrarily set based on the variation in the peak value of each received signal.
- a range of an average value ⁇ 1.64 ⁇ ( ⁇ : standard deviation), that is, a confidence interval of about 90% is set, and a peak value that deviates from this is set.
- the received signal is excluded.
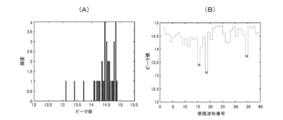
- FIG. 21A is a diagram showing the peak value of each received signal acquired by the combination of the transmitting antenna Tx1 and the receiving antenna Rx13
- FIG. 21B is a histogram of the peak value of each received signal. . Outliers outside the 90% confidence interval are excluded from the peak value of this received signal.
- control unit 10 uses the same combination of the transmission antenna and the reception antenna for the remaining reception signal (raw waveform data 41) from which the reception signal data related to the outlier is excluded from the first embodiment. Similarly to step S14, the time difference dT is calculated for time adjustment (step S33).
- control unit 10 uses the same combination of the transmission antenna and the reception antenna, and the remaining reception signal (raw waveform data 41) excluding the reception signal data related to the outlier is the same as that of the first embodiment.
- the remaining reception signal raw waveform data 41
- the remaining reception signal data related to the outlier is the same as that of the first embodiment.
- an offset Offset and a scale ratio A / B are obtained (step S34).
- the control unit 10 (average waveform pattern generation unit 31 for each group) serves as a detection waveform pattern generation unit for the remaining reception signal (raw waveform data 41) excluding the reception signal data related to the outlier in step S33. Adjustment is made based on the obtained shift time dT, the offset Offset and the scale ratio A / B obtained in step S34, and an average waveform pattern for the same combination of the transmission antenna and the reception antenna is calculated (step S35). That is, as shown in FIG. 20, the average waveform pattern generation unit 31 for each group excludes reception signals related to outliers from the 40 reception signals (data signal DATA2) by the filtering.
- each received signal (data signal DATA2) is a 4-bit coarse digital signal.
- the number of quantization bits of each digital received signal is increased, and is statistically valid. Since the signal waveform can be obtained, the influence of noise and jitter included in the received signal can be reduced. Further, by calculating the average waveform pattern for each set by excluding the reception signal related to the outlier, it is possible to obtain the average waveform pattern for each set with less influence of noise.
- control unit 10 serving as the reference waveform pattern generation unit averages each pair with the same combination of the transmission antenna and the reception antenna, as in step S13 of the first embodiment.
- the average waveform pattern having no peak in the waveform is excluded from the waveform pattern 42 (step S36). As described above, this exclusion may be performed by another threshold value.
- control unit 10 calculates an average signal pattern for the combination of the transmission antenna and the reception antenna having the same relative distance from the average waveform pattern 42 for each pair remaining in step S36. (Step S37).
- the calculated average waveform pattern is stored in the storage unit 40 as the same distance average waveform pattern 43.
- the calculated same distance average waveform pattern 43 is stored in the storage unit 40 as a reference waveform pattern.
- the control unit 10 calculates a difference waveform pattern between the average waveform pattern for each set as the detection waveform pattern and the same distance waveform pattern as the reference waveform pattern (step S38). That is, the control unit 10 determines whether the transmission antenna and the reception antenna having the same relative distance obtained in step S37 are obtained from the average waveform pattern 42 for each pair in the same combination of the transmission antenna and the reception antenna obtained in step S35. A difference waveform pattern is obtained by subtracting the same distance average waveform pattern 43 in the combination. As shown in FIG. 20, the differential waveform pattern is obtained for each combination of the transmission antenna and the reception antenna. The calculated differential waveform pattern is stored in the storage unit 40 as a differential waveform pattern 45 '.
- the control unit 10 performs noise removal using a bandpass filter (step S39).
- the differential waveform pattern 45 'calculated in step S38 includes high-frequency noise due to quantization error, which appears as spike-like noise in FIG.
- the integrated waveform obtained by integrating the differential waveform pattern 45 ′ in FIG. 22A increases as time passes, as shown in FIG. 22B. Therefore, it can be seen that the differential waveform pattern 45 ′ includes low frequency noise of a DC component. It can also be seen from the frequency spectrum obtained by Fourier transforming the differential waveform pattern 45 ′ shown in FIG. 22C that low frequency noise and high frequency noise are included.
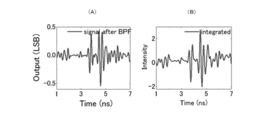
- FIG. 23A shows a waveform obtained by applying the above-described bandpass filter to the differential waveform pattern 45 ′ shown in FIG. By applying the bandpass filter, high frequency noise due to quantization error is removed.
- the integrated waveform obtained by integrating the differential waveform pattern 45 ′ shown in FIG. 23 (A) is kept horizontal without increasing with the passage of time, as shown in FIG. 23 (B). Therefore, it can be seen that the low-frequency noise of the DC component can be removed by applying the bandpass filter.
- control unit 10 compensates for the received signal attenuated by propagating through the body of the subject (step S40).
- the integral value calculated in step S39 is multiplied by the compensation coefficient C expressed by the above-described equations 1 and 2.
- the reflected wave from the abnormal tissue received late is made relatively large with respect to the direct wave from the transmitting antenna to the receiving antenna. (FIGS. 24A and 24B). Therefore, since the reflected wave from the abnormal tissue in the received waveform can be clarified, the accuracy of detecting the abnormal tissue can be improved.
- the control unit 10 adjusts the emission time point in the same manner as in step S19 of the first embodiment (step S41).
- the offset time TL is calculated by the method using the positive peak position in the differential waveform pattern 45 ′ or the method using the peak position when the differential waveform pattern 45 ′ is integrated. Not limited to.
- the offset time TL can be calculated using the negative peak position in the differential waveform pattern 45 ′.
- the detection unit 34 uses a combination of a transmission antenna and a reception antenna having different antenna distances to calculate a time T m from when transmission signal transmission is started until a negative peak appears in the differential waveform pattern 45 ′.
- the time Tm is plotted on a graph, and a solid line based on the plotted points is determined using, for example, the least square method. And the position coordinate of the intersection of this solid line and a vertical axis
- FIGS. 25A and 25B show an example in which a positive peak position is selected and a negative peak position is selected.
- FIG. 25A shows a differential waveform pattern 45 ′ in the transmission antenna Tx3 and the reception antenna Rx7.
- FIG. 25B shows a differential waveform pattern 45 ′ in the combination of the transmission antenna Tx3 and the reception antenna Rx15.
- TL 2.77 ns.
- the control unit 10 detects the abnormal tissue CA based on the differential waveform pattern, similarly to step S20 of the first embodiment (step S42).
- the position of the abnormal tissue CA is obtained by subtracting the offset time TL from the time until reception of the differential waveform pattern 45 ′ from the start of transmission of the transmission signal, that is, the propagation time (peak time) T mn until the peak appears. Then, based on the subtracted time T mn ′, the intersection of a plurality of ellipses based on the stroke distance of the microwave impulse signal is detected.
- step S41 when the offset time TL is calculated based on the positive peak value, the position of the abnormal tissue CA is detected based on the positive peak of the reflected signal.
- the offset time TL is calculated based on the negative peak value, the position of the abnormal tissue CA is detected based on the negative peak of the reflected signal.
- the detected abnormal tissue is imaged, stored as detected image data 46 in the storage unit 40, and displayed on the display screen as necessary.
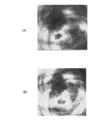
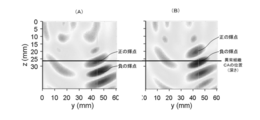
- FIG. 26 (A) and FIG. 26 (B) are examples in which the detected abnormal tissue is imaged.
- FIG. 26A shows a case where the abnormal tissue CA is detected using the offset time TL calculated based on the positive peak value. In this figure, the position of the abnormal tissue appears as a positive bright spot.
- FIG. 26B shows a case where the abnormal tissue CA is detected using the offset time TL calculated based on the negative peak value. In this figure, the position of the abnormal tissue appears as a negative bright spot. In this way, it is possible to select whether the position of the abnormal tissue CA is represented by a positive luminescent spot or a negative luminescent spot on the detection result image based on the calculation criterion of the offset time TL. Thereby, it becomes possible to create an image by a method that makes it easy to discriminate the abnormal tissue CA, and the detection accuracy of the abnormal tissue CA can be improved.
- FIG. 27A shows the detection result (detected image) of the abnormal tissue CA when the filtering by the band filter and the loss compensation are not performed.
- FIG. 27B shows the detection result of the abnormal tissue CA when filtering by the band filter is performed and loss compensation is not performed.
- FIG. 27C shows the detection result of the abnormal tissue CA in the case where filtering and loss compensation by the band filter are performed.
- the detection accuracy of the abnormal tissue CA can be improved by the bandpass filter and the loss compensation of the present embodiment.
- the number of antennas is eight transmitting antennas and eight receiving antennas, but the present invention is not limited to this, and the number of antennas may be arbitrary.
- the CMOS switches 13 and 17 do not have to be single-pole 8-throw, but may be other single-pole multi-throw switches. The number matches the number of transmitting antennas and receiving antennas. Note that it is desirable that the output ends of the CMOS switch 13 and the output ends of the CMOS switch 17 have numbers that can be arranged in a circle so that the lengths of the wirings are equal and not too long.
- CMOS switches 13 and 17 may be double pole multiple throw switches. In this case, since each antenna becomes both a transmission switch and a reception switch, the number of switch combinations can be increased.
- control unit 10 In addition, the hardware configuration and software configuration of the control unit 10 are examples, and can be arbitrarily changed and modified.
- the central part for performing the processing of the control unit 10 can be realized by using a normal computer system, not a dedicated system.
- a computer program for executing the above operation is stored and distributed in a computer-readable recording medium (flexible disk, CD-ROM, DVD-ROM, etc.), and the computer program is installed in the computer.
- the control unit 10 that executes the above-described processing may be configured.
- the computer program may be stored in a storage device included in a server device on a communication network such as the Internet, and the control unit 10 may be configured by being downloaded by a normal computer system.
- control unit 10 When the function of the control unit 10 is realized by sharing of an OS (operating system) and an application program, or by cooperation between the OS and the application program, only the application program portion may be stored in a recording medium or a storage device. Good.
- OS operating system
- application program portion may be stored in a recording medium or a storage device. Good.
- the computer program may be posted on a bulletin board (BBS, “Bulletin” Board System) on the communication network, and the computer program may be distributed via the network.
- BBS bulletin board
- the computer program may be started and executed in the same manner as other application programs under the control of the OS, so that the above-described processing may be executed.
- the present invention is suitable for an antenna array apparatus used for a breast cancer sensor or the like.
- the present invention is not limited to a breast cancer sensor, and can be applied to detection and discrimination of regions having different dielectric constants in living bodies and the external environment such as other tumors.
Landscapes
- Health & Medical Sciences (AREA)
- Life Sciences & Earth Sciences (AREA)
- Medical Informatics (AREA)
- Engineering & Computer Science (AREA)
- Biomedical Technology (AREA)
- Heart & Thoracic Surgery (AREA)
- Pathology (AREA)
- Molecular Biology (AREA)
- Surgery (AREA)
- Animal Behavior & Ethology (AREA)
- General Health & Medical Sciences (AREA)
- Public Health (AREA)
- Veterinary Medicine (AREA)
- Radar Systems Or Details Thereof (AREA)
Abstract
異常組織検出装置(1)の制御部(10)は、複数の送信アンテナ、受信アンテナが配列されたアンテナアレイ中の送信アンテナと受信アンテナとの相対距離が同じ組み合わせ(Tx1-Rx1、・・・、Tx8-Rx8)の組毎平均波形パターン(42)について、受信アンテナで受信された受信信号の信号波形におけるピークの時点に基づいて、信号波形の時間方向のずれを調整する(時間調整)。そして、制御部(10)は、送信アンテナと受信アンテナとの相対距離が同じ組み合わせにおける受信信号の信号波形の平均を示す同距離平均波形パターン(43)を生成する。送信アンテナと受信アンテナとの相対距離が同じ組み合わせにおける同距離平均波形パターン(43)と、全信号平均波形パターン(44)との差分を示す差分波形パターン(45)が生成される。
Description
本発明は、検出装置、信号処理方法及びプログラムに関する。
癌の診断は、例えば、X線や核磁気共鳴装置(MRI(Magnetic Resonance Imaging))により対象部位の画像を撮像し、撮像した画像を分析することにより行われるのが一般的である(例えば、特許文献1参照)。しかしながら、X線の生体への悪影響が懸念されるうえ、X線装置、MRI装置は、小型化が困難である。さらに、これらの装置を用いて診断を行うためには、専門機関での受診が必須になる。
そこで、X線装置やMRI装置を用いずに、簡易な構成で簡単に異常組織を検出することが可能な異常組織検出装置が提案されている(例えば、特許文献2参照)。この異常組織検出装置には、アンテナがマトリクス状に配置されたアンテナアレイが設けられている。この異常組織検出装置は、アンテナアレイの一のアンテナから生体にマイクロ波のインパルス信号を放射し、アンテナアレイの他のアンテナで、放射したインパルス信号の反射波を受信する。この異常組織検出装置は、マイクロ波のインパルス信号を送信するアンテナと、マイクロ波を受信するアンテナとの組み合わせを変えながら、インパルス信号の送受信を行い、各アンテナの組み合わせで得られた複数の受信信号に基づいて、生体内の異常組織を検出する。
特許文献2に開示された異常組織検出装置において生体内の異常組織を精度良く検出するためには、送受信を行うアンテナの組み合わせが変わっても、両アンテナの相対距離が同一であり、かつ、生体に異常組織がないのであれば、同じ受信信号(インパルス信号の反射波)を受信できるようになっている必要がある。アンテナの組み合わせが変わるだけで受信信号が変わってしまうのであれば、信号変動が極めて小さい生体内の異常組織を示す信号成分を検出するのが困難になるためである。
しかしながら、電波の送受信を行うアンテナの組み合わせによって、受信信号が異なる場合がある。送受信用のアンテナがアンテナアレイの外周側にあるのか内周側にあるのかなど、各アンテナの周囲の環境の違いによって受信信号のレベルの変化が発生するためである。そこで、ダミーアンテナなどを設けて電波の送受信状態を、異なるアンテナの組み合わせで同じ状態とするアンテナアレイ装置が開示されている(例えば、特許文献3参照)。
しかしながら、上述のアンテナアレイ装置のように、異なるアンテナの組み合わせで電波の送受信状態を同じにしても、受信信号の遅れなどがアンテナの組み合わせによって異なる場合がある。この受信信号の遅れの違いにより、検出精度が低下するおそれがある。
本発明は、上記実情に鑑みてなされたものであり、検出対象の検出精度を向上することができる検出装置、信号処理方法及びプログラムを提供することを目的とする。
上記目的を達成するために、本発明の第1の観点に係る検出装置は、
マイクロ波のインパルス信号を送信する複数の送信アンテナと、
前記インパルス信号を受信する複数の受信アンテナと、
選択する送信アンテナ及び受信アンテナの組み合わせを切り替えながら、インパルス信号を選択された送信アンテナに出力し、選択された受信アンテナで受信された受信信号を入力し、入力した受信信号に対する信号処理を行う制御部と、
を備え、
前記制御部は、
前記送信アンテナと前記受信アンテナとの所定の組み合わせについて、前記受信アンテナで受信された複数の受信信号の信号波形におけるピークの時点に基づいて、信号波形の時間方向のずれを調整する時間調整部と、
前記時間調整部で調整された複数の受信信号であって、前記送信アンテナと前記受信アンテナとの同一の組み合わせについて取得された複数の受信信号、または、前記送信アンテナと前記受信アンテナとの相対距離が同じ組み合わせについて取得された複数の受信信号の平均を示す検出波形パターンを生成する検出波形パターン生成部と、
前記検出波形パターンの生成に用いられた複数の受信信号を含み、より多数の受信信号の信号波形の平均を示す基準波形パターンを生成する基準波形パターン生成部と、
前記検出波形パターン生成部で生成された検出波形パターンと、前記基準波形パターン生成部で生成された基準波形パターンとの差分を示す差分波形パターンを生成する差分波形パターン生成部と、
前記差分波形パターン生成部で生成された差分波形パターンに基づいて、検出対象を検出する検出部と、
を備える。
マイクロ波のインパルス信号を送信する複数の送信アンテナと、
前記インパルス信号を受信する複数の受信アンテナと、
選択する送信アンテナ及び受信アンテナの組み合わせを切り替えながら、インパルス信号を選択された送信アンテナに出力し、選択された受信アンテナで受信された受信信号を入力し、入力した受信信号に対する信号処理を行う制御部と、
を備え、
前記制御部は、
前記送信アンテナと前記受信アンテナとの所定の組み合わせについて、前記受信アンテナで受信された複数の受信信号の信号波形におけるピークの時点に基づいて、信号波形の時間方向のずれを調整する時間調整部と、
前記時間調整部で調整された複数の受信信号であって、前記送信アンテナと前記受信アンテナとの同一の組み合わせについて取得された複数の受信信号、または、前記送信アンテナと前記受信アンテナとの相対距離が同じ組み合わせについて取得された複数の受信信号の平均を示す検出波形パターンを生成する検出波形パターン生成部と、
前記検出波形パターンの生成に用いられた複数の受信信号を含み、より多数の受信信号の信号波形の平均を示す基準波形パターンを生成する基準波形パターン生成部と、
前記検出波形パターン生成部で生成された検出波形パターンと、前記基準波形パターン生成部で生成された基準波形パターンとの差分を示す差分波形パターンを生成する差分波形パターン生成部と、
前記差分波形パターン生成部で生成された差分波形パターンに基づいて、検出対象を検出する検出部と、
を備える。
前記時間調整部は、前記送信アンテナと前記受信アンテナとの同一の組み合わせを所定の組み合わせとして信号波形の時間方向のずれを調整し、
前記検出波形パターン生成部は、
同一の前記送信アンテナと前記受信アンテナとの同一の組み合わせにおける複数の受信信号の信号波形を平均した組毎平均波形パターンを検出波形パターンとして生成し、
前記基準波形パターン生成部は、
前記送信アンテナと前記受信アンテナとの相対距離が同じ組み合わせでの前記組毎平均波形パターンを平均した同距離平均波形パターンを基準波形パターンとして生成する、
こととしてもよい。
前記検出波形パターン生成部は、
同一の前記送信アンテナと前記受信アンテナとの同一の組み合わせにおける複数の受信信号の信号波形を平均した組毎平均波形パターンを検出波形パターンとして生成し、
前記基準波形パターン生成部は、
前記送信アンテナと前記受信アンテナとの相対距離が同じ組み合わせでの前記組毎平均波形パターンを平均した同距離平均波形パターンを基準波形パターンとして生成する、
こととしてもよい。
前記時間調整部は、前記送信アンテナと前記受信アンテナとの相対距離が同じ組み合わせを所定の組み合わせとして信号波形の時間方向のずれを調整し、
前記検出波形パターン生成部は、
前記送信アンテナと前記受信アンテナとの相対距離が同じ組み合わせにおける受信信号の信号波形を平均した同距離平均波形パターンを検出波形パターンとして生成し、
前記基準波形パターン生成部は、
前記送信アンテナと前記受信アンテナとの全ての組み合わせでの受信信号の信号波形を平均した全信号平均波形パターンを基準波形パターンとして生成する、
こととしてもよい。
前記検出波形パターン生成部は、
前記送信アンテナと前記受信アンテナとの相対距離が同じ組み合わせにおける受信信号の信号波形を平均した同距離平均波形パターンを検出波形パターンとして生成し、
前記基準波形パターン生成部は、
前記送信アンテナと前記受信アンテナとの全ての組み合わせでの受信信号の信号波形を平均した全信号平均波形パターンを基準波形パターンとして生成する、
こととしてもよい。
前記制御部は、
前記送信アンテナと前記受信アンテナとの相対距離が同じ組み合わせについて、前記受信アンテナで受信された信号の信号波形のオフセット及び振幅に基づいて、前記受信アンテナで受信された信号の振幅が同一レベルになるように信号波形の振幅レベルを調整するレベル調整部を備える、
こととしてもよい。
前記送信アンテナと前記受信アンテナとの相対距離が同じ組み合わせについて、前記受信アンテナで受信された信号の信号波形のオフセット及び振幅に基づいて、前記受信アンテナで受信された信号の振幅が同一レベルになるように信号波形の振幅レベルを調整するレベル調整部を備える、
こととしてもよい。
前記送信アンテナと前記受信アンテナとの同じ組み合わせについて、複数回、インパルス信号を選択された送信アンテナに出力して選択された受信アンテナから出力された所定ビット数のデジタル受信信号を入力する信号送受信制御部と、
複数回入力されたデジタル受信信号の平均を前記所定ビット数より大きいビット数で表現する平均波形パターンを、その組み合わせの受信信号の信号波形の波形パターンとして取得する組毎平均波形パターン生成部と、
を備える、
こととしてもよい。
複数回入力されたデジタル受信信号の平均を前記所定ビット数より大きいビット数で表現する平均波形パターンを、その組み合わせの受信信号の信号波形の波形パターンとして取得する組毎平均波形パターン生成部と、
を備える、
こととしてもよい。
前記組毎平均波形パターン生成部は、
前記複数回入力されたデジタル受信信号のうち、前記デジタル受信信号の最大振幅が正規分布の90%信頼区間外であるデジタル受信信号を除外して、前記平均波形パターンを生成する、
こととしてもよい。
前記複数回入力されたデジタル受信信号のうち、前記デジタル受信信号の最大振幅が正規分布の90%信頼区間外であるデジタル受信信号を除外して、前記平均波形パターンを生成する、
こととしてもよい。
前記インパルス信号は、ガウシアンモノサイクルパルスである、
こととしてもよい。
こととしてもよい。
前記制御部は、
前記送信アンテナと前記受信アンテナとの相対距離が同じ組み合わせにおける受信信号の信号波形の平均を示す同距離平均波形パターンを生成する、同距離平均波形パターン生成部を備え、
前記同距離平均波形パターン生成部は、
前記送信アンテナと前記受信アンテナとの各組み合わせの受信信号の信号波形の波形パターンについて、正のピークに続いて正のピークが現れ、負のピークが現れない場合には、その組み合わせの受信信号の信号波形の波形パターンを計算対象から除外する、
こととしてもよい。
前記送信アンテナと前記受信アンテナとの相対距離が同じ組み合わせにおける受信信号の信号波形の平均を示す同距離平均波形パターンを生成する、同距離平均波形パターン生成部を備え、
前記同距離平均波形パターン生成部は、
前記送信アンテナと前記受信アンテナとの各組み合わせの受信信号の信号波形の波形パターンについて、正のピークに続いて正のピークが現れ、負のピークが現れない場合には、その組み合わせの受信信号の信号波形の波形パターンを計算対象から除外する、
こととしてもよい。
前記検出部は、
前記差分波形パターンに基づいて、前記インパルス信号を送信してから前記受信信号を受信するまでの伝搬時間を、前記送信アンテナと前記受信アンテナとの相対距離が同じ組み合わせについてそれぞれ求め、
求められた伝搬時間に基づいて、前記相対距離が0であると仮定したときの伝搬時間に含まれるオフセットを推定し、
前記伝搬時間に含まれるオフセットを差し引かれた前記伝搬時間に基づいて、検出対象の位置を検出する、
こととしてもよい。
前記差分波形パターンに基づいて、前記インパルス信号を送信してから前記受信信号を受信するまでの伝搬時間を、前記送信アンテナと前記受信アンテナとの相対距離が同じ組み合わせについてそれぞれ求め、
求められた伝搬時間に基づいて、前記相対距離が0であると仮定したときの伝搬時間に含まれるオフセットを推定し、
前記伝搬時間に含まれるオフセットを差し引かれた前記伝搬時間に基づいて、検出対象の位置を検出する、
こととしてもよい。
前記検出部は、
前記差分波形パターンの最初の正又は負のピーク位置に基づいて前記伝搬時間を求め、前記伝搬時間に含まれるオフセットを推定するとともに、
前記正のピーク位置に基づいて前記伝搬時間に含まれるオフセットを推定した場合には、前記差分波形パターンの正のピーク位置に基づいて、前記検出対象の位置を検出し、
前記負のピーク位置に基づいて前記オフセットを推定した場合には、前記差分波形パターンの負のピーク位置に基づいて、前記検出対象の位置を検出する、
こととしてもよい。
前記差分波形パターンの最初の正又は負のピーク位置に基づいて前記伝搬時間を求め、前記伝搬時間に含まれるオフセットを推定するとともに、
前記正のピーク位置に基づいて前記伝搬時間に含まれるオフセットを推定した場合には、前記差分波形パターンの正のピーク位置に基づいて、前記検出対象の位置を検出し、
前記負のピーク位置に基づいて前記オフセットを推定した場合には、前記差分波形パターンの負のピーク位置に基づいて、前記検出対象の位置を検出する、
こととしてもよい。
クロック信号を入力する論理回路、遅延回路及び半導体スイッチング素子の組み合わせ回路を有し、その組み合わせ回路を用いて複数の送信アンテナに送信するインパルス信号を生成する送信信号生成部を備える、
こととしてもよい。
こととしてもよい。
前記制御部は、
前記差分波形パターン生成部で生成された差分波形パターンから、低周波ノイズ及び高周波ノイズを除去する帯域フィルタを備える、
こととしてもよい。
前記差分波形パターン生成部で生成された差分波形パターンから、低周波ノイズ及び高周波ノイズを除去する帯域フィルタを備える、
こととしてもよい。
前記制御部は、
前記差分波形パターンを、前記インパルス信号が伝搬する媒体の損失式で補償する補償器を備える、
こととしてもよい。
前記差分波形パターンを、前記インパルス信号が伝搬する媒体の損失式で補償する補償器を備える、
こととしてもよい。
本発明の第2の観点に係る信号処理方法は、
マイクロ波のインパルス信号を送信する複数の送信アンテナと、前記インパルス信号を受信する複数の受信アンテナとの組み合わせを切り替えながら、インパルス信号を選択された送信アンテナに出力し、選択された受信アンテナで受信された受信信号を入力し、入力した受信信号に対する信号処理を行う信号処理方法であって、
前記送信アンテナと前記受信アンテナとの所定の組み合わせについて、前記受信アンテナで受信された複数の受信信号の信号波形におけるピークの時点に基づいて、信号波形の時間方向のずれを調整する時間調整ステップと、
前記時間調整ステップで調整された複数の受信信号であって、前記送信アンテナと前記受信アンテナとの同一の組み合わせについて取得された複数の受信信号、または、前記送信アンテナと前記受信アンテナとの相対距離が同じ組み合わせについて取得された複数の受信信号の平均を示す検出波形パターンを生成する検出波形パターン生成ステップと、
前記検出波形パターンの生成に用いられた複数の受信信号を含み、より多数の受信信号の信号波形の平均を示す基準波形パターンを生成する基準波形パターン生成ステップと、
前記検出波形パターンステップで生成された検出波形パターンと、前記基準波形パターン生成ステップで生成された基準波形パターンとの差分を示す差分波形パターンを生成する差分波形パターン生成ステップと、
前記差分波形パターン生成ステップで生成された差分波形パターンに基づいて、検出対象を検出する検出ステップと、
を含む。
マイクロ波のインパルス信号を送信する複数の送信アンテナと、前記インパルス信号を受信する複数の受信アンテナとの組み合わせを切り替えながら、インパルス信号を選択された送信アンテナに出力し、選択された受信アンテナで受信された受信信号を入力し、入力した受信信号に対する信号処理を行う信号処理方法であって、
前記送信アンテナと前記受信アンテナとの所定の組み合わせについて、前記受信アンテナで受信された複数の受信信号の信号波形におけるピークの時点に基づいて、信号波形の時間方向のずれを調整する時間調整ステップと、
前記時間調整ステップで調整された複数の受信信号であって、前記送信アンテナと前記受信アンテナとの同一の組み合わせについて取得された複数の受信信号、または、前記送信アンテナと前記受信アンテナとの相対距離が同じ組み合わせについて取得された複数の受信信号の平均を示す検出波形パターンを生成する検出波形パターン生成ステップと、
前記検出波形パターンの生成に用いられた複数の受信信号を含み、より多数の受信信号の信号波形の平均を示す基準波形パターンを生成する基準波形パターン生成ステップと、
前記検出波形パターンステップで生成された検出波形パターンと、前記基準波形パターン生成ステップで生成された基準波形パターンとの差分を示す差分波形パターンを生成する差分波形パターン生成ステップと、
前記差分波形パターン生成ステップで生成された差分波形パターンに基づいて、検出対象を検出する検出ステップと、
を含む。
本発明の第3の観点に係るプログラムは、
コンピュータを、
マイクロ波のインパルス信号を送信する複数の送信アンテナと、前記インパルス信号を受信する複数の受信アンテナとの組み合わせを切り替えながら、インパルス信号を選択された送信アンテナに出力し、選択された受信アンテナで受信された受信信号を入力し、入力した受信信号に対する信号処理を行う制御部、
前記送信アンテナと前記受信アンテナとの所定の組み合わせについて、前記受信アンテナで受信された複数の受信信号の信号波形におけるピークの時点に基づいて、信号波形の時間方向のずれを調整する時間調整部、
前記時間調整部で調整された複数の受信信号であって、前記送信アンテナと前記受信アンテナとの同一の組み合わせについて取得された複数の受信信号、または、前記送信アンテナと前記受信アンテナとの相対距離が同じ組み合わせについて取得された複数の受信信号の平均を示す検出波形パターンを生成する検出波形パターン生成部、
前記検出波形パターンの生成に用いられた複数の受信信号を含み、より多数の受信信号の信号波形の平均を示す基準波形パターンを生成する基準波形パターン生成部、
前記検出波形パターン生成部で生成された検出波形パターンと、前記基準波形パターン生成部で生成された基準波形パターンとの差分を示す差分波形パターンを生成する差分波形パターン生成部、
前記差分波形パターン生成部で生成された差分波形パターンに基づいて、検出対象を検出する検出部、
として機能させる。
コンピュータを、
マイクロ波のインパルス信号を送信する複数の送信アンテナと、前記インパルス信号を受信する複数の受信アンテナとの組み合わせを切り替えながら、インパルス信号を選択された送信アンテナに出力し、選択された受信アンテナで受信された受信信号を入力し、入力した受信信号に対する信号処理を行う制御部、
前記送信アンテナと前記受信アンテナとの所定の組み合わせについて、前記受信アンテナで受信された複数の受信信号の信号波形におけるピークの時点に基づいて、信号波形の時間方向のずれを調整する時間調整部、
前記時間調整部で調整された複数の受信信号であって、前記送信アンテナと前記受信アンテナとの同一の組み合わせについて取得された複数の受信信号、または、前記送信アンテナと前記受信アンテナとの相対距離が同じ組み合わせについて取得された複数の受信信号の平均を示す検出波形パターンを生成する検出波形パターン生成部、
前記検出波形パターンの生成に用いられた複数の受信信号を含み、より多数の受信信号の信号波形の平均を示す基準波形パターンを生成する基準波形パターン生成部、
前記検出波形パターン生成部で生成された検出波形パターンと、前記基準波形パターン生成部で生成された基準波形パターンとの差分を示す差分波形パターンを生成する差分波形パターン生成部、
前記差分波形パターン生成部で生成された差分波形パターンに基づいて、検出対象を検出する検出部、
として機能させる。
本発明によれば、相対距離が同じである送信アンテナ及び受信アンテナの組み合わせで得られた受信信号について、それぞれの波形パターンを時間方向に合わせた上で、平均の波形パターンを算出し、算出した平均の波形パターンに基づいて検出対象を検出する。時間方向に調整された平均の波形パターンは、ノイズやジッタが低減された波形パターンとなるので、その波形パターンに基づいて検出対象を検出すれば、検出対象の検出精度を向上することができる。
以下、本発明の実施の形態に係る検出装置、信号処理方法及びプログラムについて、乳癌を検出する乳癌センサを例に、図面を参照して詳細に説明する。なお、各実施の形態では、送受信用のアンテナがアンテナアレイの外周側にあるのか内周側にあるのかなど、各アンテナの周囲の環境の違いによる受信信号の違いを考慮しないものとする。
(実施形態1)
図1に示すように、異常組織検出装置1は、制御部10と、送信部11と、送信アンプ12と、CMOS(Complementary Metal Oxide Semiconductor)スイッチ13と、配線部14と、アンテナアレイ15と、配線部16と、CMOSスイッチ17と、受信アンプ18と、受信部19と、選択部20と、を備える。
図1に示すように、異常組織検出装置1は、制御部10と、送信部11と、送信アンプ12と、CMOS(Complementary Metal Oxide Semiconductor)スイッチ13と、配線部14と、アンテナアレイ15と、配線部16と、CMOSスイッチ17と、受信アンプ18と、受信部19と、選択部20と、を備える。
制御部10は、CPU、メモリ、外部記憶装置、入出力I/O、水晶発振器等を備えるコンピュータ(情報処理装置)である。水晶発振器が発生するクロック信号に従って、CPUが、外部記憶装置にインストールされメモリに読み込まれたプログラムを実行して、外部記憶装置へのデータの書き込み/読み出しや入出力I/Oを介して外部機器と送受信を行うことにより、制御部10の機能が実現される。
例えば、制御部10は、データ信号DATA及びクロック信号CLKを送信部11に出力する。制御部10は、受信部19からデータ信号DATA2を入力するとともに受信部19に対しクロック信号CLKを出力する。さらに、制御部10は、選択部20にCMOSスイッチ13、17の制御信号CS1を出力する。
送信信号生成部としての送信部11は、制御部10から入力されたクロック信号CLKに従って、例えば、図2に示すようなインパルス状の電気信号である送信信号SS1を生成して出力するハードウエア回路である。図2に示すように、送信信号SS1は、短時間で正のピークと負のピークが連続するインパルス状の電気信号である。この信号は、ガウシアンモノサイクルパルス(Gaussian monocycle pulse,GMP)とも呼ばれる。GMPは、マイクロ波帯(例えば、中心周波数6GHz)における広帯域信号である。送信信号SS1は、繰り返し周波数(例えば100MHz)で繰り返し送信される。
送信部11は、論理回路、遅延回路及び半導体スイッチング素子等の組み合わせ回路で構成されている。図3に示すように、送信部11は、NAND回路21A、21Bと、NOR回路21C、21Dと、遅延回路22A~22Dと、OR回路23A、23Cと、AND回路23B、23Dと、ダウンパルスジェネレータ24A、24Cと、アップパルスジェネレータ24B、24Dと、バッファ回路25A、25Bと、を備える。
NAND回路21A、21Bは、否定論理積の論理回路である。NAND回路21Aには、クロック信号CLOCK(CLK)と、データ信号DATAとが入力される。また、NAND回路21Bには、クロック信号CLOCKと、データ信号/DATAとが入力される。NOR回路21C、21Dは、否定論理和の論理回路である。NOR回路21Cには、クロック信号/CLOCKと、データ信号/DATAとが入力される。さらに、NOR回路21Dには、クロック信号/CLOCKと、データ信号DATAとが入力される。データ信号DATA、/DATAとしては、BPSK(Binary Phase Shift Keying)信号が入力される。
遅延回路22Aには、NAND回路21Aの出力が入力され、遅延回路22Bには、NAND回路21Bの出力が入力される。また、遅延回路22Cには、NOR回路21Cの出力が入力され、遅延回路22Dには、NOR回路21Dの出力が入力される。
遅延回路22A~22Dでは、4つのインバータが直列で接続されている。1δは、1つのインバータの遅延時間を表している。1δ、2δ、3δ及び4δは、1番目、2番目、3番目、4番目のインバータの出力であり、それぞれの出力の遅延時間は、1δの等倍、2倍、3倍、4倍の遅延時間となる。
OR回路23Aは、遅延回路22Aで1δ遅延した信号と、遅延回路22Dの4δ遅延した信号とを入力する。AND回路23Bは、遅延回路22Bで2δ遅延した信号と、遅延回路22Cで3δ遅延した信号とを入力する。また、OR回路23Cは、遅延回路22Bで1δ遅延した信号と、遅延回路22Cで4δ遅延した信号とを入力する。AND回路23Dは、遅延回路22Aで2δ遅延した信号と、遅延回路22Dで3δ遅延した信号とを入力する。
続いて、ダウンパルスジェネレータ24Aは、OR回路23Aから出力された信号を入力する。アップパルスジェネレータ24Bは、AND回路23Bから出力された信号を入力する。また、ダウンパルスジェネレータ24Cは、OR回路23Cから出力された信号入力する。アップパルスジェネレータ24Dは、AND回路23Dから出力された信号を入力する。
バッファ回路25Aは、ダウンパルスジェネレータ24Aから出力された信号と、アップパルスジェネレータ24Bから出力された信号とを入力し、差動出力の正側の出力信号OPを出力する。バッファ回路25Bは、ダウンパルスジェネレータ24Cから出力された信号と、アップパルスジェネレータ24Dから出力された信号とを入力し、差動出力の負側の出力信号OMを出力する。
データ信号DATAが0である場合、OR回路23Cの出力信号であるクロック信号Ck(図3参照)は、図4(A)に示すように、ハイレベル(H)とローレベル(L)とを繰り返す周期信号となる。すると、ダウンパルスジェネレータ24C内部のインバータの出力a(図3参照)は、遅延時間1δだけ遅れ反転した図4(B)に示すような波形となって、ダウンパルスジェネレータ24Cの出力b(図3参照)は、図4(C)に示すような波形となる。この場合、ダウンパルスジェネレータ24Cのオン出力により、バッファ回路25Bの正極側のスイッチング素子に流れる電流Idは、図4(D)に示すような波形となる。
同様に、アップパルスジェネレータ24Dのオン出力により、バッファ回路25Bの負側スイッチング素子に流れる電流Iuは、図4(E)に示すような波形となる。したがって、電流Idと電流Iuの和は、図4(F)に示すように変化する。この結果、送信部11の差動出力の負側の出力信号OMは、図4(G)に示すような波形となる。
一方、ダウンパルスジェネレータ24A、アップパルスジェネレータ24Bから出力される信号は、ダウンパルスジェネレータ24C、アップパルスジェネレータ24Dから出力される信号と論理が逆であるため、出力信号OPの波形パターンは、出力信号OMの波形パターンの逆となる。
図1に戻り、送信アンプ12は、送信部11から入力した送信信号SS1を増幅して送信信号SS2として出力する。具体的には、送信アンプ12は、DCカットフィルタ、アッテネータ、可変利得パワーアンプ、STEPアッテネータ等を有し、直流成分がカットされ、かつ、ゲインが増幅された送信信号SS2を生成する。
CMOSスイッチ13は、単極8投のスイッチである。CMOSスイッチ13は、入力端から送信信号SS2を入力する。CMOSスイッチ13では、複数の出力端それぞれが複数の送信アンテナTx1、Tx2、…、Tx8と接続されている。CMOSスイッチ13は、後述される選択部20から出力される制御信号CS2に従って、入力した送信信号SS2を出力するアンテナを、複数の送信アンテナTx1、Tx2、…、Tx8のいずれかに切り替える。
配線部14は、CMOSスイッチ13の8つの出力端のいずれかと、送信アンテナTx1~Tx8のいずれかとを、同じ長さの配線で結ぶ8つの伝送線路を備えている。この伝送路は、同軸ケーブルやマイクロストラップライン等で形成されている。配線部14で送信アンテナTx1~Tx8に信号を送信する伝送線路の長さが同じであるため、各伝送線路を流れる信号の時間差は、ほとんどなくなっている。
アンテナアレイ15は、複数の送信アンテナTx1、Tx2、…、Tx8を備える。複数の送信アンテナTx1、Tx2、…、Tx8は、入力した送信信号SS2に従ってマイクロ波のインパルス信号MWを送信する。インパルス信号MWは、被検者の体内の異常組織CAで反射し、反射信号RWとなる。
アンテナアレイ15は、複数の受信アンテナRx1、Rx2、…、Rx8を備える。複数の受信アンテナRx1、Rx2、…、Rx8は、マイクロ波(反射信号RW)を受信する。
図5(A)にはアンテナアレイ15の一方の面が示され、図5(B)にはアンテナアレイ15の他方の面が示されている。アンテナアレイ15では、図5(A)、図5(B)に示すように、複数のアンテナが4×4のマトリクス状に配列されている。アンテナアレイ15の大きさは、例えば、55.4mm×47mmであり、厚みは、0.635mmである。各アンテナは、11mm×13.1mmである。また、アンテナ間のギャップは、1mmに設定されている。アンテナアレイ15では、送信アンテナTx1~Tx4がX軸方向に並んで配置され、受信アンテナRx1~Rx4がX軸方向に並んで配置され、送信アンテナTx5~Tx8がX軸方向に並んで配置され、受信アンテナRx5~Rx8がX軸方向に並んで配置されている。送信アンテナTx1~Tx4、受信アンテナRx1~Rx4、送信アンテナTx5~Tx8、受信アンテナRx5~Rx8は、Y軸方向にこの順で並んでいる。
アンテナアレイ15では、送信アンテナTxm(m=1~8)と受信アンテナRxn(n=1~8)との相対距離が同じとなる送信アンテナと受信アンテナとの組み合わせ(Txm、Rxn)でのマイクロ波のインパルス信号の受信環境が同じになるように形成されている。
配線部16は、CMOSスイッチ17の8つの入力端のいずれかと、受信アンテナRx1~Rx8のいずれかとを、同じ長さの配線で結ぶ8つの伝送線路を備えている。配線部16では、受信アンテナRx1~Rx8から信号を送信する伝送線路の長さが同じであるため、各信号の時間差がほとんどなくなっている。
CMOSスイッチ17は、単極8投のスイッチである。CMOSスイッチ17は、8つの入力端を有し、複数の受信アンテナRx1~Rx8で受信した信号を入力する。CMOSスイッチ17では、1つの出力端が受信アンプ18と接続されている。CMOSスイッチ17は、選択部20から出力された制御信号CS2に従って受信した信号を、受信信号RS1として受信アンプ18に送信する複数の受信アンテナRx1、Rx2、…、Rx8のいずれかに切り替える。CMOSスイッチ17では、制御信号CS2によって入力端から入力された受信信号が、受信信号RS1として出力される。
受信アンプ18は、受信信号RS1を増幅し、増幅した信号を受信信号RS2として出力する。具体的には、受信アンプ18は、低雑音増幅器、STEPアッテネータ及びDCカットフィルタ等を有しており、受信信号RS1を入力し、これらの内部回路を経て受信信号RS2を生成して出力する。
受信部19は、受信アンプ18から入力した受信信号RS2を制御部10に出力するハードウエア回路である。受信信号RS2は、デジタルのデータ信号DATA2に変換され、制御部10に入力される。データ信号DATA2は例えば4ビットの信号である。
選択部20は、制御部10から出力された制御信号CS1に従って、CMOSスイッチ13、17を切り替えるための制御信号CS2を出力するハードウエア回路である。CMOSスイッチ13、17では、この制御信号CS2に従ってスイッチが切り替えられ、アンテナアレイ15の送信アンテナTx1~Tx8のうち、1つの送信アンテナと、受信アンテナRx1~Rx8のうち、1つの受信アンテナが選択される。
制御部10は、入力したデータ信号DATA2に対して信号処理を行って、異常組織CAを検出する。
図1に示すように、制御信号CS2により、送信アンテナTx2が選択された場合には、CMOSスイッチ13は、送信信号SS2を送信アンテナTx2に出力するように切り変わる。制御信号CS2により、受信アンテナRx2が選択された場合には、CMOSスイッチ17は、受信アンテナRx2で受信された受信信号RS1を受信アンプ18に出力するように切り変わる。この場合、送信アンテナTx2、受信アンテナRx2の組み合わせでマイクロ波のインパルス信号MWの送受信が行われる。
制御部10は、制御信号CS2によりCMOSスイッチ13、17を制御して、送信アンテナTx1~Tx8及び受信アンテナRx1~Rx8の組み合わせを切り替えながら、送信信号SS2をCMOSスイッチ13に出力し、受信アンテナRx1~Rx8から出力された受信信号RS1を、CMOSスイッチ17を介して入力し、入力した電気信号に対する信号処理を行う。
図6に示すように、送信アンテナTx1からマイクロ波のインパルス信号を放射する。放射されたマイクロ波の一部は、生体内を伝播する。一般に、癌組織等の異常組織CAは、通常の生体組織に比して、5~10倍程度の高い誘電率を有することが知られている。したがって、異常組織CAが存在する場合には、誘電率の異なる領域の界面、即ち、異常組織CAの表面で、マイクロ波が反射され、受信アンテナRx2~Rx4で受信される。
ここで、マイクロ波のインパルス信号を放射してから受信アンテナRx2が反射波を受信するまでの時間をT12[s]とすると、T12・c(c:生体中の光の速度)が、マイクロ波のインパルス信号の行程距離となる。
従って、異常組織CAは、送信アンテナTx1と受信アンテナRx2を焦点とし、アンテナTx1とRx2からの距離の和がT12・cとなる楕円E12上に位置することになる。
アンテナRx3、Rx4が受信したマイクロ波についても同様の処理を行い、複数の楕円E12~E14(E14については不図示)の交点を求めることにより、異常組織CAの位置を求めることができる。なお、送信アンテナTxmからインパルス信号が送信されてから受信アンテナRxnが受信するまでの時間を、伝搬時間Tmnとする。
さらに、インパルス信号を送信するアンテナを送信アンテナTx2に切り換えて、送信アンテナTx2からマイクロ波を放射し、これを受信アンテナRx2~Rx4で受信して、同様の処理を行う。以後、送信アンテナを順次切り換えながら、マイクロ波を放射し、受信アンテナで反射波を受信し、同様の処理を行うことにより、異常組織CAの位置をより正確に特定することが可能となる。
上述のように、異常組織検出装置1では、送信アンテナTx1~Tx8と受信アンテナRx1~Rx8との間で送受信されるインパルス信号の伝搬時間に基づいて、異常組織CAを検出する。そのため、本実施の形態のように、回路上のインパルス信号の遅れを解消することにより、異常組織CAの位置を精度良く検出することができる。
なお、上述の例では、理解を容易にするため、2次元で説明したが、実際は、3次元で上述の処理を行うことになる。
図7には、制御部10の機能構成が示されている。図7に示すように、制御部10は、信号送受信制御部30と、組毎平均波形パターン生成部31と、時間調整部32Aと、レベル調整部32Bと、同距離平均波形パターン生成部32Cと、全信号平均波形パターン生成部33Aと、差分波形パターン生成部33Bと、検出部34と、記憶部40と、を備える。記憶部40には、生波形データ41と、組毎平均波形パターン42と、同距離平均波形パターン43と、全信号平均波形パターン44と、差分波形パターン45と、検出画像データ46と、が記憶される。図7に示す各部は、上述のように、CPUの実行により実現される。
信号送受信制御部30は、選択する送信アンテナ及び受信アンテナの組み合わせを切り替えながら、インパルス信号を選択された送信アンテナに出力し、選択された受信アンテナで受信された受信信号を入力する。信号送受信制御部30は、送信アンテナと受信アンテナとの同じ組み合わせについて、複数回、インパルス信号を選択された送信アンテナに出力して選択された受信アンテナから出力された量子化ビット数4ビットのデジタル受信信号(データ信号DATA2)を入力する。このデータは、生波形データ41として記憶部40に記憶される。
組毎平均波形パターン生成部31は、複数回入力された4ビットのデジタル受信信号の平均を、4ビットより大きい量子化ビット数で表現する平均波形パターンを、その組み合わせの受信信号の信号波形の波形パターンとして取得する。取得されたパターンは、組毎平均波形パターン42として記憶部40に記憶される。
時間調整部32Aは、送信アンテナと受信アンテナとの相対距離が同じ組み合わせについて、受信アンテナで受信された受信信号の信号波形におけるピークの時点に基づいて、信号波形の時間方向のずれを調整する。具体的には、ピークの時点が一致するように、信号波形が重ね合わされた状態に信号波形の時間が調整される。
また、レベル調整部32Bは、送信アンテナと受信アンテナとの相対距離が同じ組み合わせについて、受信アンテナで受信された信号の信号波形のオフセットOffset及び振幅に基づいて、受信アンテナで受信された信号の振幅が同一レベルになるように信号波形の振幅レベルを調整する。具体的には、各信号波形の中心及び振幅が同じになるように、各信号波形のスケールを調整する。
さらに、検出波形パターン生成部としての、同距離平均波形パターン生成部32Cは、信号波形の時間方向のずれが調整され、信号波形の振幅レベルが調整された、送信アンテナと受信アンテナとの相対距離が同じ組み合わせにおける受信信号の信号波形の平均を示す同距離平均波形パターンを生成する。生成された波形パターンは、同距離平均波形パターン43として、記憶部40に記憶される。
なお、同距離平均波形パターン生成部32Cは、送信アンテナと受信アンテナとの各組み合わせの受信信号の信号波形の波形パターンについて、正のピークに続いて正のピークが現れ、負のピークが現れない場合には、その組み合わせの受信信号の信号波形の波形パターンを、検出対象を検出するための計算対象から除外する。
基準波形パターン生成部としての、全信号平均波形パターン生成部33Aは、送信アンテナと受信アンテナとの全ての組み合わせでの受信信号の信号波形の平均を示す全信号平均波形パターンを生成する。生成された波形パターンは、全信号平均波形パターン44として記憶部40に記憶される。また、差分波形パターン生成部33Bは、同距離平均波形パターン生成部32Cで生成された送信アンテナと受信アンテナとの相対距離が同じ組み合わせにおける同距離平均波形パターン43と、全信号平均波形パターン生成部33Aで生成された全信号平均波形パターン44との差分を示す差分波形パターンを生成する。生成された波形パターンは、差分波形パターン45として記憶部40に記憶される。
検出部34は、差分波形パターン生成部33Bで生成された差分波形パターン45に基づいて、検出対象を検出する。検出部34は、差分波形パターン45に基づいて、インパルス信号を送信してから受信信号を受信するまでの伝搬時間Tmnを、送信アンテナと受信アンテナとの相対距離(アンテナ間距離)が同じ組み合わせについてそれぞれ求める。そして、検出部34は、求められた伝搬時間Tmnに基づいて、送信アンテナと受信アンテナとの相対距離(アンテナ間距離)が0であると仮定したときにも残る、伝搬時間Tmnに含まれるオフセットTLを推定する(図14参照)。このオフセットTLの詳細については後述する。さらに、検出部34は、オフセットTLが差し引かれた伝搬時間Tmn’に基づいて、検出対象の位置を検出する。
次に、本実施の形態に係る異常組織検出装置1の動作について説明する。図8には、異常組織検出装置1の動作の流れが示されている。図9には、異常組織検出装置1のデータの流れが示されている。
図8には、制御部10の処理の流れが示されている。図8に示すように、まず、制御部10(信号送受信制御部30)は、全ての組み合わせでマイクロ波を送受信し、受信信号を取得する(ステップS11)。例えば、信号送受信制御部30は、送信アンテナTx1及び受信アンテナRx1を選択する制御信号CS1を出力するとともに、送信部11にデータ信号DATAを出力し、送信信号SS1を出力させる。このようにして、送信アンテナTx1と受信アンテナRx1との間で信号の送受信が行われ、受信アンテナRx1で受信された信号が、制御部10に入力される。信号送受信制御部30は、この受信信号を生波形データ41として記憶部40に記憶する。受信信号は、送受信に用いられた送信アンテナ及び受信アンテナの情報(Tx1-Rx1)と関連付けられて記憶される。信号送受信制御部30は同じアンテナの組み合わせ(Tx1-Rx1)で、複数回、例えば16回信号の送受信を行う。したがって、記憶部40には、同じアンテナの組み合わせ(Tx1-Rx1)における受信信号(データ信号DATA2)のデータが16個記憶される。
次に、信号送受信制御部30は、制御信号CS1を出力して、送信アンテナTx1及び受信アンテナRx2を選択する制御信号CS2を選択部20に出力させるとともに、送信部11に送信信号SS1を出力させる。信号の送受信は、16回行われ、アンテナの組み合わせ(Tx1-Rx2)についても、16個の受信信号が取得され、記憶部40に記憶される。
このようにして、全てのアンテナの組み合わせ(Tx1-Rx1)、(Tx1-Rx2)、…、(Tx2-Rx1)、…、(Tx2-Rx8)、(Tx3-Rx1)、…、(Tx3-Rx8)、(Tx4-Rx1)、…、(Tx4-Rx8)、(Tx5-Rx1)、…、(Tx5-Rx8)、(Tx6-Rx1)、…、(Tx6-Rx8)、(Tx7-Rx1)、…、(Tx7-Rx8)、(Tx8-Rx1)、…、(Tx8-Rx8)について、それぞれ16個の受信信号(データ信号DATA2)が取得され、制御部10に記憶される。アンテナの組み合わせは64通りあるので、図9に示すように、アンテナの各組み合わせで64通り、計16×64個の受信信号のデータ(生波形データ41)が記憶される。
続いて、制御部10(組毎平均波形パターン生成部31)は、送信アンテナ及び受信アンテナの同一の組み合わせでの平均波形パターンを算出する(ステップS12)。この時点で、組毎平均波形パターン生成部31は、アンテナの組み合わせ毎に16個の受信信号(生波形データ41)を記憶している。組毎平均波形パターン生成部31は、図9に示すように、この16個の受信信号(データ信号DATA2)の平均波形パターンを、組毎平均波形パターン42として算出する。各受信信号(データ信号DATA2)は4ビットの粗いデジタル信号であるが、この平均化により、各デジタル受信信号の量子化ビット数を上げ、統計的に見て妥当な信号波形を得ることができるので、受信信号に含まれるノイズ及びジッタの影響を低減することができる。
続いて、制御部10(同距離平均波形パターン生成部32C)は、送信アンテナ及び受信アンテナの同一の組み合わせでの組毎平均波形パターン42の中から、波形にピークを有しない平均波形パターンを除外する(ステップS13)。例えば、同距離平均波形パターン生成部32Cは、正のピークの後に負のピークが現れない平均波形パターンについては、その後の計算対象から除外する。この除外は、他に閾値によって行われるようにしてもよい。
続いて、制御部10(時間調整部32A)は、相対距離が同じ送信アンテナ及び受信アンテナの組み合わせでの平均波形パターンの時間調整を行う(ステップS14)。例えば、相対距離が同じ送信アンテナ及び受信アンテナの組み合わせとしては、図5(A)及び図5(B)に示すように、(Tx1-Rx1)、(Tx2-Rx2)、(Tx3-Rx3)、(Tx4-Rx4)、(Tx5-Rx5)、(Tx6-Rx6)、(Tx7-Rx7)、(Tx8-Rx8)等がある。
図10(A)には、相対距離が同じ送信アンテナ及び受信アンテナの2つの組み合わせにおける平均波形パターンが表示されている。図10(A)では、2つの平均波形パターンはよく重なっているように見えるが、実際には、そのピーク付近を拡大した図10(B)に示すように、2つの信号波形のピークP1、P2は時間方向にずれている。そこで、制御部10は、図10(B)のさらなる拡大図である図10(C)に示すように、2つの信号波形のピークP1、P2の中心時点A1、A2を算出し、そのずれ時間dTを算出する。なお、ピークP1、P2に幅がある場合には、最大値を維持するピークP1、P2の頂点の中央を、中心時点A1、A2とすればよい。
続いて、制御部10(レベル調整部32B)は、相対距離が同じ送信アンテナ及び受信アンテナの組み合わせでの平均波形パターンのレベル調整を行う(ステップS15)。具体的には、レベル調整部32Bは、図11(A)に示すように、相対距離が同じ送信アンテナ及び受信アンテナの組み合わせでの2つの平均波形パターンのオフセット成分Offsetを求め、図11(B)に示すように、2つの平均波形パターンの最大値と最小値とのレベルA、Bのスケール比を求める。
続いて、制御部10(同距離平均波形パターン生成部32C)は、求めたずれ時間dTと、オフセットOffset及びスケール比A/Bに基づいて、相対距離が同じ送信アンテナ及び受信アンテナの組み合わせでの平均信号パターンを算出する(ステップS16)。例えば(Tx1-Rx1)、(Tx2-Rx2)、(Tx3-Rx3)、(Tx4-Rx4)、(Tx5-Rx5)、(Tx6-Rx6)、(Tx7-Rx7)、(Tx8-Rx8)について、時間調整(時間ずれの調整)及びレベル調整が行われ、相対距離が同じ送信アンテナ及び受信アンテナの組み合わせでの平均波形パターンが算出される。算出された平均波形パターンは、図7、図9に示すように、同距離平均波形パターン43(検出波形パターン)として、記憶部40に記憶される。
続いて、制御部10(全信号平均波形パターン生成部33A)は、全ての送信アンテナ及び受信アンテナの組み合わせでの平均波形パターンを全信号平均波形パターン(基準波形パターン)44として算出する(ステップS17)。
生体には、受信信号を変化させる異常組織CAが含まれている場合がある。異常組織CAがあると、各受信アンテナRxnで受信される受信信号の波形パターンが変化する。各受信アンテナRxnで受信される受信信号が、異常組織CAによってどのように変化するかは、受信アンテナRxnと異常組織CAとの位置関係によって決まる。例えば、送信アンテナTx1を送信用とし、受信アンテナRx1を受信用とした場合の受信信号における異常組織CAの成分の出現位置と、送信アンテナTx6を送信用とし受信アンテナRx6を受信用とした場合の受信信号における異常組織CAの成分の出現位置とは、それぞれ異なっている。
各受信アンテナRxnで受信される受信信号における異常組織CAの成分の出現位置はそれぞれ異なるため、各受信アンテナRxnで受信された受信信号の平均をとれば、受信信号から、異常組織CAの成分を抑圧することができる。本実施の形態では、異常組織CAの成分が抑圧され、かつ、生体を用いて実際に測定された受信信号の全ての信号の平均波形パターンを基準波形パターンとして、異常組織CAの成分を検出する。
算出された平均波形パターンは、図7、図9に示すように、全信号平均波形パターン(基準波形パターン)44として、記憶部40に記憶される。
続いて、制御部10(差分波形パターン生成部33B)は、同距離平均波形パターンと基準波形パターンとの差分波形パターンを算出する(ステップS18)。すなわち、ここでは、制御部10は、上記ステップS16で求められた相対距離が同じ送信アンテナ及び受信アンテナの組み合わせでの同距離平均波形パターン43から、ステップS17で求められた全信号平均波形パターン(基準波形パターン)44を差し引いて、差分波形パターンが求められる。差分波形パターンは、図9に示すように、相対距離が同じ送信アンテナ及び受信アンテナの組み合わせ毎に求められる。算出された差分波形パターンは、図7、図9に示すように、差分波形パターン45として、記憶部40に記憶される。
図12(A)には、ステップS14の時間調整を行わなかった場合に求められる、相対距離が同じ送信アンテナ及び受信アンテナの組み合わせでの同距離平均波形パターンと、全信号平均波形パターン(基準波形パターン)を差し引いた場合に求められる差分波形パターンが示されている。また、図12(B)には、ステップS14の時間調整を行った場合に求められる、相対距離が同じ送信アンテナ及び受信アンテナの組み合わせでの同距離平均波形パターンと、全信号平均波形パターン(基準波形パターン)を差し引いた場合に求められる差分波形パターンが示されている。図12(A)及び図12(B)を比較するとわかるように、求められる差分波形パターンは、時間調整の有無により、著しく異なっている。
図13(A)には、ステップS15のレベル調整を行わなかった場合に求められる、相対距離が同じ送信アンテナ及び受信アンテナの組み合わせでの同距離平均波形パターンと、全信号平均波形パターン(基準波形パターン)を差し引いた場合に求められる差分波形パターンが示されている。また、図13(B)には、ステップS15のレベル調整を行った場合に求められる、ステップS18における相対距離が同じ送信アンテナ及び受信アンテナの組み合わせでの同距離平均波形パターンと、全信号平均波形パターン(基準波形パターン)を差し引いた場合に求められる差分波形パターンが示されている。図13(A)及び図13(B)を比較するとわかるように、求められる差分波形パターンは、若干異なっている。
続いて、制御部10(検出部34)は、放射時点を調整する(ステップS19)。図14には、送信アンテナ及び受信アンテナのアンテナ間距離に対する、差分波形パターンにおける送信信号の送信を開始してからピークまでの伝搬時間(ピーク時間)の関係が示されている。アンテナ間距離が0になれば、送信信号の送信を開始してから差分波形パターンにおいて、受信されるまでの時間は理論的には0になるはずであるが、図14に示すように、実際には、オフセット時間TLが乗っている。オフセット時間TLは、アンテナの端子にインパルス電流を流し始めてから、アンテナ開口面から電磁波が実際に放射されるまでの高周波信号の遅れによるものであると考えられている。オフセット時間TLは、異常組織CAの検出結果の誤差要因であるため、計測されたピーク時間Tmnから取り除く必要がある。検出装置の各構成要素中の電子デバイス特性の相違、送受信アンテナ特性の相違等様々な要因によって、オフセット時間TLにはばらつきが生じるため、計測の都度、オフセット時間TLを求める必要がある。そこで、このステップでは、オフセット時間TLを求める。
オフセット時間TLの求め方には2通りの方法がある。まず、1つ目の方法について説明する。検出部34は、アンテナ間距離が異なる送信アンテナ及び受信アンテナの組み合わせで、送信信号の送信を開始してから差分波形パターンにおいて最初のピークが現れるまでの時間Tを求め、時間Tを図14に示すグラフ上にプロットし、例えば最小二乗法を用いてプロットされた点に基づく図14に示す実線を決定する。そして、この実線と縦軸との交点の位置座標を、オフセット時間TLとして求める。
次に、2つ目の方法について説明する。検出部34は、アンテナ間距離が異なる送信アンテナ及び受信アンテナの組み合わせでそれぞれ得られた差分波形パターンを積分する。そして、積分波形について、送信信号の送信を開始してから最大ピークが現れるまでの時間Tを求め、時間Tを図14に示すグラフ上にプロットし、例えば最小二乗法を用いてプロットされた点に基づく図14に示す実線を決定する。そして、この実線と縦軸との交点の位置座標を、オフセット時間TLとして求める。
また、図15には、送信アンテナ別に、送信信号の送信を開始してから受信されるまでの時間Tをそれぞれ生成した場合のグラフが示されている。図15に示すように、この場合には、送信アンテナTx1、Tx3、Tx4については曲線(実線)が良く一致していたが、送信アンテナTx2の曲線(点線)については、他のアンテナの曲線よりも傾きが大きくなっている。このような場合には、送信アンテナTx2に関連する計測結果を、異常組織CAを検出するための計測結果から除外するようにしてもよい。
続いて、制御部10(検出部34)は、差分波形パターンに基づいて異常組織CAを検出する(ステップS20)。ここでは、送信信号の送信を開始してから差分波形パターンにおいて、受信されるまでの時間、すなわちピークが現れるまでの伝搬時間(ピーク時間)Tmnからオフセット時間TLが差し引かれた後、差し引かれた時間Tmn’に基づいて、マイクロ波のインパルス信号の行程距離に基づく複数の楕円の交点を検出することにより、異常組織CAの位置が検出される。検出された異常組織は画像化され、図7に示すように、検出画像データ46として記憶部40に記憶され、必要に応じて表示画面に表示される。
図16(A)~図16(C)には、時間調整及びレベル調整を行わなかった場合における異常組織CAの検出結果(検出画像)が示されている。図16(A)~図16(C)に示すように、時間調整及びレベル調整が行われていない状態では、異常組織CAの位置を特定することが困難になっている。
図17(A)は、時間調整を行った場合における異常組織CAの検出結果が示されて、図17(B)には、時間調整及びレベル調整を行った場合における異常組織CAの検出結果(画像)が示されている。図17(A)及び図17(B)に示すように、この検出結果では、中央やや左斜め下に異常組織CAが現れている。この検出結果を用いれば、異常組織CAの位置を特定することが可能となる。レベル調整を行った場合と、行わなかった場合とでは、異常組織CAの検出位置が若干異なっており、レベル調整を行った方が、異常組織CAの検出位置は正確であった。
このように、本実施の形態によれば、相対距離が同じである送信アンテナ及び受信アンテナの組み合わせで得られた受信信号について、それぞれの組毎波形パターンを時間方向及び振幅方向に合わせた上で、同じ距離での平均の波形パターンを算出し、算出した平均の波形パターンに基づいて検出対象を検出する。時間方向及び振幅方向に調整された同じ距離での平均の波形パターンは、ノイズやジッタが低減された波形パターンとなるので、その波形パターンに基づいて検出対象を検出すれば、検出対象の検出精度を向上することができる。
なお、送信アンテナTx1~Tx8、受信アンテナRx1~Rx8とCMOSスイッチ13、17の間の配線の長さを同じとしたが、多少長さが違っていても、位置関係が同じ送信アンテナTx1~Tx8及び受信アンテナRx1~Rx8の組み合わせで送受信された受信信号に対してキャリブレーションを行って配線の長さの違いによる受信信号の差を調整してもよい。
(実施形態2)
続いて、実施形態2に係る検出装置、信号処理方法及びプログラムについて説明する。本実施形態では、検出対象の検出精度を向上させるため、制御部10が、ピーク値のばらつきの大きい受信信号を除外して組毎平均波形パターンを算出する点、及び差分波形パターンに帯域フィルタ、補償演算等を適用する点で、上記実施形態1と異なる。また、検出波形パターンとして組毎平均波形パターンを、基準波形パターンとして同距離波形パターンを用いる点で、上記実施形態1と異なる。その他の構成は上記実施形態1の構成(図1)と同様であるので、同じ符号を付してその詳細な説明は省略する。
続いて、実施形態2に係る検出装置、信号処理方法及びプログラムについて説明する。本実施形態では、検出対象の検出精度を向上させるため、制御部10が、ピーク値のばらつきの大きい受信信号を除外して組毎平均波形パターンを算出する点、及び差分波形パターンに帯域フィルタ、補償演算等を適用する点で、上記実施形態1と異なる。また、検出波形パターンとして組毎平均波形パターンを、基準波形パターンとして同距離波形パターンを用いる点で、上記実施形態1と異なる。その他の構成は上記実施形態1の構成(図1)と同様であるので、同じ符号を付してその詳細な説明は省略する。
制御部10の基本的な機能構成(図18)は、全信号平均波形パターンに関する部分を除いて、図7に示される実施形態1と同様であるが、上記検出波形パターン及び基準波形パターンの違いから、一部の機能、処理は実施形態1と異なる。以下、主に、実施形態1と異なる機能について説明する。
本実施形態の組毎平均波形パターン生成部31は、受信信号の外れ値を除外する。具体的には、送信アンテナ及び受信アンテナの同一の組み合わせで取得された各受信信号のピーク値から、ピーク値の平均値と標準偏差を求める。そして、ピーク値が、一定の信頼区間から外れている受信信号を除外した後、組毎平均波形パターンを算出する。
また、差分波形パターン生成部33Bは、差分波形パターンから雑音を除外するための帯域フィルタを備える。差分波形パターンは、高周波の量子化ノイズと、直流成分の低周波ノイズを含んでいる。差分波形パターン生成部33Bは、差分波形パターンに帯域フィルタを適用して、これらのノイズを除去する。
さらに、差分波形パターン生成部33Bは、被検者の体内を伝搬することによって減衰した受信信号を増幅させるための補償器を備える。具体的には、差分波形パターンの積分波形に対して、次式の補償係数Cを乗ずることにより、補償を行う。

ただし、αは次式の減衰定数、rは距離(生体中の光の速度c×時間t)。

ただし、μは透磁率、εは誘電率、ωは角周波数、σは導電率を表す。
次に、実施形態2に係る異常組織検出装置1の動作について説明する。図19には、異常組織検出装置1の動作の流れが示されている。図20には、異常組織検出装置1のデータの流れが示されている。
図19に示すように、まず、制御部10(信号送受信制御部30)は、全ての組み合わせでマイクロ波を送受信し、受信信号を取得する(ステップS31)。ステップS31は、実施形態1のステップS11と同様の処理であり、同じアンテナの組み合わせで複数回、例えば40回信号の送受信を行う(図20)。そして、記憶部40に、全てのアンテナの組み合わせ(64通り)で40個の受信信号(データ信号DATA2)のデータ(生波形データ41)が記憶される。
続いて、制御部10(組毎平均波形パターン生成部31)は、上記40個の受信信号のデータから、ピーク値が一定の信頼区間から外れている受信信号のデータを除外する(ステップS32)。具体的には、組毎平均波形パターン生成部31は、上記40個の受信信号のデータそれぞれのピーク値を基に、ピーク値の平均値及び標準偏差を算出する。そして、ピーク値が、一定の信頼区間から外れている外れ値となる受信信号を除外する。
外れ値を除外するための信頼区間は、各受信信号のピーク値のばらつきに基づいて、任意に設定することができる。本実施の形態では、各受信信号のピーク値は正規分布に従うものとして、平均値±1.64σ(σ:標準偏差)の範囲、すなわち約90%の信頼区間を設定し、これから外れるピーク値を有する受信信号を除外している。
例えば、図21(A)は、送信アンテナTx1及び受信アンテナRx13の組み合わせで取得した各受信信号のピーク値を示す図であり、図21(B)は、各受信信号のピーク値のヒストグラムである。この受信信号のピーク値について90%信頼区間外の外れ値を除外する。
続いて、制御部10(時間調整部32A)は、送信アンテナ及び受信アンテナの同一の組み合わせで、外れ値に係る受信信号データを除外した残余の受信信号(生波形データ41)について、実施形態1のステップS14と同様に、時間調整を行うため、ずれ時間dTを算出する(ステップS33)。
また、制御部10(レベル調整部32B)は、送信アンテナ及び受信アンテナの同一の組み合わせで、外れ値に係る受信信号データを除外した残余の受信信号(生波形データ41)について、実施形態1のステップS15と同様に、レベル調整を行うため、オフセットOffset及びスケール比A/Bを求める(ステップS34)。
続いて、制御部10(組毎平均波形パターン生成部31)は、検出波形パターン生成部として、外れ値に係る受信信号データを除外した残余の受信信号(生波形データ41)について、ステップS33で求めたずれ時間dTと、ステップS34で求めたオフセットOffset及びスケール比A/Bに基づく調整を行い送信アンテナ及び受信アンテナの同一の組み合わせでの平均波形パターンを算出する(ステップS35)。すなわち、組毎平均波形パターン生成部31は、図20に示すように、上記フィルタリングによって、40個の受信信号(データ信号DATA2)から外れ値に係る受信信号を除外する。残余の受信信号は、時間調整部32A及びレベル調整部32Bによって調整された後、組毎平均波形パターン生成部31によって平均される。そして、算出された平均波形パターンを、組毎平均波形パターン42とする。実施形態1と同様に、各受信信号(データ信号DATA2)は4ビットの粗いデジタル信号であるが、この平均化により、各デジタル受信信号の量子化ビット数を上げ、統計的に見て妥当な信号波形を得ることができるので、受信信号に含まれるノイズ及びジッタの影響を低減することができる。また、外れ値に係る受信信号を除外して、組毎平均波形パターンを算出することにより、ノイズの影響の少ない組毎平均波形パターンを求めることができる。
続いて、基準波形パターン生成部としての、制御部10(同距離平均波形パターン生成部32C)は、実施形態1のステップS13と同様に、送信アンテナ及び受信アンテナの同一の組み合わせでの組毎平均波形パターン42の中から、波形にピークを有しない平均波形パターンを除外する(ステップS36)。上述のように、この除外は、他に閾値によって行われるようにしてもよい。
続いて、制御部10(同距離平均波形パターン生成部32C)は、ステップS36で残った組毎平均波形パターン42から、相対距離が同じ送信アンテナ及び受信アンテナの組み合わせでの平均信号パターンを算出する(ステップS37)。算出された平均波形パターンは、同距離平均波形パターン43として、記憶部40に記憶される。
算出された同距離平均波形パターン43は、基準波形パターンとして、記憶部40に記憶される。
続いて、制御部10(差分波形パターン生成部33B)は、検出波形パターンとしての組毎平均波形パターンと基準波形パターンとしての同距離波形パターンとの差分波形パターンを算出する(ステップS38)。すなわち、制御部10は、上記ステップS35で求められた、送信アンテナ及び受信アンテナの同一の組み合わせでの組毎平均波形パターン42から、ステップS37で求められた相対距離が同じ送信アンテナ及び受信アンテナの組み合わせでの同距離平均波形パターン43を差し引いて、差分波形パターンが求められる。差分波形パターンは、図20に示すように、送信アンテナ及び受信アンテナの組み合わせ毎に求められる。算出された差分波形パターンは、差分波形パターン45’として、記憶部40に記憶される。
続いて、制御部10(差分波形パターン生成部33B)は、帯域フィルタによるノイズ除去を行う(ステップS39)。ステップS38で算出された差分波形パターン45’には、図22(A)にスパイク状のノイズとして表れている、量子化誤差による高周波ノイズが含まれている。また、図22(A)の差分波形パターン45’を積分した積分波形は、図22(B)に示すように、時間の経過とともに増大している。よって、差分波形パターン45’には、直流成分の低周波ノイズが含まれていることがわかる。また、図22(C)に示す差分波形パターン45’をフーリエ変換した周波数スペクトルからも、低周波ノイズ及び高周波ノイズが含まれていることがわかる。
これらのノイズを除去するため、本実施形態では、送信信号の周波数よりも狭い、2GHz~6GHzを通過帯域とする帯域フィルタを用いる。図23(A)は、図22(A)の差分波形パターン45’に上述の帯域フィルタを適用した波形である。帯域フィルタの適用によって、量子化誤差による高周波ノイズが除去されている。
また、図23(A)に示す差分波形パターン45’を積分した積分波形は、図23(B)に示すように、時間の経過とともに増大することなく、水平を保っている。したがって、帯域フィルタの適用により、直流成分の低周波ノイズを除去できていることがわかる。
続いて、制御部10(差分波形パターン生成部33B)は、被検者の体内を伝搬することによって減衰した受信信号の補償を行う(ステップS40)。
具体的には、上記ステップS39で算出された積分値に対して、上述の数1及び数2で表される補償係数Cを乗ずる。これにより、送信アンテナから受信アンテナへの直接波に対して、遅く受信される異常組織からの反射波を相対的に大きくする。(図24(A)、図24(B))。したがって、受信波形における異常組織からの反射波をより明確にすることができるため、異常組織検出の精度を向上させることができる。
続いて、制御部10(検出部34)は、実施形態1のステップS19と同様に、放射時点を調整する(ステップS41)。実施形態1では、オフセット時間TLは、差分波形パターン45’における正のピーク位置を用いる方法、または、差分波形パターン45’を積分した場合のピーク位置を用いる方法によって算出することとしたが、これに限られない。
例えば、差分波形パターン45’における負のピーク位置を用いてオフセット時間TLを算出することができる。具体的には、検出部34は、アンテナ間距離が異なる送信アンテナ及び受信アンテナの組み合わせで、送信信号の送信を開始してから差分波形パターン45’において負のピークが現れるまでの時間Tmを求める。図14と同様に、時間Tmをグラフ上にプロットし、例えば最小二乗法を用いてプロットされた点に基づく実線を決定する。そして、この実線と縦軸との交点の位置座標を、オフセット時間TLとして求める。
図25(A)及び図25(B)に、正のピーク位置を選択した場合と負のピーク位置を選択した場合の例が示されている。図25(A)は、送信アンテナTx3及び受信アンテナRx7における差分波形パターン45’を示しており、正のピーク位置は、Tp1=3.83ns、負のピーク位置は、Tm1=3.95nsの時点である。また、図25(B)は、送信アンテナTx3及び受信アンテナRx15の組み合わせにおける差分波形パターン45’を示しており、正のピーク位置は、Tp2=4.00ns、負のピーク位置は、Tm2=4.10nsの時点である。上記の通り、Tp1及びTp2からオフセット時間TLを算出すると、TL=2.77nsとなる。また、Tm1及びTm2からオフセット時間TLを算出すると、TL=2.90nsとなる。
続いて、制御部10(検出部34)は、実施形態1のステップS20と同様に、差分波形パターンに基づいて異常組織CAを検出する(ステップS42)。異常組織CAの位置は、送信信号の送信を開始してから差分波形パターン45’において、受信されるまでの時間、すなわちピークが現れるまでの伝搬時間(ピーク時間)Tmnからオフセット時間TLが差し引かれた後、差し引かれた時間Tmn’に基づいて、マイクロ波のインパルス信号の行程距離に基づく複数の楕円の交点を検出することによって行われる。
上記ステップS41において、正のピーク値に基づいてオフセット時間TLを算出した場合には、反射信号の正のピークに基づいて、異常組織CAの位置が検出される。また、負のピーク値に基づいてオフセット時間TLを算出した場合には、反射信号の負のピークに基づいて、異常組織CAの位置が検出される。検出された異常組織は画像化され、検出画像データ46として記憶部40に記憶され、必要に応じて表示画面に表示される。
図26(A)及び図26(B)は、検出された異常組織を画像化した例である。図26(A)は、正のピーク値に基づいて算出したオフセット時間TLを使って、異常組織CAを検出した場合を示している。この図では、異常組織の位置は、正の輝点として現れている。図26(B)は、負のピーク値に基づいて算出したオフセット時間TLを使って、異常組織CAを検出した場合を示している。この図では、異常組織の位置は、負の輝点として現れている。このように、オフセット時間TLの算出基準によって、検出結果の画像上で異常組織CAの位置を正の輝点で表すか、負の輝点で表すかを選択することができる。これにより、異常組織CAを判別し易い方法で画像を作成することが可能となり、異常組織CAの検出精度を向上させることができる。
図27(A)には、帯域フィルタによるフィルタリング及び損失補償を行わなかった場合における異常組織CAの検出結果(検出画像)が示されている。図27(B)には、帯域フィルタによるフィルタリングを行い、損失補償を行わなかった場合における異常組織CAの検出結果が示されている。図27(C)には、帯域フィルタによるフィルタリング及び損失補償を行った場合における異常組織CAの検出結果が示されている。それぞれの場合の信号雑音比は、図27(A)でSCR(signal-to-clutter ratio)=2.43,SMR(signal-to-mask ratio)=21.22、図27(B)でSCR=4.93,SMR=24.22、図27(C)でSCR=5.70,SMR=24.54となっている。このように、本実施形態の帯域フィルタ及び損失補償により、異常組織CAの検出精度を向上させることができる。
上記各実施の形態では、アンテナの数を送信アンテナ8個、受信アンテナ8個としたが、本発明はこれには限られず、アンテナの数は任意でよい。これに合わせて、CMOSスイッチ13、17も、単極8投でなくてもよく、他の単極多投のスイッチでよい。その数は、送信アンテナ、受信アンテナの数に合わせることになる。なお、CMOSスイッチ13の出力端、CMOSスイッチ17の出力端は、配線の長さが等しくなるように、かつ長すぎないように、円状に配置できる数とするのが望ましい。
また、CMOSスイッチ13、17は、双極多投のスイッチであってもよい。この場合には、各アンテナが、送信スイッチにも受信スイッチにもなるので、スイッチの組み合わせの数を増やすことができる。
その他、制御部10のハードウエア構成やソフトウエア構成は一例であり、任意に変更および修正が可能である。
制御部10の処理を行う中心となる部分は、専用のシステムによらず、通常のコンピュータシステムを用いて実現可能である。例えば、前記の動作を実行するためのコンピュータプログラムを、コンピュータが読み取り可能な記録媒体(フレキシブルディスク、CD-ROM、DVD-ROM等)に格納して配布し、当該コンピュータプログラムをコンピュータにインストールすることにより、前記の処理を実行する制御部10を構成してもよい。また、インターネット等の通信ネットワーク上のサーバ装置が有する記憶装置に当該コンピュータプログラムを格納しておき、通常のコンピュータシステムがダウンロード等することで制御部10を構成してもよい。
制御部10の機能を、OS(オペレーティングシステム)とアプリケーションプログラムの分担、またはOSとアプリケーションプログラムとの協働により実現する場合などには、アプリケーションプログラム部分のみを記録媒体や記憶装置に格納してもよい。
搬送波にコンピュータプログラムを重畳し、通信ネットワークを介して配信することも可能である。たとえば、通信ネットワーク上の掲示板(BBS, Bulletin Board System)にコンピュータプログラムを掲示し、ネットワークを介してコンピュータプログラムを配信してもよい。そして、このコンピュータプログラムを起動し、OSの制御下で、他のアプリケーションプログラムと同様に実行することにより、前記の処理を実行できるように構成してもよい。
この発明は、この発明の広義の精神と範囲を逸脱することなく、様々な実施の形態及び変形が可能とされるものである。また、上述した実施の形態は、この発明を説明するためのものであり、この発明の範囲を限定するものではない。すなわち、この発明の範囲は、実施の形態ではなく、特許請求の範囲によって示される。そして、特許請求の範囲内及びそれと同等の発明の意義の範囲内で施される様々な変形が、この発明の範囲内とみなされる。
本出願は、2015年10月29日に出願された日本国特許出願2015-213406号に基づく。本明細書中に、日本国特許出願2015-213406号の明細書、特許請求の範囲、図面全体を参照として取り込むものとする。
本発明は、乳癌センサなどに用いられるアンテナアレイ装置に好適である。また、本発明は、乳癌センサに限らず、他の腫瘍等、生体、外部環境の誘電率の異なる領域の検出・判別に応用可能である。
1 異常組織検出装置
10 制御部
11 送信部
12 送信アンプ
13 CMOSスイッチ
14 配線部
15 アンテナアレイ
16 配線部
17 CMOSスイッチ
18 受信アンプ
19 受信部
20 選択部
21A、21B NAND回路
21C、21D NOR回路
22A~22D 遅延回路
23A、23C OR回路
23B、23D AND回路
24A、24C ダウンパルスジェネレータ
24B、24D アップパルスジェネレータ
25A、25B バッファ回路
30 信号送受信制御部
31 組毎平均波形パターン生成部
32A 時間調整部
32B レベル調整部
32C 同距離平均波形パターン生成部
33A 全信号平均波形パターン生成部
33B 差分波形パターン生成部
34 検出部
40 記憶部
41 生波形データ
42 組毎平均波形パターン
43 同距離平均波形パターン
44 全信号平均波形パターン(基準波形パターン)
45、45’ 差分波形パターン
46 検出画像データ
CA 異常組織
Ck 信号
CLK、CLOCK、/CLOCK クロック信号
CS1、CS2 制御信号
DATA、/DATA、DATA2 データ信号
RS1、RS2 受信信号
Rx1、Rx2、…、Rx8 受信アンテナ
MW 送信信号(インパルス信号)
OP、OM 出力信号
RW 反射信号
Tx1、Tx2、…、Tx8 送信アンテナ
SS1、SS2 送信信号
10 制御部
11 送信部
12 送信アンプ
13 CMOSスイッチ
14 配線部
15 アンテナアレイ
16 配線部
17 CMOSスイッチ
18 受信アンプ
19 受信部
20 選択部
21A、21B NAND回路
21C、21D NOR回路
22A~22D 遅延回路
23A、23C OR回路
23B、23D AND回路
24A、24C ダウンパルスジェネレータ
24B、24D アップパルスジェネレータ
25A、25B バッファ回路
30 信号送受信制御部
31 組毎平均波形パターン生成部
32A 時間調整部
32B レベル調整部
32C 同距離平均波形パターン生成部
33A 全信号平均波形パターン生成部
33B 差分波形パターン生成部
34 検出部
40 記憶部
41 生波形データ
42 組毎平均波形パターン
43 同距離平均波形パターン
44 全信号平均波形パターン(基準波形パターン)
45、45’ 差分波形パターン
46 検出画像データ
CA 異常組織
Ck 信号
CLK、CLOCK、/CLOCK クロック信号
CS1、CS2 制御信号
DATA、/DATA、DATA2 データ信号
RS1、RS2 受信信号
Rx1、Rx2、…、Rx8 受信アンテナ
MW 送信信号(インパルス信号)
OP、OM 出力信号
RW 反射信号
Tx1、Tx2、…、Tx8 送信アンテナ
SS1、SS2 送信信号
Claims (15)
- マイクロ波のインパルス信号を送信する複数の送信アンテナと、
前記インパルス信号を受信する複数の受信アンテナと、
選択する送信アンテナ及び受信アンテナの組み合わせを切り替えながら、インパルス信号を選択された送信アンテナに出力し、選択された受信アンテナで受信された受信信号を入力し、入力した受信信号に対する信号処理を行う制御部と、
を備え、
前記制御部は、
前記送信アンテナと前記受信アンテナとの所定の組み合わせについて、前記受信アンテナで受信された複数の受信信号の信号波形におけるピークの時点に基づいて、信号波形の時間方向のずれを調整する時間調整部と、
前記時間調整部で調整された複数の受信信号であって、前記送信アンテナと前記受信アンテナとの同一の組み合わせについて取得された複数の受信信号、または、前記送信アンテナと前記受信アンテナとの相対距離が同じ組み合わせについて取得された複数の受信信号の平均を示す検出波形パターンを生成する検出波形パターン生成部と、
前記検出波形パターンの生成に用いられた複数の受信信号を含み、より多数の受信信号の信号波形の平均を示す基準波形パターンを生成する基準波形パターン生成部と、
前記検出波形パターン生成部で生成された検出波形パターンと、前記基準波形パターン生成部で生成された基準波形パターンとの差分を示す差分波形パターンを生成する差分波形パターン生成部と、
前記差分波形パターン生成部で生成された差分波形パターンに基づいて、検出対象を検出する検出部と、
を備える検出装置。 - 前記時間調整部は、前記送信アンテナと前記受信アンテナとの同一の組み合わせを所定の組み合わせとして信号波形の時間方向のずれを調整し、
前記検出波形パターン生成部は、
同一の前記送信アンテナと前記受信アンテナとの同一の組み合わせにおける複数の受信信号の信号波形を平均した組毎平均波形パターンを検出波形パターンとして生成し、
前記基準波形パターン生成部は、
前記送信アンテナと前記受信アンテナとの相対距離が同じ組み合わせでの前記組毎平均波形パターンを平均した同距離平均波形パターンを基準波形パターンとして生成する、
請求項1に記載の検出装置。 - 前記時間調整部は、前記送信アンテナと前記受信アンテナとの相対距離が同じ組み合わせを所定の組み合わせとして信号波形の時間方向のずれを調整し、
前記検出波形パターン生成部は、
前記送信アンテナと前記受信アンテナとの相対距離が同じ組み合わせにおける受信信号の信号波形を平均した同距離平均波形パターンを検出波形パターンとして生成し、
前記基準波形パターン生成部は、
前記送信アンテナと前記受信アンテナとの全ての組み合わせでの受信信号の信号波形を平均した全信号平均波形パターンを基準波形パターンとして生成する、
請求項1に記載の検出装置。 - 前記制御部は、
前記送信アンテナと前記受信アンテナとの相対距離が同じ組み合わせについて、前記受信アンテナで受信された信号の信号波形のオフセット及び振幅に基づいて、前記受信アンテナで受信された信号の振幅が同一レベルになるように信号波形の振幅レベルを調整するレベル調整部を備える、
請求項1から3のいずれか一項に記載の検出装置。 - 前記送信アンテナと前記受信アンテナとの同じ組み合わせについて、複数回、インパルス信号を選択された送信アンテナに出力して選択された受信アンテナから出力された所定ビット数のデジタル受信信号を入力する信号送受信制御部と、
複数回入力されたデジタル受信信号の平均を前記所定ビット数より大きいビット数で表現する平均波形パターンを、その組み合わせの受信信号の信号波形の波形パターンとして取得する組毎平均波形パターン生成部と、
を備える、
請求項1から4のいずれか一項に記載の検出装置。 - 前記組毎平均波形パターン生成部は、
前記複数回入力されたデジタル受信信号のうち、前記デジタル受信信号の最大振幅が正規分布の90%信頼区間外であるデジタル受信信号を除外して、前記平均波形パターンを生成する、
請求項5に記載の検出装置。 - 前記インパルス信号は、ガウシアンモノサイクルパルスである、
請求項1から6のいずれか一項に記載の検出装置。 - 前記制御部は、
前記送信アンテナと前記受信アンテナとの相対距離が同じ組み合わせにおける受信信号の信号波形の平均を示す同距離平均波形パターンを生成する、同距離平均波形パターン生成部を備え、
前記同距離平均波形パターン生成部は、
前記送信アンテナと前記受信アンテナとの各組み合わせの受信信号の信号波形の波形パターンについて、正のピークに続いて正のピークが現れ、負のピークが現れない場合には、その組み合わせの受信信号の信号波形の波形パターンを計算対象から除外する、
請求項7に記載の検出装置。 - 前記検出部は、
前記差分波形パターンに基づいて、前記インパルス信号を送信してから前記受信信号を受信するまでの伝搬時間を、前記送信アンテナと前記受信アンテナとの相対距離が同じ組み合わせについてそれぞれ求め、
求められた伝搬時間に基づいて、前記相対距離が0であると仮定したときの伝搬時間に含まれるオフセットを推定し、
前記伝搬時間に含まれるオフセットを差し引かれた前記伝搬時間に基づいて、検出対象の位置を検出する、
請求項1から8のいずれか一項に記載の検出装置。 - 前記検出部は、
前記差分波形パターンの最初の正又は負のピーク位置に基づいて前記伝搬時間を求め、前記伝搬時間に含まれるオフセットを推定するとともに、
前記正のピーク位置に基づいて前記伝搬時間に含まれるオフセットを推定した場合には、前記差分波形パターンの正のピーク位置に基づいて、前記検出対象の位置を検出し、
前記負のピーク位置に基づいて前記オフセットを推定した場合には、前記差分波形パターンの負のピーク位置に基づいて、前記検出対象の位置を検出する、
請求項9に記載の検出装置。 - クロック信号を入力する論理回路、遅延回路及び半導体スイッチング素子の組み合わせ回路を有し、その組み合わせ回路を用いて複数の送信アンテナに送信するインパルス信号を生成する送信信号生成部を備える、
請求項1から10のいずれか一項に記載の検出装置。 - 前記制御部は、
前記差分波形パターン生成部で生成された差分波形パターンから、低周波ノイズ及び高周波ノイズを除去する帯域フィルタを備える、
請求項1から11のいずれか一項に記載の検出装置。 - 前記制御部は、
前記差分波形パターンを、前記インパルス信号が伝搬する媒体の損失式で補償する補償器を備える、
請求項1から12のいずれか一項に記載の検出装置。 - マイクロ波のインパルス信号を送信する複数の送信アンテナと、前記インパルス信号を受信する複数の受信アンテナとの組み合わせを切り替えながら、インパルス信号を選択された送信アンテナに出力し、選択された受信アンテナで受信された受信信号を入力し、入力した受信信号に対する信号処理を行う信号処理方法であって、
前記送信アンテナと前記受信アンテナとの所定の組み合わせについて、前記受信アンテナで受信された複数の受信信号の信号波形におけるピークの時点に基づいて、信号波形の時間方向のずれを調整する時間調整ステップと、
前記時間調整ステップで調整された複数の受信信号であって、前記送信アンテナと前記受信アンテナとの同一の組み合わせについて取得された複数の受信信号、または、前記送信アンテナと前記受信アンテナとの相対距離が同じ組み合わせについて取得された複数の受信信号の平均を示す検出波形パターンを生成する検出波形パターン生成ステップと、
前記検出波形パターンの生成に用いられた複数の受信信号を含み、より多数の受信信号の信号波形の平均を示す基準波形パターンを生成する基準波形パターン生成ステップと、
前記検出波形パターンステップで生成された検出波形パターンと、前記基準波形パターン生成ステップで生成された基準波形パターンとの差分を示す差分波形パターンを生成する差分波形パターン生成ステップと、
前記差分波形パターン生成ステップで生成された差分波形パターンに基づいて、検出対象を検出する検出ステップと、
を含む信号処理方法。 - コンピュータを、
マイクロ波のインパルス信号を送信する複数の送信アンテナと、前記インパルス信号を受信する複数の受信アンテナとの組み合わせを切り替えながら、インパルス信号を選択された送信アンテナに出力し、選択された受信アンテナで受信された受信信号を入力し、入力した受信信号に対する信号処理を行う制御部、
前記送信アンテナと前記受信アンテナとの所定の組み合わせについて、前記受信アンテナで受信された複数の受信信号の信号波形におけるピークの時点に基づいて、信号波形の時間方向のずれを調整する時間調整部、
前記時間調整部で調整された複数の受信信号であって、前記送信アンテナと前記受信アンテナとの同一の組み合わせについて取得された複数の受信信号、または、前記送信アンテナと前記受信アンテナとの相対距離が同じ組み合わせについて取得された複数の受信信号の平均を示す検出波形パターンを生成する検出波形パターン生成部、
前記検出波形パターンの生成に用いられた複数の受信信号を含み、より多数の受信信号の信号波形の平均を示す基準波形パターンを生成する基準波形パターン生成部、
前記検出波形パターン生成部で生成された検出波形パターンと、前記基準波形パターン生成部で生成された基準波形パターンとの差分を示す差分波形パターンを生成する差分波形パターン生成部、
前記差分波形パターン生成部で生成された差分波形パターンに基づいて、検出対象を検出する検出部、
として機能させるプログラム。
Priority Applications (1)
| Application Number | Priority Date | Filing Date | Title |
|---|---|---|---|
| JP2017547905A JP6685520B2 (ja) | 2015-10-29 | 2016-10-28 | 検出装置、信号処理方法及びプログラム |
Applications Claiming Priority (2)
| Application Number | Priority Date | Filing Date | Title |
|---|---|---|---|
| JP2015-213406 | 2015-10-29 | ||
| JP2015213406 | 2015-10-29 |
Publications (1)
| Publication Number | Publication Date |
|---|---|
| WO2017073757A1 true WO2017073757A1 (ja) | 2017-05-04 |
Family
ID=58630411
Family Applications (1)
| Application Number | Title | Priority Date | Filing Date |
|---|---|---|---|
| PCT/JP2016/082134 Ceased WO2017073757A1 (ja) | 2015-10-29 | 2016-10-28 | 検出装置、信号処理方法及びプログラム |
Country Status (2)
| Country | Link |
|---|---|
| JP (1) | JP6685520B2 (ja) |
| WO (1) | WO2017073757A1 (ja) |
Cited By (1)
| Publication number | Priority date | Publication date | Assignee | Title |
|---|---|---|---|---|
| JPWO2019103057A1 (ja) * | 2017-11-27 | 2020-06-18 | 国立大学法人広島大学 | 異常組織検出装置 |
Citations (3)
| Publication number | Priority date | Publication date | Assignee | Title |
|---|---|---|---|---|
| JP2010069158A (ja) * | 2008-09-19 | 2010-04-02 | Hiroshima Univ | 異常組織検出装置及び異常組織検出方法 |
| JP2014036411A (ja) * | 2012-08-10 | 2014-02-24 | Hiroshima Univ | 半導体スイッチ回路及び異常組織検出装置 |
| JP2014131199A (ja) * | 2012-12-28 | 2014-07-10 | Hiroshima Univ | アンテナアレイ装置及び異常組織検出装置 |
-
2016
- 2016-10-28 JP JP2017547905A patent/JP6685520B2/ja active Active
- 2016-10-28 WO PCT/JP2016/082134 patent/WO2017073757A1/ja not_active Ceased
Patent Citations (3)
| Publication number | Priority date | Publication date | Assignee | Title |
|---|---|---|---|---|
| JP2010069158A (ja) * | 2008-09-19 | 2010-04-02 | Hiroshima Univ | 異常組織検出装置及び異常組織検出方法 |
| JP2014036411A (ja) * | 2012-08-10 | 2014-02-24 | Hiroshima Univ | 半導体スイッチ回路及び異常組織検出装置 |
| JP2014131199A (ja) * | 2012-12-28 | 2014-07-10 | Hiroshima Univ | アンテナアレイ装置及び異常組織検出装置 |
Cited By (1)
| Publication number | Priority date | Publication date | Assignee | Title |
|---|---|---|---|---|
| JPWO2019103057A1 (ja) * | 2017-11-27 | 2020-06-18 | 国立大学法人広島大学 | 異常組織検出装置 |
Also Published As
| Publication number | Publication date |
|---|---|
| JP6685520B2 (ja) | 2020-04-22 |
| JPWO2017073757A1 (ja) | 2018-08-16 |
Similar Documents
| Publication | Publication Date | Title |
|---|---|---|
| Wang et al. | Noncontact distance and amplitude-independent vibration measurement based on an extended DACM algorithm | |
| JP4120679B2 (ja) | レーダ | |
| JP7069309B2 (ja) | レーダ装置、レーダ装置の故障検出方法、及びレーダ装置の運用方法 | |
| CN111624568B (zh) | 多目标生命征象检测系统及方法 | |
| US7460058B2 (en) | Radar | |
| JP5639150B2 (ja) | パルスレーダ装置及びその制御方法 | |
| JP2020016639A (ja) | 共通信号波形を使用するレーダー及び通信複合システム | |
| JP6663115B2 (ja) | Fmcwレーダー | |
| JP5980587B2 (ja) | レーダ装置及び反射信号処理方法 | |
| JP2014006066A (ja) | 干渉検出装置、干渉除去器、レーダ装置、干渉検出方法および干渉検出用プログラム | |
| JP2021067461A (ja) | レーダ装置及びレーダ信号処理方法 | |
| US20190317186A1 (en) | Radar apparatus | |
| CN113227830A (zh) | 减轻小形状因子设备中的互耦泄漏 | |
| JP5410827B2 (ja) | 電磁波発生源判定方法及び装置 | |
| US10684235B2 (en) | Material determination by sweeping a range of frequencies | |
| JP2017194379A (ja) | レーダ装置、位相差折返判定方法 | |
| JP6279193B2 (ja) | 物体検出装置及びセンサ装置 | |
| JP2014006067A (ja) | レーダ装置、物標検出方法及び物標検出プログラム | |
| JP6685520B2 (ja) | 検出装置、信号処理方法及びプログラム | |
| CN120531364B (zh) | 基于微波数据自适应时延相位补偿的脑部图像生成方法 | |
| CN101042434B (zh) | 检测装置及方法 | |
| JP2009198363A (ja) | 電波探知装置および方法 | |
| US12130539B2 (en) | System and method for dual-comb microwave imaging | |
| US20120163690A1 (en) | Image reconfiguration method for electro-magnetic tomography | |
| JP2017191074A (ja) | Cfar処理装置及びレーダ装置 |
Legal Events
| Date | Code | Title | Description |
|---|---|---|---|
| 121 | Ep: the epo has been informed by wipo that ep was designated in this application |
Ref document number: 16859985 Country of ref document: EP Kind code of ref document: A1 |
|
| ENP | Entry into the national phase |
Ref document number: 2017547905 Country of ref document: JP Kind code of ref document: A |
|
| NENP | Non-entry into the national phase |
Ref country code: DE |
|
| 122 | Ep: pct application non-entry in european phase |
Ref document number: 16859985 Country of ref document: EP Kind code of ref document: A1 |