WO2016157624A1 - 超音波観測装置、超音波観測装置の作動方法および超音波観測装置の作動プログラム - Google Patents
超音波観測装置、超音波観測装置の作動方法および超音波観測装置の作動プログラム Download PDFInfo
- Publication number
- WO2016157624A1 WO2016157624A1 PCT/JP2015/083938 JP2015083938W WO2016157624A1 WO 2016157624 A1 WO2016157624 A1 WO 2016157624A1 JP 2015083938 W JP2015083938 W JP 2015083938W WO 2016157624 A1 WO2016157624 A1 WO 2016157624A1
- Authority
- WO
- WIPO (PCT)
- Prior art keywords
- feature amount
- attenuation rate
- ultrasonic
- frequency
- attenuation
- Prior art date
Links
- 238000011017 operating method Methods 0.000 title 1
- 238000001228 spectrum Methods 0.000 claims abstract description 83
- 238000012887 quadratic function Methods 0.000 claims abstract description 33
- 238000002604 ultrasonography Methods 0.000 claims abstract description 8
- 238000012937 correction Methods 0.000 claims description 135
- 238000004364 calculation method Methods 0.000 claims description 63
- 238000004458 analytical method Methods 0.000 claims description 50
- 238000000034 method Methods 0.000 claims description 41
- 230000008569 process Effects 0.000 claims description 20
- 230000000007 visual effect Effects 0.000 claims description 12
- 238000012545 processing Methods 0.000 description 52
- 230000003321 amplification Effects 0.000 description 50
- 238000003199 nucleic acid amplification method Methods 0.000 description 50
- 239000000523 sample Substances 0.000 description 42
- 238000010586 diagram Methods 0.000 description 17
- 230000005540 biological transmission Effects 0.000 description 16
- 210000001519 tissue Anatomy 0.000 description 14
- 230000006870 function Effects 0.000 description 10
- 238000006243 chemical reaction Methods 0.000 description 7
- 230000008859 change Effects 0.000 description 6
- 239000006185 dispersion Substances 0.000 description 6
- 239000000463 material Substances 0.000 description 6
- 210000000056 organ Anatomy 0.000 description 6
- 238000000611 regression analysis Methods 0.000 description 6
- 238000012986 modification Methods 0.000 description 4
- 230000004048 modification Effects 0.000 description 4
- 230000002238 attenuated effect Effects 0.000 description 3
- 230000000694 effects Effects 0.000 description 3
- 238000003384 imaging method Methods 0.000 description 3
- 238000005070 sampling Methods 0.000 description 3
- 206010028980 Neoplasm Diseases 0.000 description 2
- 230000002159 abnormal effect Effects 0.000 description 2
- 210000000013 bile duct Anatomy 0.000 description 2
- 210000003445 biliary tract Anatomy 0.000 description 2
- 230000015572 biosynthetic process Effects 0.000 description 2
- 210000000621 bronchi Anatomy 0.000 description 2
- 201000011510 cancer Diseases 0.000 description 2
- 238000004891 communication Methods 0.000 description 2
- 230000007423 decrease Effects 0.000 description 2
- 210000000232 gallbladder Anatomy 0.000 description 2
- 238000005286 illumination Methods 0.000 description 2
- 210000001165 lymph node Anatomy 0.000 description 2
- 230000003287 optical effect Effects 0.000 description 2
- 210000000496 pancreas Anatomy 0.000 description 2
- 230000000241 respiratory effect Effects 0.000 description 2
- 230000004044 response Effects 0.000 description 2
- 238000003786 synthesis reaction Methods 0.000 description 2
- 210000003437 trachea Anatomy 0.000 description 2
- 210000003932 urinary bladder Anatomy 0.000 description 2
- 206010011732 Cyst Diseases 0.000 description 1
- 208000001976 Endocrine Gland Neoplasms Diseases 0.000 description 1
- 235000002597 Solanum melongena Nutrition 0.000 description 1
- 244000061458 Solanum melongena Species 0.000 description 1
- 230000003187 abdominal effect Effects 0.000 description 1
- 238000010521 absorption reaction Methods 0.000 description 1
- 210000004204 blood vessel Anatomy 0.000 description 1
- 210000000481 breast Anatomy 0.000 description 1
- 238000007796 conventional method Methods 0.000 description 1
- 208000031513 cyst Diseases 0.000 description 1
- 230000002950 deficient Effects 0.000 description 1
- 230000001419 dependent effect Effects 0.000 description 1
- 238000001514 detection method Methods 0.000 description 1
- 230000029087 digestion Effects 0.000 description 1
- 210000001198 duodenum Anatomy 0.000 description 1
- 238000002592 echocardiography Methods 0.000 description 1
- 201000011523 endocrine gland cancer Diseases 0.000 description 1
- 238000005516 engineering process Methods 0.000 description 1
- 210000003238 esophagus Anatomy 0.000 description 1
- 238000001914 filtration Methods 0.000 description 1
- 238000007667 floating Methods 0.000 description 1
- 210000001035 gastrointestinal tract Anatomy 0.000 description 1
- 238000003780 insertion Methods 0.000 description 1
- 230000037431 insertion Effects 0.000 description 1
- 230000001788 irregular Effects 0.000 description 1
- 210000002429 large intestine Anatomy 0.000 description 1
- 210000004185 liver Anatomy 0.000 description 1
- 210000004072 lung Anatomy 0.000 description 1
- 210000005075 mammary gland Anatomy 0.000 description 1
- 238000005259 measurement Methods 0.000 description 1
- 208000022669 mucinous neoplasm Diseases 0.000 description 1
- 210000000277 pancreatic duct Anatomy 0.000 description 1
- 230000001902 propagating effect Effects 0.000 description 1
- 210000002307 prostate Anatomy 0.000 description 1
- 230000035945 sensitivity Effects 0.000 description 1
- 210000002784 stomach Anatomy 0.000 description 1
- 210000001685 thyroid gland Anatomy 0.000 description 1
- 230000009466 transformation Effects 0.000 description 1
- 210000000626 ureter Anatomy 0.000 description 1
- 210000003708 urethra Anatomy 0.000 description 1
- 230000002792 vascular Effects 0.000 description 1
Images


Classifications
-
- A—HUMAN NECESSITIES
- A61—MEDICAL OR VETERINARY SCIENCE; HYGIENE
- A61B—DIAGNOSIS; SURGERY; IDENTIFICATION
- A61B8/00—Diagnosis using ultrasonic, sonic or infrasonic waves
- A61B8/52—Devices using data or image processing specially adapted for diagnosis using ultrasonic, sonic or infrasonic waves
- A61B8/5269—Devices using data or image processing specially adapted for diagnosis using ultrasonic, sonic or infrasonic waves involving detection or reduction of artifacts
-
- A—HUMAN NECESSITIES
- A61—MEDICAL OR VETERINARY SCIENCE; HYGIENE
- A61B—DIAGNOSIS; SURGERY; IDENTIFICATION
- A61B8/00—Diagnosis using ultrasonic, sonic or infrasonic waves
- A61B8/52—Devices using data or image processing specially adapted for diagnosis using ultrasonic, sonic or infrasonic waves
- A61B8/5207—Devices using data or image processing specially adapted for diagnosis using ultrasonic, sonic or infrasonic waves involving processing of raw data to produce diagnostic data, e.g. for generating an image
-
- A—HUMAN NECESSITIES
- A61—MEDICAL OR VETERINARY SCIENCE; HYGIENE
- A61B—DIAGNOSIS; SURGERY; IDENTIFICATION
- A61B8/00—Diagnosis using ultrasonic, sonic or infrasonic waves
- A61B8/12—Diagnosis using ultrasonic, sonic or infrasonic waves in body cavities or body tracts, e.g. by using catheters
-
- A—HUMAN NECESSITIES
- A61—MEDICAL OR VETERINARY SCIENCE; HYGIENE
- A61B—DIAGNOSIS; SURGERY; IDENTIFICATION
- A61B8/00—Diagnosis using ultrasonic, sonic or infrasonic waves
- A61B8/13—Tomography
- A61B8/14—Echo-tomography
-
- A—HUMAN NECESSITIES
- A61—MEDICAL OR VETERINARY SCIENCE; HYGIENE
- A61B—DIAGNOSIS; SURGERY; IDENTIFICATION
- A61B8/00—Diagnosis using ultrasonic, sonic or infrasonic waves
- A61B8/46—Ultrasonic, sonic or infrasonic diagnostic devices with special arrangements for interfacing with the operator or the patient
- A61B8/461—Displaying means of special interest
Definitions
- the present invention relates to an ultrasonic observation apparatus that observes a tissue to be observed using ultrasonic waves, an operation method of the ultrasonic observation apparatus, and an operation program of the ultrasonic observation apparatus.
- Ultrasound may be applied to observe the characteristics of the biological tissue or material that is the object of observation. Specifically, ultrasonic waves are transmitted to the observation target, and predetermined signal processing is performed on the ultrasonic echoes reflected by the observation target, thereby acquiring information related to the characteristics of the observation target.
- the intensity of ultrasonic waves is attenuated when propagating through the observation target.
- a technique for determining characteristics of a material to be observed using this attenuation is known (see, for example, Patent Document 1).
- an electrical signal corresponding to an ultrasonic echo is converted into an amplitude spectrum in the frequency domain, and the attenuation is calculated by comparing the amplitude spectrum with a predetermined reference amplitude spectrum.
- the material properties are determined by fitting with a dependent attenuation model.
- the reference amplitude spectrum is made of a material that has the same shape as the observation target and has an ultrasonic velocity equivalent to that of the observation target, but substantially does not attenuate the ultrasonic wave. It is set using a reference object (reference piece).
- the method for determining the characteristics of the observation target using the reference amplitude spectrum set in this way is effective in the case of a material having a regular structure, but is applied to a biological tissue in which the structure itself is irregular. Difficult to do.
- the present invention has been made in view of the above, and it is possible to obtain an attenuation characteristic of an ultrasonic wave suitable for an observation object by simple calculation and to perform an observation using the attenuation characteristic.
- An object is to provide an observation apparatus, an operation method of an ultrasonic observation apparatus, and an operation program of the ultrasonic observation apparatus.
- the ultrasonic observation apparatus converts an ultrasonic echo reflected by the observation target into an electrical signal.
- a frequency analysis unit that calculates a plurality of frequency spectra by analyzing the frequency of a signal generated based on an echo signal; and a feature amount of each of the plurality of frequency spectra is calculated, and the ultrasonic wave propagates through the observation target
- the at least three attenuation rate candidate values that give different attenuation characteristics when performing the attenuation correction for eliminating the influence of the attenuation of the ultrasonic wave on the feature amount of each frequency spectrum
- the ultrasonic observation apparatus is the ultrasonic observation apparatus according to the above aspect, wherein the feature amount calculation unit uses data having a dynamic range wider than a dynamic range of data used by the feature amount image data generation unit. It is characterized by setting.
- the feature amount calculation unit calculates the feature amount by performing a process of approximating each frequency spectrum by an n-order equation (n is a positive integer). It is characterized by that.
- the feature amount calculation unit approximates a predetermined frequency band in the frequency spectrum by a linear expression, an intercept and an inclination of the linear expression, and an intermediate between the frequency bands.
- One or more of the mid-band fits that are values of the linear expression at a frequency, including one of the slope and the mid-band fit, is calculated as the feature amount, and either the slope or the mid-band fit is calculated.
- the optimum attenuation rate is set based on one of the above.
- the optimum attenuation rate is set based on the inclination, and the midband fit is performed. Is calculated as the feature amount, the optimum attenuation rate is set based on the midband fit.
- the ultrasonic observation apparatus is characterized in that, in the above invention, the feature amount calculation unit sets the optimum attenuation rate in all frames of the ultrasonic image.
- the feature amount calculation unit sets the optimal attenuation rate for each predetermined number of frames larger than 1 of the ultrasonic image, and sets the optimal attenuation rate. For a frame that is not set, the feature amount of each frequency spectrum is calculated using the optimum attenuation rate that was set last before the frame.
- the feature amount calculation unit calculates an optimum attenuation rate equivalent value corresponding to the optimum attenuation rate in all frames of the ultrasound image, and is greater than 1.
- the optimum attenuation rate is set based on the value corresponding to the optimum attenuation rate calculated in a predetermined number of frames.
- the ultrasonic observation apparatus is characterized in that, in the above invention, the feature image data includes information on the optimum attenuation rate.
- the ultrasonic observation apparatus is characterized in that, in the above-mentioned invention, the ultrasonic observation apparatus further includes a display unit for displaying a feature image corresponding to the feature image data.
- the ultrasonic observation apparatus further includes an input unit that receives a setting input of a target region in which the frequency analysis unit calculates the frequency spectrum in the above invention, and the frequency analysis unit is reflected by the target region.
- the frequency spectrum is calculated based on the ultrasonic echo.
- the operation method of the ultrasonic observation apparatus includes a frequency of a signal generated on the basis of an echo signal obtained by converting an ultrasonic echo reflected by the observation target into an electric signal.
- the correction feature quantity of each frequency spectrum is calculated by performing attenuation correction that eliminates the influence of the attenuation of the ultrasonic wave on the feature quantity of each frequency spectrum.
- a secondary function based on the statistical variation is calculated.
- a feature amount calculating step for setting an attenuation rate candidate value having the smallest statistical variation in the quadratic function as an optimal attenuation rate, and a feature amount image data generation unit sets the optimal attenuation rate to A feature amount image data generating step of generating feature amount image data to be displayed together with the ultrasonic image generated from the echo signal in association with the corrected feature amount based on visual information.
- the operation program of the ultrasonic observation apparatus includes a frequency of a signal generated on the basis of an echo signal obtained by converting an ultrasonic echo reflected by the observation target into an electric signal.
- the frequency analysis procedure for calculating a plurality of frequency spectra by analyzing the frequency, and the feature amount calculation unit respectively calculate the feature amounts of the plurality of frequency spectra, and are different from each other when the ultrasonic wave propagates through the observation target.
- the correction feature quantity of each frequency spectrum is calculated by performing attenuation correction that eliminates the influence of the attenuation of the ultrasonic wave on the feature quantity of each frequency spectrum.
- the present invention it is possible to obtain the attenuation characteristic of the ultrasonic wave suitable for the observation target by simple calculation, and to perform the observation using the attenuation characteristic.
- FIG. 1 is a block diagram showing a configuration of an ultrasonic observation system provided with an ultrasonic observation apparatus according to an embodiment of the present invention.
- FIG. 2 is a diagram illustrating a relationship between the reception depth and the amplification factor in the amplification processing performed by the signal amplification unit of the ultrasonic observation apparatus according to the embodiment of the present invention.
- FIG. 3 is a diagram illustrating a relationship between the reception depth and the amplification factor in the amplification correction process performed by the amplification correction unit of the ultrasonic observation apparatus according to the embodiment of the present invention.
- FIG. 4 is a diagram schematically showing a data array in one sound ray of the ultrasonic signal.
- FIG. 5 is a diagram illustrating an example of a frequency spectrum calculated by the frequency analysis unit of the ultrasonic observation apparatus according to the embodiment of the present invention.
- FIG. 6 is a diagram showing a straight line having as a parameter the correction feature amount corrected by the attenuation correction unit of the ultrasonic observation apparatus according to the embodiment of the present invention.
- FIG. 7 is a diagram schematically illustrating a distribution example of correction feature amounts that have been attenuation-corrected based on two different attenuation rate candidate values for the same observation target.
- FIG. 8 is a diagram schematically showing the relationship between the attenuation rate candidate value and the variance of the corrected feature amount that has been attenuation-corrected based on the attenuation rate candidate value.
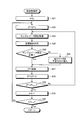
- FIG. 9 is a flowchart showing an outline of processing performed by the ultrasonic observation apparatus according to the embodiment of the present invention.
- FIG. 10 is a flowchart showing an outline of processing executed by the frequency analysis unit of the ultrasonic observation apparatus according to the embodiment of the present invention.
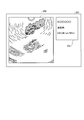
- FIG. 11 is a diagram schematically illustrating a display example of the feature amount image in the display device of the ultrasonic observation apparatus system according to the embodiment of the present invention.
- FIG. 1 is a block diagram showing a configuration of an ultrasonic observation system provided with an ultrasonic observation apparatus according to an embodiment of the present invention.
- An ultrasonic observation system 1 shown in FIG. 1 transmits an ultrasonic wave to a subject to be observed and receives an ultrasonic wave reflected by the subject, and an ultrasonic endoscope 2.
- an ultrasonic observation device 3 that generates an ultrasonic image based on the ultrasonic signal acquired by the, and a display device 4 that displays the ultrasonic image generated by the ultrasonic observation device 3.
- the ultrasonic endoscope 2 converts an electrical pulse signal received from the ultrasonic observation device 3 into an ultrasonic pulse (acoustic pulse) and irradiates the subject at the tip thereof, and is reflected by the subject.
- the ultrasonic transducer 21 converts the ultrasonic echo into an electrical echo signal expressed by a voltage change and outputs it.
- the ultrasonic endoscope 2 usually has an imaging optical system and an imaging device, and is inserted into a digestive tract (esophagus, stomach, duodenum, large intestine) or respiratory organ (trachea / bronchi) of a subject for digestion. It is possible to image a tube, respiratory organ, and surrounding organs (pancreas, gallbladder, bile duct, biliary tract, lymph node, mediastinal organ, blood vessel, etc.).
- the ultrasonic endoscope 2 has a light guide that guides illumination light to be irradiated onto the subject during imaging.
- the light guide has a distal end portion that reaches the distal end of the insertion portion of the ultrasonic endoscope 2 into the subject, and a proximal end portion that is connected to a light source device that generates illumination light.
- the ultrasonic observation device 3 is electrically connected to the ultrasonic endoscope 2 and transmits a transmission signal (pulse signal) including a high voltage pulse to the ultrasonic transducer 21 based on a predetermined waveform and transmission timing.
- a transmitter / receiver 31 that receives an echo signal that is an electrical reception signal from the ultrasonic transducer 21 and generates and outputs digital radio frequency (RF) data (hereinafter referred to as RF data);
- RF data digital radio frequency
- a signal processing unit 32 that generates digital B-mode reception data based on the RF data received from the unit 31; a calculation unit 33 that performs predetermined calculations on the RF data received from the transmission / reception unit 31;
- An image processing unit 34 that generates data, and an input unit that is implemented using a user interface such as a keyboard, a mouse, and a touch panel, and receives input of various types of information It includes a 5, a control unit 36 for controlling the entire ultrasound observation system 1, a storage unit 37 that stores various information
- the transmission / reception unit 31 includes a signal amplification unit 311 that amplifies the echo signal.
- the signal amplification unit 311 performs STC (Sensitivity Time Control) correction in which an echo signal having a larger reception depth is amplified with a higher amplification factor.
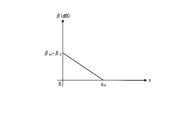
- FIG. 2 is a diagram illustrating the relationship between the reception depth and the amplification factor in the amplification process performed by the signal amplification unit 311.
- the reception depth z shown in FIG. 2 is an amount calculated based on the elapsed time from the reception start point of the ultrasonic wave. As shown in FIG.
- the amplification factor ⁇ (dB) increases linearly from ⁇ 0 to ⁇ th (> ⁇ 0 ) as the reception depth z increases.
- the amplification factor ⁇ (dB) takes a constant value ⁇ th when the reception depth z is equal to or greater than the threshold value z th .
- the value of the threshold value z th is such a value that the ultrasonic signal received from the observation target is almost attenuated and the noise becomes dominant. More generally, when the reception depth z is smaller than the threshold value z th , the amplification factor ⁇ may increase monotonously as the reception depth z increases.
- the relationship shown in FIG. 2 is stored in the storage unit 37 in advance.
- the transmission / reception unit 31 performs processing such as filtering on the echo signal amplified by the signal amplification unit 311 and then performs A / D conversion to generate time domain RF data, and the signal processing unit 32 and the calculation unit To 33.
- the transmission / reception unit 31 includes a plurality of beams for beam synthesis corresponding to the plurality of elements.
- a channel circuit is included.
- the frequency band of the pulse signal transmitted by the transmission / reception unit 31 may be a wide band that substantially covers the linear response frequency band of the electroacoustic conversion of the pulse signal to the ultrasonic pulse in the ultrasonic transducer 21.
- the various processing frequency bands of the echo signal in the signal amplifying unit 311 may be a wide band that substantially covers the linear response frequency band of the acoustoelectric conversion of the ultrasonic transducer 21 into the echo signal of the ultrasonic echo. Accordingly, it is possible to perform accurate approximation when performing frequency spectrum approximation processing, which will be described later.
- the transmission / reception unit 31 transmits various control signals output from the control unit 36 to the ultrasonic endoscope 2 and receives various types of information including an identification ID from the ultrasonic endoscope 2 and receives the control unit 36. It also has a function to transmit to.
- the signal processing unit 32 performs known processing such as band-pass filter, envelope detection, and logarithmic conversion on the RF data to generate digital B-mode reception data. In logarithmic conversion, the common logarithm of the amount obtained by dividing the RF data by the reference voltage V c is taken and expressed as a decibel value.
- the signal processing unit 32 outputs the generated B-mode reception data to the image processing unit 34.
- the signal processing unit 32 is realized using a CPU (Central Processing Unit), various arithmetic circuits, and the like.
- the calculation unit 33 performs amplification correction on the RF data generated by the transmission / reception unit 31 so as to make the amplification factor ⁇ constant regardless of the reception depth, and fast Fourier transform on the RF data subjected to the amplification correction.
- a frequency analysis unit 332 that calculates a frequency spectrum by performing frequency analysis by applying (FFT: Fast Fourier Transform), and a feature amount calculation unit 333 that calculates a feature amount of the frequency spectrum.
- the calculation unit 33 is realized using a CPU (Central Processing Unit), various calculation circuits, and the like.
- FIG. 3 is a diagram illustrating a relationship between the reception depth and the amplification factor in the amplification correction process performed by the amplification correction unit 331.
- the amplification rate ⁇ (dB) in the amplification process performed by the amplification correction unit 331 takes the maximum value ⁇ th ⁇ 0 when the reception depth z is zero, and the reception depth z is zero to the threshold value z th. Decreases linearly until reaching 0 and is zero when the reception depth z is greater than or equal to the threshold z th .
- the amplification correction unit 331 amplifies and corrects the digital RF signal with the amplification factor determined in this way, thereby canceling the influence of the STC correction in the signal processing unit 32 and outputting a signal with a constant amplification factor ⁇ th. .
- the relationship between the reception depth z and the amplification factor ⁇ performed by the amplification correction unit 331 differs depending on the relationship between the reception depth and the amplification factor in the signal processing unit 32.
- STC correction is a correction process that eliminates the influence of attenuation from the amplitude of the analog signal waveform by amplifying the amplitude of the analog signal waveform uniformly over the entire frequency band and with a gain that monotonously increases with respect to the depth. is there. For this reason, when generating a B-mode image to be displayed by converting the amplitude of the echo signal into luminance, and when scanning a uniform tissue, the luminance value is constant regardless of the depth by performing STC correction. become. That is, an effect of eliminating the influence of attenuation from the luminance value of the B-mode image can be obtained.
- the STC correction cannot accurately eliminate the influence of attenuation accompanying the propagation of the ultrasonic wave. This is because, although the attenuation amount generally varies depending on the frequency (see Equation (1) described later), the STC correction amplification factor changes only according to the distance and has no frequency dependence.
- the amplification correction unit 331 Correct the gain.
- the frequency analysis unit 332 samples the RF data (line data) of each sound ray amplified and corrected by the amplification correction unit 331 at a predetermined time interval to generate sample data.
- the frequency analysis unit 332 calculates a frequency spectrum at a plurality of locations (data positions) on the RF data by performing FFT processing on the sample data group.
- FIG. 4 is a diagram schematically showing a data array in one sound ray of the ultrasonic signal.
- a white or black rectangle means data at one sample point.
- the data located on the right side is sample data from a deeper location when measured along the sound ray SR k from the ultrasonic transducer 21.
- the sound ray SR k is discretized at a time interval corresponding to a sampling frequency (for example, 50 MHz) in A / D conversion performed by the transmission / reception unit 31.
- FIG. 1 a sampling frequency
- a sample data group needs to have a power number of 2 data.
- a process for generating a normal sample data group is performed by inserting zero data in an insufficient amount. This point will be described in detail when the processing of the frequency analysis unit 332 is described (see FIG. 9).
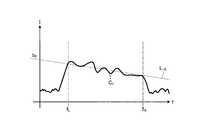
- FIG. 5 is a diagram illustrating an example of a frequency spectrum calculated by the frequency analysis unit 332.
- the “frequency spectrum” means “frequency distribution of intensity at a certain reception depth z” obtained by subjecting the sample data group to FFT processing.
- intensity refers to parameters such as the voltage of the echo signal, the power of the echo signal, the sound pressure of the ultrasonic echo, the acoustic energy of the ultrasonic echo, the amplitude and time integral value of these parameters, and combinations thereof. Points to either.
- the horizontal axis is the frequency f.
- the lower limit frequency f L and the upper limit frequency f H of the frequency band used for the subsequent calculation are the frequency band of the ultrasonic transducer 21 and the frequency band of the pulse signal transmitted by the transmitting / receiving unit 31. It is a parameter determined based on the above.
- the frequency band determined by the lower limit frequency f L and the upper limit frequency f H is referred to as “frequency band U”.
- the frequency spectrum shows a tendency that varies depending on the properties of the living tissue scanned with ultrasonic waves. This is because the frequency spectrum has a correlation with the size, number density, acoustic impedance, and the like of the scatterer that scatters ultrasonic waves.
- the “characteristics of the biological tissue” referred to here includes, for example, malignant tumor (cancer), benign tumor, endocrine tumor, mucinous tumor, normal tissue, cyst, vascular vessel and the like.
- the feature amount calculation unit 333 calculates the feature amounts of the plurality of frequency spectra, respectively.
- the feature amount calculation unit 333 A correction feature amount of each frequency spectrum is calculated by performing attenuation correction that eliminates the influence of ultrasonic attenuation on the amount (hereinafter referred to as a pre-correction feature amount), and a plurality of attenuation rates are calculated using the correction feature amount.
- the optimal attenuation rate is set for the observation target from the candidate values.
- the feature amount calculation unit 333 includes an approximation unit 333a that calculates a pre-correction feature amount of the frequency spectrum by approximating the frequency spectrum with a straight line, and a plurality of attenuation rate candidate values for the pre-correction feature amount calculated by the approximation unit 333a.
- Attenuation correction unit 333b that calculates a correction feature amount by performing attenuation correction based on each of the above, and a plurality of variations based on statistical variation of the correction feature amount calculated for all frequency spectra by attenuation correction unit 333b
- An optimum attenuation rate setting unit 333c for setting an optimum attenuation rate from among the attenuation rate candidate values.
- the approximating unit 333a performs a regression analysis of the frequency spectrum in a predetermined frequency band and approximates the frequency spectrum with a linear expression (regression line), thereby calculating a pre-correction feature quantity characterizing the approximated primary expression. For example, in the case of the frequency spectrum C 1 shown in FIG. 5, the approximating unit 333a obtains a regression line L 10 by performing regression analysis in the frequency band U and approximating the frequency spectrum C 1 with a linear expression.
- (Mid-band fit) c 0 a 0 f M + b 0 is calculated as a feature amount before correction.
- the slope a 0 has a correlation with the size of the ultrasonic scatterer, and it is generally considered that the larger the scatterer, the smaller the slope.
- the intercept b 0 has a correlation with the size of the scatterer, the difference in acoustic impedance, the number density (concentration) of the scatterer, and the like. Specifically, the intercept b 0 has a larger value as the scatterer is larger, has a larger value as the difference in acoustic impedance is larger, and has a larger value as the number density of the scatterers is larger.
- the mid-band fit c 0 is an indirect parameter derived from the slope a 0 and the intercept b 0 and gives the intensity of the spectrum at the center in the effective frequency band. Therefore, the midband fit c 0 is considered to have a certain degree of correlation with the brightness of the B-mode image in addition to the size of the scatterer, the difference in acoustic impedance, and the number density of the scatterers. Note that the feature amount calculation unit 333 may approximate the frequency spectrum with a second-order or higher polynomial by regression analysis.
- the ultrasonic attenuation A (f, z) is attenuation that occurs while the ultrasonic waves reciprocate between the reception depth 0 and the reception depth z, and the intensity change before and after the reciprocation (difference in decibel expression). ).
- the attenuation amount A (f, z) is empirically known to be proportional to the frequency in a uniform tissue, and is expressed by the following equation (1).
- a (f, z) 2 ⁇ zf (1)
- the proportionality constant ⁇ is an amount called an attenuation rate.
- Z is the ultrasonic reception depth
- f is the frequency.
- the attenuation correction unit 333b performs attenuation correction on each of a plurality of attenuation rate candidate values in order to set the most suitable attenuation rate (optimum attenuation rate). Details of the plurality of attenuation rate candidate values will be described later with reference to FIG.
- the attenuation correction unit 333b performs attenuation correction according to the following equations (2) to (4) with respect to the pre-correction feature values (slope a 0 , intercept b 0 , midband fit c 0 ) extracted by the approximation unit 333a. By doing so, the correction feature amounts a, b, and c are calculated.
- the attenuation correction unit 333b performs correction with a larger correction amount as the ultrasonic reception depth z is larger.
- the correction related to the intercept is an identity transformation. This is because the intercept is a frequency component corresponding to a frequency of 0 (Hz) and is not affected by attenuation.
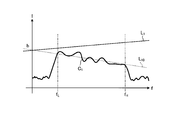
- FIG. 6 is a diagram illustrating a straight line having the correction feature amounts a, b, and c corrected by the attenuation correction unit 333b as parameters.
- the optimum attenuation rate setting unit 333c sets, as the optimum attenuation rate, the attenuation rate candidate value with the smallest statistical variation of the correction feature amount calculated for each attenuation rate candidate value by the attenuation correction unit 333b with respect to all frequency spectra. Set. In this embodiment, dispersion is applied as an amount indicating statistical variation. In this case, the optimum attenuation rate setting unit 333c sets the attenuation rate candidate value that minimizes the variance as the optimum attenuation rate. Two of the three correction feature values a, b, and c described above are independent. In addition, the correction feature amount b does not depend on the attenuation rate. Therefore, when setting an optimum attenuation rate for the correction feature amounts a and c, the optimum attenuation rate setting unit 333c may calculate the variance of one of the correction feature amounts a and c.
- the correction feature amount used when the optimum attenuation rate setting unit 333c sets the optimum attenuation rate is the same type as the correction feature amount used when the feature amount image data generation unit 342 generates the feature amount image data. It is preferable. That is, when the feature amount image data generation unit 342 generates the feature amount image data using the inclination as the correction feature amount, the distribution of the correction feature amount a is applied, and the feature amount image data generation unit 342 applies the midpoint as the correction feature amount. When generating feature amount image data using band fitting, it is more preferable to apply the variance of the corrected feature amount c. This is because the equation (1) that gives the attenuation amount A (f, z) is merely ideal, and the following equation (6) is more appropriate in reality.
- the reason why the optimum attenuation rate can be set based on statistical variation will be described.
- the feature amount is converged to a value unique to the observation target regardless of the distance between the observation target and the ultrasonic transducer 21, and the statistical variation is considered to be small.
- the attenuation rate candidate value that does not match the observation target is set as the optimal attenuation rate, the attenuation correction is excessive or insufficient, and thus the feature amount is shifted depending on the distance from the ultrasonic transducer 21. It is considered that the statistical variation of the feature amount is increased. Therefore, it can be said that the attenuation rate candidate value having the smallest statistical variation is the optimum attenuation rate for the observation target.
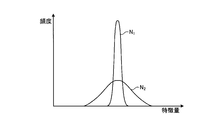
- FIG. 7 is a diagram schematically illustrating a distribution example of correction feature amounts that have been attenuation-corrected based on two different attenuation rate candidate values for the same observation target.
- the horizontal axis is the correction feature amount
- the vertical axis is the frequency.
- the two distribution curves N 1 and N 2 shown in FIG. 7 have the same total frequency.
- the distribution curve N 1 has a smaller statistical variation in feature quantity (small variance) and a steep mountain compared to the distribution curve N 2 .
- the optimum attenuation rate setting unit 333c sets an optimum attenuation rate from the two attenuation rate candidate values corresponding to the two distribution curves N 1 and N 2 , the attenuation rate candidate value corresponding to the distribution curve N 1 is set. Is set as the optimum attenuation factor.
- the optimum attenuation rate setting unit 333c is generated based on the variance of the correction feature quantity c that has been attenuation-corrected based on a plurality (three in this embodiment) of attenuation rate candidate values. A minimum value (extreme value) in the next function is obtained, and an attenuation candidate value corresponding to the extreme value is set as an optimum attenuation rate.
- three attenuation candidate values are stored in advance in the storage unit 37, and the optimum attenuation rate setting unit 333c determines the three attenuation rate candidate values. Use to set the optimum attenuation factor.
- the attenuation rate candidate values ⁇ 1 , ⁇ 2 , and ⁇ 3 are values of 0.0 or more, and when the observation target is a biological tissue, the attenuation rate of the biological tissue is generally around 0.6. It is preferable that the smallest attenuation rate candidate value among the attenuation candidate values is 0.6 or less, and the largest value is 0.6 or more.
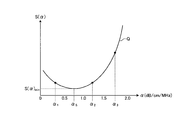
- FIG. 8 shows attenuation rate candidate values ⁇ 1 , ⁇ 2 , and ⁇ 3, and dispersions S ( ⁇ 1 ) and S of corrected feature values that are attenuated based on the attenuation rate candidate values ⁇ 1 , ⁇ 2 , and ⁇ 3 , respectively. It is a figure which shows typically the relationship with the quadratic function Q produced
- the optimum attenuation rate setting unit 333c includes variances S ( ⁇ 1 ), S ( ⁇ 2 ), and S ( ⁇ 2 ), correction feature amount c corrected for attenuation based on preset attenuation rate candidate values ⁇ 1 , ⁇ 2 , and ⁇ 3 .
- the optimum attenuation rate setting unit 333c obtains the extreme value of the generated quadratic function Q, and sets the attenuation rate candidate value ⁇ S corresponding to the extreme value as the optimum attenuation rate.
- V a ( ⁇ ) is a positive value. Therefore, V a ( ⁇ ) is also a downward convex quadratic function.
- the image processing unit 34 converts the amplitude of the echo signal into luminance and displays the B-mode image data generation unit 341 that generates B-mode image data that is an ultrasonic image to be displayed, and the optimum attenuation rate setting unit 333c. And a feature amount image data generation unit 342 that generates feature amount image data to be displayed together with the B-mode image in association with the feature amount based on the attenuation rate.
- the B-mode image data generation unit 341 performs signal processing using known techniques such as gain processing and contrast processing on the B-mode reception data received from the signal processing unit 32, and displays an image on the display device 4.
- B-mode image data is generated by thinning out data according to the data step width determined according to the range.
- the B-mode image is a grayscale image in which values of R (red), G (green), and B (blue), which are variables when the RGB color system is adopted as a color space, are matched.
- the B-mode image data generation unit 341 performs coordinate conversion for rearranging the B-mode reception data from the signal processing unit 32 so that the scanning range can be spatially represented correctly, and then performs interpolation processing between the B-mode reception data. As a result, the gaps between the B-mode reception data are filled, and B-mode image data is generated.
- the B-mode image data generation unit 341 outputs the generated B-mode image data to the feature amount image data generation unit 342.
- the feature amount image data generation unit 342 generates a feature amount image by associating a hue as visual information with any one of the above-described inclination, intercept, and midband fit, for example.
- the feature amount image data generation unit 342 generates the feature amount image data by associating the hue with one of the two feature amounts selected from the inclination, the intercept, and the midband fit, and by associating the light and dark with the other. May be.
- visual information related to the feature amount for example, variables in a color space constituting a predetermined color system such as hue, saturation, brightness, luminance value, R (red), G (green), and B (blue) are included. Can be mentioned.
- the control unit 36 is realized using a CPU (Central Processing Unit) having various calculation and control functions, various arithmetic circuits, and the like.
- the control unit 36 controls the ultrasonic observation apparatus 3 in an integrated manner by reading information stored and stored in the storage unit 37 from the storage unit 37 and executing various arithmetic processes related to the operation method of the ultrasonic observation apparatus 3. To do.
- the control unit 36 may be configured using a CPU or the like common to the signal processing unit 32 and the calculation unit 33.
- the storage unit 37 includes attenuation rate candidate values ⁇ 1 , ⁇ 2 , ⁇ 3 , a plurality of feature amounts calculated by the attenuation correction unit 333 b for each frequency spectrum in accordance with the attenuation rate candidate values, and statistical information on the plurality of feature amounts.
- a feature amount information storage unit 371 for storing a dispersion giving a large variation in association with an attenuation rate candidate value.
- the storage unit 37 has information necessary for amplification processing (relationship between the amplification factor and the reception depth shown in FIG. 2) and information necessary for amplification correction processing (the amplification factor and the reception depth shown in FIG. 3). ), Information necessary for the attenuation correction process (see equation (1)), information on window functions (Hamming, Hanning, Blackman, etc.) necessary for the frequency analysis process, and the like are stored.
- the storage unit 37 stores various programs including an operation program for executing the operation method of the ultrasonic observation apparatus 3.
- the operation program can be recorded on a computer-readable recording medium such as a hard disk, a flash memory, a CD-ROM, a DVD-ROM, or a flexible disk and widely distributed.
- the various programs described above can also be obtained by downloading via a communication network.
- the communication network here is realized by, for example, an existing public line network, LAN (Local Area Network), WAN (Wide Area Network), etc., and may be wired or wireless.
- the storage unit 37 having the above configuration is realized using a ROM (Read Only Memory) in which various programs are installed in advance, and a RAM (Random Access Memory) that stores calculation parameters and data of each process. .
- ROM Read Only Memory
- RAM Random Access Memory
- the dynamic range of the correction feature amount is preferably set according to a range that can be set by gain processing, contrast processing, and the like performed by the image processing unit 34.
- the attenuation rate candidate values ⁇ 1 , ⁇ 2 , and ⁇ 3 are dynamic ranges related to display according to a range in which the feature amount displayed as the feature amount image can be set by the above-described gain processing, contrast processing, and the like. There are three values set between 0.0 and 2.0 so as to be within. For example, if the attenuation candidate value is larger than 2.0, the calculated corrected feature value may exceed the dynamic range, and may not be held as the corrected feature value.
- the values of statistical variation are different, and for example, a function generated based on the variance does not become a quadratic function, and the attenuation rate cannot be set to an optimum value. That is, the attenuation rate candidate values ⁇ 1 , ⁇ 2 , and ⁇ 3 according to the present embodiment are values set in the range of 0.0 to 2.0, and are the smallest attenuation among the three attenuation candidate values. It is preferable that the rate candidate value is 0.6 or less and the largest value is 0.6 or more. In particular, when the observation target is a living tissue and the eigenpoint method is used, it is more preferable that the three attenuation candidate values are set to values near 0.6 in order to suppress a decrease in calculation accuracy due to clipping. .
- FIG. 9 is a flowchart showing an outline of processing performed by the ultrasonic observation apparatus 3 having the above configuration.
- the ultrasonic observation device 3 receives an echo signal as a measurement result of an observation target by the ultrasonic transducer 21 from the ultrasonic endoscope 2 (step S1).
- the signal amplifying unit 311 that has received the echo signal from the ultrasonic transducer 21 amplifies the echo signal (step S2).
- the signal amplifying unit 311 performs amplification (STC correction) of the echo signal based on the relationship between the amplification factor and the reception depth shown in FIG. 2, for example.
- the B-mode image data generation unit 341 generates B-mode image data using the echo signal amplified by the signal amplification unit 311 and outputs the B-mode image data to the display device 4 (step S3).
- the display device 4 that has received the B-mode image data displays a B-mode image corresponding to the B-mode image data (step S4).
- the amplification correction unit 331 performs amplification correction on the signal output from the transmission / reception unit 31 so that the amplification factor is constant regardless of the reception depth (step S5).
- the amplification correction unit 331 performs amplification correction so that, for example, the relationship between the amplification factor and the reception depth illustrated in FIG. 3 is established.
- the frequency analysis unit 332 calculates frequency spectra for all sample data groups in the region of interest, which is a region for generating feature amount image data, by performing frequency analysis by FFT calculation (step S6: frequency analysis). Step).
- FIG. 10 is a flowchart showing an outline of the processing executed by the frequency analysis unit 332 in step S6.
- the frequency analysis processing will be described in detail with reference to the flowchart shown in FIG.
- the frequency analysis unit 332 sets a counter k for identifying a sound ray to be analyzed as k 0 (step S21).
- the frequency analysis unit 332 sets an initial value Z (k) 0 of a data position (corresponding to a reception depth) Z (k) representing a series of data groups (sample data group) acquired for the FFT calculation.
- FIG. 4 shows a case where the eighth data position of the sound ray SR k is set as the initial value Z (k) 0 as described above.
- the frequency analysis unit 332 acquires a sample data group (step S23), and causes the window function stored in the storage unit 37 to act on the acquired sample data group (step S24).
- the window function By applying the window function to the sample data group in this way, it is possible to avoid the sample data group from becoming discontinuous at the boundary and to prevent the occurrence of artifacts.
- the frequency analysis unit 332 determines whether or not the sample data group at the data position Z (k) is a normal data group (step S25).
- the sample data group needs to have the number of powers of two.
- the number of data in the normal sample data group is 2 n (n is a positive integer).
- step S25 If the result of determination in step S25 is that the sample data group at data position Z (k) is normal (step S25: Yes), the frequency analysis unit 332 proceeds to step S27 described later.
- step S25 If the result of determination in step S25 is that the sample data group at the data position Z (k) is not normal (step S25: No), the frequency analysis unit 332 inserts zero data as much as the deficient amount into a normal sample data group. Generate (step S26). A window function is applied to the sample data group determined to be not normal in step S25 (for example, the sample data group F K in FIG. 4) before adding zero data. For this reason, even if zero data is inserted into the sample data group, data discontinuity does not occur. After step S26, the frequency analysis unit 332 proceeds to step S27 described later.
- step S27 the frequency analysis unit 332 obtains a frequency spectrum that is a frequency distribution of amplitude by performing an FFT operation using the sample data group (step S27).
- FIG frequency spectrum C 1 shown in 5 is an example of the resulting frequency spectrum as a result of step S27.
- the frequency analysis unit 332 changes the data position Z (k) by the step width D (step S28). It is assumed that the step width D is stored in advance in the storage unit 37.
- the step width D is desirably matched with the data step width used when the B-mode image data generation unit 341 generates B-mode image data.
- the step width D A value larger than the data step width may be set as the width D.
- the frequency analysis unit 332 determines whether or not the data position Z (k) is larger than the maximum value Z (k) max in the sound ray SR k (step S29).
- the frequency analysis unit 332 increases the counter k by 1 (step S30). This means that the processing is shifted to the next sound ray.
- the frequency analysis unit 332 returns to step S23.
- the frequency analysis unit 332 performs an FFT operation on [(Z (k) max ⁇ Z (k) 0 +1) / D + 1] sample data groups for the sound ray SR k .
- [X] represents the maximum integer not exceeding X.
- the frequency analysis unit 332 determines whether or not the counter k is greater than the maximum value k max (step S31). When the counter k is larger than the maximum value k max (step S31: Yes), the frequency analysis unit 332 ends the series of frequency analysis processing. On the other hand, when the counter k is equal to or less than the maximum value k max (step S31: No), the frequency analysis unit 332 returns to step S22.
- the maximum value k max is a value arbitrarily input by a user such as an operator through the input unit 35 or a value preset in the storage unit 37.
- the frequency analysis unit 332 performs the FFT operation a plurality of times for each of (k max ⁇ k 0 +1) sound rays in the analysis target region.
- the result of the FFT operation is stored in the storage unit 37 together with the reception depth and the reception direction.
- the frequency analysis process is performed only in the set region of interest.
- the frequency analysis unit 332 performs the frequency analysis process on all the regions that have received the ultrasonic signal. It is also possible.
- the feature amount calculation unit 333 calculates pre-correction feature amounts of a plurality of frequency spectra, and gives different attenuation characteristics when ultrasonic waves propagate through the observation target.
- the correction feature quantity of each frequency spectrum is calculated by performing attenuation correction that eliminates the influence of ultrasonic attenuation on the pre-correction feature quantity of each frequency spectrum, and the correction feature
- the optimal attenuation rate is set for the observation target by calculating the variance for each attenuation rate candidate value using the quantity, generating a quadratic function indicating the relationship between the attenuation rate candidate value and the variance, and obtaining the extreme value (Steps S7 to S12: feature amount calculation step).
- the processing of steps S7 to S12 will be described in detail.
- step S7 the approximating unit 333a performs a regression analysis on each of the plurality of frequency spectra calculated by the frequency analyzing unit 332, thereby calculating a pre-correction feature quantity corresponding to each frequency spectrum of the division region to be set for attenuation rate (Ste S7).
- the approximating unit 333a approximates each frequency spectrum with a linear expression by performing regression analysis, and calculates a slope a 0 , an intercept b 0 , and a midband fit c 0 as pre-correction feature values.
- the straight line L 10 shown in FIG. 5 the approximation unit 333a is the regression line approximated by the regression analysis for the frequency spectrum C 1 frequency band U.
- the optimum attenuation rate setting unit 333c sets the attenuation rate candidate values to be applied when performing attenuation correction, which will be described later, to predetermined setting values ⁇ 1 , ⁇ 2 , and ⁇ 3 .
- the set values ⁇ 1 , ⁇ 2 , and ⁇ 3 may be stored in advance in the feature amount information storage unit 371, and the optimum attenuation rate setting unit 333c may refer to the feature amount information storage unit 371.
- the attenuation correction unit 333b performs attenuation correction on the pre-correction feature values approximated by the approximation unit 333a for each frequency spectrum, using the set values ⁇ 1 , ⁇ 2 , and ⁇ 3 as attenuation rate candidate values. Then, the corrected feature amount is calculated and stored in the feature amount information storage unit 371 together with the set values ⁇ 1 , ⁇ 2 , and ⁇ 3 (step S8).
- a straight line L 1 illustrated in FIG. 6 is an example of a straight line obtained by the attenuation correction unit 333b performing the attenuation correction process.
- the correction feature amount is calculated by substituting Dn.
- f sp is the data sampling frequency
- v s is the sound velocity
- D is the data step width
- n is the number of data steps from the first data of the sound ray up to the data position of the sample data group to be processed.
- the data sampling frequency f sp is 50 MHz
- the sound velocity vs is 1530 m / sec
- the optimum attenuation rate setting unit 333c calculates a variance of representative correction feature amounts among a plurality of correction feature amounts obtained by the attenuation correction unit 333b performing attenuation correction on each frequency spectrum, and sets a set value ⁇ 1. , ⁇ 2 , ⁇ 3 and stored in the feature amount information storage unit 371 (step S9).
- the correction feature amount is the slope a and the midband fit c, as shown in FIG. 8 described above
- the optimum attenuation rate setting unit 333c calculates, for example, the variance of the correction feature amount c.
- step S19 the optimum attenuation rate setting unit 333c applies the variance of the corrected feature amount a when the feature amount image data generation unit 342 generates the feature amount image data using the inclination, and uses the midband fit.
- the optimum attenuation rate setting unit 333c generates a quadratic function based on the variance of the corrected feature quantity c that has been attenuation-corrected based on the set values ⁇ 1 , ⁇ 2 , and ⁇ 3 (step S10).
- the optimum attenuation rate setting unit 333c obtains the extreme value of the generated quadratic function (step S11), and sets the attenuation rate candidate value corresponding to the extreme value as the optimum attenuation rate (step S12).
- the feature amount image data generation unit 342 includes visual information associated with the corrected feature amount based on the optimum attenuation rate specified in step S12 for each pixel in the B mode image data generated by the B mode image data generation unit 341.
- the feature amount image data is generated by superimposing the hue) and adding information of the optimum attenuation rate (step S13: feature amount image data generation step).
- FIG. 11 is a diagram schematically illustrating a display example of the feature amount image on the display device 4.
- the feature amount image 201 shown in the figure includes a superimposed image display unit 202 that displays an image in which visual information related to a feature amount is superimposed on a B-mode image, an identification information of an observation target, and an attenuation rate set as an optimal attenuation rate.
- an information display unit 203 that displays information on candidate values.
- image information such as gain and contrast may be further displayed.
- a B-mode image corresponding to the feature amount image may be displayed side by side with the feature amount image.
- step S4 In the series of processes described above (steps S1 to S14), the process of step S4 and the processes of steps S5 to S12 may be performed in parallel.
- the correction feature amount is obtained by performing the attenuation correction using the three preset values (setting values ⁇ 1 , ⁇ 2 , ⁇ 3 ) as attenuation rate candidate values. Is calculated, the extremum of the quadratic function generated based on the variance of the corrected feature value is obtained, and the attenuation candidate value corresponding to the extremum is set as the optimum attenuation rate. It is possible to obtain a suitable attenuation characteristic of ultrasonic waves at high speed by simple calculation, and to perform observation using the attenuation characteristic.
- an optimum attenuation rate can be set even when the attenuation rate suitable for the observation target is unknown.
- the set values ⁇ 1 , ⁇ 2 , and ⁇ 3 as attenuation rate candidate values are values of 0.0 or more, and the smallest attenuation rate among the three attenuation candidate values.
- the attenuation rate corresponding to the extreme value of the quadratic function is set as the optimal attenuation rate, and therefore a numerical value having a number of digits larger than a preset attenuation rate candidate value. Can be set as the attenuation rate, and the calculation accuracy of the optimum attenuation rate can be improved.
- the attenuation rate candidate values ⁇ 1 , ⁇ 2 , and ⁇ 3 are displayed between 0.0 and 2.0 so that the feature amount displayed as the feature amount image is within the dynamic range.
- information on the quadratic function generated on the information display unit 203 based on the dispersion of the corrected feature values that are attenuation-corrected based on the set values ⁇ 1 , ⁇ 2 , and ⁇ 3 respectively.
- the user can confirm and grasp errors generated in the generation of the quadratic function.
- the optimum attenuation rate setting unit 333c sets an optimum attenuation rate with a dynamic range wider than the dynamic range used when displaying as a feature amount image.
- the feature amount calculation unit 333 performs an attenuation calculation with a dynamic range (for example, 100 dB) larger than the dynamic range (70 dB). Perform processing.
- a dynamic range for example, 100 dB
- the feature amount calculation unit 333 uses an 8-bit fixed-point method
- the feature amount calculation unit 333 uses a 32-bit floating point method to calculate a feature amount and set an optimum attenuation rate. Including attenuation calculation processing.
- the calculation accuracy can be improved as compared with the attenuation calculation process using the fixed-point method.
- the quadratic function based on the variance from the calculation of the feature amount before correction, the optimum attenuation rate can be calculated with high accuracy.
- the optimum attenuation rate setting unit 333c calculates an optimum attenuation rate equivalent value corresponding to the optimum attenuation rate in all frames of the ultrasonic image, and a predetermined number of optimum values including the optimum attenuation rate equivalent value in the latest frame.
- the average value, median value, or mode value of the attenuation rate equivalent values may be set as the optimal attenuation rate. In this case, compared with the case where the optimum attenuation rate is set in each frame, the change in the optimum attenuation rate is reduced, and the value can be stabilized.
- the optimum attenuation rate setting unit 333c may set an optimum attenuation rate at a predetermined frame interval of the ultrasonic image. Thereby, the amount of calculation can be reduced significantly. In this case, the most recently set optimum attenuation value may be used until the next optimum attenuation rate is set.
- the target area for calculating the statistical variation may be set for each sound ray, or the reception depth may be an area having a predetermined value or more. It is good also as a structure which the input part 35 can receive the setting of these area
- the input unit 35 may be configured to accept input of setting changes of the attenuation rate candidate value setting values ⁇ 1 , ⁇ 2 , and ⁇ 3 .
- an amount giving statistical variation for example, any one of standard deviation, a difference between the maximum value and minimum value of the feature amount in the population, and a half-value width of the distribution of the feature amount can be applied. It is also possible to apply the reciprocal of variance as an amount that gives statistical variation, but in this case, the quadratic function is convex upward, and the attenuation rate candidate value corresponding to the extreme value is optimal. It goes without saying that the attenuation rate is obtained.
- the optimum attenuation rate setting unit 333c calculates statistical variations of a plurality of types of correction feature amounts, respectively, and optimizes attenuation rate candidate values according to the extreme values of the quadratic function generated based on the statistical variations. It is also possible to set as a partial attenuation rate.
- Ultrasonic miniature probes are usually inserted into the biliary tract, bile duct, pancreatic duct, trachea, bronchi, urethra, ureter, and used to observe surrounding organs (pancreas, lung, prostate, bladder, lymph nodes, etc.).
- an external ultrasonic probe that irradiates ultrasonic waves from the body surface of the subject may be applied.
- the extracorporeal ultrasonic probe is usually used for observing an abdominal organ (liver, gallbladder, bladder), breast (particularly mammary gland), and thyroid gland.
- the ultrasonic vibrator may be a linear vibrator, a radial vibrator, or a convex vibrator.
- the scanning area is rectangular (rectangular, square), and when the ultrasonic transducer is a radial or convex transducer, the scanning area is fan-shaped or annular.
- the ultrasonic endoscope may be one that mechanically scans the ultrasonic transducer, or a plurality of elements are arranged in an array as the ultrasonic transducer, and the elements involved in transmission and reception are switched electronically. Alternatively, electronic scanning may be performed by delaying transmission / reception of each element.
- the ultrasonic observation apparatus, the operation method of the ultrasonic observation apparatus, and the operation program of the ultrasonic observation apparatus according to the present invention obtain the ultrasonic attenuation characteristics suitable for the observation target by simple calculation, and This is useful for observations using attenuation characteristics.
Abstract
本発明にかかる超音波観測装置は、エコー信号に基づいて生成される信号の周波数を解析することによって複数の周波数スペクトルを算出する周波数解析部と、複数の周波数スペクトルの特徴量をそれぞれ算出し、三つの減衰率候補値の各々において周波数スペクトルの補正特徴量を算出し、減衰率候補値ごとに補正特徴量の統計的なばらつきを算出した後、このばらつきに基づく二次関数を生成し、二次関数において統計的なばらつきが最小である減衰率候補値を最適な減衰率として設定する特徴量算出部と、最適な減衰率に基づく補正特徴量を超音波画像とともに表示する特徴量画像データを生成する特徴量画像データ生成部と、を備えた。
Description
本発明は、超音波を用いて観測対象の組織を観測する超音波観測装置、超音波観測装置の作動方法および超音波観測装置の作動プログラムに関する。
観測対象である生体組織または材料の特性を観測するために、超音波を適用することがある。具体的には、観測対象に超音波を送信し、その観測対象によって反射された超音波エコーに対して所定の信号処理を施すことにより、観測対象の特性に関する情報を取得する。
超音波の強度は、観測対象を伝播する際に減衰する。従来、この減衰を利用して観測対象の材料の特性を決定する技術が知られている(例えば、特許文献1を参照)。この技術では、超音波エコーに対応する電気信号を周波数ドメインの振幅スペクトルに変換し、この振幅スペクトルを所定の基準振幅スペクトルと比較することによって減衰量を算出し、この減衰量を材料の特性に依存した減衰モデルとフィッティングさせることによって材料の特性を決定している。
上述した特許文献1に記載の技術において、基準振幅スペクトルは、観測対象と同じ形状を有し、観測対象と対等の超音波速度を有する一方、超音波の減衰が実質的に生じない材料からなる基準対象(基準片)を用いて設定される。このようにして設定される基準振幅スペクトルを用いた観測対象の特性の決定方法は、規則的な構造を有する材料の場合には有効であるものの、構造自体が不規則な生体組織の場合に適用することは難しい。
また、上記特許文献1に記載の技術において、材料の特性を決定する際には、散乱や吸収などの減衰の原因に応じて異なる複数の減衰モデルを用いることにより、多くの計算を行う必要がある。
本発明は、上記に鑑みてなされたものであって、観測対象に適合した超音波の減衰特性を簡易な計算によって求めることができるとともに、その減衰特性を利用した観測を行うことができる超音波観測装置、超音波観測装置の作動方法および超音波観測装置の作動プログラムを提供することを目的とする。
上述した課題を解決し、目的を達成するために、本発明に係る超音波観測装置は、観測対象に対して送信した超音波が該観測対象によって反射された超音波エコーを電気信号に変換したエコー信号に基づいて生成される信号の周波数を解析することによって複数の周波数スペクトルを算出する周波数解析部と、前記複数の周波数スペクトルの特徴量をそれぞれ算出し、前記超音波が前記観測対象を伝播する際の互いに異なる減衰特性を与える少なくとも三つの減衰率候補値の各々において、各周波数スペクトルの特徴量に対して前記超音波の減衰の影響を排除する減衰補正を行うことによって前記各周波数スペクトルの補正特徴量を算出し、前記減衰率候補値ごとに前記補正特徴量の統計的なばらつきを算出した後、該統計的なばらつきに基づく二次関数を生成し、該二次関数において前記統計的なばらつきが最小である減衰率候補値を最適な減衰率として設定する特徴量算出部と、前記最適な減衰率に基づく前記補正特徴量を視覚情報と関連づけて前記エコー信号から生成された超音波画像とともに表示する特徴量画像データを生成する特徴量画像データ生成部と、を備えたことを特徴とする。
本発明に係る超音波観測装置は、上記発明において、前記特徴量算出部は、前記特徴量画像データ生成部が用いるデータのダイナミックレンジよりも広いダイナミックレンジのデータを用いて前記最適な減衰率の設定を行うことを特徴とする。
本発明に係る超音波観測装置は、上記発明において、前記特徴量算出部は、前記各周波数スペクトルをn次式(nは正の整数)で近似する処理を行うことによって前記特徴量を算出することを特徴とする。
本発明に係る超音波観測装置は、上記発明において、前記特徴量算出部は、前記周波数スペクトルにおける所定の周波数帯域を一次式で近似し、前記一次式の切片および傾き、ならびに前記周波数帯域の中間周波数における前記一次式の値であるミッドバンドフィットのうち、前記傾きおよび前記ミッドバンドフィットのいずれか一方を含む一つまたは複数を前記特徴量として算出し、前記傾きおよび前記ミッドバンドフィットのいずれか一方に基づいて前記最適な減衰率を設定することを特徴とする。
本発明に係る超音波観測装置は、上記発明において、前記特徴量算出部は、前記傾きを前記特徴量として算出する場合は前記傾きに基づいて前記最適な減衰率を設定し、前記ミッドバンドフィットを前記特徴量として算出する場合は前記ミッドバンドフィットに基づいて前記最適な減衰率を設定することを特徴とする。
本発明に係る超音波観測装置は、上記発明において、前記特徴量算出部は、前記超音波画像の全てのフレームで前記最適な減衰率を設定することを特徴とする。
本発明に係る超音波観測装置は、上記発明において、前記特徴量算出部は、前記超音波画像の1より大きい所定数のフレームごとに前記最適な減衰率を設定し、前記最適な減衰率を設定しないフレームでは、該フレーム以前で最後に設定された前記最適な減衰率を用いて前記各周波数スペクトルの特徴量を算出することを特徴とする。
本発明に係る超音波観測装置は、上記発明において、前記特徴量算出部は、前記超音波画像の全てのフレームで前記最適な減衰率に相当する最適減衰率相当値を算出し、1より大きい所定数のフレームで算出した前記最適減衰率相当値をもとに前記最適な減衰率を設定することを特徴とする。
本発明に係る超音波観測装置は、上記発明において、前記特徴量画像データは、前記最適な減衰率に関する情報を含むことを特徴とする。
本発明に係る超音波観測装置は、上記発明において、前記特徴量画像データに対応する特徴量画像を表示する表示部をさらに備えたことを特徴とする。
本発明に係る超音波観測装置は、上記発明において、前記周波数解析部が前記周波数スペクトルを算出する対象領域の設定入力を受け付ける入力部をさらに備え、前記周波数解析部は、前記対象領域で反射された前記超音波エコーをもとに前記周波数スペクトルを算出することを特徴とする。
本発明に係る超音波観測装置の作動方法は、観測対象に対して送信した超音波が該観測対象によって反射された超音波エコーを電気信号に変換したエコー信号に基づいて生成される信号の周波数を解析することによって複数の周波数スペクトルを算出する周波数解析ステップと、特徴量算出部が、前記複数の周波数スペクトルの特徴量をそれぞれ算出し、前記超音波が前記観測対象を伝播する際の互いに異なる減衰特性を与える少なくとも三つの減衰率候補値の各々において、各周波数スペクトルの特徴量に対して前記超音波の減衰の影響を排除する減衰補正を行うことによって前記各周波数スペクトルの補正特徴量を算出し、前記減衰率候補値ごとに前記補正特徴量の統計的なばらつきを算出した後、該統計的なばらつきに基づく二次関数を生成し、該二次関数において前記統計的なばらつきが最小である減衰率候補値を最適な減衰率として設定する特徴量算出ステップと、特徴量画像データ生成部が、前記最適な減衰率に基づく前記補正特徴量を視覚情報と関連づけて前記エコー信号から生成された超音波画像とともに表示する特徴量画像データを生成する特徴量画像データ生成ステップと、を含むことを特徴とする。
本発明に係る超音波観測装置の作動プログラムは、観測対象に対して送信した超音波が該観測対象によって反射された超音波エコーを電気信号に変換したエコー信号に基づいて生成される信号の周波数を解析することによって複数の周波数スペクトルを算出する周波数解析手順と、特徴量算出部が、前記複数の周波数スペクトルの特徴量をそれぞれ算出し、前記超音波が前記観測対象を伝播する際の互いに異なる減衰特性を与える少なくとも三つの減衰率候補値の各々において、各周波数スペクトルの特徴量に対して前記超音波の減衰の影響を排除する減衰補正を行うことによって前記各周波数スペクトルの補正特徴量を算出し、前記減衰率候補値ごとに前記補正特徴量の統計的なばらつきを算出した後、該統計的なばらつきに基づく二次関数を生成し、該二次関数において前記統計的なばらつきが最小である減衰率候補値を最適な減衰率として設定する特徴量算出手順と、特徴量画像データ生成部が、前記最適な減衰率に基づく前記補正特徴量を視覚情報と関連づけて前記エコー信号から生成された超音波画像とともに表示する特徴量画像データを生成する特徴量画像データ生成手順と、を超音波観測装置に実行させることを特徴とする。
本発明によれば、観測対象に適合した超音波の減衰特性を簡易な計算によって求めることができるとともに、その減衰特性を利用した観測を行うことができるという効果を奏する。
以下、添付図面を参照して、本発明を実施するための形態(以下、「実施の形態」という)を説明する。
(実施の形態)
図1は、本発明の一実施の形態に係る超音波観測装置を備えた超音波観測システムの構成を示すブロック図である。同図に示す超音波観測システム1は、観測対象である被検体へ超音波を送信し、該被検体で反射された超音波を受信する超音波内視鏡2と、超音波内視鏡2が取得した超音波信号に基づいて超音波画像を生成する超音波観測装置3と、超音波観測装置3が生成した超音波画像を表示する表示装置4と、を備える。
図1は、本発明の一実施の形態に係る超音波観測装置を備えた超音波観測システムの構成を示すブロック図である。同図に示す超音波観測システム1は、観測対象である被検体へ超音波を送信し、該被検体で反射された超音波を受信する超音波内視鏡2と、超音波内視鏡2が取得した超音波信号に基づいて超音波画像を生成する超音波観測装置3と、超音波観測装置3が生成した超音波画像を表示する表示装置4と、を備える。
超音波内視鏡2は、その先端部に、超音波観測装置3から受信した電気的なパルス信号を超音波パルス(音響パルス)に変換して被検体へ照射するとともに、被検体で反射された超音波エコーを電圧変化で表現する電気的なエコー信号に変換して出力する超音波振動子21を有する。
超音波内視鏡2は、通常は撮像光学系および撮像素子を有しており、被検体の消化管(食道、胃、十二指腸、大腸)、または呼吸器(気管・気管支)へ挿入され、消化管や呼吸器、その周囲臓器(膵臓、胆嚢、胆管、胆道、リンパ節、縦隔臓器、血管等)を撮像することが可能である。また、超音波内視鏡2は、撮像時に被検体へ照射する照明光を導くライトガイドを有する。このライトガイドは、先端部が超音波内視鏡2の被検体への挿入部の先端まで達している一方、基端部が照明光を発生する光源装置に接続されている。
超音波観測装置3は、超音波内視鏡2と電気的に接続され、所定の波形および送信タイミングに基づいて高電圧パルスからなる送信信号(パルス信号)を超音波振動子21へ送信するとともに、超音波振動子21から電気的な受信信号であるエコー信号を受信してデジタルの高周波(RF:Radio Frequency)信号のデータ(以下、RFデータという)を生成、出力する送受信部31と、送受信部31から受信したRFデータをもとにデジタルのBモード用受信データを生成する信号処理部32と、送受信部31から受信したRFデータに対して所定の演算を施す演算部33と、各種画像データを生成する画像処理部34と、キーボード、マウス、タッチパネル等のユーザインタフェースを用いて実現され、各種情報の入力を受け付ける入力部35と、超音波観測システム1全体を制御する制御部36と、超音波観測装置3の動作に必要な各種情報を記憶する記憶部37と、を備える。
送受信部31は、エコー信号を増幅する信号増幅部311を有する。信号増幅部311は、受信深度が大きいエコー信号ほど高い増幅率で増幅するSTC(Sensitivity Time Control)補正を行う。図2は、信号増幅部311が行う増幅処理における受信深度と増幅率との関係を示す図である。図2に示す受信深度zは、超音波の受信開始時点からの経過時間に基づいて算出される量である。図2に示すように、増幅率β(dB)は、受信深度zが閾値zthより小さい場合、受信深度zの増加に伴ってβ0からβth(>β0)へ線型に増加する。また、増幅率β(dB)は、受信深度zが閾値zth以上である場合、一定値βthをとる。閾値zthの値は、観測対象から受信する超音波信号がほとんど減衰してしまい、ノイズが支配的になるような値である。より一般に、増幅率βは、受信深度zが閾値zthより小さい場合、受信深度zの増加に伴って単調増加すればよい。なお、図2に示す関係は、予め記憶部37に記憶されている。
送受信部31は、信号増幅部311によって増幅されたエコー信号に対してフィルタリング等の処理を施した後、A/D変換することによって時間ドメインのRFデータを生成し、信号処理部32および演算部33へ出力する。なお、超音波内視鏡2が複数の素子をアレイ状に設けた超音波振動子21を電子的に走査させる構成を有する場合、送受信部31は、複数の素子に対応したビーム合成用の多チャンネル回路を有する。
送受信部31が送信するパルス信号の周波数帯域は、超音波振動子21におけるパルス信号の超音波パルスへの電気音響変換の線型応答周波数帯域をほぼカバーする広帯域にするとよい。また、信号増幅部311におけるエコー信号の各種処理周波数帯域は、超音波振動子21による超音波エコーのエコー信号への音響電気変換の線型応答周波数帯域をほぼカバーする広帯域にするとよい。これらにより、後述する周波数スペクトルの近似処理を実行する際、精度のよい近似を行うことが可能となる。
送受信部31は、制御部36が出力する各種制御信号を超音波内視鏡2に対して送信するとともに、超音波内視鏡2から識別用のIDを含む各種情報を受信して制御部36へ送信する機能も有する。
信号処理部32は、RFデータに対してバンドパスフィルタ、包絡線検波、対数変換など公知の処理を施し、デジタルのBモード用受信データを生成する。対数変換では、RFデータを基準電圧Vcで除した量の常用対数をとってデシベル値で表現する。信号処理部32は、生成したBモード用受信データを、画像処理部34へ出力する。信号処理部32は、CPU(Central Processing Unit)や各種演算回路等を用いて実現される。
演算部33は、送受信部31が生成したRFデータに対して受信深度によらず増幅率βを一定とするよう増幅補正を行う増幅補正部331と、増幅補正を行ったRFデータに高速フーリエ変換(FFT:Fast Fourier Transform)を施して周波数解析を行うことにより周波数スペクトルを算出する周波数解析部332と、周波数スペクトルの特徴量を算出する特徴量算出部333と、を有する。演算部33は、CPU(Central Processing Unit)や各種演算回路等を用いて実現される。
図3は、増幅補正部331が行う増幅補正処理における受信深度と増幅率との関係を示す図である。図3に示すように、増幅補正部331が行う増幅処理における増幅率β(dB)は、受信深度zがゼロのとき最大値βth-β0をとり、受信深度zがゼロから閾値zthに達するまで線型に減少し、受信深度zが閾値zth以上のときゼロである。このように定められる増幅率によって増幅補正部331がデジタルRF信号を増幅補正することにより、信号処理部32におけるSTC補正の影響を相殺し、一定の増幅率βthの信号を出力することができる。なお、増幅補正部331が行う受信深度zと増幅率βの関係は、信号処理部32における受信深度と増幅率の関係に応じて異なることは勿論である。
このような増幅補正を行う理由を説明する。STC補正は、アナログ信号波形の振幅を全周波数帯域にわたって均一に、かつ、深度に対しては単調増加する増幅率で増幅させることで、アナログ信号波形の振幅から減衰の影響を排除する補正処理である。このため、エコー信号の振幅を輝度に変換して表示するBモード画像を生成する場合、かつ、一様な組織を走査した場合には、STC補正を行うことによって深度によらず輝度値が一定になる。すなわち、Bモード画像の輝度値から減衰の影響を排除する効果を得ることができる。
一方、本実施の形態のように超音波の周波数スペクトルを算出して解析した結果を利用する場合、STC補正でも超音波の伝播に伴う減衰の影響を正確に排除できるわけではない。なぜなら、一般に減衰量は周波数によって異なるが(後述する式(1)を参照)、STC補正の増幅率は距離だけに応じて変化し、周波数依存性がないためである。
上述した問題、すなわち、超音波の周波数スペクトルを算出して解析した結果を利用する場合、STC補正でも超音波の伝播に伴う減衰の影響を正確に排除できるわけではない、という問題を解決するには、Bモード画像を生成する際にSTC補正を施した受信信号を出力する一方、周波数スペクトルに基づいた画像を生成する際に、Bモード画像を生成するための送信とは異なる新たな送信を行い、STC補正を施していない受信信号を出力することが考えられる。ところがこの場合には、受信信号に基づいて生成される画像データのフレームレートが低下してしまうという問題がある。
そこで、本実施の形態では、生成される画像データのフレームレートを維持しつつ、Bモード画像用にSTC補正を施した信号に対してSTC補正の影響を排除するために、増幅補正部331によって増幅率の補正を行う。
周波数解析部332は、増幅補正部331が増幅補正した各音線のRFデータ(ラインデータ)を所定の時間間隔でサンプリングし、サンプルデータを生成する。周波数解析部332は、サンプルデータ群にFFT処理を施すことにより、RFデータ上の複数の箇所(データ位置)における周波数スペクトルを算出する。
図4は、超音波信号の1つの音線におけるデータ配列を模式的に示す図である。同図に示す音線SRkにおいて、白または黒の長方形は、1つのサンプル点におけるデータを意味している。また、音線SRkにおいて、右側に位置するデータほど、超音波振動子21から音線SRkに沿って計った場合の深い箇所からのサンプルデータである。音線SRkは、送受信部31が行うA/D変換におけるサンプリング周波数(例えば50MHz)に対応した時間間隔で離散化されている。図4では、番号kの音線SRkの8番目のデータ位置を受信深度zの方向の初期値Z(k)
0として設定した場合を示しているが、初期値の位置は任意に設定することができる。周波数解析部332による算出結果は複素数で得られ、記憶部37に格納される。
図4に示すデータ群Fj(j=1、2、・・・、K)は、FFT処理の対象となるサンプルデータ群である。一般に、FFT処理を行うためには、サンプルデータ群が2のべき乗のデータ数を有している必要がある。この意味で、サンプルデータ群Fj(j=1、2、・・・、K-1)はデータ数が16(=24)で正常なデータ群である一方、サンプルデータ群FKは、データ数が12であるため異常なデータ群である。異常なデータ群に対してFFT処理を行う際には、不足分だけゼロデータを挿入することにより、正常なサンプルデータ群を生成する処理を行う。この点については、周波数解析部332の処理を説明する際に詳述する(図9を参照)。
図5は、周波数解析部332が算出する周波数スペクトルの例を示す図である。ここでいう「周波数スペクトル」とは、サンプルデータ群をFFT処理を施すことによって得られた「ある受信深度zにおける強度の周波数分布」を意味する。また、ここでいう「強度」とは、例えばエコー信号の電圧、エコー信号の電力、超音波エコーの音圧、超音波エコーの音響エネルギー等のパラメータ、これらパラメータの振幅や時間積分値やその組み合わせのいずれかを指す。
図5では、横軸が周波数fである。また、図5では、縦軸が、強度I0を基準強度Ic(定数)で除した量の常用対数(デシベル表現)I=10log10(I0/Ic)である。図5に示す直線L10については後述する。なお、本実施の形態において、曲線および直線は、離散的な点の集合からなる。
図5に示す周波数スペクトルC1において、以後の演算に使用する周波数帯域の下限周波数fLおよび上限周波数fHは、超音波振動子21の周波数帯域、送受信部31が送信するパルス信号の周波数帯域などをもとに決定されるパラメータである。以下、図5において、下限周波数fLおよび上限周波数fHによって定まる周波数帯域を「周波数帯域U」という。
一般に、周波数スペクトルは、観測対象が生体組織である場合、超音波が走査された生体組織の性状によって異なる傾向を示す。これは、周波数スペクトルが、超音波を散乱する散乱体の大きさ、数密度、音響インピーダンス等と相関を有しているためである。ここでいう「生体組織の性状」とは、例えば悪性腫瘍(癌)、良性腫瘍、内分泌腫瘍、粘液性腫瘍、正常組織、嚢胞、脈管などのことである。
特徴量算出部333は、複数の周波数スペクトルの特徴量をそれぞれ算出し、超音波が観測対象を伝播する際の互いに異なる減衰特性を与える複数の減衰率候補値の各々において、各周波数スペクトルの特徴量(以下、補正前特徴量という)に対して超音波の減衰の影響を排除する減衰補正を行うことによって各周波数スペクトルの補正特徴量を算出し、該補正特徴量を用いて複数の減衰率候補値の中から観測対象に最適な減衰率を設定する。
特徴量算出部333は、周波数スペクトルを直線で近似することによって周波数スペクトルの補正前特徴量を算出する近似部333aと、近似部333aが算出した補正前特徴量に対して複数の減衰率候補値の各々に基づいた減衰補正を行うことによって補正特徴量を算出する減衰補正部333bと、減衰補正部333bがすべての周波数スペクトルに対して算出した補正特徴量の統計的なばらつきに基づいて複数の減衰率候補値の中から最適な減衰率を設定する最適減衰率設定部333cと、を有する。
近似部333aは、所定周波数帯域における周波数スペクトルの回帰分析を行って周波数スペクトルを一次式(回帰直線)で近似することにより、この近似した一次式を特徴付ける補正前特徴量を算出する。例えば、図5に示す周波数スペクトルC1の場合、近似部333aは、周波数帯域Uで回帰分析を行い周波数スペクトルC1を一次式で近似することによって回帰直線L10を得る。換言すると、近似部333aは、回帰直線L10の傾きa0、切片b0、および周波数帯域Uの中心周波数fM=(fL+fH)/2の回帰直線上の値であるミッドバンドフィット(Mid-band fit)c0=a0fM+b0を補正前特徴量として算出する。
3つの補正前特徴量のうち、傾きa0は、超音波の散乱体の大きさと相関を有し、一般に散乱体が大きいほど傾きが小さな値を有すると考えられる。また、切片b0は、散乱体の大きさ、音響インピーダンスの差、散乱体の数密度(濃度)等と相関を有している。具体的には、切片b0は、散乱体が大きいほど大きな値を有し、音響インピーダンスの差が大きいほど大きな値を有し、散乱体の数密度が大きいほど大きな値を有すると考えられる。ミッドバンドフィットc0は、傾きa0と切片b0から導出される間接的なパラメータであり、有効な周波数帯域内の中心におけるスペクトルの強度を与える。このため、ミッドバンドフィットc0は、散乱体の大きさ、音響インピーダンスの差、散乱体の数密度に加えて、Bモード画像の輝度とある程度の相関を有していると考えられる。なお、特徴量算出部333は、回帰分析によって二次以上の多項式で周波数スペクトルを近似するようにしてもよい。
減衰補正部333bが行う補正について説明する。一般に、超音波の減衰量A(f,z)は、超音波が受信深度0と受信深度zとの間を往復する間に生じる減衰であり、往復する前後の強度変化(デシベル表現での差)として定義される。減衰量A(f,z)は、一様な組織内では周波数に比例することが経験的に知られており、以下の式(1)で表現される。
A(f,z)=2αzf ・・・(1)
ここで、比例定数αは減衰率と呼ばれる量である。また、zは超音波の受信深度であり、fは周波数である。減衰率αの具体的な値は、観測対象が生体である場合、生体の部位に応じて定まる。減衰率αの単位は、例えばdB/cm/MHzである。本実施の形態において、減衰補正部333bは、最も適合する減衰率(最適な減衰率)をそれぞれ設定するために、複数の減衰率候補値に対してそれぞれ減衰補正を行う。複数の減衰率候補値の詳細については、図8を参照して後述する。
A(f,z)=2αzf ・・・(1)
ここで、比例定数αは減衰率と呼ばれる量である。また、zは超音波の受信深度であり、fは周波数である。減衰率αの具体的な値は、観測対象が生体である場合、生体の部位に応じて定まる。減衰率αの単位は、例えばdB/cm/MHzである。本実施の形態において、減衰補正部333bは、最も適合する減衰率(最適な減衰率)をそれぞれ設定するために、複数の減衰率候補値に対してそれぞれ減衰補正を行う。複数の減衰率候補値の詳細については、図8を参照して後述する。
減衰補正部333bは、近似部333aが抽出した補正前特徴量(傾きa0、切片b0、ミッドバンドフィットc0)に対し、以下に示す式(2)~(4)にしたがって減衰補正を行うことにより、補正特徴量a、b、cを算出する。
a=a0+2αz ・・・(2)
b=b0 ・・・(3)
c=c0+A(fM,z)=c0+2αzfM(=afM+b)・・・(4)
式(2)、(4)からも明らかなように、減衰補正部333bは、超音波の受信深度zが大きいほど、補正量が大きい補正を行う。また、式(3)によれば、切片に関する補正は恒等変換である。これは、切片が周波数0(Hz)に対応する周波数成分であって減衰の影響を受けないためである。
a=a0+2αz ・・・(2)
b=b0 ・・・(3)
c=c0+A(fM,z)=c0+2αzfM(=afM+b)・・・(4)
式(2)、(4)からも明らかなように、減衰補正部333bは、超音波の受信深度zが大きいほど、補正量が大きい補正を行う。また、式(3)によれば、切片に関する補正は恒等変換である。これは、切片が周波数0(Hz)に対応する周波数成分であって減衰の影響を受けないためである。
図6は、減衰補正部333bが補正した補正特徴量a、b、cをパラメータとして有する直線を示す図である。直線L1の式は、
I=af+b=(a0+2αz)f+b0 ・・・(5)
で表される。この式(5)からも明らかなように、直線L1は、減衰補正前の直線L10と比較して、傾きが大きく(a>a0)、かつ切片が同じ(b=b0)である。
I=af+b=(a0+2αz)f+b0 ・・・(5)
で表される。この式(5)からも明らかなように、直線L1は、減衰補正前の直線L10と比較して、傾きが大きく(a>a0)、かつ切片が同じ(b=b0)である。
最適減衰率設定部333cは、減衰補正部333bがすべての周波数スペクトルに対して減衰率候補値ごとに算出した補正特徴量の統計的なばらつきが最小である減衰率候補値を最適な減衰率として設定する。本実施の形態では、統計的なばらつきを示す量として分散を適用する。この場合、最適減衰率設定部333cは、分散が最小となる減衰率候補値を最適な減衰率として設定する。上述した3つの補正特徴量a、b、cのうち独立なのは2つである。加えて、補正特徴量bは減衰率に依存しない。したがって、補正特徴量a、cに対して最適な減衰率を設定する場合、最適減衰率設定部333cは、補正特徴量aおよびcのいずれか一方の分散を算出すればよい。
ただし、最適減衰率設定部333cが最適な減衰率を設定する際に用いる補正特徴量は、特徴量画像データ生成部342が特徴量画像データを生成する際に用いる補正特徴量と同じ種類であることが好ましい。すなわち、特徴量画像データ生成部342が補正特徴量として傾きを用いて特徴量画像データを生成する場合は補正特徴量aの分散を適用し、特徴量画像データ生成部342が補正特徴量としてミッドバンドフィットを用いて特徴量画像データを生成する場合は補正特徴量cの分散を適用するのがより好ましい。これは、減衰量A(f,z)を与える式(1)があくまで理想的なものに過ぎず、現実には以下の式(6)の方が適切であることによる。
A(f,z)=2αzf+2α1z ・・・(6)
式(6)の右辺第2項のα1は、超音波の受信深度zに比例して信号強度が変化する大きさを表す係数であり、観測対象の組織が不均一であることや、ビーム合成時のチャンネル数の変更などに起因して発生する信号強度の変化を表す係数である。式(6)の右辺第2項が存在するため、補正特徴量としてミッドバンドフィットを用いて特徴量画像データを生成する場合は、補正特徴量cの分散を用いて最適な減衰率を設定した方が正確に減衰を補正することができる(式(4)を参照)。一方、周波数fに比例する係数である傾きを用いて特徴量画像データを生成する場合は、補正特徴量aの分散を用いて最適な減衰率を設定した方が、右辺第2項の影響を排除して正確に減衰を補正することができる。例えば、減衰率αの単位がdB/cm/MHzである場合、係数α1の単位はdB/cmである。
ここで、統計的なばらつきに基づいて最適な減衰率を設定することができる理由を説明する。観測対象に最適な減衰率を適用した場合、観測対象と超音波振動子21との距離に関わらず、特徴量は観測対象に固有の値へ収束し、統計的なばらつきが小さくなると考えられる。その一方で、観測対象に適合しない減衰率候補値を最適な減衰率とした場合、減衰補正が過剰であるかまたは不足するため、超音波振動子21との距離に応じて特徴量にずれが生じ、特徴量の統計的なばらつきが大きくなると考えられる。したがって、統計的なばらつきが最も小さい減衰率候補値が、観察対象にとって最適な減衰率であるということができる。
図7は、同じ観測対象に対して2つの異なる減衰率候補値に基づいてそれぞれ減衰補正された補正特徴量の分布例を模式的に示す図である。図7では、横軸を補正特徴量とし、縦軸を頻度としている。図7に示す2つの分布曲線N1、N2は、頻度の総和が同じである。図7に示す場合、分布曲線N1は、分布曲線N2と比較して特徴量の統計的なばらつきが小さく(分散が小さく)、山が急峻な形状をなす。したがって、最適減衰率設定部333cは、この2つの分布曲線N1、N2に対応する2つの減衰率候補値から最適な減衰率を設定する場合、分布曲線N1に対応する減衰率候補値を最適な減衰率として設定する。
一般に、減衰率候補値と、減衰率候補値ごとに算出した補正特徴量の統計的なばらつきである分散とは、フレームごとに一つの二次関数が決まることが知られている。本実施の形態では、最適減衰率設定部333cは、複数(本実施の形態では3つ)の減衰率候補値に基づきそれぞれ減衰補正された補正特徴量cの分散をもとに生成された二次関数において最小となる値(極値)を求め、該極値に応じた減衰候補値を最適な減衰率として設定する。これは、観測対象が一様と仮定した場合、減衰率の真値と、ばらつきを最小とする減衰率αとが等しいという性質を利用して、極値に基づき最適な減衰率を設定するものである。なお、減衰率候補値は、四つ以上設定されるものであってもよいが、演算処理による負荷軽減の観点から、三つであることが好ましい。
本実施の形態では、三つの減衰候補値(減衰率候補値α1,α2,α3)が予め記憶部37に記憶され、最適減衰率設定部333cは、この三つの減衰率候補値を用いて最適な減衰率の設定を行う。減衰率候補値α1,α2,α3は、0.0以上の値であって、観測対象が生体組織である場合、生体組織の減衰率は一般に0.6付近であるため、三つの減衰候補値のうち最も小さい減衰率候補値が0.6以下であり、かつ最も大きい値が0.6以上であることが好ましい。
図8は、減衰率候補値α1,α2,α3と、この減衰率候補値α1,α2,α3に基づきそれぞれ減衰補正された補正特徴量の分散S(α1),S(α2),S(α3)をもとに生成された二次関数Qとの関係を模式的に示す図である。最適減衰率設定部333cは、予め設定されている減衰率候補値α1,α2,α3に基づきそれぞれ減衰補正された補正特徴量cの分散S(α1),S(α2),S(α3)を求め、得られた分散S(α1),S(α2),S(α3)を通過する二次関数Qを生成する。この際に得られる二次関数は、下に凸の関数である。最適減衰率設定部333cは、生成した二次関数Qの極値を求め、該極値に応じた減衰率候補値αSを最適な減衰率として設定する。
ここで、同一フレームのRFデータにおいて、複数の減衰候補値に基づく分散が、同一の二次関数上に存在し、かつこの二次関数が下に凸となる理由について説明する。以下の説明では、補正特徴量c(ミッドバンドフィット)の分散を例に説明する。補正特徴量cの分散をVc(α)とすると、上記式(4)より、下式(7)が導出される。式(7)において、iはサンプル点を識別する添え字であり、各補正特徴量ciとこれらの補正特徴量の相加平均との差の二乗の和を求めることで、分散Vc(α)を算出する。

上記式(7)より、下式(8)が導出される。なお、下式(8)では、往復距離をL(L=2z)としている。
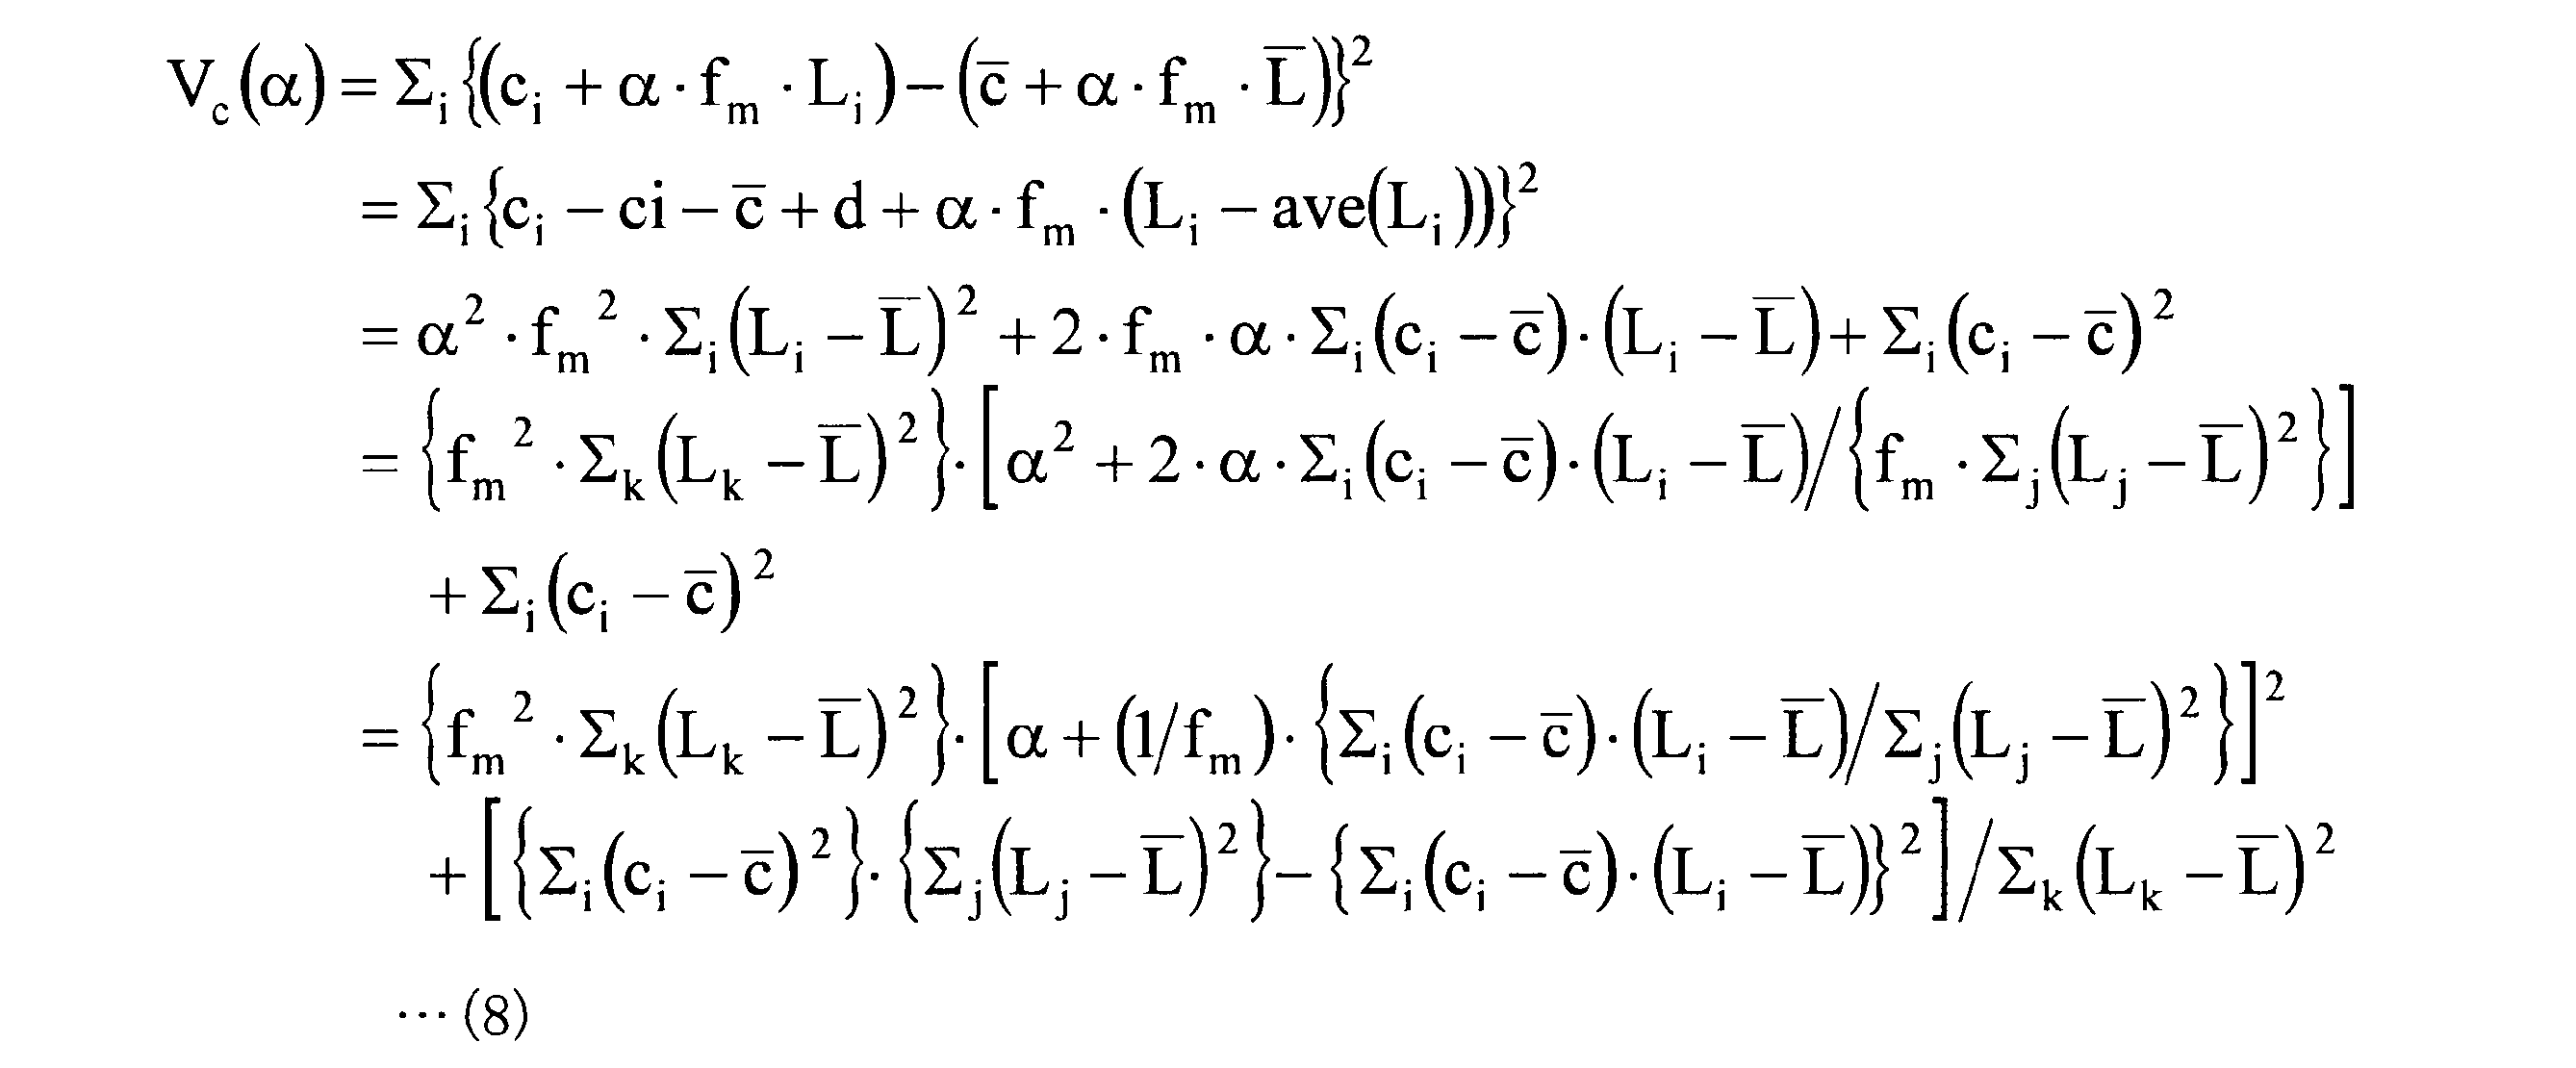
式(8)において、Vc(α)におけるα2の係数は、正の値となる。したがって、Vc(α)は、下に凸の二次関数となる。
また、補正特徴量aの分散についても、補正特徴量aの分散をVa(α)とすると、上記式(2)より、下式(9)が導出される。

上記式(9)より、上述した分散Vc(α)と同様に計算すると、下式(10)が導出される。
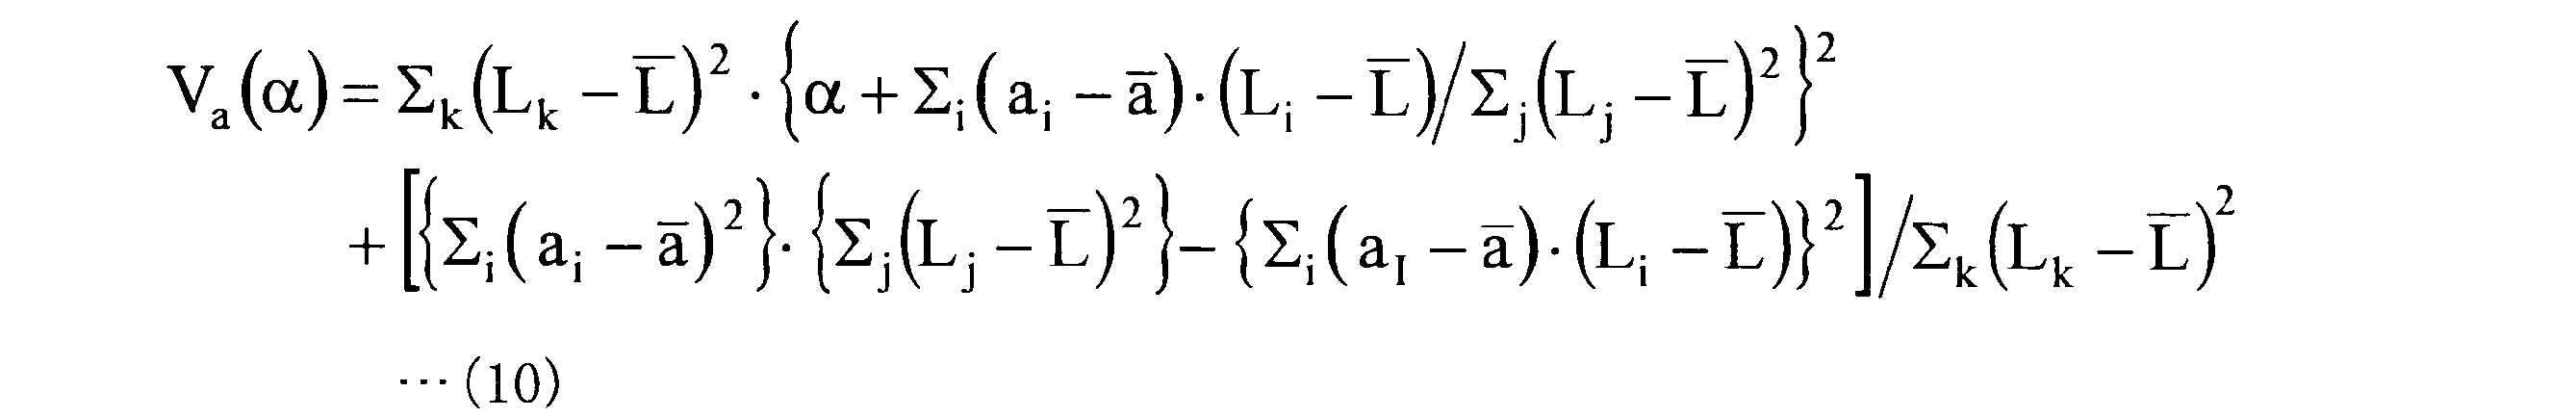
式(10)において、Va(α)におけるα2の係数は、正の値となる。したがって、Va(α)についても、下に凸の二次関数となる。
画像処理部34は、エコー信号の振幅を輝度に変換して表示する超音波画像であるBモード画像データを生成するBモード画像データ生成部341と、最適減衰率設定部333cが設定した最適な減衰率に基づく特徴量を視覚情報と関連づけてBモード画像とともに表示する特徴量画像データを生成する特徴量画像データ生成部342と、を有する。
Bモード画像データ生成部341は、信号処理部32から受信したBモード用受信データに対してゲイン処理、コントラスト処理等の公知の技術を用いた信号処理を行うとともに、表示装置4における画像の表示レンジに応じて定まるデータステップ幅に応じたデータの間引き等を行うことによってBモード画像データを生成する。Bモード画像は、色空間としてRGB表色系を採用した場合の変数であるR(赤)、G(緑)、B(青)の値を一致させたグレースケール画像である。
Bモード画像データ生成部341は、信号処理部32からのBモード用受信データに走査範囲を空間的に正しく表現できるよう並べ直す座標変換を施した後、Bモード用受信データ間の補間処理を施すことによってBモード用受信データ間の空隙を埋め、Bモード画像データを生成する。Bモード画像データ生成部341は、生成したBモード画像データを特徴量画像データ生成部342へ出力する。
特徴量画像データ生成部342は、特徴量算出部333が算出した特徴量に関連する視覚情報をBモード画像データにおける画像の各画素に対して重畳することによって特徴量画像データを生成する。特徴量画像データ生成部342は、例えば図4に示す1つのサンプルデータ群Fj(j=1、2、・・・、K)のデータ量に対応する画素領域に対し、そのサンプルデータ群Fjから算出される周波数スペクトルの特徴量に対応する視覚情報を割り当てる。特徴量画像データ生成部342は、例えば上述した傾き、切片、ミッドバンドフィットのいずれか一つに視覚情報としての色相を対応付けることによって特徴量画像を生成する。なお、特徴量画像データ生成部342が、傾き、切片、ミッドバンドフィットから選択される2つの特徴量の一方に色相を対応付けるとともに、他方に明暗を対応付けることによって特徴量画像データを生成するようにしてもよい。特徴量に関連する視覚情報としては、例えば色相、彩度、明度、輝度値、R(赤)、G(緑)、B(青)などの所定の表色系を構成する色空間の変数を挙げることができる。
制御部36は、演算および制御機能を有するCPU(Central Processing Unit)や各種演算回路等を用いて実現される。制御部36は、記憶部37が記憶、格納する情報を記憶部37から読み出し、超音波観測装置3の作動方法に関連した各種演算処理を実行することによって超音波観測装置3を統括して制御する。なお、制御部36を信号処理部32および演算部33と共通のCPU等を用いて構成することも可能である。
記憶部37は、減衰率候補値α1,α2,α3、減衰補正部333bが減衰率候補値に応じて周波数スペクトルごとに算出した複数の特徴量、および該複数の特徴量の統計的なばらつきを与える分散を減衰率候補値と対応づけて記憶する特徴量情報記憶部371を有する。
記憶部37は、上記以外にも、例えば増幅処理に必要な情報(図2に示す増幅率と受信深度との関係)、増幅補正処理に必要な情報(図3に示す増幅率と受信深度との関係)、減衰補正処理に必要な情報(式(1)参照)、周波数解析処理に必要な窓関数(Hamming、Hanning、Blackman等)の情報等を記憶する。
また、記憶部37は、超音波観測装置3の作動方法を実行するための作動プログラムを含む各種プログラムを記憶する。作動プログラムは、ハードディスク、フラッシュメモリ、CD-ROM、DVD-ROM、フレキシブルディスク等のコンピュータ読み取り可能な記録媒体に記録して広く流通させることも可能である。なお、上述した各種プログラムは、通信ネットワークを介してダウンロードすることによって取得することも可能である。ここでいう通信ネットワークは、例えば既存の公衆回線網、LAN(Local Area Network)、WAN(Wide Area Network)などによって実現されるものであり、有線、無線を問わない。
以上の構成を有する記憶部37は、各種プログラム等が予めインストールされたROM(Read Only Memory)、および各処理の演算パラメータやデータ等を記憶するRAM(Random Access Memory)等を用いて実現される。
本実施の形態において、減衰補正部333bでは、補正特徴量のダイナミックレンジが、画像処理部34が行うゲイン処理、コントラスト処理等で設定可能な範囲に応じて設定されていることが好ましい。具体的には、減衰率候補値α1,α2,α3は、特徴量画像として表示する特徴量が、上述したゲイン処理、コントラスト処理等で設定可能な範囲に応じた表示に係るダイナミックレンジ内となるように、0.0~2.0の間で設定される三つの値である。例えば、減衰候補値が2.0より大きいと、算出した補正特徴量が、ダイナミックレンジを超えてしまい、補正特徴量として保持することができない場合が生じる。これにより、統計的なばらつきの値が異なるものとなってしまい、例えば分散に基づき生成される関数が二次関数とならず、減衰率を最適な値に設定することができなくなる。すなわち、本実施の形態に係る減衰率候補値α1,α2,α3は、0.0~2.0の範囲において設定される値であって、三つの減衰候補値のうち最も小さい減衰率候補値が0.6以下であり、かつ最も大きい値が0.6以上であることが好ましい。特に、観測対象が生体組織であって、固有小数点方式を用いる場合、クリップによる計算精度の低下を抑制するため、三つの減衰候補値が0.6付近の値にそれぞれ設定されることがさらに好ましい。
図9は、以上の構成を有する超音波観測装置3が行う処理の概要を示すフローチャートである。まず、超音波観測装置3は、超音波内視鏡2から超音波振動子21による観測対象の測定結果としてのエコー信号を受信する(ステップS1)。
超音波振動子21からエコー信号を受信した信号増幅部311は、そのエコー信号の増幅を行う(ステップS2)。ここで、信号増幅部311は、例えば図2に示す増幅率と受信深度との関係に基づいてエコー信号の増幅(STC補正)を行う。
続いて、Bモード画像データ生成部341は、信号増幅部311が増幅したエコー信号を用いてBモード画像データを生成して、表示装置4へ出力する(ステップS3)。Bモード画像データを受信した表示装置4は、そのBモード画像データに対応するBモード画像を表示する(ステップS4)。
増幅補正部331は、送受信部31から出力された信号に対して受信深度によらず増幅率が一定となる増幅補正を行う(ステップS5)。ここで、増幅補正部331は、例えば図3に示す増幅率と受信深度との関係が成立するように増幅補正を行う。
増幅補正後、周波数解析部332は、FFT演算による周波数解析を行うことによって特徴量画像データを生成する領域である関心領域内の全てのサンプルデータ群に対する周波数スペクトルを算出する(ステップS6:周波数解析ステップ)。図10は、ステップS6において周波数解析部332が実行する処理の概要を示すフローチャートである。以下、図10に示すフローチャートを参照して、周波数解析処理を詳細に説明する。
まず、周波数解析部332は、解析対象の音線を識別するカウンタkをk0とする(ステップS21)。
続いて、周波数解析部332は、FFT演算用に取得する一連のデータ群(サンプルデータ群)を代表するデータ位置(受信深度に相当)Z(k)の初期値Z(k)
0を設定する(ステップS22)。例えば、図4では、上述したように、音線SRkの8番目のデータ位置を初期値Z(k)
0として設定した場合を示している。
その後、周波数解析部332は、サンプルデータ群を取得し(ステップS23)、取得したサンプルデータ群に対し、記憶部37が記憶する窓関数を作用させる(ステップS24)。このようにサンプルデータ群に対して窓関数を作用させることにより、サンプルデータ群が境界で不連続になることを回避し、アーチファクトが発生するのを防止することができる。
続いて、周波数解析部332は、データ位置Z(k)のサンプルデータ群が正常なデータ群であるか否かを判定する(ステップS25)。図4を参照した際に説明したように、サンプルデータ群は、2のべき乗のデータ数を有している必要がある。以下、正常なサンプルデータ群のデータ数を2n(nは正の整数)とする。本実施の形態では、データ位置Z(k)が、できるだけZ(k)が属するサンプルデータ群の中心になるよう設定される。具体的には、サンプルデータ群のデータ数は2nであるので、Z(k)はそのサンプルデータ群の中心に近い2n/2(=2n-1)番目の位置に設定される。この場合、サンプルデータ群が正常であるとは、データ位置Z(k)の前方に2n-1-1(=Nとする)個のデータがあり、データ位置Z(k)の後方に2n-1(=Mとする)個のデータがあることを意味する。図4に示す場合、サンプルデータ群Fj(j=1、2、・・・、K-1)はともに正常である。なお、図4ではn=4(N=7,M=8)の場合を例示している。
ステップS25における判定の結果、データ位置Z(k)のサンプルデータ群が正常である場合(ステップS25:Yes)、周波数解析部332は、後述するステップS27へ移行する。
ステップS25における判定の結果、データ位置Z(k)のサンプルデータ群が正常でない場合(ステップS25:No)、周波数解析部332は、不足分だけゼロデータを挿入することによって正常なサンプルデータ群を生成する(ステップS26)。ステップS25において正常でないと判定されたサンプルデータ群(例えば図4のサンプルデータ群FK)は、ゼロデータを追加する前に窓関数が作用されている。このため、サンプルデータ群にゼロデータを挿入してもデータの不連続は生じない。ステップS26の後、周波数解析部332は、後述するステップS27へ移行する。
ステップS27において、周波数解析部332は、サンプルデータ群を用いてFFT演算を行うことにより、振幅の周波数分布である周波数スペクトルを得る(ステップS27)。図5に示す周波数スペクトルC1は、ステップS27の結果として得られる周波数スペクトルの一例である。
続いて、周波数解析部332は、データ位置Z(k)をステップ幅Dで変化させる(ステップS28)。ステップ幅Dは、記憶部37が予め記憶しているものとする。図4では、D=15の場合を例示している。ステップ幅Dは、Bモード画像データ生成部341がBモード画像データを生成する際に利用するデータステップ幅と一致させることが望ましいが、周波数解析部332における演算量を削減したい場合には、ステップ幅Dとしてデータステップ幅より大きい値を設定してもよい。
その後、周波数解析部332は、データ位置Z(k)が音線SRkにおける最大値Z(k)
maxより大きいか否かを判定する(ステップS29)。データ位置Z(k)が最大値Z(k)
maxより大きい場合(ステップS29:Yes)、周波数解析部332はカウンタkを1増加させる(ステップS30)。これは、処理をとなりの音線へ移すことを意味する。一方、データ位置Z(k)が最大値Z(k)
max以下である場合(ステップS29:No)、周波数解析部332はステップS23へ戻る。このようにして、周波数解析部332は、音線SRkに対して、[(Z(k)
max-Z(k)
0+1)/D+1]個のサンプルデータ群に対するFFT演算を行う。ここで、[X]は、Xを超えない最大の整数を表す。
ステップS30の後、周波数解析部332は、カウンタkが最大値kmaxより大きいか否かを判定する(ステップS31)。カウンタkが最大値kmaxより大きい場合(ステップS31:Yes)、周波数解析部332は一連の周波数解析処理を終了する。一方、カウンタkが最大値kmax以下である場合(ステップS31:No)、周波数解析部332はステップS22に戻る。この最大値kmaxは、術者等のユーザが入力部35を通じて任意に指示入力した値、もしくは、記憶部37にあらかじめ設定された値とする。
このようにして、周波数解析部332は、解析対象領域内の(kmax-k0+1)本の音線の各々について複数回のFFT演算を行う。FFT演算の結果は、受信深度および受信方向とともに記憶部37に格納される。
なお、以上の説明では、設定された関心領域内においてのみ周波数解析処理を行うものとしたが、周波数解析部332が超音波信号を受信したすべての領域に対して周波数解析処理を行うようにすることも可能である。
以上説明したステップS6の周波数解析処理に続いて、特徴量算出部333は、複数の周波数スペクトルの補正前特徴量をそれぞれ算出し、超音波が観測対象を伝播する際の互いに異なる減衰特性を与える複数の減衰率候補値の各々において、各周波数スペクトルの補正前特徴量に対して超音波の減衰の影響を排除する減衰補正を行うことによって各周波数スペクトルの補正特徴量を算出し、該補正特徴量を用いて各減衰率候補値ごとの分散を算出し、減衰率候補値と分散との関係を示す二次関数を生成して極値を求めることで観測対象に最適な減衰率を設定する(ステップS7~S12:特徴量算出ステップ)。以下、ステップS7~S12の処理を詳細に説明する。
ステップS7において、近似部333aは、周波数解析部332が算出した複数の周波数スペクトルをそれぞれ回帰分析することにより、減衰率設定対象の分割領域の各周波数スペクトルに対応する補正前特徴量を算出する(ステップS7)。具体的には、近似部333aは、各周波数スペクトルを回帰分析することによって一次式で近似し、補正前特徴量として傾きa0、切片b0、ミッドバンドフィットc0を算出する。例えば、図5に示す直線L10は、近似部333aが周波数帯域Uの周波数スペクトルC1に対し回帰分析によって近似した回帰直線である。
この後、最適減衰率設定部333cは、後述する減衰補正を行う際に適用する減衰率候補値の値を所定の設定値α1,α2,α3に設定する。この設定値α1,α2,α3の値は、予め特徴量情報記憶部371が記憶しておき、最適減衰率設定部333cが特徴量情報記憶部371を参照するようにすればよい。
続いて、減衰補正部333bは、近似部333aが各周波数スペクトルに対して近似した補正前特徴量に対し、設定値α1,α2,α3を減衰率候補値として減衰補正を行うことにより、補正特徴量をそれぞれ算出し、設定値α1,α2,α3とともに特徴量情報記憶部371に格納する(ステップS8)。図6に示す直線L1は、減衰補正部333bが減衰補正処理を行うことによって得られる直線の例である。
ステップS8において、減衰補正部333bは、上述した式(2)、(4)における受信深度zに、超音波信号の音線のデータ配列を用いて得られるデータ位置Z=(fsp/2vs)Dnを代入することによって補正特徴量を算出する。ここで、fspはデータのサンプリング周波数、vsは音速、Dはデータステップ幅、nは処理対象のサンプルデータ群のデータ位置までの音線の1番目のデータからのデータステップ数である。例えば、データのサンプリング周波数fspを50MHzとし、音速vsを1530m/secとし、図6に示すデータ配列を採用してステップ幅Dを15とすると、Z=0.2295n(mm)となる。
最適減衰率設定部333cは、減衰補正部333bが各周波数スペクトルに対して減衰補正することによって得られた複数の補正特徴量のうち代表となる補正特徴量の分散を算出し、設定値α1,α2,α3と対応づけて特徴量情報記憶部371へ格納する(ステップS9)。補正特徴量が傾きa、ミッドバンドフィットcである場合、上述した図8のように、最適減衰率設定部333cは、例えば、補正特徴量cの分散を算出する。ステップS19において、最適減衰率設定部333cは、特徴量画像データ生成部342が、傾きを用いて特徴量画像データを生成する場合は補正特徴量aの分散を適用し、ミッドバンドフィットを用いて特徴量画像データを生成する場合は補正特徴量cの分散を適用するのが好ましい。
この後、最適減衰率設定部333cは、設定値α1,α2,α3に基づきそれぞれ減衰補正された補正特徴量cの分散をもとに二次関数を生成する(ステップS10)。最適減衰率設定部333cは、生成された二次関数の極値を求め(ステップS11)、該極値に応じた減衰率候補値を最適な減衰率として設定する(ステップS12)。
最適減衰率設定部333cは、図8に示したように、減衰率候補値αSが0.65(dB/cm/MHz)のときに分散が極値S(α)minをとる場合、α=0.65(dB/cm/MHz)を最適な減衰率として設定する。
特徴量画像データ生成部342は、Bモード画像データ生成部341が生成したBモード画像データにおける各画素に対し、ステップS12で特定された最適な減衰率に基づく補正特徴量に関連づけた視覚情報(例えば色相)を重畳するとともに、最適な減衰率の情報を加えることによって特徴量画像データを生成する(ステップS13:特徴量画像データ生成ステップ)。
この後、表示装置4は、制御部36の制御のもと、特徴量画像データ生成部342が生成した特徴量画像データに対応する特徴量画像を表示する(ステップS14)。図11は、表示装置4における特徴量画像の表示例を模式的に示す図である。同図に示す特徴量画像201は、Bモード画像に特徴量に関する視覚情報が重畳された画像を表示する重畳画像表示部202と、観測対象の識別情報および最適な減衰率として設定された減衰率候補値の情報を表示する情報表示部203とを有する。なお、情報表示部203に、特徴量の情報、近似式の情報、設定値α1,α2,α3に基づきそれぞれ減衰補正された補正特徴量の分散をもとに生成された二次関数の情報、ゲインやコントラスト等の画像情報等をさらに表示するようにしてもよい。また、特徴量画像に対応するBモード画像を特徴量画像と並べて表示してもよい。また、減衰率候補値の情報を表示するか否かの指示信号を入力部35が受け付け可能な構成としてもよい。
以上説明してきた一連の処理(ステップS1~S14)において、ステップS4の処理とステップS5~S12の処理とを並行して行うようにしてもよい。
以上説明した本発明の一実施の形態によれば、予め設定された三つの設定値(設定値α1,α2,α3)を減衰率候補値として減衰補正を行うことにより、補正特徴量をそれぞれ算出し、補正特徴量の分散をもとに生成した二次関数の極値を求め、該極値に応じた減衰候補値を最適な減衰率として設定するようにしたので、観測対象に適合した超音波の減衰特性を簡易な計算によって高速に求めることができるとともに、その減衰特性を利用した観測を行うことができる。
また、本実施の形態によれば、各周波数スペクトルを減衰補正した補正特徴量の統計的なばらつきに基づいて最適な部分減衰率を設定するため、複数の減衰モデルとフィッティングを行う従来技術と比較して、計算量を削減することができる。
また、本実施の形態によれば、観測対象に適合する減衰率が未知の場合であっても、最適な減衰率を設定することができる。
また、本実施の形態によれば、減衰率候補値としての設定値α1,α2,α3を、0.0以上の値であって、三つの減衰候補値のうち最も小さい減衰率が0.6以下であり、かつ最も大きい値が0.6以上とすることによって、一般に0.6付近の減衰率である生体組織を観測対象とした際の最適な減衰率の算出精度を向上することができる。
また、本実施の形態によれば、二次関数の極値に応じた減衰率を最適な減衰率として設定するようにしたので、予め設定されている減衰率候補値よりも桁数の大きな数値を減衰率として設定することが可能となり、最適な減衰率の算出精度を向上することができる。
また、本実施の形態によれば、減衰率候補値α1,α2,α3を、特徴量画像として表示する特徴量がダイナミックレンジ内となるように、0.0~2.0の間で設定することで、生体組織を観測対象とした際の最適な減衰率の算出精度を向上することができる。
また、本実施の形態によれば、情報表示部203に、設定値α1,α2,α3に基づきそれぞれ減衰補正された補正特徴量の分散をもとに生成された二次関数の情報をさらに表示させることによって、二次関数の生成において生じたエラーなどをユーザが確認し、把握することができる。
(実施の形態の変形例)
次に、本発明の実施の形態の変形例について説明する。本変形例では、最適減衰率設定部333cが、特徴量画像として表示する際のダイナミックレンジよりも広いダイナミックレンジで最適な減衰率を設定する。
次に、本発明の実施の形態の変形例について説明する。本変形例では、最適減衰率設定部333cが、特徴量画像として表示する際のダイナミックレンジよりも広いダイナミックレンジで最適な減衰率を設定する。
具体的には、特徴量画像データ生成部342が生成する画像の表示ダイナミックレンジを70dBとすると、特徴量算出部333は、このダイナミックレンジ(70dB)よりも大きなダイナミックレンジ(例えば100dB)で減衰演算処理を行なう。例えば、特徴量画像データ生成部342が、8bitの固定小数点方式を用いるのに対し、特徴量算出部333は、32bitの浮動小数点方式を用いて特徴量の算出から最適な減衰率の設定までを含む減衰演算処理を行なう。
本変形例によれば、固定小数点方式を用いた減衰演算処理と比して、演算精度を向上させることができる。補正前特徴量の演算から分散に基づく二次関数の生成を一層高精度に行うことで、最適な減衰率を高精度に算出することができる。
ここまで、本発明を実施するための形態を説明してきたが、本発明は上述した実施の形態によってのみ限定されるべきものではない。例えば、最適減衰率設定部333cは、超音波画像の全てのフレームで最適な減衰率に相当する最適減衰率相当値をそれぞれ算出し、最新のフレームにおける最適減衰率相当値を含む所定数の最適減衰率相当値の平均値、中央値または最頻値を最適な減衰率として設定してもよい。この場合には、各フレームで最適な減衰率を設定する場合と比較して、最適な減衰率の変化が少なくなってその値を安定させることができる。
また、最適減衰率設定部333cは、超音波画像の所定のフレーム間隔で最適な減衰率を設定するようにしてもよい。これにより、計算量を大幅に削減することができる。この場合には、次に最適な減衰率を設定するまでの間、最後に設定した最適な減衰率の値を使用すればよい。
また、統計的なばらつきを算出する対象領域を音線ごととしてもよいし、受信深度が所定値以上の領域としてもよい。これらの領域の設定を入力部35が受け付け可能な構成としてもよい。
また、入力部35が減衰率候補値の設定値α1,α2,α3の設定変更の入力を受け付け可能な構成としてもよい。
また、統計的なばらつきを与える量として、例えば標準偏差、母集団における特徴量の最大値と最小値の差、特徴量の分布の半値幅のいずれかを適用することも可能である。なお、統計的なばらつきを与える量として分散の逆数を適用する場合も考えられるが、この場合には、その二次関数が上に凸となり、その極値に応じた減衰率候補値が最適な減衰率となることはいうまでもない。
また、最適減衰率設定部333cが、複数種類の補正特徴量の統計的なばらつきをそれぞれ算出し、統計的なばらつきに基づき生成された二次関数の極値に応じた減衰率候補値を最適な部分減衰率として設定することも可能である。
また、超音波プローブとして、光学系のない細径の超音波ミニチュアプローブを適用してもよい。超音波ミニチュアプローブは、通常、胆道、胆管、膵管、気管、気管支、尿道、尿管へ挿入され、その周囲臓器(膵臓、肺、前立腺、膀胱、リンパ節等)を観察する際に用いられる。
また、超音波プローブとして、被検体の体表から超音波を照射する体外式超音波プローブを適用してもよい。体外式超音波プローブは、通常、腹部臓器(肝臓、胆嚢、膀胱)、乳房(特に乳腺)、甲状腺を観察する際に用いられる。
また、超音波振動子は、リニア振動子でもラジアル振動子でもコンベックス振動子でも構わない。超音波振動子がリニア振動子である場合、その走査領域は矩形(長方形、正方形)をなし、超音波振動子がラジアル振動子やコンベックス振動子である場合、その走査領域は扇形や円環状をなす。また、超音波内視鏡は、超音波振動子をメカ的に走査させるものであってもよいし、超音波振動子として複数の素子をアレイ状に設け、送受信にかかわる素子を電子的に切り替えたり、各素子の送受信に遅延をかけたりすることで、電子的に走査させるものであってもよい。
このように、本発明は、請求の範囲に記載した技術的思想を逸脱しない範囲内において、様々な実施の形態を含みうるものである。
以上のように、本発明にかかる超音波観測装置、超音波観測装置の作動方法および超音波観測装置の作動プログラムは、観測対象に適合した超音波の減衰特性を簡易な計算によって求めるとともに、その減衰特性を利用した観測を行うのに有用である。
1 超音波観測システム
2 超音波内視鏡
3 超音波観測装置
4 表示装置
21 超音波振動子
31 送受信部
32 信号処理部
33 演算部
34 画像処理部
35 入力部
36 制御部
37 記憶部
201 特徴量画像
202 重畳画像表示部
203 情報表示部
331 増幅補正部
332 周波数解析部
333 特徴量算出部
333a 近似部
333b 減衰補正部
333c 最適減衰率設定部
341 Bモード画像データ生成部
342 特徴量画像データ生成部
371 特徴量情報記憶部
C1 周波数スペクトル
2 超音波内視鏡
3 超音波観測装置
4 表示装置
21 超音波振動子
31 送受信部
32 信号処理部
33 演算部
34 画像処理部
35 入力部
36 制御部
37 記憶部
201 特徴量画像
202 重畳画像表示部
203 情報表示部
331 増幅補正部
332 周波数解析部
333 特徴量算出部
333a 近似部
333b 減衰補正部
333c 最適減衰率設定部
341 Bモード画像データ生成部
342 特徴量画像データ生成部
371 特徴量情報記憶部
C1 周波数スペクトル
Claims (13)
- 観測対象に対して送信した超音波が該観測対象によって反射された超音波エコーを電気信号に変換したエコー信号に基づいて生成される信号の周波数を解析することによって複数の周波数スペクトルを算出する周波数解析部と、
前記複数の周波数スペクトルの特徴量をそれぞれ算出し、前記超音波が前記観測対象を伝播する際の互いに異なる減衰特性を与える少なくとも三つの減衰率候補値の各々において、各周波数スペクトルの特徴量に対して前記超音波の減衰の影響を排除する減衰補正を行うことによって前記各周波数スペクトルの補正特徴量を算出し、前記減衰率候補値ごとに前記補正特徴量の統計的なばらつきを算出した後、該統計的なばらつきに基づく二次関数を生成し、該二次関数において前記統計的なばらつきが最小である減衰率候補値を最適な減衰率として設定する特徴量算出部と、
前記最適な減衰率に基づく前記補正特徴量を視覚情報と関連づけて前記エコー信号から生成された超音波画像とともに表示する特徴量画像データを生成する特徴量画像データ生成部と、
を備えたことを特徴とする超音波観測装置。 - 前記特徴量算出部は、前記特徴量画像データ生成部が用いるデータのダイナミックレンジよりも広いダイナミックレンジのデータを用いて前記最適な減衰率の設定を行うことを特徴とする請求項1に記載の超音波観測装置。
- 前記特徴量算出部は、
前記各周波数スペクトルをn次式(nは正の整数)で近似する処理を行うことによって前記特徴量を算出することを特徴とする請求項1または2に記載の超音波観測装置。 - 前記特徴量算出部は、
前記周波数スペクトルにおける所定の周波数帯域を一次式で近似し、前記一次式の切片および傾き、ならびに前記周波数帯域の中間周波数における前記一次式の値であるミッドバンドフィットのうち、前記傾きおよび前記ミッドバンドフィットのいずれか一方を含む一つまたは複数を前記特徴量として算出し、
前記傾きおよび前記ミッドバンドフィットのいずれか一方に基づいて前記最適な減衰率を設定することを特徴とする請求項3に記載の超音波観測装置。 - 前記特徴量算出部は、
前記傾きを前記特徴量として算出する場合は前記傾きに基づいて前記最適な減衰率を設定し、前記ミッドバンドフィットを前記特徴量として算出する場合は前記ミッドバンドフィットに基づいて前記最適な減衰率を設定することを特徴とする請求項4に記載の超音波観測装置。 - 前記特徴量算出部は、
前記超音波画像の全てのフレームで前記最適な減衰率を設定することを特徴とする請求項1~5のいずれか一項に記載の超音波観測装置。 - 前記特徴量算出部は、
前記超音波画像の1より大きい所定数のフレームごとに前記最適な減衰率を設定し、
前記最適な減衰率を設定しないフレームでは、該フレーム以前で最後に設定された前記最適な減衰率を用いて前記各周波数スペクトルの特徴量を算出することを特徴とする請求項1~5のいずれか一項に記載の超音波観測装置。 - 前記特徴量算出部は、
前記超音波画像の全てのフレームで前記最適な減衰率に相当する最適減衰率相当値を算出し、1より大きい所定数のフレームで算出した前記最適減衰率相当値をもとに前記最適な減衰率を設定することを特徴とする請求項1~5のいずれか一項に記載の超音波観測装置。 - 前記特徴量画像データは、前記最適な減衰率に関する情報を含むことを特徴とする請求項1~8のいずれか一項に記載の超音波観測装置。
- 前記特徴量画像データに対応する特徴量画像を表示する表示部をさらに備えたことを特徴とする請求項1~9のいずれか一項に記載の超音波観測装置。
- 前記周波数解析部が前記周波数スペクトルを算出する対象領域の設定入力を受け付ける入力部をさらに備え、
前記周波数解析部は、前記対象領域で反射された前記超音波エコーをもとに前記周波数スペクトルを算出することを特徴とする請求項1~10のいずれか一項に記載の超音波観測装置。 - 観測対象に対して送信した超音波が該観測対象によって反射された超音波エコーを電気信号に変換したエコー信号に基づいて生成される信号の周波数を解析することによって複数の周波数スペクトルを算出する周波数解析ステップと、
特徴量算出部が、前記複数の周波数スペクトルの特徴量をそれぞれ算出し、前記超音波が前記観測対象を伝播する際の互いに異なる減衰特性を与える少なくとも三つの減衰率候補値の各々において、各周波数スペクトルの特徴量に対して前記超音波の減衰の影響を排除する減衰補正を行うことによって前記各周波数スペクトルの補正特徴量を算出し、前記減衰率候補値ごとに前記補正特徴量の統計的なばらつきを算出した後、該統計的なばらつきに基づく二次関数を生成し、該二次関数において前記統計的なばらつきが最小である減衰率候補値を最適な減衰率として設定する特徴量算出ステップと、
特徴量画像データ生成部が、前記最適な減衰率に基づく前記補正特徴量を視覚情報と関連づけて前記エコー信号から生成された超音波画像とともに表示する特徴量画像データを生成する特徴量画像データ生成ステップと、
を含むことを特徴とする超音波観測装置の作動方法。 - 観測対象に対して送信した超音波が該観測対象によって反射された超音波エコーを電気信号に変換したエコー信号に基づいて生成される信号の周波数を解析することによって複数の周波数スペクトルを算出する周波数解析手順と、
特徴量算出部が、前記複数の周波数スペクトルの特徴量をそれぞれ算出し、前記超音波が前記観測対象を伝播する際の互いに異なる減衰特性を与える少なくとも三つの減衰率候補値の各々において、各周波数スペクトルの特徴量に対して前記超音波の減衰の影響を排除する減衰補正を行うことによって前記各周波数スペクトルの補正特徴量を算出し、前記減衰率候補値ごとに前記補正特徴量の統計的なばらつきを算出した後、該統計的なばらつきに基づく二次関数を生成し、該二次関数において前記統計的なばらつきが最小である減衰率候補値を最適な減衰率として設定する特徴量算出手順と、
特徴量画像データ生成部が、前記最適な減衰率に基づく前記補正特徴量を視覚情報と関連づけて前記エコー信号から生成された超音波画像とともに表示する特徴量画像データを生成する特徴量画像データ生成手順と、
を超音波観測装置に実行させることを特徴とする超音波観測装置の作動プログラム。
Priority Applications (4)
| Application Number | Priority Date | Filing Date | Title |
|---|---|---|---|
| JP2017509164A JP6138402B2 (ja) | 2015-03-31 | 2015-12-02 | 超音波観測装置、超音波観測装置の作動方法および超音波観測装置の作動プログラム |
| EP15887766.2A EP3278737A4 (en) | 2015-03-31 | 2015-12-02 | Ultrasonic observation apparatus, operating method of ultrasonic observation apparatus, and operating program for ultrasonic observation apparatus |
| CN201580078561.6A CN107405136A (zh) | 2015-03-31 | 2015-12-02 | 超声波观测装置、超声波观测装置的工作方法以及超声波观测装置的工作程序 |
| US15/716,679 US20180028158A1 (en) | 2015-03-31 | 2017-09-27 | Ultrasound observation apparatus, method for operating ultrasound observation apparatus, and computer-readable recording medium |
Applications Claiming Priority (2)
| Application Number | Priority Date | Filing Date | Title |
|---|---|---|---|
| JP2015-072726 | 2015-03-31 | ||
| JP2015072726 | 2015-03-31 |
Related Child Applications (1)
| Application Number | Title | Priority Date | Filing Date |
|---|---|---|---|
| US15/716,679 Continuation US20180028158A1 (en) | 2015-03-31 | 2017-09-27 | Ultrasound observation apparatus, method for operating ultrasound observation apparatus, and computer-readable recording medium |
Publications (1)
| Publication Number | Publication Date |
|---|---|
| WO2016157624A1 true WO2016157624A1 (ja) | 2016-10-06 |
Family
ID=57004084
Family Applications (1)
| Application Number | Title | Priority Date | Filing Date |
|---|---|---|---|
| PCT/JP2015/083938 WO2016157624A1 (ja) | 2015-03-31 | 2015-12-02 | 超音波観測装置、超音波観測装置の作動方法および超音波観測装置の作動プログラム |
Country Status (5)
| Country | Link |
|---|---|
| US (1) | US20180028158A1 (ja) |
| EP (1) | EP3278737A4 (ja) |
| JP (1) | JP6138402B2 (ja) |
| CN (1) | CN107405136A (ja) |
| WO (1) | WO2016157624A1 (ja) |
Cited By (1)
| Publication number | Priority date | Publication date | Assignee | Title |
|---|---|---|---|---|
| CN113491535A (zh) * | 2020-04-01 | 2021-10-12 | 株式会社日立制作所 | 超声波诊断装置、信号处理装置以及信号处理程序 |
Citations (2)
| Publication number | Priority date | Publication date | Assignee | Title |
|---|---|---|---|---|
| JPS62117536A (ja) * | 1985-11-18 | 1987-05-29 | 株式会社島津製作所 | 超音波診断装置における組織性状の判定方法 |
| WO2012063929A1 (ja) * | 2010-11-11 | 2012-05-18 | オリンパスメディカルシステムズ株式会社 | 超音波観測装置、超音波観測装置の作動方法および超音波観測装置の作動プログラム |
Family Cites Families (8)
| Publication number | Priority date | Publication date | Assignee | Title |
|---|---|---|---|---|
| JPH02193651A (ja) * | 1989-01-20 | 1990-07-31 | Fujitsu Ltd | 超音波減衰係数の推定方法 |
| JP5054254B2 (ja) * | 2010-11-11 | 2012-10-24 | オリンパスメディカルシステムズ株式会社 | 超音波診断装置、超音波診断装置の作動方法および超音波診断装置の作動プログラム |
| EP2548515B1 (en) * | 2010-11-11 | 2014-02-12 | Olympus Medical Systems Corp. | Ultrasonic observation apparatus and operation method and operation program of the same |
| EP2554124B1 (en) * | 2010-11-11 | 2014-01-01 | Olympus Medical Systems Corp. | Ultrasound observation device with the associated method and operating program |
| JP5114609B2 (ja) * | 2011-03-31 | 2013-01-09 | オリンパスメディカルシステムズ株式会社 | 超音波観測装置および超音波観測装置の作動方法および超音波観測装置の作動プログラム |
| JP5430809B1 (ja) * | 2012-05-30 | 2014-03-05 | オリンパスメディカルシステムズ株式会社 | 超音波観測装置、超音波観測装置の作動方法および超音波観測装置の作動プログラム |
| EP2878271A4 (en) * | 2012-07-27 | 2016-04-13 | Olympus Corp | ULTRASOUND OBSERVATION APPARATUS, METHOD FOR OPERATING ULTRASOUND OBSERVATION APPARATUS, AND OPERATING PROGRAM FOR ULTRASONIC OBSERVATION APPARATUS |
| WO2016006288A1 (ja) * | 2014-07-11 | 2016-01-14 | オリンパス株式会社 | 超音波観測装置、超音波観測装置の作動方法および超音波観測装置の作動プログラム |
-
2015
- 2015-12-02 WO PCT/JP2015/083938 patent/WO2016157624A1/ja unknown
- 2015-12-02 EP EP15887766.2A patent/EP3278737A4/en not_active Withdrawn
- 2015-12-02 JP JP2017509164A patent/JP6138402B2/ja active Active
- 2015-12-02 CN CN201580078561.6A patent/CN107405136A/zh active Pending
-
2017
- 2017-09-27 US US15/716,679 patent/US20180028158A1/en not_active Abandoned
Patent Citations (2)
| Publication number | Priority date | Publication date | Assignee | Title |
|---|---|---|---|---|
| JPS62117536A (ja) * | 1985-11-18 | 1987-05-29 | 株式会社島津製作所 | 超音波診断装置における組織性状の判定方法 |
| WO2012063929A1 (ja) * | 2010-11-11 | 2012-05-18 | オリンパスメディカルシステムズ株式会社 | 超音波観測装置、超音波観測装置の作動方法および超音波観測装置の作動プログラム |
Non-Patent Citations (1)
| Title |
|---|
| See also references of EP3278737A4 * |
Cited By (2)
| Publication number | Priority date | Publication date | Assignee | Title |
|---|---|---|---|---|
| CN113491535A (zh) * | 2020-04-01 | 2021-10-12 | 株式会社日立制作所 | 超声波诊断装置、信号处理装置以及信号处理程序 |
| CN113491535B (zh) * | 2020-04-01 | 2024-04-26 | 富士胶片医疗健康株式会社 | 超声波诊断装置、信号处理装置以及记录介质 |
Also Published As
| Publication number | Publication date |
|---|---|
| JP6138402B2 (ja) | 2017-05-31 |
| EP3278737A4 (en) | 2019-01-02 |
| JPWO2016157624A1 (ja) | 2017-06-08 |
| EP3278737A1 (en) | 2018-02-07 |
| CN107405136A (zh) | 2017-11-28 |
| US20180028158A1 (en) | 2018-02-01 |
Similar Documents
| Publication | Publication Date | Title |
|---|---|---|
| JP5974210B2 (ja) | 超音波観測装置、超音波観測装置の作動方法および超音波観測装置の作動プログラム | |
| WO2016151951A1 (ja) | 超音波観測装置、超音波観測装置の作動方法および超音波観測装置の作動プログラム | |
| JP5948527B1 (ja) | 超音波観測装置、超音波観測装置の作動方法および超音波観測装置の作動プログラム | |
| WO2018142937A1 (ja) | 超音波観測装置、超音波観測装置の作動方法および超音波観測装置の作動プログラム | |
| WO2017110756A1 (ja) | 超音波観測装置、超音波観測装置の作動方法および超音波観測装置の作動プログラム | |
| JP6289772B2 (ja) | 超音波観測装置、超音波観測装置の作動方法および超音波観測装置の作動プログラム | |
| JP6892320B2 (ja) | 超音波観測装置、超音波観測装置の作動方法および超音波観測装置の作動プログラム | |
| JP2016202567A (ja) | 超音波観測装置、超音波観測装置の作動方法および超音波観測装置の作動プログラム | |
| WO2016181869A1 (ja) | 超音波観測装置、超音波観測装置の作動方法および超音波観測装置の作動プログラム | |
| JP6138402B2 (ja) | 超音波観測装置、超音波観測装置の作動方法および超音波観測装置の作動プログラム | |
| JP2018191779A (ja) | 超音波観測装置 | |
| WO2016103848A1 (ja) | 超音波観測装置、超音波観測装置の作動方法および超音波観測装置の作動プログラム | |
| JP6157790B1 (ja) | 超音波観測装置、超音波観測装置の作動方法および超音波観測装置の作動プログラム | |
| JP5981072B1 (ja) | 超音波観測装置、超音波観測装置の作動方法および超音波観測装置の作動プログラム | |
| JP6022135B1 (ja) | 超音波診断装置、超音波診断装置の作動方法および超音波診断装置の作動プログラム | |
| JP6253572B2 (ja) | 超音波観測装置、超音波観測装置の作動方法および超音波観測装置の作動プログラム | |
| WO2016181856A1 (ja) | 超音波診断装置、超音波診断装置の作動方法および超音波診断装置の作動プログラム | |
| JP5927367B1 (ja) | 超音波観測装置、超音波観測装置の作動方法および超音波観測装置の作動プログラム | |
| JP6010274B1 (ja) | 超音波観測装置、超音波観測装置の作動方法および超音波観測装置の作動プログラム | |
| JP5953457B1 (ja) | 超音波観測装置、超音波観測装置の作動方法および超音波観測装置の作動プログラム | |
| JP5932184B1 (ja) | 超音波観測装置、超音波観測装置の作動方法および超音波観測装置の作動プログラム | |
| WO2020157931A1 (ja) | 超音波観測装置、超音波観測装置の作動方法および超音波観測装置の作動プログラム | |
| WO2016103849A1 (ja) | 超音波観測装置、超音波観測装置の作動方法および超音波観測装置の作動プログラム | |
| JP2017217313A (ja) | 超音波観測装置、超音波観測装置の作動方法および超音波観測装置の作動プログラム |
Legal Events
| Date | Code | Title | Description |
|---|---|---|---|
| 121 | Ep: the epo has been informed by wipo that ep was designated in this application |
Ref document number: 15887766 Country of ref document: EP Kind code of ref document: A1 |
|
| ENP | Entry into the national phase |
Ref document number: 2017509164 Country of ref document: JP Kind code of ref document: A |
|
| NENP | Non-entry into the national phase |
Ref country code: DE |