WO2018142937A1 - 超音波観測装置、超音波観測装置の作動方法および超音波観測装置の作動プログラム - Google Patents
超音波観測装置、超音波観測装置の作動方法および超音波観測装置の作動プログラム Download PDFInfo
- Publication number
- WO2018142937A1 WO2018142937A1 PCT/JP2018/001208 JP2018001208W WO2018142937A1 WO 2018142937 A1 WO2018142937 A1 WO 2018142937A1 JP 2018001208 W JP2018001208 W JP 2018001208W WO 2018142937 A1 WO2018142937 A1 WO 2018142937A1
- Authority
- WO
- WIPO (PCT)
- Prior art keywords
- region
- unit
- determination
- ultrasonic
- small
- Prior art date
Links
Images


Classifications
-
- A—HUMAN NECESSITIES
- A61—MEDICAL OR VETERINARY SCIENCE; HYGIENE
- A61B—DIAGNOSIS; SURGERY; IDENTIFICATION
- A61B8/00—Diagnosis using ultrasonic, sonic or infrasonic waves
- A61B8/46—Ultrasonic, sonic or infrasonic diagnostic devices with special arrangements for interfacing with the operator or the patient
- A61B8/467—Ultrasonic, sonic or infrasonic diagnostic devices with special arrangements for interfacing with the operator or the patient characterised by special input means
- A61B8/469—Ultrasonic, sonic or infrasonic diagnostic devices with special arrangements for interfacing with the operator or the patient characterised by special input means for selection of a region of interest
-
- A—HUMAN NECESSITIES
- A61—MEDICAL OR VETERINARY SCIENCE; HYGIENE
- A61B—DIAGNOSIS; SURGERY; IDENTIFICATION
- A61B8/00—Diagnosis using ultrasonic, sonic or infrasonic waves
- A61B8/52—Devices using data or image processing specially adapted for diagnosis using ultrasonic, sonic or infrasonic waves
- A61B8/5207—Devices using data or image processing specially adapted for diagnosis using ultrasonic, sonic or infrasonic waves involving processing of raw data to produce diagnostic data, e.g. for generating an image
-
- A—HUMAN NECESSITIES
- A61—MEDICAL OR VETERINARY SCIENCE; HYGIENE
- A61B—DIAGNOSIS; SURGERY; IDENTIFICATION
- A61B8/00—Diagnosis using ultrasonic, sonic or infrasonic waves
- A61B8/52—Devices using data or image processing specially adapted for diagnosis using ultrasonic, sonic or infrasonic waves
- A61B8/5215—Devices using data or image processing specially adapted for diagnosis using ultrasonic, sonic or infrasonic waves involving processing of medical diagnostic data
- A61B8/5223—Devices using data or image processing specially adapted for diagnosis using ultrasonic, sonic or infrasonic waves involving processing of medical diagnostic data for extracting a diagnostic or physiological parameter from medical diagnostic data
-
- A—HUMAN NECESSITIES
- A61—MEDICAL OR VETERINARY SCIENCE; HYGIENE
- A61B—DIAGNOSIS; SURGERY; IDENTIFICATION
- A61B8/00—Diagnosis using ultrasonic, sonic or infrasonic waves
- A61B8/52—Devices using data or image processing specially adapted for diagnosis using ultrasonic, sonic or infrasonic waves
- A61B8/5269—Devices using data or image processing specially adapted for diagnosis using ultrasonic, sonic or infrasonic waves involving detection or reduction of artifacts
-
- G—PHYSICS
- G16—INFORMATION AND COMMUNICATION TECHNOLOGY [ICT] SPECIALLY ADAPTED FOR SPECIFIC APPLICATION FIELDS
- G16H—HEALTHCARE INFORMATICS, i.e. INFORMATION AND COMMUNICATION TECHNOLOGY [ICT] SPECIALLY ADAPTED FOR THE HANDLING OR PROCESSING OF MEDICAL OR HEALTHCARE DATA
- G16H50/00—ICT specially adapted for medical diagnosis, medical simulation or medical data mining; ICT specially adapted for detecting, monitoring or modelling epidemics or pandemics
- G16H50/30—ICT specially adapted for medical diagnosis, medical simulation or medical data mining; ICT specially adapted for detecting, monitoring or modelling epidemics or pandemics for calculating health indices; for individual health risk assessment
-
- A—HUMAN NECESSITIES
- A61—MEDICAL OR VETERINARY SCIENCE; HYGIENE
- A61B—DIAGNOSIS; SURGERY; IDENTIFICATION
- A61B8/00—Diagnosis using ultrasonic, sonic or infrasonic waves
- A61B8/12—Diagnosis using ultrasonic, sonic or infrasonic waves in body cavities or body tracts, e.g. by using catheters
-
- A—HUMAN NECESSITIES
- A61—MEDICAL OR VETERINARY SCIENCE; HYGIENE
- A61B—DIAGNOSIS; SURGERY; IDENTIFICATION
- A61B8/00—Diagnosis using ultrasonic, sonic or infrasonic waves
- A61B8/13—Tomography
- A61B8/14—Echo-tomography
-
- A—HUMAN NECESSITIES
- A61—MEDICAL OR VETERINARY SCIENCE; HYGIENE
- A61B—DIAGNOSIS; SURGERY; IDENTIFICATION
- A61B8/00—Diagnosis using ultrasonic, sonic or infrasonic waves
- A61B8/46—Ultrasonic, sonic or infrasonic diagnostic devices with special arrangements for interfacing with the operator or the patient
- A61B8/461—Displaying means of special interest
Definitions
- the present invention relates to an ultrasonic observation apparatus that observes a tissue to be observed using ultrasonic waves, an operation method of the ultrasonic observation apparatus, and an operation program of the ultrasonic observation apparatus.
- Ultrasound may be applied to observe the characteristics of the biological tissue or material that is the object of observation. Specifically, the observation target is observed by transmitting an ultrasonic wave to the observation target, generating an ultrasonic image based on the ultrasonic echo reflected by the observation target, and displaying the generated ultrasonic image. I do.
- a region for observation in detail (hereinafter referred to as a region of interest) may be set in the ultrasound image (see, for example, Patent Document 1).
- the accuracy of the image in the region of interest is increased by performing attenuation correction or the like.
- Patent Literature 1 a plurality of evaluation regions are set in a region of interest, an evaluation value is calculated for each evaluation region using a preset physical quantity, and the region of interest is reset based on the evaluation value. ing.
- the evaluation value is compared with a threshold value to determine the high observation accuracy of the evaluation region, and the region of interest is reset by excluding the evaluation region determined to have a low observation accuracy.
- Patent Document 1 excludes an evaluation region determined to have low observation accuracy as described above from the region of interest, and no attenuation rate is set for a region with low observation accuracy. Therefore, in Patent Document 1, it is impossible to set the attenuation rate appropriately for the region of interest without changing the region of interest set first.
- the present invention has been made in view of the above, and an ultrasonic observation apparatus and an operation of the ultrasonic observation apparatus that can appropriately set the attenuation rate in the region of interest while maintaining the size of the region of interest. It is an object to provide a method and an operation program for an ultrasonic observation apparatus.
- an ultrasonic observation apparatus transmits an ultrasonic wave to an observation target and receives an ultrasonic wave reflected by the observation target.
- An ultrasonic observation apparatus that generates ultrasonic image data based on a received ultrasonic signal, wherein a predetermined condition is set for a region of interest set in an ultrasonic image corresponding to the ultrasonic image data.
- a small area setting unit that sets a plurality of small areas obtained by dividing the region of interest, and a histogram of each small area based on a preset physical quantity, and based on the histogram, the physical quantity in the small area Based on a determination value calculation unit that calculates a determination value for determining whether each of the small regions is uniform for each of the small regions, the determination value, and a preset threshold value.
- the physical quantity of is uniform
- a determination unit that determines whether or not, and when the determination unit determines that the physical quantity in the small region to be determined is not uniform, a region changing unit that changes the small region according to a preset condition, When the determination unit determines that the physical quantity in the small area to be determined is uniform, an area setting unit that sets the small area as an attenuation rate calculation target area, and an attenuation rate of the attenuation rate calculation target area And an attenuation rate setting unit for setting.
- the region changing unit divides the small region when the determination unit determines that the physical quantity in the small region to be determined is not uniform. And setting a plurality of divided areas.
- the attenuation rate setting unit determines that a physical quantity in the divided region having a size of the minimum setting region is not uniform by the determination unit
- the attenuation rate of the divided region is set based on the attenuation rate of the small region or the divided region around the divided region.
- the region changing unit moves the region of interest in a predetermined direction when the region changing unit includes the small region determined to be nonuniform by the determining unit. It is characterized by making it.
- the determination value calculation unit calculates variation in the histogram, and the determination unit includes the variation and a threshold value set in advance with respect to the variation. And determining whether the physical quantity in the small region to be determined is uniform.
- the determination value calculation unit calculates the number of maximum values of the histogram, and the determination unit relates to the number of maximum values and the number of maximum values. It is characterized in that it is determined whether or not the physical quantity in the small area to be determined is uniform based on a preset threshold value.
- the determination value calculation unit calculates a difference in physical quantity corresponding to each maximum value, and the determination unit includes: Whether or not the physical quantity in the small region to be judged is uniform is determined based on the difference between the physical quantities and a threshold value set in advance with respect to the difference between the physical quantities.
- An operation method of an ultrasonic observation apparatus is an operation method of an ultrasonic observation apparatus that generates ultrasonic image data based on an ultrasonic signal, wherein a small region setting unit responds to the ultrasonic image data.
- a first region setting step for setting a plurality of small regions obtained by dividing the region of interest according to a preset condition for a region of interest set in the ultrasonic image, and a determination value calculation unit A histogram of each small region is generated based on the obtained physical quantity, and a determination value for determining whether the physical quantity in the small region is uniform is calculated for each small region based on the histogram.
- the change unit determines the determination When it is determined by the step that the physical quantity in the small area to be determined is not uniform, the area changing step for changing the small area in accordance with a preset condition and the area setting unit are determined by the determining step.
- a second area setting step for setting the small area as an attenuation rate calculation target area, and an attenuation rate setting unit includes: An attenuation rate setting step for setting an attenuation rate.
- the operation program of the ultrasonic observation apparatus is an operation program of the ultrasonic observation apparatus that generates ultrasonic image data based on an ultrasonic signal, and the small region setting unit responds to the ultrasonic image data.
- a first region setting procedure for setting a plurality of small regions obtained by dividing the region of interest according to a preset condition with respect to the region of interest set in the ultrasonic image, and a determination value calculation unit A histogram of each small region is generated based on the obtained physical quantity, and a determination value for determining whether the physical quantity in the small region is uniform is calculated for each small region based on the histogram.
- a determination value calculation procedure to be performed a determination unit that determines whether a physical quantity in the small region is uniform based on the determination value and a preset threshold value, and a region
- the change unit determines the determination
- the area changing procedure for changing the small area in accordance with a preset condition and the area setting unit are determined according to the determination procedure.
- a second area setting procedure for setting the small area as an attenuation rate calculation target area, and an attenuation rate setting unit includes: An attenuation factor setting procedure for setting an attenuation factor is executed by the ultrasonic observation apparatus.
- the present invention it is possible to appropriately set the attenuation rate in the region of interest while maintaining the size of the region of interest.
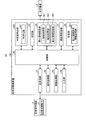
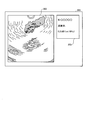
- FIG. 1 is a block diagram showing a configuration of an ultrasonic diagnostic system including an ultrasonic observation apparatus according to Embodiment 1 of the present invention.
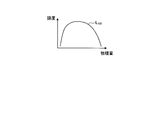
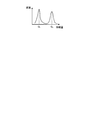
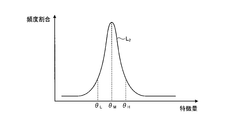
- FIG. 2 is a diagram illustrating a frequency distribution when the physical quantity is uniform.
- FIG. 3 is a diagram illustrating a frequency distribution when physical quantities are not uniform.
- FIG. 4 is a diagram schematically showing an ultrasound image displayed by the display device of the ultrasound diagnosis system according to Embodiment 1 of the present invention.
- FIG. 5 is a diagram for explaining a region of interest set by the ultrasound observation apparatus according to Embodiment 1 of the present invention.
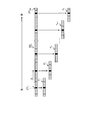
- FIG. 6 is a diagram for explaining small area setting processing of a region of interest performed by the ultrasound observation apparatus according to Embodiment 1 of the present invention.
- FIG. 1 is a block diagram showing a configuration of an ultrasonic diagnostic system including an ultrasonic observation apparatus according to Embodiment 1 of the present invention.
- FIG. 2 is a diagram illustrating a frequency distribution when the physical quantity is uniform.
- FIG. 7 is a diagram for explaining small area setting processing of a region of interest performed by the ultrasound observation apparatus according to Embodiment 1 of the present invention.
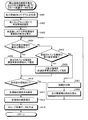
- FIG. 8 is a flowchart showing an outline of processing performed by the ultrasound observation apparatus according to Embodiment 1 of the present invention.
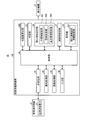
- FIG. 9 is a block diagram showing a configuration of an ultrasonic diagnostic system including the ultrasonic observation apparatus according to Embodiment 2 of the present invention.
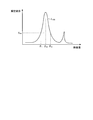
- FIG. 10 is a diagram illustrating a frequency distribution having a plurality of local maximum values.
- FIG. 11 is a flowchart showing an outline of processing performed by the ultrasonic observation apparatus according to Embodiment 2 of the present invention.
- FIG. 12 is a block diagram showing a configuration of an ultrasonic diagnostic system including the ultrasonic observation apparatus according to Embodiment 3 of the present invention.
- FIG. 13 is a diagram for explaining small area setting processing of a region of interest performed by the ultrasound observation apparatus according to Embodiment 4 of the present invention.
- FIG. 14 is a block diagram showing a configuration of an ultrasonic diagnostic system provided with an ultrasonic observation apparatus according to Embodiment 5 of the present invention.
- FIG. 15 is a diagram showing the relationship between the reception depth and the amplification factor in the amplification processing performed by the signal amplification unit of the ultrasonic observation apparatus according to Embodiment 5 of the present invention.
- FIG. 16 is a diagram showing the relationship between the reception depth and the amplification factor in the amplification correction process performed by the amplification correction unit of the ultrasonic observation apparatus according to Embodiment 5 of the present invention.
- FIG. 17 is a diagram schematically illustrating a data array in one sound ray of an ultrasonic signal.
- FIG. 18 is a diagram illustrating an example of a frequency spectrum calculated by the frequency analysis unit of the ultrasonic observation apparatus according to the fifth embodiment of the present invention.
- FIG. 19 is a diagram showing a straight line having as a parameter the correction feature amount calculated by the attenuation correction unit of the ultrasonic observation apparatus according to the fifth embodiment of the present invention.
- FIG. 20 is a flowchart showing an outline of processing performed by the ultrasound observation apparatus according to Embodiment 5 of the present invention.
- FIG. 21 is a flowchart showing an outline of processing executed by the frequency analysis unit of the ultrasonic observation apparatus according to Embodiment 5 of the present invention.
- FIG. 22 is a diagram schematically illustrating a display example of the feature amount image in the display device of the ultrasonic observation apparatus according to the fifth embodiment of the present invention.
- FIG. 23 is a flowchart illustrating an outline of processing performed by the ultrasound observation apparatus according to the first modification of the fifth embodiment of the present invention.
- FIG. 24 is a diagram illustrating a frequency distribution of a frequency ratio with respect to a feature amount.
- FIG. 25 is a diagram illustrating a frequency distribution of a frequency ratio with respect to a feature amount.
- FIG. 26 is a flowchart showing an outline of processing performed by the ultrasonic observation apparatus according to the second modification of the fifth embodiment of the present invention.
- FIG. 27 is a diagram illustrating a frequency distribution of a frequency ratio with respect to a feature amount.
- FIG. 1 is a block diagram showing a configuration of an ultrasonic diagnostic system including an ultrasonic observation apparatus according to Embodiment 1 of the present invention.
- An ultrasonic diagnostic system 1 shown in FIG. 1 transmits an ultrasonic wave to a subject to be observed and receives an ultrasonic wave reflected by the subject, and an ultrasonic endoscope 2.
- an ultrasonic observation device 3 that generates an ultrasonic image based on the ultrasonic signal acquired by the
- a display device 4 that displays the ultrasonic image generated by the ultrasonic observation device 3.
- the ultrasonic endoscope 2 converts an electrical pulse signal received from the ultrasonic observation device 3 into an ultrasonic pulse (acoustic pulse) and irradiates the subject at the tip thereof, and is reflected by the subject. And an ultrasonic transducer 21 that converts the ultrasonic echo into an electrical echo signal (ultrasonic signal) that is expressed by a voltage change and outputs it.
- the ultrasonic transducer 21 is realized by a radial type transducer.
- the ultrasonic endoscope 2 may be one that mechanically scans the ultrasonic transducer 21, or a plurality of elements are provided in an array as the ultrasonic transducer 21, and the elements involved in transmission and reception are electronically arranged. Electronic scanning may be performed by switching or delaying transmission / reception of each element.
- the ultrasonic endoscope 2 usually has an imaging optical system and an imaging device, and is inserted into the digestive tract (esophagus, stomach, duodenum, large intestine) or respiratory organ (trachea, bronchi) of the subject for digestion. Images of ducts, respiratory organs and surrounding organs (pancreas, gallbladder, bile duct, biliary tract, lymph node, mediastinal organ, blood vessel, etc.) can be imaged.
- the ultrasonic endoscope 2 has a light guide that guides illumination light to be irradiated onto the subject during imaging.
- the light guide has a distal end portion that reaches the distal end of the insertion portion of the ultrasonic endoscope 2 into the subject, and a proximal end portion that is connected to a light source device that generates illumination light.
- the ultrasound observation apparatus 3 includes a transmission / reception unit 31, a signal processing unit 32, an image processing unit 33, a determination value calculation unit 34, a determination unit 35, a region of interest setting unit 36, an attenuation rate setting unit 37, An input unit 38, a storage unit 39, and a control unit 40 are provided.
- the transmission / reception unit 31 is electrically connected to the ultrasonic endoscope 2 and transmits a transmission signal (pulse signal) including a high voltage pulse to the ultrasonic transducer 21 based on a predetermined waveform and transmission timing.
- a transmission signal pulse signal
- An echo signal which is an electrical reception signal, is received from the sonic transducer 21 to generate and output digital high frequency (RF) signal data (hereinafter referred to as RF data).
- the frequency band of the pulse signal transmitted by the transmission / reception unit 31 may be a wide band that substantially covers the linear response frequency band of the electroacoustic conversion of the pulse signal to the ultrasonic pulse in the ultrasonic transducer 21.
- the transmission / reception unit 31 transmits various control signals output from the control unit 40 to the ultrasonic endoscope 2, and receives various types of information including an identification ID from the ultrasonic endoscope 2 to receive the control unit 40. It also has a function to transmit to.
- the signal processing unit 32 generates digital B-mode reception data based on the RF data received from the transmission / reception unit 31. Specifically, the signal processing unit 32 performs known processing such as bandpass filter, envelope detection, logarithmic conversion, attenuation correction on the RF data, and generates digital B-mode reception data. In logarithmic conversion, a common logarithm of an amount obtained by dividing RF data by a reference voltage is taken and expressed as a decibel value.
- the B-mode reception data includes a plurality of line data in which the amplitude or intensity of the reception signal indicating the intensity of reflection of the ultrasonic pulse is arranged along the transmission / reception direction (depth direction) of the ultrasonic pulse.
- the signal processing unit 32 outputs the generated B-mode reception data for one frame to the image processing unit 33.
- the signal processing unit 32 is realized using a general-purpose processor such as a CPU (Central Processing Unit) or a dedicated integrated circuit that performs a specific function such as an ASIC (Application Specific Integrated Circuit) or FPGA (Field Programmable Gate Array). Is done.
- a general-purpose processor such as a CPU (Central Processing Unit) or a dedicated integrated circuit that performs a specific function such as an ASIC (Application Specific Integrated Circuit) or FPGA (Field Programmable Gate Array). Is done.
- the image processing unit 33 generates B-mode image data based on the B-mode reception data received from the signal processing unit 32.
- the image processing unit 33 performs signal processing using known techniques such as scan converter processing, gain processing, contrast processing, and the like on the B-mode reception data output from the signal processing unit 32, and in the display device 4.
- B-mode image data is generated by thinning out data according to the data step width determined according to the display range of the image.
- the scan direction of the B-mode reception data is converted from the ultrasonic scan direction to the display direction of the display device 4.
- the B-mode image is a grayscale image in which values of R (red), G (green), and B (blue), which are variables when the RGB color system is adopted as a color space, are matched.
- luminance the value indicating the brightness at the pixel position
- luminance the value indicating the brightness at the pixel position
- the image processing unit 33 performs coordinate conversion to rearrange the scanning range so that the scanning range can be spatially correctly represented on the B-mode reception data from the signal processing unit 32, and then performs interpolation processing between the B-mode reception data.
- the gap between the B mode reception data is filled, and B mode image data is generated.
- the image processing unit 33 is realized by using a general-purpose processor such as a CPU or a dedicated integrated circuit that executes a specific function such as an ASIC or FPGA.
- the determination value calculation unit 34 calculates the determination value of the calculation area using a preset physical quantity.
- luminance is used as a physical quantity to generate a histogram regarding the frequency of luminance in a small region set in the region of interest or a divided region obtained by dividing the small region. Is calculated as a determination value.
- the variation is, for example, a standard deviation of luminance.
- the small area and the divided area will be described later.
- the determination value calculation unit 34 is realized using a general-purpose processor such as a CPU or a dedicated integrated circuit that executes a specific function such as an ASIC or FPGA.
- the determination unit 35 determines whether the luminance in the small region to be determined or the luminance in the divided region is uniform based on the determination value calculated by the determination value calculation unit 34. Specifically, the determination unit 35 determines whether or not the determination value exceeds a preset threshold value, and determines that the determination value is uniform if the determination value does not exceed the threshold value. On the other hand, if the determination value exceeds the threshold value, the determination unit 35 determines that it is not uniform.
- the determination unit 35 is realized by using a general-purpose processor such as a CPU or a dedicated integrated circuit that executes a specific function such as an ASIC or FPGA.
- FIG. 2 is a diagram illustrating a frequency distribution when the physical quantity is uniform.
- the determination unit 35 shows a frequency distribution with small variations such as the distribution curve L 1 shown in FIG. 2, and the luminance in the region is uniform when the standard deviation as the determination value is small. Judge.
- FIG. 3 is a diagram illustrating a frequency distribution when physical quantities are not uniform.
- the determination unit 35 shows a frequency distribution with a large variation such as the distribution curve L 100 shown in FIG. 3 with respect to the frequency distribution of FIG. 2, and the standard deviation as the determination value increases. It is determined that the brightness of is not uniform.
- the region-of-interest setting unit 36 sets a region of interest in accordance with a preset setting condition or a region-of-interest setting instruction received by the input unit 38.
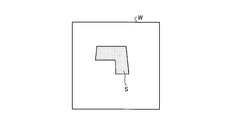
- FIG. 4 is a diagram schematically showing an ultrasound image displayed by the display device of the ultrasound diagnosis system according to Embodiment 1 of the present invention.
- FIG. 5 is a diagram for explaining a region of interest set by the ultrasound observation apparatus according to Embodiment 1 of the present invention.
- the region-of-interest setting unit 36 has a trapezoidal interest as shown in FIG. 5 according to the setting condition or setting input for the B-mode image W that is an ultrasonic image in which the object S is shown as shown in FIG. Region R is set.
- the region of interest R is set to a shape surrounding the object S.
- the object S is an abnormal part such as a tumor in the subject.
- the region-of-interest setting unit 36 is realized using a general-purpose processor such as a CPU or a dedicated integrated circuit that executes a specific function such as an A
- the region-of-interest setting unit 36 divides the region of interest according to a preset condition, so that a small region setting unit 361 that sets a plurality of small regions and a region to be determined are determined by the determination unit 35. If it is determined that the region to be determined is uniform by the region changing unit 362 that changes the region according to a preset condition and the determination unit 35 determines that the region to be determined is uniform. And a calculation area setting unit 363 that sets the calculation target area.
- the small region setting unit 361 divides the region of interest R according to preset conditions. For example, as shown in FIG. 5, the small region setting unit 361 divides the region of interest R into nine regions, and sets nine small regions (small regions R S 1 to R S 9) in the region of interest R. To do.
- the division processing may be performed so that the areas are the same, or may be performed by a straight line along the depth direction and straight lines parallel to the upper and lower bases of the region of interest R.
- the area changing unit 362 performs division processing that satisfies a predetermined division condition so as to subdivide the determination target area.
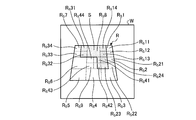
- FIG. 6 and FIG. 7 are diagrams for explaining small area setting processing of a region of interest performed by the ultrasound observation apparatus according to Embodiment 1 of the present invention.
- the determination unit 35 determines that the small regions R S 1, R S 2, R S 7, R S 9 are not uniform.
- the region changing unit 362 divides the small regions R S 1, R S 2, R S 7, and R S 9.
- the small region R S 1 divided region R S 11, R S 12, R S 13, R S 14 is generated, the small region R S 2 divided regions R S 21 , R S 22, R S 23, R S 24 are generated, and in the small area R S 7, divided areas R S 31, R S 32, R S 33, R S 34 are generated, and in the small area R S 9.
- the divided regions R S 41, R S 42, R S 43, and R S 44 are generated.
- the area changing unit 362 further divides the divided areas R S 41 and R S 42, respectively.
- divided regions R S 411, R S 412, R S 413, R S 414 are generated in the divided region R S 41, and the divided region R S 421 is generated in the divided region R S 42.
- R S 422, R S 423, and R S 424 are generated.
- Each divided region generated by the dividing process by the region changing unit 362 corresponds to a small region after the change.
- the area changing unit 362 performs the dividing process of the area determined to be not uniform until the area size becomes the minimum setting area.
- the attenuation rate setting unit 37 sets an attenuation rate in each of the small regions and / or divided regions in the region of interest set by the region of interest setting unit 36.
- the attenuation rate setting unit 37 sets the attenuation rate determined by the representative point of each region, for example, the depth of the center of gravity position, to the attenuation rate of that region.
- the attenuation rate setting unit 37 is realized using a general-purpose processor such as a CPU or a dedicated integrated circuit that performs a specific function such as an ASIC or FPGA.
- the input unit 38 is realized by using a user interface such as a keyboard, a mouse, a trackball, and a touch panel, and accepts input of various information.
- the input unit 38 outputs the received information to the control unit 40.
- the storage unit 39 stores various programs for operating the ultrasonic diagnostic system 1, data including various parameters necessary for the operation of the ultrasonic diagnostic system 1, and the like.
- the storage unit 39 stores a threshold used by the determination unit 35 for determination processing.
- the storage unit 39 includes a region-of-interest setting information storage unit 391 that stores region-of-interest setting information that is information related to the setting of the region of interest.
- the region-of-interest setting information is information for setting a small region obtained by dividing the region of interest, and includes information such as the initial number of small regions, the small-area division condition, and the minimum set region. For example, the minimum setting area is set to a size that is not affected by speckles that form a bright and dark speckled pattern.
- the storage unit 39 stores various programs including an operation program for executing the operation method of the ultrasonic diagnostic system 1.
- the operation program can be recorded on a computer-readable recording medium such as a hard disk, a flash memory, a CD-ROM, a DVD-ROM, or a flexible disk and widely distributed.
- the various programs described above can also be obtained by downloading via a communication network.
- the communication network here is realized by, for example, an existing public line network, LAN (Local Area Network), WAN (Wide Area Network), etc., and may be wired or wireless.
- the storage unit 39 having the above configuration is realized using a ROM (Read Only Memory) in which various programs are installed in advance, and a RAM (Random Access Memory) that stores calculation parameters and data of each process. .
- ROM Read Only Memory
- RAM Random Access Memory
- the control unit 40 controls the entire ultrasound diagnostic system 1.
- the control unit 40 is realized using a CPU having arithmetic and control functions, various arithmetic circuits, and the like.
- the controller 40 reads out information stored and stored in the storage unit 39 from the storage unit 39 and executes various arithmetic processes related to the operation method of the ultrasound observation apparatus 3 to control the ultrasound observation apparatus 3 in an integrated manner. To do.
- the control unit 40 may be configured using a CPU or the like common to the signal processing unit 32.
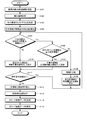
- FIG. 8 is a flowchart showing an outline of processing performed by the ultrasound observation apparatus according to Embodiment 1 of the present invention, and is a flowchart for explaining attenuation rate setting processing in a region of interest.
- the ultrasonic observation apparatus 3 receives an echo signal as a measurement result of an observation target by the ultrasonic transducer 21 from the ultrasonic endoscope 2 (step S101).
- a B-mode image that is an ultrasonic image based on the obtained echo signal may be displayed on the display device 4.
- step S102 the region-of-interest setting unit 36 sets a region of interest in accordance with a preset setting condition or a region-of-interest setting instruction received by the input unit 38.
- the small region setting unit 361 sets a small region for the set region of interest.
- step S103 the determination value calculation unit 34 generates a histogram relating to the luminance frequency in the region set in the region of interest. Thereafter, the determination value calculation unit 34 calculates the determination value of the physical quantity (step S104).
- the determination value in the first embodiment is a luminance variation in the histogram.
- the area refers to either a small area or a divided area.
- the determination unit 35 compares the determination value of the determination target region with the threshold value stored in the storage unit 39 to determine whether the determination value is equal to or greater than the threshold value (step S105). If the determination unit 35 determines that the determination value is equal to or greater than the threshold (step S105: Yes), the determination unit 35 determines that the target small region is not uniform, and proceeds to step S106.
- step S106 the area changing unit 362 determines whether the currently set size of the determination target area is the minimum setting area. At this time, if the region changing unit 362 determines that the determination target region is the minimum setting region (step S106: Yes), the region changing unit 362 proceeds to step S107.
- step S107 the region changing unit 362 sets the target region as a non-attenuation rate calculation region, and proceeds to step S111.
- step S106 determines that the determination target region is not the minimum setting region.
- step S108 the region changing unit 362 further divides the target region. For example, as illustrated in FIG. 6, the region changing unit 362 generates divided regions R S 11, R S 12, R S 13, and R S 14 by dividing the small region R S 1.
- the determination value calculation unit 34 calculates a determination value for the divided area (step S109). After calculating the determination value, the control unit 40 returns to step S105 and performs the above-described determination process.
- step S105 when the determination unit 35 determines that the determination value is not equal to or greater than the threshold value (step S105: No), the determination unit 35 determines that the target small region is uniform, and proceeds to step S110.
- step S110 the calculation area setting unit 363 sets the set area as the attenuation rate calculation area. After setting the attenuation rate calculation region, the control unit 40 proceeds to step S111.
- step S111 the control unit 40 determines whether or not an undetermined area remains.
- step S111: Yes the control unit 40 returns to step S105 to perform the above-described processing on the undetermined area.
- step S111: No the control unit 40 proceeds to step S112.
- the attenuation rate setting unit 37 sets an attenuation rate for each of the small region and / or the divided region set in the attenuation rate calculation region.
- the attenuation factor setting unit 37 sets the attenuation factor of the non-attenuation factor calculation region using the attenuation factor set in the surrounding region for the region set in the non-attenuation factor calculation region.
- the attenuation rate setting unit 37 may calculate an average value of attenuation rates of adjacent regions and use this as the attenuation rate. At this time, the attenuation rate may be weighted according to the size of the region.
- the signal processing unit 32 performs attenuation correction of each region using the set attenuation rate (step S113).
- the image processing unit 33 acquires the B-mode reception data after attenuation correction, and generates B-mode image data including a B-mode image that is an ultrasonic image (step S114).
- control unit 40 controls the display device 4 to display a B-mode image corresponding to the B-mode image data (Step S115).
- Embodiment 1 of the present invention it is determined whether or not the luminance is uniform for each region set in the region of interest, and the region is divided according to the determination result, so that the luminance is uniform.
- the attenuation rate was set for the region that became. Accordingly, it is possible to appropriately set the attenuation rate in the region of interest while maintaining the size of the region of interest. By using the attenuation rate set in this way, a highly accurate ultrasonic image can be created.
- the shape of the region of interest is not limited to a trapezoid, and may be a rectangle, a circle, an ellipse, or the like.
- FIG. 9 is a block diagram showing a configuration of an ultrasonic diagnostic system including the ultrasonic observation apparatus according to Embodiment 2 of the present invention.
- An ultrasonic diagnostic system 1A shown in the figure includes an ultrasonic observation apparatus 3A in place of the ultrasonic observation apparatus 3 of the ultrasonic diagnostic system 1 described above.
- the ultrasonic observation apparatus 3A includes a determination value calculation unit 34A instead of the determination value calculation unit 34 described above.
- Other configurations are the same as those of the ultrasound diagnostic system 1.
- the determination value calculation unit 34A will be described.
- the determination value calculation unit 34A calculates a determination value of the calculation area using a preset physical quantity.
- a histogram relating to the frequency of luminance in a small region set in the region of interest or a divided region that is a divided region is generated.
- the determination value calculation unit 34A includes a smoothing unit 341.
- the smoothing unit 341 smoothes the histogram generated in the determination value calculation unit 34A.
- the smoothing unit 341 is configured using, for example, a moving average filter.
- a histogram after smoothing for example, a histogram having one maximum value (see FIG. 2) or a histogram having a plurality of maximum values is obtained.
- FIG. 10 is a diagram illustrating a frequency distribution having a plurality of local maximum values. For example, as shown in FIG. 10, a histogram having a maximum value is obtained for physical quantities Q 1 and Q 2 (Q 1 ⁇ Q 2 ).
- the determination value calculation unit 34A calculates the number of maximum values of the histogram smoothed by the smoothing unit 341 as the determination value. At this time, the determination value calculation unit 34A counts the number of maximum values that are equal to or higher than a preset frequency.
- the determination unit 35 Based on the number of maximum values that are determination values calculated by the determination value calculation unit 34A and a preset threshold value, the determination unit 35 has uniform luminance in the small region or divided region to be determined. It is determined whether or not.
- the threshold value is the number of local maximum values and will be described as being set to 1 in the second embodiment. Specifically, the determination unit 35 determines whether or not the determination value is greater than a preset threshold value. For example, if the number of maximum values is 0 or 1, it is determined that the determination value is uniform. On the other hand, if the number of local maximum values exceeds 1, the determination unit 35 determines that the values are not uniform.
- the determination unit 35 determines, for example, that the histogram has the distribution curve L 1 as shown in FIG. 2 and is uniform if the frequency of the maximum value is equal to or higher than the set frequency, and is shown in FIG. if the histogram has a distribution curve L 100 as shown, determines not uniform.
- FIG. 11 is a flowchart showing an outline of processing performed by the ultrasound observation apparatus according to the second embodiment of the present invention, and is a flowchart for explaining attenuation rate setting processing in a region of interest.
- the ultrasonic observation device 3 receives an echo signal as a measurement result of the observation target by the ultrasonic transducer 21 from the ultrasonic endoscope 2 in the same manner as the flowchart shown in FIG. 8 (step S201).
- the region-of-interest setting unit 36 sets the region of interest in accordance with the preset setting conditions or the region-of-interest setting instruction received by the input unit 38 (step S202).
- the small region setting unit 361 divides the set region of interest and sets a plurality of small regions.
- step S203 the determination value calculation unit 34A generates a histogram regarding the frequency of luminance in the region set in the region of interest (step S203).
- the smoothing unit 341 smoothes the histogram (step S204).
- the determination value calculation unit 34A calculates a determination value of the physical quantity (step S205).
- the determination value in the first embodiment is the number of local maximum values in the smoothed histogram.
- the determination unit 35 compares the determination value of the determination target area with the threshold value stored in the storage unit 39 to determine whether the determination value is larger than the threshold value (step S206). If the determination value is larger than the threshold (step S206: Yes), the determination unit 35 determines that the target small region is not uniform, and proceeds to step S207.
- step S207 the area changing unit 362 determines whether the currently set size of the determination target area is the minimum setting area. At this time, if the region changing unit 362 determines that the determination target region is the minimum setting region (step S207: Yes), the region changing unit 362 proceeds to step S208.
- step S208 the region changing unit 362 sets the target region as a non-attenuation rate calculation region, and proceeds to step S212.
- the region changing unit 362 determines that the determination target region is not the minimum setting region (step S207: No)
- the region changing unit 362 further divides the target region (step S209).
- the determination value calculation unit 34A calculates a determination value for the divided area (step S210). After calculating the determination value, the control unit 40 returns to step S206 and performs the above-described determination process.
- step S206 when the determination unit 35 determines that the determination value is equal to or less than the threshold value (step S206: No), the determination unit 35 determines that the target small region is uniform, and proceeds to step S211.
- step S211 the calculation area setting unit 363 sets the set area as the attenuation rate calculation area. After setting the attenuation rate calculation area, the control unit 40 proceeds to step S212.
- step S212 the control unit 40 determines whether or not an undetermined area remains.
- the control unit 40 determines that an undetermined region remains (step S212: Yes)
- the control unit 40 returns to step S206 to perform the above-described processing on the undetermined region.
- the control unit 40 determines that no undetermined area remains (step S212: No)
- the control unit 40 proceeds to step S213.
- step S213 the attenuation rate setting unit 37 sets an attenuation rate for each of the set small region and / or divided region. Thereafter, the signal processing unit 32 performs attenuation correction of each region using the set attenuation rate (step S214).
- the image processing unit 33 acquires the B-mode reception data after the attenuation correction, and generates B-mode image data indicating the B-mode image that is an ultrasonic image (step S215). After generating the B-mode image data, the control unit 40 performs control to display on the display device 4 (step S216).
- Embodiment 2 of the present invention described above for each region set in the region of interest, it is determined whether the luminance is uniform based on the number of local maximum values in the histogram, and the determination result is The area is divided accordingly, and the attenuation rate is set for the area where the luminance is uniform. Accordingly, it is possible to appropriately set the attenuation rate in the region of interest while maintaining the size of the region of interest. By using the attenuation rate set in this way, a highly accurate ultrasonic image can be created.
- FIG. 12 is a block diagram showing a configuration of an ultrasonic diagnostic system including the ultrasonic observation apparatus according to Embodiment 3 of the present invention.
- An ultrasonic diagnostic system 1B shown in the figure includes an ultrasonic observation device 3B in place of the ultrasonic observation device 3 of the ultrasonic diagnostic system 1 described above.
- the ultrasonic observation apparatus 3B includes a determination value calculation unit 34B instead of the determination value calculation unit 34 described above.
- Other configurations are the same as those of the ultrasound diagnostic system 1.
- the determination value calculation unit 34B will be described.
- the determination value calculation unit 34B calculates a determination value of the calculation area using a preset physical quantity.
- luminance is used as a physical quantity to generate a histogram relating to the luminance frequency in a small area set in the region of interest or a divided area that is a divided area.
- the determination value calculation unit 34B calculates a physical quantity difference indicating the local maximum value and sets this difference as a determination value. For example, when the histogram illustrated in FIG. 10 is obtained, the determination value calculation unit 34B calculates the difference (Q 2 ⁇ Q 1 ) between the physical quantity Q 1 and the physical quantity Q 2 .
- the determination value calculation unit 34B sets the above-described difference to 0.
- the determination value calculation unit 34B calculates a difference between physical quantities corresponding to adjacent maximum values, and calculates a determination value based on each difference.
- the determination unit 35 determines whether the luminance of the determination target small region or divided region is uniform based on the difference between the physical quantities that are the determination values calculated by the determination value calculation unit 34B and a preset threshold value. Determine whether or not.
- the threshold value is a physical quantity difference that can be regarded as uniform. Specifically, the determination unit 35 determines whether or not the determination value is greater than a preset threshold value. For example, if the difference is equal to or less than the threshold value, the determination unit 35 determines that the value is uniform. On the other hand, the determination unit 35 determines that the difference is not uniform if the difference is larger than the threshold value.
- the attenuation rate setting process in the region of interest is performed according to steps S201, S202, and S204 to S216 of FIG.
- the determination value is read as a difference in physical quantity
- the threshold value is read as the threshold value described above.
- the histogram may be smoothed in combination with the second embodiment described above. In this case, the attenuation rate setting process in the region of interest is performed according to steps S201 to S216 in FIG.
- Embodiment 3 of the present invention described above for each region set in the region of interest, it is determined whether the luminance is uniform based on the difference in the physical quantity in the histogram, and according to the determination result. By dividing the area, the attenuation rate was set for the area where the brightness became uniform. Accordingly, it is possible to appropriately set the attenuation rate in the region of interest while maintaining the size of the region of interest. By using the attenuation rate set in this way, a highly accurate ultrasonic image can be created.
- FIG. 13 is a diagram for explaining small area setting processing of a region of interest performed by the ultrasound observation apparatus according to Embodiment 4 of the present invention.
- Embodiments 1 to 3 described above it has been described that the region is divided when it is determined that the luminance of the determination target region is not uniform. However, in Embodiment 4, the size of the region of interest is maintained. To move.
- the fourth embodiment will be described assuming that it has the same configuration as the above-described ultrasonic diagnostic system 1.
- the region change unit 362 Move.
- the region changing unit 362 moves the region of interest R in a preset direction and a preset number of pixels. For example, in FIG. 13, it is moved by several pixels in the left direction in the figure. Thereby, the arrangement of each small region in the B-mode image is also reset. In this manner, the area changing unit 362 performs a changing process that satisfies the conditions set to move the determination area.
- the determination value calculation unit 34 calculates a determination value for each small region of the region of interest R ′ after movement indicated by a one-dot chain line.
- the determination unit 35 determines whether each small region of the region of interest R ′ is uniform based on the calculated determination value.
- the region changing unit 362 determines that the region of interest to be set is uniform among the regions of interest that have been moved so far.
- the region of interest having the largest number of small regions may be used, or warning information may be output so as to reset the region of interest to the operator.
- the ultrasound observation apparatus 3 sets the attenuation rate and generates a B-mode image.
- Embodiment 4 of the present invention it is determined whether or not the luminance is uniform for each region set in the region of interest, and the region is moved according to the determination result, and is determined.
- the attenuation rate was set for each small area of the region of interest. Accordingly, it is possible to appropriately set the attenuation rate in the region of interest while maintaining the size of the region of interest. By using the attenuation rate set in this way, a highly accurate ultrasonic image can be created.
- Embodiments 1 to 4 described above can be combined as appropriate.
- the histogram may be smoothed, the difference between the maximum values of the histogram may be calculated, and the small area may be divided, or the small area may be moved in combination with the fourth embodiment.
- FIG. 14 is a block diagram showing a configuration of an ultrasonic diagnostic system provided with an ultrasonic observation apparatus according to Embodiment 5 of the present invention.
- An ultrasonic diagnostic system 1C shown in the figure includes an ultrasonic observation apparatus 3C instead of the ultrasonic observation apparatus 3 of the ultrasonic diagnostic system 1 described above.
- the ultrasonic observation device 3C includes an image processing unit 33A instead of the image processing unit 33 and a calculation unit 41 instead of the determination value calculation unit 34 in addition to the configuration of the ultrasonic observation device 3 described above.
- the calculation unit 41 functions as a determination value calculation unit.
- the transmission / reception unit 31 will be described as having the signal amplification unit 311. Other configurations are the same as those of the ultrasound diagnostic system 1.
- the transmission / reception unit 31, the image processing unit 33A, and the calculation unit 41 will be described.
- the transmission / reception unit 31 includes a signal amplification unit 311 that amplifies the echo signal.
- the signal amplification unit 311 performs STC (Sensitivity Time Control) correction in which an echo signal having a larger reception depth is amplified with a higher amplification factor.
- FIG. 15 is a diagram illustrating a relationship between the reception depth and the amplification factor in the amplification processing performed by the signal amplification unit 311.
- the reception depth z shown in FIG. 15 is an amount calculated based on the elapsed time from the reception start time of the ultrasonic wave. As shown in FIG.
- the amplification factor ⁇ (dB) increases linearly from ⁇ 0 to ⁇ th (> ⁇ 0 ) as the reception depth z increases.
- the amplification factor ⁇ (dB) takes a constant value ⁇ th when the reception depth z is equal to or greater than the threshold value z th .
- the value of the threshold value z th is such a value that the ultrasonic signal received from the observation target is almost attenuated and the noise becomes dominant. More generally, when the reception depth z is smaller than the threshold value z th , the amplification factor ⁇ may increase monotonously as the reception depth z increases.
- the relationship shown in FIG. 15 is stored in the storage unit 39 in advance.
- the transmission / reception unit 31 performs processing such as filtering on the echo signal amplified by the signal amplification unit 311 and then performs A / D conversion to generate RF data in the time domain. 41 and the storage unit 39.
- the transmission / reception unit 31 includes a plurality of beams for beam synthesis corresponding to the plurality of elements. A channel circuit is included.
- the various processing frequency bands of the echo signal in the signal amplifying unit 311 may be a wide band that substantially covers the linear response frequency band of the acoustoelectric conversion to the echo signal of the ultrasonic echo by the ultrasonic transducer 21. Accordingly, it is possible to perform accurate approximation when performing frequency spectrum approximation processing, which will be described later.
- the calculation unit 41 performs amplification correction on the RF data generated by the transmission / reception unit 31 so as to make the amplification factor ⁇ constant regardless of the reception depth, and fast Fourier transform on the amplified RF data. (FFT: Fast Fourier Transform) to perform frequency analysis to have a frequency analysis unit 412 that calculates a frequency spectrum, and a feature amount calculation unit 413 that calculates a feature amount of the frequency spectrum.
- the calculation unit 41 is realized by using a general-purpose processor such as a CPU or a dedicated integrated circuit that executes a specific function such as an ASIC or FPGA.
- FIG. 16 is a diagram illustrating the relationship between the reception depth and the amplification factor in the amplification correction processing performed by the amplification correction unit 411.
- the amplification rate ⁇ (dB) in the amplification correction process performed by the amplification correction unit 411 takes the maximum value ⁇ th ⁇ 0 when the reception depth z is zero, and the reception depth z is zero to the threshold value z. It decreases linearly until it reaches th0 , and is zero when the reception depth z is greater than or equal to the threshold zth0 .
- the amplification correction unit 411 amplifies and corrects the digital RF signal with the amplification factor determined as described above, thereby canceling the influence of the STC correction in the signal processing unit 32 and outputting a signal with a constant amplification factor ⁇ th. .
- the relationship between the reception depth z and the amplification factor ⁇ performed by the amplification correction unit 411 varies depending on the relationship between the reception depth and the amplification factor in the signal processing unit 32.
- STC correction is a correction process that eliminates the influence of attenuation from the amplitude of the analog signal waveform by amplifying the amplitude of the analog signal waveform uniformly over the entire frequency band and with a gain that monotonously increases with respect to the depth. is there. For this reason, when generating a B-mode image to be displayed by converting the amplitude of the echo signal into luminance, and when scanning a uniform tissue, the luminance value is constant regardless of the depth by performing STC correction. become. That is, an effect of eliminating the influence of attenuation from the luminance value of the B-mode image can be obtained.
- the amplification correction unit 411 Correct the gain.
- the frequency analysis unit 412 samples the RF data of each sound ray amplified and corrected by the amplification correction unit 411 at predetermined time intervals to generate sample data.
- the frequency analysis unit 412 calculates a frequency spectrum at a plurality of locations (data positions) on the RF data by performing FFT processing on the sample data group.
- the “frequency spectrum” means “frequency distribution of intensity at a certain reception depth z” obtained by performing FFT processing on a sample data group.
- “intensity” as used herein refers to parameters such as the voltage of the echo signal, the power of the echo signal, the sound pressure of the ultrasonic echo, the acoustic energy of the ultrasonic echo, the amplitude and time integral value of these parameters, and combinations thereof. Points to either.
- the frequency spectrum shows a tendency that varies depending on the properties of the living tissue scanned with ultrasonic waves. This is because the frequency spectrum has a correlation with the size, number density, acoustic impedance, and the like of the scatterer that scatters ultrasonic waves.
- the “characteristics of the biological tissue” referred to here includes, for example, malignant tumor (cancer), benign tumor, endocrine tumor, mucinous tumor, normal tissue, cyst, vascular vessel and the like.
- FIG. 17 is a diagram schematically illustrating a data array in one sound ray of an ultrasonic signal.
- a white or black rectangle means data at one sample point.
- the more data located on the right side which is the sample data from the deep portion of the case as measured along the ultrasonic transducer 21 to the sound ray SR k (see arrows in FIG. 17).
- the sound ray SR k is discretized at a time interval corresponding to a sampling frequency (for example, 50 MHz) in A / D conversion performed by the transmission / reception unit 31.
- a sample data group needs to have a power number of 2 data.
- a process for generating a normal sample data group is performed by inserting zero data in an insufficient amount. This point will be described in detail when the processing of the frequency analysis unit 412 is described (see FIG. 21).
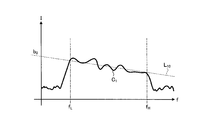
- FIG. 18 is a diagram illustrating an example of a frequency spectrum calculated by the frequency analysis unit 412.
- the horizontal axis is the frequency f.
- a regression line L 10 shown in FIG. 18 (hereinafter also simply referred to as a straight line L 10 ) will be described later.
- the curve and the straight line are composed of a set of discrete points.
- the lower limit frequency f L and the upper limit frequency f H of the frequency band used for the subsequent calculation are the frequency band of the ultrasonic transducer 21 and the frequency band of the pulse signal transmitted by the transmitting / receiving unit 31. It is a parameter determined based on the above.
- the frequency band determined by the lower limit frequency f L and the upper limit frequency f H is referred to as “frequency band F”.
- the feature amount calculation unit 413 calculates the feature amounts of the plurality of frequency spectra, respectively, and in each of a plurality of attenuation rate candidate values giving different attenuation characteristics when the ultrasonic wave propagates through the observation target, the feature amount of each frequency spectrum
- a correction feature amount of each frequency spectrum is calculated by performing attenuation correction that eliminates the influence of ultrasonic attenuation on the amount (hereinafter referred to as a pre-correction feature amount), and a plurality of attenuation rates are calculated using the correction feature amount.
- the optimal attenuation rate is set for the observation target from the candidate values.
- the feature amount calculation unit 413 approximates the frequency spectrum with a straight line to calculate the feature amount of the frequency spectrum before performing the attenuation correction process, and attenuates the pre-correction feature amount calculated by the approximation unit 413a.
- An attenuation correction unit 413b that calculates a feature amount by performing correction, and a plurality of attenuation rate candidate values based on statistical variation of the correction feature amount calculated for all frequency spectra by the attenuation correction unit 413b
- an optimum attenuation rate setting unit 413c for setting an optimum attenuation rate.
- the approximating unit 413a performs a regression analysis of the frequency spectrum in a predetermined frequency band and approximates the frequency spectrum with a linear expression (regression line), thereby calculating a pre-correction feature quantity characterizing the approximated primary expression. For example, in the case of the frequency spectrum C 1 shown in FIG. 18, the approximating unit 413a obtains a regression line L 10 by performing regression analysis in the frequency band F and approximating the frequency spectrum C 1 with a linear expression.
- (Mid-band fit) c 0 a 0 f M + b 0 is calculated as a feature amount before correction.
- the slope a 0 has a correlation with the size of the ultrasonic scatterer, and it is generally considered that the larger the scatterer, the smaller the slope.
- the intercept b 0 has a correlation with the size of the scatterer, the difference in acoustic impedance, the number density (concentration) of the scatterer, and the like. Specifically, the intercept b 0 has a larger value as the scatterer is larger, has a larger value as the difference in acoustic impedance is larger, and has a larger value as the number density of the scatterers is larger.
- the mid-band fit c 0 is an indirect parameter derived from the slope a 0 and the intercept b 0 and gives the intensity of the spectrum at the center in the effective frequency band. Therefore, the midband fit c 0 is considered to have a certain degree of correlation with the brightness of the B-mode image in addition to the size of the scatterer, the difference in acoustic impedance, and the number density of the scatterers. Note that the feature amount calculation unit 413 may approximate the frequency spectrum with a second-order or higher-order polynomial by regression analysis.
- the ultrasonic attenuation A (f, z) is attenuation that occurs while the ultrasonic waves reciprocate between the reception depth 0 and the reception depth z, and the intensity change before and after the reciprocation (difference in decibel expression). ).
- the attenuation amount A (f, z) is empirically known to be proportional to the frequency in a uniform tissue, and is expressed by the following equation (1).
- a (f, z) 2 ⁇ zf (1)
- the proportionality constant ⁇ is an amount called an attenuation rate.
- Z is the ultrasonic reception depth
- f is the frequency.
- the observation target is a living body
- a specific value of the attenuation rate ⁇ is determined according to the part of the living body.
- the unit of the attenuation rate ⁇ is, for example, dB / cm / MHz.
- the attenuation correction unit 413b performs attenuation correction according to the following equations (2) to (4) with respect to the pre-correction feature values (slope a 0 , intercept b 0 , midband fit c 0 ) extracted by the approximation unit 413a. By doing so, the correction feature amounts a, b, and c are calculated.
- the attenuation correction unit 413b performs correction with a larger correction amount as the ultrasonic reception depth z is larger.
- the correction related to the intercept is an identity transformation. This is because the intercept is a frequency component corresponding to a frequency of 0 (Hz) and is not affected by attenuation.
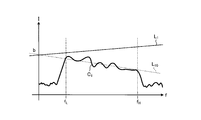
- FIG. 19 is a diagram illustrating a straight line having the correction feature amounts a, b, and c calculated by the attenuation correction unit 413b as parameters.
- the optimum attenuation rate setting unit 413c sets, as the optimum attenuation rate, an attenuation rate candidate value with the smallest statistical variation of the correction feature amount calculated for each attenuation rate candidate value for all frequency spectra by the attenuation correction unit 413b. Set. In this embodiment, dispersion is applied as an amount indicating statistical variation. In this case, the optimum attenuation rate setting unit 413c sets the attenuation rate candidate value that minimizes the variance as the optimum attenuation rate. Two of the three correction feature values a, b, and c described above are independent. In addition, the correction feature amount b does not depend on the attenuation rate. Therefore, when setting an optimal attenuation rate for the correction feature amounts a and c, the optimal attenuation rate setting unit 413c may calculate the variance of one of the correction feature amounts a and c.
- the correction feature amount used when the optimum attenuation rate setting unit 413c sets the optimum attenuation rate is preferably the same type as the correction feature amount used when the image processing unit 33A generates the feature amount image data. . That is, when the image processing unit 33A generates the feature amount image data using the inclination as the correction feature amount, the variance of the correction feature amount a is applied, and the image processing unit 33A uses the midband fit as the correction feature amount. When generating the quantity image data, it is more preferable to apply the variance of the correction feature quantity c. This is because the equation (1) that gives the attenuation amount A (f, z) is merely ideal, and the following equation (6) is more appropriate in reality.
- the reason why the optimum attenuation rate can be set based on statistical variation will be described.
- the feature amount is converged to a value unique to the observation target regardless of the distance between the observation target and the ultrasonic transducer 21, and the statistical variation is considered to be small.
- the attenuation rate candidate value that does not match the observation target is set as the optimal attenuation rate, the attenuation correction is excessive or insufficient, and thus the feature amount is shifted depending on the distance from the ultrasonic transducer 21. It is considered that the statistical variation of the feature amount is increased. Therefore, it can be said that the attenuation rate candidate value having the smallest statistical variation is the optimum attenuation rate for the observation target.
- the image processing unit 33A converts the amplitude of the echo signal into luminance and displays the feature amount calculated by the B-mode image data generation unit 331 that generates B-mode image data that is an ultrasound image to be displayed and the feature amount calculation unit 413.
- a feature amount image data generation unit 332 that generates feature amount image data to be displayed together with the B-mode image in association with the visual information.
- the B-mode image data generation unit 331 performs signal processing using known techniques such as gain processing and contrast processing on the B-mode reception data received from the signal processing unit 32, and displays an image on the display device 4.
- B-mode image data is generated by thinning out data according to the data step width determined according to the range.
- the B-mode image is a grayscale image in which values of R (red), G (green), and B (blue), which are variables when the RGB color system is adopted as a color space, are matched.
- the B-mode image data generation unit 331 performs coordinate transformation for rearranging the B-mode reception data from the signal processing unit 32 so that the scanning range can be spatially represented correctly, and then performs interpolation processing between the B-mode reception data. As a result, the gaps between the B-mode reception data are filled, and B-mode image data is generated.
- the B mode image data generation unit 331 outputs the generated B mode image data to the feature amount image data generation unit 332.
- the feature amount image data generation unit 332 generates feature amount image data by associating a hue with one of two feature amounts selected from inclination, intercept, and midband fit, and by associating light and dark with the other. May be.
- visual information related to the feature amount for example, variables in a color space constituting a predetermined color system such as hue, saturation, brightness, luminance value, R (red), G (green), and B (blue) are included. Can be mentioned.
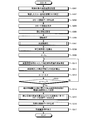
- FIG. 20 is a flowchart showing an outline of processing performed by the ultrasonic observation apparatus 3C having the above configuration.
- the ultrasonic observation apparatus 3C receives an echo signal as a measurement result of an observation target by the ultrasonic transducer 21 from the ultrasonic endoscope 2 (step S301).
- the signal amplifying unit 311 that has received the echo signal from the ultrasonic transducer 21 amplifies the echo signal (step S302).
- the signal amplifying unit 311 performs amplification (STC correction) of the echo signal based on, for example, the relationship between the amplification factor and the reception depth shown in FIG.
- the B-mode image data generation unit 331 generates B-mode image data using the echo signal amplified by the signal amplification unit 311 and outputs the B-mode image data to the display device 4 (step S303).
- the display device 4 that has received the B-mode image data displays a B-mode image corresponding to the B-mode image data (step S304).
- step S305 following step S304 the region-of-interest setting unit 36 sets a region of interest in accordance with a preset setting condition or a region-of-interest setting instruction received by the input unit 38.
- the amplification correction unit 411 performs amplification correction on the signal output from the transmission / reception unit 31 so that the amplification factor is constant regardless of the reception depth (step S306).
- the amplification correction unit 411 performs amplification correction so that, for example, the relationship between the amplification factor and the reception depth illustrated in FIG. 16 is established.
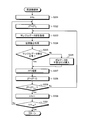
- FIG. 21 is a flowchart showing an overview of the processing executed by the frequency analysis unit 412 in step S307.
- the frequency analysis processing will be described in detail with reference to the flowchart shown in FIG.
- the frequency analysis unit 412 sets a counter k for identifying a sound ray to be analyzed as k 0 (step S321).
- the frequency analysis unit 412 sets an initial value Z (k) 0 of a data position (corresponding to a reception depth) Z (k) representing a series of data groups (sample data group) acquired for the FFT calculation.
- Step S322 For example, FIG. 17 shows a case where the eighth data position of the sound ray SR k is set as the initial value Z (k) 0 as described above.
- the frequency analysis unit 412 acquires a sample data group (step S323), and causes the window function stored in the storage unit 39 to act on the acquired sample data group (step S324).
- the window function By applying the window function to the sample data group in this way, it is possible to avoid the sample data group from becoming discontinuous at the boundary and to prevent the occurrence of artifacts.
- the frequency analysis unit 412 determines whether or not the sample data group at the data position Z (k) is a normal data group (step S325).
- the sample data group needs to have the number of powers of two.
- the number of data in the normal sample data group is 2 n (n is a positive integer).
- the sample data groups F 1 , F 2 , F 3 ,..., F k-1 are all normal.
- step S325 If the result of determination in step S325 is that the sample data group at data position Z (k) is normal (step S325: Yes), the frequency analysis unit 412 proceeds to step S327 described later.
- step S325 when the sample data group at the data position Z (k) is not normal (step S325: No), the frequency analysis unit 412 inserts zero data by the deficiency to obtain a normal sample data group. Generate (step S326). A window function is applied to the sample data group determined to be not normal in step S325 (for example, the sample data group F K in FIG. 17) before adding zero data. For this reason, even if zero data is inserted into the sample data group, discontinuity of data does not occur. After step S326, the frequency analysis unit 412 proceeds to step S327 described later.
- step S327 the frequency analysis unit 412 obtains a frequency spectrum that is a frequency distribution of amplitude by performing an FFT operation using the sample data group (step S327).
- the frequency analysis unit 412 changes the data position Z (k) by the step width D (step S328).
- the step width D is stored in the storage unit 39 in advance.
- the step width D preferably matches the data step width used when the B-mode image data generation unit 331 generates the B-mode image data. However, if the amount of calculation in the frequency analysis unit 412 is desired to be reduced, the step width D A value larger than the data step width may be set as the width D.
- the frequency analysis unit 412 determines whether or not the data position Z (k) is larger than the maximum value Z (k) max in the sound ray SR k (step S329).
- the frequency analysis unit 412 increments the counter k by 1 (step S330). This means that the processing is shifted to the next sound ray.
- the frequency analysis unit 412 returns to step S323.
- the frequency analysis unit 412 performs an FFT operation on [(Z (k) max ⁇ Z (k) 0 +1) / D + 1] sample data groups for the sound ray SR k .
- [X] represents the maximum integer not exceeding X.
- the frequency analysis unit 412 determines whether or not the counter k is greater than the maximum value k max (step S331). When the counter k is larger than the maximum value k max (step S331: Yes), the frequency analysis unit 412 ends a series of frequency analysis processing. On the other hand, when the counter k is equal to or less than the maximum value k max (step S331: No), the frequency analysis unit 412 returns to step S322.
- the maximum value k max is a value arbitrarily input by a user such as an operator through the input unit 38 or a value preset in the storage unit 39.
- the frequency analysis unit 412 performs a plurality of FFT operations for each of (k max ⁇ k 0 +1) sound rays in the analysis target region.
- the result of the FFT operation is stored in the storage unit 39 together with the reception depth and the reception direction.
- the feature amount calculation unit 413 calculates pre-correction feature amounts of a plurality of frequency spectra, and gives different attenuation characteristics when ultrasonic waves propagate through the observation target.
- the correction feature quantity of each frequency spectrum is calculated by performing attenuation correction that eliminates the influence of ultrasonic attenuation on the pre-correction feature quantity of each frequency spectrum, and the correction feature
- the optimum attenuation rate is set for the observation target from among a plurality of attenuation rate candidate values using the amount (steps S308 to S314).
- steps S308 to S314 will be described in detail.
- the approximating unit 413a calculates a pre-correction feature amount corresponding to each frequency spectrum by performing regression analysis on each of the plurality of frequency spectra calculated by the frequency analyzing unit 412 (step S308). Specifically, the approximating unit 413a approximates each frequency spectrum with a linear expression by regression analysis, and calculates a slope a 0 , an intercept b 0 , and a midband fit c 0 as pre-correction feature values. For example, the straight line L 10 shown in FIG. 18, the approximate portion 413a is the regression line approximated by the regression analysis for the frequency spectrum C 1 frequency band F.
- the optimal attenuation factor setting unit 413c sets the initial value alpha 0 the value of the predetermined attenuation factor candidate value alpha be applied when performing attenuation correction to be described later.
- the initial value ⁇ 0 may be stored in advance in the storage unit 39, and the optimum attenuation rate setting unit 413c may refer to the storage unit 39.
- the attenuation correction unit 413b calculates a correction feature amount by performing attenuation correction with the attenuation rate candidate value as ⁇ for the pre-correction feature amount approximated by the approximation unit 413a with respect to each frequency spectrum, and attenuation It stores in the memory
- f sp is the data sampling frequency
- v s is the sound speed
- D is the data step width
- n is the number of data steps from the first data of the sound ray up to the data position of the amplitude data group to be processed.
- the data sampling frequency f sp is 50 MHz
- the sound velocity vs is 1530 m / sec
- the optimum attenuation rate setting unit 413c calculates a variance of representative correction feature amounts among a plurality of correction feature amounts obtained by the attenuation correction unit 413b performing attenuation correction on each frequency spectrum, and attenuation rate candidate values It is stored in the storage unit 39 in association with ⁇ (step S311).
- the optimum attenuation rate setting unit 413c calculates, for example, the variance of the correction feature amount c.
- the optimum attenuation rate setting unit 413c applies the variance of the corrected feature amount a when the feature amount image data generation unit 332 generates the feature amount image data using the slope, and uses the midband fit.
- the optimum attenuation rate setting unit 413c increases the value of the attenuation rate candidate value ⁇ by ⁇ (step S312), and compares the increased attenuation rate candidate value ⁇ with a predetermined maximum value ⁇ max (step S312). Step S313).
- the ultrasound observation apparatus 3C proceeds to step S314.
- the ultrasound observation apparatus 3C returns to step S310.
- the optimum attenuation rate setting unit 413c refers to the variance for each attenuation rate candidate value stored in the storage unit 39, and sets the attenuation rate candidate value having the minimum variance as the optimum attenuation rate (step S314). .
- the ultrasound observation apparatus 3C uses this attenuation rate as a physical quantity to calculate the attenuation rate of the small region or divided region set in the region of interest, and to calculate the attenuation rate.
- B-mode image data is generated (step S315).
- the ultrasound observation apparatus 3C performs, for example, the processing of steps S105 to S115 in the flowchart shown in FIG.
- the determination unit 35 generates a histogram of the correction feature amount c for each region in the region of interest using the correction feature amount c as a physical amount, determines whether the target region is uniform, and the region change unit 362 and the calculation area setting unit 363 set an area based on the determination result.
- the attenuation rate setting unit 37 sets the attenuation rate of each region, and the B-mode image data generation unit 331 generates B-mode image data that is attenuation-corrected with the set attenuation rate.
- the feature amount image data generation unit 332 performs visual information (in relation to each pixel in the B mode image data generated by the B mode image data generation unit 331 in step S315, associated with the corrected feature amount calculated in step S310.
- the feature amount image data is generated by superimposing the hue) and adding information on the optimum attenuation rate (step S316).
- step S317 following step S316, the display device 4 displays a feature amount image corresponding to the feature amount image data generated by the feature amount image data generation unit 332 under the control of the control unit 40.
- FIG. 22 is a diagram schematically illustrating a display example of the feature amount image on the display device 4.
- a feature image 201 shown in the figure includes a superimposed image display unit 202 that displays an image in which visual information related to a feature amount is superimposed on a B-mode image, and an information display unit 203 that displays identification information of an observation target. .
- the information display unit 203 may further display feature amount information, attenuation rate information, approximate expression information, image information such as gain and contrast, and the like.
- a B-mode image corresponding to the feature amount image may be displayed side by side with the feature amount image.
- the attenuation rate calculated by frequency analysis is used as a physical quantity, and it is determined whether the physical quantity is uniform for each region set in the region of interest.
- the area is divided according to the above, and the attenuation rate is set for the area where the physical quantity is uniform. Accordingly, it is possible to appropriately set the attenuation rate in the region of interest while maintaining the size of the region of interest. By using the attenuation rate set in this way, a highly accurate ultrasonic image can be created.
- an optimum attenuation rate is set for the observation target from among a plurality of attenuation rate candidate values that give different attenuation characteristics when ultrasonic waves propagate through the observation target, and the optimum attenuation rate is set. Since the feature quantity of each of the multiple frequency spectra is calculated by performing attenuation correction using the attenuation factor, the attenuation characteristic of the ultrasonic wave suitable for the observation target can be obtained by simple calculation. It can be used for observation.
- the optimum attenuation rate is set based on the statistical variation of the correction feature value obtained by attenuation-correcting each frequency spectrum, it is compared with the conventional technique that performs fitting with a plurality of attenuation models. Thus, the amount of calculation can be reduced.
- the optimum attenuation rate setting unit 413c sets the accumulated attenuation rate obtained by accumulating the attenuation rate up to the target data along the depth direction corresponding to the reception depth as the optimum attenuation rate. You may do it.
- FIG. 23 is a flowchart illustrating an outline of processing performed by the ultrasound observation apparatus according to the first modification of the fifth embodiment of the present invention.
- the ultrasonic diagnostic system according to the first modification is the same as the ultrasonic diagnostic system 1C described above. Further, in the first modification, the display of the feature amount image is performed in the same flow as in FIG. 20 except that the processing content of step S315 shown in FIG. 20 is different.
- processing different from that of the fifth embodiment (calculation of the attenuation rate of the region of interest and generation of B-mode image data based on the attenuation rate) will be described.
- step S401 the calculation unit 41 generates a histogram relating to the frequency ratio of the feature amount (for example, the corrected feature amount c) of each small region.
- the calculation unit 41 sets a determination region centered on the feature amount corresponding to the peak of the histogram (step S402).
- 24 and 25 are diagrams showing the frequency distribution of the frequency ratio with respect to the feature amount.
- 24 and 25 show curves L 2 and L 101 obtained by approximating the frequency ratio histogram of each feature amount.
- the calculation unit 41 has a region centered around the feature value ⁇ M corresponding to the peak of the histogram (from the feature value ⁇ L to the feature value ⁇ H in FIGS. 24 and 25). Set in the judgment area. Note that the range of the determination region may be set for each part, or may be set by the user.
- step S403 the ratio of the frequency sum of the determination area to the total frequency is calculated. Specifically, the calculation unit 41 calculates the sum of the frequencies (frequency sum) of the set determination areas and the sum of all frequencies (total frequency). Thereafter, the calculation unit 41 calculates the ratio of the frequency sum to the total frequency.
- the correction feature quantity c is a physical quantity
- the ratio of the frequency sum calculated in step S403 is a determination value.
- step S404 following step S403, the determination unit 35 compares the determination value (ratio of frequency sums) of the determination target region with the threshold value stored in the storage unit 39, and the determination value is equal to or greater than the threshold value. Determine whether or not. Determining unit 35, when determining that the determination value is smaller than the threshold (step S404: No), (see, for example, curve L 101 shown in FIG. 25) determines that the small region of interest is not uniform, the step S405 Transition.
- the threshold value used in step S403 is set based on a past treatment example, for example.
- step S405 the area changing unit 362 determines whether the currently set size of the determination target area is the minimum setting area. At this time, if the region changing unit 362 determines that the determination target region is the minimum setting region (step S405: Yes), the region changing unit 362 proceeds to step S406.
- step S406 the region changing unit 362 sets the target region as a non-attenuation rate calculation region, and proceeds to step S410.
- step S405 determines that the determination target region is not the minimum setting region.
- step S407 the area changing unit 362 further divides the target area in the same manner as in step S108. Thereafter, the calculation unit 41 calculates a determination value for the divided region (step S408). After calculating the determination value, the control unit 40 returns to step S404 and performs the above-described determination process.
- step S404 determines that the determination value is greater than or equal to the threshold value (step S404: Yes)
- step S409 the calculation area setting unit 363 sets the set area as the attenuation rate calculation area. After setting the attenuation rate calculation region, the control unit 40 proceeds to step S410.
- step S410 the control unit 40 determines whether or not an undetermined area remains.
- step S410: Yes the control unit 40 returns to step S404 and causes the above-described processing to be performed on the undetermined region.
- step S410: No the control unit 40 proceeds to step S411.
- step S411 the attenuation rate setting unit 37 sets an attenuation rate for each of the small region and / or the divided region set in the attenuation rate calculation region. Thereafter, the signal processing unit 32 performs attenuation correction of each region using the set attenuation rate (step S412).
- the image processing unit 33A acquires the B-mode reception data after attenuation correction, and generates B-mode image data including a B-mode image that is an ultrasonic image (step S413). After the B-mode image data is generated in step S413, the control unit 40 returns to step S316 and executes the above-described processing.
- the frequency ratio calculated based on the feature value is used as a physical quantity, and it is determined whether the physical quantity is uniform for each region set in the region of interest.
- the area is divided accordingly, and the attenuation rate is set for the area where the physical quantity is uniform. Accordingly, it is possible to appropriately set the attenuation rate in the region of interest while maintaining the size of the region of interest. By using the attenuation rate set in this way, a highly accurate ultrasonic image can be created.
- FIG. 26 is a flowchart showing an outline of processing performed by the ultrasonic observation apparatus according to the second modification of the fifth embodiment of the present invention.
- the ultrasonic diagnostic system according to the second modification is the same as the ultrasonic diagnostic system 1C described above.
- the display of the feature amount image is performed in the same flow as in FIG. 20 except that the processing content of step S315 shown in FIG. 20 is different.
- processing different from that of the fifth embodiment (calculation of the attenuation rate of the region of interest and generation of B-mode image data based on the attenuation rate) will be described.
- step S501 the calculation unit 41 generates a histogram relating to the frequency ratio of the feature amount (for example, the corrected feature amount c) of each small region in the same manner as in step S401 described above.
- the calculation unit 41 sets a determination region centered on the feature amount corresponding to the peak of the histogram (step S502).
- the value (peak value) of the frequency ratio outside the determination region is the determination value.
- step S503 when there is a peak outside the determination region, the determination unit 35 compares the peak value (determination value) with the threshold value stored in the storage unit 39, and the determination value is the threshold value. It is determined whether this is the case. If the determination unit 35 determines that the determination value is equal to or greater than the threshold (step S503: Yes), the determination unit 35 determines that the target small region is not uniform, and proceeds to step S504.
- the threshold value used in step S503 is set based on, for example, past treatment examples.
- FIG. 27 is a diagram illustrating a frequency distribution of a frequency ratio with respect to a feature amount.
- FIG. 27 shows a curve L 102 obtained by approximating a histogram of frequency ratios for each feature amount.
- a curve L 102 shown in FIG. 27 has a peak with a frequency ratio larger than the frequency ratio threshold value S TH in a feature quantity larger than the feature quantity ⁇ H that is outside the determination region. In this case, the determination unit 35 determines that the target small region is not uniform.
- step S503 the area changing unit 362 determines whether the currently set size of the determination target area is the minimum setting area. At this time, if the region changing unit 362 determines that the determination target region is the minimum setting region (step S503: Yes), the region changing unit 362 proceeds to step S505.
- step S505 the region changing unit 362 sets the target region as a non-attenuation rate calculation region, and proceeds to step S510.
- step S504 determines that the determination target region is not the minimum setting region (step S504: No)
- step S504 determines that the determination target region is not the minimum setting region
- step S506 the area changing unit 362 further divides the target area in the same manner as in step S108. Thereafter, the calculation unit 41 generates a histogram as described above for the divided region (step S507), and sets a determination region for the histogram (step S508). After setting the determination area, the control unit 40 returns to step S503 and performs the above-described determination process.
- step S504 when the determination unit 35 determines that the determination value (peak value) is smaller than the threshold value or that no peak exists (step S504: Yes), the determination unit 35 determines that the target small region is uniform. (see, for example, curve L 2 shown in FIG. 24), the process proceeds to step S509. Note that the determination unit 35 determines that the determination value is smaller than the threshold value if there is no peak outside the determination region.
- step S509 the calculation area setting unit 363 sets the set area as the attenuation rate calculation area. After setting the attenuation rate calculation region, the control unit 40 proceeds to step S510.
- step S510 the control unit 40 determines whether or not an undetermined area remains. If the control unit 40 determines that an undetermined area remains (step S510: Yes), the control unit 40 returns to step S503 and causes the above-described processing to be performed on the undetermined area. On the other hand, when the control unit 40 determines that no undetermined area remains (No in step S510), the control unit 40 proceeds to step S511.
- step S511 the attenuation rate setting unit 37 sets the attenuation rate for each of the small region and / or the divided region set in the attenuation rate calculation region. Thereafter, the signal processing unit 32 performs attenuation correction of each region using the set attenuation rate (step S512).
- the image processing unit 33A acquires the B-mode reception data after attenuation correction, and generates B-mode image data including a B-mode image that is an ultrasonic image (step S513). After the B-mode image data is generated in step S513, the control unit 40 returns to step S316 and executes the above-described processing.
- the frequency ratio is calculated based on the feature amount, and the physical value is uniform for each region set in the region of interest with the peak value outside the determination region as the physical amount. It is determined whether or not the region is divided according to the determination result, and the attenuation rate is set for the region where the physical quantity is uniform. Accordingly, it is possible to appropriately set the attenuation rate in the region of interest while maintaining the size of the region of interest. By using the attenuation rate set in this way, a highly accurate ultrasonic image can be created.
- the correction feature quantity c is described as a physical quantity.
- the luminance may be used as a physical quantity.
- the present invention should not be limited only by the embodiment described above.
- the case where the observation target is a living tissue has been described as an example, but the present invention can also be applied to an industrial endoscope that observes the characteristics of a material.
- the ultrasonic observation apparatus according to the present invention can be applied to both inside and outside the body. In addition to ultrasonic waves, infrared signals or the like may be irradiated to transmit / receive signals to be observed.
- the determination unit 35 determines whether or not the target region is uniform using the correction feature quantity related to the luminance or frequency feature quantity in the B-mode image as a physical quantity.
- the physical quantity includes a corrected feature quantity a related to the frequency feature quantity, a spectrum intensity, a value correlated with the spectrum intensity, a change value in elastography, a sound speed, and the like.
- the region of interest setting unit 36 has been described as having the small region setting unit 361 and the region changing unit 362.
- the region of interest setting unit 36, the small region, The setting unit 361 and the region changing unit 362 may be independent from each other.
- the ultrasonic observation apparatus it may be configured by connecting circuits having respective functions by a bus, or may be configured such that a part of the functions is built in the circuit structure of other functions. .
- an ultrasonic endoscope having an optical system such as a light guide has been described as an ultrasonic probe.
- the present invention is not limited to an ultrasonic endoscope, and does not include an imaging optical system and an imaging element.
- An ultrasonic probe may be used.
- a thin ultrasonic miniature probe without an optical system may be applied as the ultrasonic probe.
- Ultrasonic miniature probes are usually inserted into the biliary tract, bile duct, pancreatic duct, trachea, bronchi, urethra, ureter, and used to observe surrounding organs (pancreas, lung, prostate, bladder, lymph nodes, etc.).
- an external ultrasonic probe that irradiates ultrasonic waves from the body surface of the subject may be applied.
- the extracorporeal ultrasonic probe is usually used in direct contact with the body surface when observing an abdominal organ (liver, gallbladder, bladder), breast (particularly mammary gland), and thyroid gland.
- the ultrasonic vibrator may be a linear vibrator, a radial vibrator, or a convex vibrator.
- the scanning area is rectangular (rectangular, square), and when the ultrasonic transducer is a radial type transducer or a convex type transducer, the scanning area is Has a fan shape or a ring shape.
- the ultrasonic observation apparatus, the operation method of the ultrasonic observation apparatus, and the operation program of the ultrasonic observation apparatus according to the present invention appropriately set the attenuation rate in the region of interest while maintaining the size of the region of interest. Useful for setting.
Landscapes
- Health & Medical Sciences (AREA)
- Life Sciences & Earth Sciences (AREA)
- Engineering & Computer Science (AREA)
- Medical Informatics (AREA)
- Public Health (AREA)
- General Health & Medical Sciences (AREA)
- Biomedical Technology (AREA)
- Pathology (AREA)
- Heart & Thoracic Surgery (AREA)
- Radiology & Medical Imaging (AREA)
- Veterinary Medicine (AREA)
- Animal Behavior & Ethology (AREA)
- Surgery (AREA)
- Physics & Mathematics (AREA)
- Molecular Biology (AREA)
- Biophysics (AREA)
- Nuclear Medicine, Radiotherapy & Molecular Imaging (AREA)
- Computer Vision & Pattern Recognition (AREA)
- Data Mining & Analysis (AREA)
- Databases & Information Systems (AREA)
- Epidemiology (AREA)
- Physiology (AREA)
- Primary Health Care (AREA)
- Ultra Sonic Daignosis Equipment (AREA)
Abstract
本発明に係る超音波観測装置は、判定対象の小領域内の物理量が一様であると判定された場合に減衰率算出対象領域として設定し、判定対象の小領域内の物理量が一様でないと判定された場合に予め設定された条件にしたがって領域を変更し、変更後の領域について、ヒストグラムをそれぞれ生成して判定値を算出するようにしたので、関心領域の大きさを維持しつつ、この関心領域における減衰率を適切に設定することができる。
Description
本発明は、超音波を用いて観測対象の組織を観測する超音波観測装置、超音波観測装置の作動方法および超音波観測装置の作動プログラムに関する。
観測対象である生体組織または材料の特性を観測するために、超音波を適用することがある。具体的には、観測対象に超音波を送信し、その観測対象によって反射された超音波エコーに基づいて超音波画像を生成し、該生成した超音波画像を表示することで、観測対象の観測を行う。
超音波画像を用いて診断を行う際、超音波画像内において、詳細に観察を行うための領域(以下、関心領域という)を設定することがある(例えば、特許文献1を参照)。関心領域では、減衰補正を行うなどして、関心領域内の画像を高精度化している。特許文献1では、関心領域内に複数の評価領域を設定し、各評価領域について、予め設定されている物理量を用いて評価値を算出し、この評価値に基づいて関心領域の再設定を行っている。特許文献1では、評価値と閾値とを比較して評価領域の観測精度の高さを判別し、観測精度が低いと判別された評価領域を除外することによって関心領域を再設定している。
特許文献1は、上述したように観測精度が低いと判定された評価領域を関心領域から除外するものであり、観測精度が低い領域については減衰率が設定されない。そのため、特許文献1では、最初に設定された関心領域を変えずに、かつその関心領域について適切に減衰率を設定することができなかった。
本発明は、上記に鑑みてなされたものであって、関心領域の大きさを維持しつつ、この関心領域における減衰率を適切に設定することができる超音波観測装置、超音波観測装置の作動方法および超音波観測装置の作動プログラムを提供することを目的とする。
上述した課題を解決し、目的を達成するために、本発明に係る超音波観測装置は、観測対象へ超音波を送信し、該観測対象で反射された超音波を受信する超音波振動子から受信した超音波信号に基づく超音波画像データを生成する超音波観測装置であって、前記超音波画像データに応じた超音波画像内において設定された関心領域に対して、予め設定された条件にしたがって前記関心領域を分割した複数の小領域を設定する小領域設定部と、予め設定された物理量をもとに各小領域のヒストグラムを生成し、該ヒストグラムに基づいて、前記小領域内の物理量が一様であるか否かを判定するための判定値を前記小領域ごとに算出する判定値算出部と、前記判定値と、予め設定されている閾値とをもとに、前記小領域内の物理量が一様であるか否かを判定する判定部と、前記判定部により判定対象の前記小領域内の物理量が一様でないと判定された場合、予め設定された条件にしたがって当該小領域を変更する領域変更部と、前記判定部により判定対象の前記小領域内の物理量が一様であると判定された場合、当該小領域を減衰率算出対象領域として設定する領域設定部と、前記減衰率算出対象領域の減衰率を設定する減衰率設定部と、を備えることを特徴とする。
本発明に係る超音波観測装置は、上記発明において、前記領域変更部は、前記判定部によって判定対象の前記小領域内の物理量が一様でないと判定された場合に、当該小領域を分割して複数の分割領域を設定することを特徴とする。
本発明に係る超音波観測装置は、上記発明において、前記判定値算出部による前記判定値の算出、前記判定部による判定、および前記領域変更部による前記分割領域の設定を、前記判定部によって一様であると判定されるか、または、前記分割領域の大きさが、予め設定されている最小設定領域の大きさとなるまで繰り返すことを特徴とする。
本発明に係る超音波観測装置は、上記発明において、前記減衰率設定部は、前記最小設定領域の大きさの前記分割領域内の物理量が、前記判定部により一様ではないと判定された場合、該分割領域の周囲の前記小領域または前記分割領域の減衰率に基づいて、当該分割領域の減衰率を設定することを特徴とする。
本発明に係る超音波観測装置は、上記発明において、前記領域変更部は、前記判定部によって一様でないと判定された前記小領域を含む場合に、前記関心領域を予め設定された方向に移動させることを特徴とする。
本発明に係る超音波観測装置は、上記発明において、前記判定値算出部は、前記ヒストグラムのばらつきを算出し、前記判定部は、前記ばらつきと、前記ばらつきに関して予め設定されている閾値とをもとに、判定対象の前記小領域内の物理量が一様であるか否かを判定することを特徴とする。
本発明に係る超音波観測装置は、上記発明において、前記判定値算出部は、前記ヒストグラムの極大値の数を算出し、前記判定部は、前記極大値の数と、前記極大値の数に関して予め設定されている閾値とをもとに、判定対象の前記小領域内の物理量が一様であるか否かを判定することを特徴とする。
本発明に係る超音波観測装置は、上記発明において、前記判定値算出部は、前記ヒストグラムが複数の極大値を有する場合、各極大値に対応する物理量の差を算出し、前記判定部は、前記物理量の差と、前記物理量の差に関して予め設定されている閾値とをもとに、判定対象の前記小領域内の物理量が一様であるか否かを判定することを特徴とする。
本発明に係る超音波観測装置の作動方法は、超音波信号に基づいて超音波画像データを生成する超音波観測装置の作動方法であって、小領域設定部が、前記超音波画像データに応じた超音波画像内において設定された関心領域に対して、予め設定された条件にしたがって前記関心領域を分割した複数の小領域を設定する第1領域設定ステップと、判定値算出部が、予め設定された物理量をもとに各小領域のヒストグラムを生成し、該ヒストグラムに基づいて、前記小領域内の物理量が一様であるか否かを判定するための判定値を前記小領域ごとに算出する判定値算出ステップと、判定部が、前記判定値と、予め設定されている閾値とをもとに、前記小領域内の物理量が一様であるか否かを判定する判定ステップと、領域変更部が、前記判定ステップにより判定対象の前記小領域内の物理量が一様でないと判定された場合、予め設定された条件にしたがって当該小領域を変更する領域変更ステップと、領域設定部が、前記判定ステップにより判定対象の前記小領域内の物理量が一様であると判定された場合、当該小領域を減衰率算出対象領域として設定する第2領域設定ステップと、減衰率設定部が、前記減衰率算出対象領域の減衰率を設定する減衰率設定ステップと、を含むことを特徴とする。
本発明に係る超音波観測装置の作動プログラムは、超音波信号に基づいて超音波画像データを生成する超音波観測装置の作動プログラムであって、小領域設定部が、前記超音波画像データに応じた超音波画像内において設定された関心領域に対して、予め設定された条件にしたがって前記関心領域を分割した複数の小領域を設定する第1領域設定手順と、判定値算出部が、予め設定された物理量をもとに各小領域のヒストグラムを生成し、該ヒストグラムに基づいて、前記小領域内の物理量が一様であるか否かを判定するための判定値を前記小領域ごとに算出する判定値算出手順と、判定部が、前記判定値と、予め設定されている閾値とをもとに、前記小領域内の物理量が一様であるか否かを判定する判定手順と、領域変更部が、前記判定手順により判定対象の前記小領域内の物理量が一様でないと判定された場合、予め設定された条件にしたがって当該小領域を変更する領域変更手順と、領域設定部が、前記判定手順により判定対象の前記小領域内の物理量が一様であると判定された場合、当該小領域を減衰率算出対象領域として設定する第2領域設定手順と、減衰率設定部が、前記減衰率算出対象領域の減衰率を設定する減衰率設定手順と、を前記超音波観測装置に実行させることを特徴とする。
本発明によれば、関心領域の大きさを維持しつつ、この関心領域における減衰率を適切に設定することができるという効果を奏する。
以下、添付図面を参照して、本発明を実施するための形態(以下、「実施の形態」という)を説明する。
(実施の形態1)
図1は、本発明の実施の形態1に係る超音波観測装置を備えた超音波診断システムの構成を示すブロック図である。同図に示す超音波診断システム1は、観測対象である被検体へ超音波を送信し、該被検体で反射された超音波を受信する超音波内視鏡2と、超音波内視鏡2が取得した超音波信号に基づいて超音波画像を生成する超音波観測装置3と、超音波観測装置3が生成した超音波画像を表示する表示装置4と、を備える。
図1は、本発明の実施の形態1に係る超音波観測装置を備えた超音波診断システムの構成を示すブロック図である。同図に示す超音波診断システム1は、観測対象である被検体へ超音波を送信し、該被検体で反射された超音波を受信する超音波内視鏡2と、超音波内視鏡2が取得した超音波信号に基づいて超音波画像を生成する超音波観測装置3と、超音波観測装置3が生成した超音波画像を表示する表示装置4と、を備える。
超音波内視鏡2は、その先端部に、超音波観測装置3から受信した電気的なパルス信号を超音波パルス(音響パルス)に変換して被検体へ照射するとともに、被検体で反射された超音波エコーを電圧変化で表現する電気的なエコー信号(超音波信号)に変換して出力する超音波振動子21を有する。超音波振動子21は、ラジアル型の振動子により実現される。超音波内視鏡2は、超音波振動子21をメカ的に走査させるものであってもよいし、超音波振動子21として複数の素子をアレイ状に設け、送受信にかかわる素子を電子的に切り替えたり、各素子の送受信に遅延をかけたりすることで、電子的に走査させるものであってもよい。
超音波内視鏡2は、通常は撮像光学系および撮像素子を有しており、被検体の消化管(食道、胃、十二指腸、大腸)、または呼吸器(気管、気管支)へ挿入され、消化管、呼吸器やその周囲臓器(膵臓、胆嚢、胆管、胆道、リンパ節、縦隔臓器、血管等)を撮像することが可能である。また、超音波内視鏡2は、撮像時に被検体へ照射する照明光を導くライトガイドを有する。このライトガイドは、先端部が超音波内視鏡2の被検体への挿入部の先端まで達している一方、基端部が照明光を発生する光源装置に接続されている。
超音波観測装置3は、送受信部31と、信号処理部32と、画像処理部33と、判定値算出部34と、判定部35と、関心領域設定部36と、減衰率設定部37と、入力部38と、記憶部39と、制御部40と、を備える。
送受信部31は、超音波内視鏡2と電気的に接続され、所定の波形および送信タイミングに基づいて高電圧パルスからなる送信信号(パルス信号)を超音波振動子21へ送信するとともに、超音波振動子21から電気的な受信信号であるエコー信号を受信してデジタルの高周波(RF:Radio Frequency)信号のデータ(以下、RFデータという)を生成、出力する。
送受信部31が送信するパルス信号の周波数帯域は、超音波振動子21におけるパルス信号の超音波パルスへの電気音響変換の線型応答周波数帯域をほぼカバーする広帯域にするとよい。
送受信部31は、制御部40が出力する各種制御信号を超音波内視鏡2に対して送信するとともに、超音波内視鏡2から識別用のIDを含む各種情報を受信して制御部40へ送信する機能も有する。
信号処理部32は、送受信部31から受信したRFデータをもとにデジタルのBモード用受信データを生成する。具体的には、信号処理部32は、RFデータに対してバンドパスフィルタ、包絡線検波、対数変換、減衰補正など公知の処理を施し、デジタルのBモード用受信データを生成する。対数変換では、RFデータを基準電圧で除した量の常用対数をとってデシベル値で表現する。Bモード用受信データは、超音波パルスの反射の強さを示す受信信号の振幅または強度が、超音波パルスの送受信方向(深度方向)に沿って並んだ複数のラインデータからなる。信号処理部32は、生成した1フレーム分のBモード用受信データを、画像処理部33へ出力する。信号処理部32は、CPU(Central Processing Unit)等の汎用プロセッサ、またはASIC(Application Specific Integrated Circuit)もしくはFPGA(Field Programmable Gate Array)等の特定の機能を実行する専用の集積回路等を用いて実現される。
画像処理部33は、信号処理部32から受信したBモード用受信データに基づいてBモード画像データを生成する。画像処理部33は、信号処理部32から出力されたBモード用受信データに対して、スキャンコンバーター処理、ゲイン処理、コントラスト処理等の公知の技術を用いた信号処理を行うとともに、表示装置4における画像の表示レンジに応じて定まるデータステップ幅に応じたデータの間引き等を行うことによってBモード画像データを生成する。スキャンコンバーター処理では、Bモード用受信データのスキャン方向を、超音波のスキャン方向から表示装置4の表示方向に変換する。Bモード画像は、色空間としてRGB表色系を採用した場合の変数であるR(赤)、G(緑)、B(青)の値を一致させたグレースケール画像である。以下、Bモード画像の各画素位置の値であって、RGBの各値を加算した、画素位置における明るさを示す値を輝度という。
画像処理部33は、信号処理部32からのBモード用受信データに走査範囲を空間的に正しく表現できるよう並べ直す座標変換を施した後、Bモード用受信データ間の補間処理を施すことによってBモード用受信データ間の空隙を埋め、Bモード画像データを生成する。画像処理部33は、CPU等の汎用プロセッサ、またはASICもしくはFPGA等の特定の機能を実行する専用の集積回路等を用いて実現される。
判定値算出部34は、予め設定されている物理量を用いて、算出領域の判定値を算出する。本実施の形態1では、物理量として輝度を用いて、関心領域内に設定される小領域、または、小領域を分割した領域である分割領域における輝度の頻度に関するヒストグラムを生成し、このヒストグラムのばらつきを判定値として算出する。ばらつきは、例えば輝度の標準偏差である。小領域および分割領域については後述する。判定値算出部34は、CPU等の汎用プロセッサ、またはASICもしくはFPGA等の特定の機能を実行する専用の集積回路等を用いて実現される。
判定部35は、判定値算出部34が算出した判定値をもとに、判定対象の小領域内の輝度または分割領域内の輝度が一様であるか否かを判定する。具体的に、判定部35は、判定値が、予め設定されている閾値を超えているか否かを判断し、判定値が閾値を超えていなければ、一様であると判定する。一方、判定部35は、判定値が閾値を超えていれば、一様でないと判定する。判定部35は、CPU等の汎用プロセッサ、またはASICもしくはFPGA等の特定の機能を実行する専用の集積回路等を用いて実現される。
図2は、物理量が一様である場合の頻度分布を示す図である。判定部35は、領域内の輝度が図2に示す分布曲線L1のような、ばらつきの小さい頻度分布を示し、判定値である標準偏差が小さくなる場合、領域内の輝度が一様であると判断する。
図3は、物理量が一様でない場合の頻度分布を示す図である。判定部35は、図2の頻度分布に対し、領域内の輝度が図3に示す分布曲線L100のようなばらつきの大きい頻度分布を示し、判定値である標準偏差が大きくなる場合、領域内の輝度が一様でないと判断する。
関心領域設定部36は、予め設定されている設定条件、または入力部38が受け付けた関心領域の設定指示に応じて、関心領域の設定を行う。図4は、本発明の実施の形態1に係る超音波診断システムの表示装置が表示する超音波画像を模式的に示す図である。図5は、本発明の実施の形態1に係る超音波観測装置が設定する関心領域を説明する図である。関心領域設定部36は、図4に示すような対象物Sが写った超音波画像であるBモード画像Wに対し、設定条件または設定入力に応じて、図5に示すような台形をなす関心領域Rを設定する。一般に、関心領域Rは、対象物Sを取り囲むような形状に設定されている。対象物Sは、被検体内の場合、腫瘍などの異常部である。関心領域設定部36は、CPU等の汎用プロセッサ、またはASICもしくはFPGA等の特定の機能を実行する専用の集積回路等を用いて実現される。
また、関心領域設定部36は、関心領域に対し、予め設定された条件にしたがって分割することによって、複数の小領域を設定する小領域設定部361と、判定部35により判定対象の領域が一様でないと判定された場合、予め設定された条件にしたがって当該領域を変更する領域変更部362と、判定部35により判定対象の領域が一様であると判定された場合、当該領域を減衰率算出対象領域として設定する算出領域設定部363と、を有する。
小領域設定部361は、予め設定されている条件にしたがって、関心領域Rを分割する。小領域設定部361は、例えば、図5に示すように、関心領域Rを九つに分割して、関心領域R内に、九つの小領域(小領域RS1~RS9)を設定する。分割処理は、例えば面積が同じになるように分割してもよいし、深度方向に沿った直線と、関心領域Rの上底および下底に平行な直線とにより分割してもよい。
領域変更部362は、判定対象の領域を細分化するように予め設定された分割条件を満たすような分割処理を行う。図6および図7は、本発明の実施の形態1に係る超音波観測装置が行う関心領域の小領域の設定処理を説明する図である。図5に示す関心領域Rの小領域RS1~RS9について、例えば、判定部35によって小領域RS1、RS2、RS7、RS9が一様でないと判断された場合、領域変更部362は、小領域RS1、RS2、RS7、RS9をそれぞれ分割する。これにより、図6に示すように、小領域RS1には分割領域RS11、RS12、RS13、RS14が生成され、小領域RS2には分割領域RS21、RS22、RS23、RS24が生成され、小領域RS7には分割領域RS31、RS32、RS33、RS34が生成され、小領域RS9には分割領域RS41、RS42、RS43、RS44が生成される。
各分割領域について、判定部35によって分割領域RS41、RS42が一様でないと判断された場合、領域変更部362は、分割領域RS41、RS42をそれぞれさらに分割する。これにより、図7に示すように、分割領域RS41には分割領域RS411、RS412、RS413、RS414が生成され、分割領域RS42には分割領域RS421、RS422、RS423、RS424が生成される。領域変更部362による分割処理によって生成された各分割領域は、各々が変更後の小領域に相当する。
このようにして、領域変更部362は、一様でないと判定された領域の分割処理を、領域の大きさが最小設定領域となるまで行う。
減衰率設定部37は、関心領域設定部36により設定された関心領域内の小領域および/または分割領域において、それぞれの領域における減衰率を設定する。減衰率設定部37は、各領域の代表点、例えば重心位置の深度によって決まる減衰率を、その領域の減衰率に設定する。減衰率設定部37は、CPU等の汎用プロセッサ、またはASICもしくはFPGA等の特定の機能を実行する専用の集積回路等を用いて実現される。
入力部38は、キーボード、マウス、トラックボール、タッチパネル等のユーザインタフェースを用いて実現され、各種情報の入力を受け付ける。入力部38は、受け付けた情報を制御部40に出力する。
記憶部39は、超音波診断システム1を動作させるための各種プログラム、および超音波診断システム1の動作に必要な各種パラメータ等を含むデータなどを記憶する。記憶部39は、判定部35が判定処理に用いる閾値を記憶する。また、記憶部39は、関心領域の設定に関する情報である関心領域設定情報を記憶する関心領域設定情報記憶部391を有する。関心領域設定情報は、関心領域を分割してなる小領域を設定する情報であり、小領域の初期設定数や、小領域の分割条件、設定最小領域などの情報を含んでいる。設定最小領域は、例えば、明暗の斑点模様をなすスペックルの影響を受けない大きさに設定される。
また、記憶部39は、超音波診断システム1の作動方法を実行するための作動プログラムを含む各種プログラムを記憶する。作動プログラムは、ハードディスク、フラッシュメモリ、CD-ROM、DVD-ROM、フレキシブルディスク等のコンピュータ読み取り可能な記録媒体に記録して広く流通させることも可能である。なお、上述した各種プログラムは、通信ネットワークを介してダウンロードすることによって取得することも可能である。ここでいう通信ネットワークは、例えば既存の公衆回線網、LAN(Local Area Network)、WAN(Wide Area Network)などによって実現されるものであり、有線、無線を問わない。
以上の構成を有する記憶部39は、各種プログラム等が予めインストールされたROM(Read Only Memory)、および各処理の演算パラメータやデータ等を記憶するRAM(Random Access Memory)等を用いて実現される。
制御部40は、超音波診断システム1全体を制御する。制御部40は、演算および制御機能を有するCPUや各種演算回路等を用いて実現される。制御部40は、記憶部39が記憶、格納する情報を記憶部39から読み出し、超音波観測装置3の作動方法に関連した各種演算処理を実行することによって超音波観測装置3を統括して制御する。なお、制御部40を信号処理部32と共通のCPU等を用いて構成することも可能である。
図8は、本発明の実施の形態1に係る超音波観測装置が行う処理の概要を示すフローチャートであって、関心領域における減衰率の設定処理を説明するフローチャートである。まず、超音波観測装置3は、超音波内視鏡2から超音波振動子21による観測対象の測定結果としてのエコー信号を受信する(ステップS101)。この際、次ステップによる関心領域設定のために、得られたエコー信号による超音波画像であるBモード画像を表示装置4に表示してもよい。
ステップS101に続くステップS102では、関心領域設定部36が、予め設定されている設定条件、または入力部38が受け付けた関心領域の設定指示に応じて、関心領域の設定を行う。この際、小領域設定部361が、設定された関心領域に対して小領域の設定を行う。
ステップS102に続くステップS103では、判定値算出部34が、関心領域内に設定される領域における輝度の頻度に関するヒストグラムを生成する。その後、判定値算出部34は、物理量の判定値として算出する(ステップS104)。本実施の形態1における判定値は、ヒストグラムにおける輝度のばらつきである。以下、領域とは、小領域および分割領域のいずれかをさす。
その後、判定部35は、判定対象の領域の判定値と、記憶部39に記憶されている閾値とを比較して、判定値が閾値以上であるか否かを判断する(ステップS105)。判定部35は、判定値が閾値以上であると判断した場合(ステップS105:Yes)、対象の小領域が一様ではないと判定し、ステップS106に移行する。
ステップS106において、領域変更部362が、判定対象の領域について、現在設定されている大きさが、最小設定領域であるか否かを判断する。この際、領域変更部362は、判定対象の領域が、最小設定領域であると判断した場合(ステップS106:Yes)、ステップS107に移行する。
ステップS107において、領域変更部362は、対象の領域を非減衰率算出領域として設定し、ステップS111に移行する。
これに対し、領域変更部362は、判定対象の領域が、最小設定領域ではないと判断した場合(ステップS106:No)、ステップS108に移行する。
ステップS108において、領域変更部362は、対象の領域をさらに分割する。領域変更部362は、例えば、図6に示すように、小領域RS1を分割することによって分割領域RS11、RS12、RS13、RS14を生成する。
その後、判定値算出部34が、分割領域について、判定値を算出する(ステップS109)。制御部40は、判定値を算出後、ステップS105に戻り、上述した判定処理を行う。
一方、ステップS105において、判定部35は、判定値が閾値以上でないと判断した場合(ステップS105:No)、対象の小領域が一様であると判定し、ステップS110に移行する。
ステップS110において、算出領域設定部363は、設定されている領域を減衰率算出領域として設定する。制御部40は、減衰率算出領域の設定後、ステップS111に移行する。
ステップS111において、制御部40は、未判定の領域が残っているか否かを判断する。ここで、制御部40は、未判定の領域が残っていると判断した場合(ステップS111:Yes)、ステップS105に戻り、未判定の領域について、上述した処理を行わせる。これに対し、制御部40は、未判定の領域が残っていないと判断した場合(ステップS111:No)、ステップS112に移行する。
ステップS112において、減衰率設定部37が、減衰率算出領域に設定されている小領域および/または分割領域のそれぞれについて、減衰率を設定する。なお、減衰率設定部37は、非減衰率算出領域に設定されている領域について、周囲の領域において設定された減衰率を用いて当該非減衰率算出領域の減衰率を設定する。減衰率設定部37は、例えば、隣接する領域の減衰率の平均値を算出して、これを減衰率としてもよい。この際、領域の大きさに応じて減衰率を重み付けするようにしてもよい。
その後、信号処理部32が、設定された減衰率を用いて、各領域の減衰補正を行う(ステップS113)。
画像処理部33は、減衰補正後のBモード用受信データを取得して、超音波画像であるBモード画像を含むBモード画像データを生成する(ステップS114)。
制御部40は、Bモード画像データが生成されると、Bモード画像データに応じたBモード画像を表示装置4に表示させる制御を行う(ステップS115)。
以上説明した本発明の実施の形態1では、関心領域内において設定されている領域ごとに輝度が一様であるか否かを判断し、判断結果に応じて領域を分割し、輝度が一様となった領域について減衰率を設定するようにした。これにより、関心領域の大きさを維持しつつ、この関心領域における減衰率を適切に設定することができる。このように設定された減衰率を用いることによって、高精度な超音波画像を作成することができる。
なお、上述した実施の形態1において、関心領域の形状は台形に限ることはなく、矩形、円、楕円などであってもよい。
(実施の形態2)
続いて、本発明の実施の形態2について説明する。図9は、本発明の実施の形態2に係る超音波観測装置を備えた超音波診断システムの構成を示すブロック図である。同図に示す超音波診断システム1Aは、上述した超音波診断システム1の超音波観測装置3に代えて超音波観測装置3Aを備える。超音波観測装置3Aは、上述した判定値算出部34に代えて判定値算出部34Aを備える。その他の構成は、超音波診断システム1と同様である。以下、この判定値算出部34Aについて説明する。
続いて、本発明の実施の形態2について説明する。図9は、本発明の実施の形態2に係る超音波観測装置を備えた超音波診断システムの構成を示すブロック図である。同図に示す超音波診断システム1Aは、上述した超音波診断システム1の超音波観測装置3に代えて超音波観測装置3Aを備える。超音波観測装置3Aは、上述した判定値算出部34に代えて判定値算出部34Aを備える。その他の構成は、超音波診断システム1と同様である。以下、この判定値算出部34Aについて説明する。
判定値算出部34Aは、予め設定されている物理量を用いて、算出領域の判定値を算出する。本実施の形態2では、物理量として輝度を用いて、関心領域内に設定される小領域、または、小領域を分割した領域である分割領域における輝度の頻度に関するヒストグラムを生成する。
判定値算出部34Aは、平滑化部341を有する。平滑化部341は、判定値算出部34Aにおいて生成されたヒストグラムを平滑化する。平滑化部341は、例えば、移動平均フィルタなどを用いて構成される。平滑化後のヒストグラムとして、例えば、一つの極大値を有するヒストグラム(図2参照)や、複数の極大値を有するヒストグラムが得られる。図10は、極大値を複数有する頻度分布を示す図である。例えば、図10に示すように、物理量Q1,Q2(Q1<Q2)において、極大値を有するヒストグラムが得られる。
判定値算出部34Aは、平滑化部341によって平滑化されたヒストグラムの極大値の数を判定値として算出する。この際、判定値算出部34Aは、予め設定された頻度以上となる極大値の数を計数する。
判定部35は、判定値算出部34Aが算出した判定値である極大値の数と、予め設定されている閾値とをもとに、判定対象の小領域または分割領域の輝度が一様であるか否かを判定する。閾値は、極大値の数であり、本実施の形態2では1に設定されているものとして説明する。具体的に、判定部35は、判定値が予め設定されている閾値より大きいか否かを判断し、例えば極大値の数が0または1であれば、一様であると判定する。一方、判定部35は、極大値の数が1を超えていれば、一様でないと判定する。判定部35は、例えば、図2に示すような分布曲線L1を有するヒストグラムであって、極大値の頻度が設定されている頻度以上であれば、一様であると判定し、図3に示すような分布曲線L100を有するヒストグラムであれば、一様ではないと判定する。
図11は、本発明の実施の形態2に係る超音波観測装置が行う処理の概要を示すフローチャートであって、関心領域における減衰率の設定処理を説明するフローチャートである。まず、超音波観測装置3は、上述した図8に示すフローチャートと同様にして、超音波内視鏡2から超音波振動子21による観測対象の測定結果としてのエコー信号を受信し(ステップS201)、関心領域設定部36が、予め設定されている設定条件、または入力部38が受け付けた関心領域の設定指示に応じて、関心領域の設定を行う(ステップS202)。ステップS202では、小領域設定部361が、設定された関心領域を分割して複数の小領域を設定する。
ステップS202に続くステップS203では、判定値算出部34Aが、関心領域内に設定される領域における輝度の頻度に関するヒストグラムを生成する(ステップS203)。
ヒストグラムが生成されると、平滑化部341が、ヒストグラムの平滑化を行う(ステップS204)。
その後、判定値算出部34Aは、物理量の判定値を算出する(ステップS205)。本実施の形態1における判定値は、平滑化されたヒストグラムにおける極大値の数である。
判定部35は、判定対象の領域の判定値と、記憶部39に記憶されている閾値とを比較して、判定値が閾値より大きいか否かを判断する(ステップS206)。判定部35は、判定値が閾値より大きい場合(ステップS206:Yes)、対象の小領域が一様ではないと判定し、ステップS207に移行する。
ステップS207において、領域変更部362が、判定対象の領域について、現在設定されている大きさが、最小設定領域であるか否かを判断する。この際、領域変更部362は、判定対象の領域が、最小設定領域であると判断した場合(ステップS207:Yes)、ステップS208に移行する。
ステップS208において、領域変更部362は、対象の領域を非減衰率算出領域として設定し、ステップS212に移行する。
これに対し、領域変更部362は、判定対象の領域が、最小設定領域ではないと判断した場合(ステップS207:No)、対象の領域をさらに分割する(ステップS209)。
その後、判定値算出部34Aが、分割領域について、判定値を算出する(ステップS210)。制御部40は、判定値を算出後、ステップS206に戻り、上述した判定処理を行う。
一方、ステップS206において、判定部35は、判定値が閾値以下であると判断した場合(ステップS206:No)、対象の小領域が一様であると判定し、ステップS211に移行する。
ステップS211において、算出領域設定部363は、設定されている領域を減衰率算出領域として設定する。制御部40は、減衰率算出領域の設定後、ステップS212に移行する。
ステップS212において、制御部40は、未判定の領域が残っているか否かを判断する。ここで、制御部40は、未判定の領域が残っていると判断した場合(ステップS212:Yes)、ステップS206に戻り、未判定の領域について、上述した処理を行わせる。これに対し、制御部40は、未判定の領域が残っていないと判断した場合(ステップS212:No)、ステップS213に移行する。
ステップS213において、減衰率設定部37が、設定されている小領域および/または分割領域のそれぞれについて、減衰率を設定する。その後、信号処理部32が、設定された減衰率を用いて、各領域の減衰補正を行う(ステップS214)。
画像処理部33は、減衰補正後のBモード用受信データを取得して、超音波画像であるBモード画像を示すBモード画像データを生成する(ステップS215)。制御部40は、Bモード画像データを生成後、表示装置4に表示させる制御を行う(ステップS216)。
以上説明した本発明の実施の形態2では、関心領域内において設定されている領域ごとに、ヒストグラムにおける極大値の数をもとに輝度が一様であるか否かを判断し、判断結果に応じて領域を分割し、輝度が一様となった領域について減衰率を設定するようにした。これにより、関心領域の大きさを維持しつつ、この関心領域における減衰率を適切に設定することができる。このように設定された減衰率を用いることによって、高精度な超音波画像を作成することができる。
(実施の形態3)
続いて、本発明の実施の形態3について説明する。図12は、本発明の実施の形態3に係る超音波観測装置を備えた超音波診断システムの構成を示すブロック図である。同図に示す超音波診断システム1Bは、上述した超音波診断システム1の超音波観測装置3に代えて超音波観測装置3Bを備える。超音波観測装置3Bは、上述した判定値算出部34に代えて判定値算出部34Bを備える。その他の構成は、超音波診断システム1と同様である。以下、この判定値算出部34Bについて説明する。
続いて、本発明の実施の形態3について説明する。図12は、本発明の実施の形態3に係る超音波観測装置を備えた超音波診断システムの構成を示すブロック図である。同図に示す超音波診断システム1Bは、上述した超音波診断システム1の超音波観測装置3に代えて超音波観測装置3Bを備える。超音波観測装置3Bは、上述した判定値算出部34に代えて判定値算出部34Bを備える。その他の構成は、超音波診断システム1と同様である。以下、この判定値算出部34Bについて説明する。
判定値算出部34Bは、予め設定されている物理量を用いて、算出領域の判定値を算出する。本実施の形態3では、物理量として輝度を用いて、関心領域内に設定される小領域、または、小領域を分割した領域である分割領域における輝度の頻度に関するヒストグラムを生成する。判定値算出部34Bは、生成したヒストグラムが、設定された頻度以上の極大値を複数有する場合、極大値を示す物理量の差を算出して、この差を判定値とする。判定値算出部34Bは、例えば図10に示すヒストグラムが得られた場合、物理量Q1と物理量Q2の差(Q2-Q1)を算出する。なお、極大値の数が0または1である場合、判定値算出部34Bは、上述した差を0に設定する。なお、判定値算出部34Bは、ヒストグラムが極大値を三つ以上有する場合は、隣り合う極大値に対応する物理量の差をそれぞれ算出して、各差に基づいて判定値を算出する。
判定部35は、判定値算出部34Bが算出した判定値である物理量の差と、予め設定されている閾値とをもとに、判定対象の小領域または分割領域の輝度が一様であるか否かを判定する。閾値は、一様であるとみなせる物理量の差である。具体的に、判定部35は、判定値が予め設定されている閾値より大きいか否かを判断し、例えば差が閾値以下であれば一様であると判定する。一方、判定部35は、差が閾値より大きければ、一様でないと判定する。
関心領域における減衰率の設定処理は、上述した図11のステップS201、S202、S204~S216に準じて行われる。この際、判定値は物理量の差、閾値は上述した閾値に読み替える。なお、上述した実施の形態2と組み合わせて、ヒストグラムを平滑化するようにしてもよい。この場合の関心領域における減衰率の設定処理は、図11のステップS201~S216に準じて行われる。
以上説明した本発明の実施の形態3では、関心領域内において設定されている領域ごとに、ヒストグラムにおける物理量の差をもとに輝度が一様であるか否かを判断し、判断結果に応じて領域を分割し、輝度が一様となった領域について減衰率を設定するようにした。これにより、関心領域の大きさを維持しつつ、この関心領域における減衰率を適切に設定することができる。このように設定された減衰率を用いることによって、高精度な超音波画像を作成することができる。
(実施の形態4)
続いて、本発明の実施の形態4について説明する。図13は、本発明の実施の形態4に係る超音波観測装置が行う関心領域の小領域の設定処理を説明する図である。上述した実施の形態1~3では、判定対象の領域の輝度が一様でないと判定された場合、領域を分割するものとして説明したが、実施の形態4では、関心領域の大きさを維持して移動させる。本実施の形態4は、上述した超音波診断システム1と同様の構成を有しているものとして説明する。
続いて、本発明の実施の形態4について説明する。図13は、本発明の実施の形態4に係る超音波観測装置が行う関心領域の小領域の設定処理を説明する図である。上述した実施の形態1~3では、判定対象の領域の輝度が一様でないと判定された場合、領域を分割するものとして説明したが、実施の形態4では、関心領域の大きさを維持して移動させる。本実施の形態4は、上述した超音波診断システム1と同様の構成を有しているものとして説明する。
例えば、図13に示すように、破線で区分される関心領域Rの各小領域において、判定部35が一つでも一様でない領域が存在すると判定した場合、領域変更部362は、関心領域Rを移動させる。この際、領域変更部362は、予め設定された方向、設定された画素数で関心領域Rを移動させる。例えば、図13では、図の左方向に数画素分移動させている。これにより、Bモード画像における各小領域の配置も再設定される。このように、領域変更部362は、判定領域を移動させるように設定された条件を満たすような変更処理を行う。
判定値算出部34は、一点鎖線で示す移動後の関心領域R´の各小領域の判定値を算出する。判定部35は、算出された判定値をもとに、関心領域R´の各小領域が一様であるか否かを判定する。
本実施の形態4では、上述したようにして、関心領域における判定値の算出、一様であるか否かの判定、および関心領域の移動を繰り返す。なお、領域変更部362は、予め設定されている移動回数を超えても関心領域が一様とならない場合、設定する関心領域をこれまで移動した関心領域のなかで、一様であると判定された小領域が最も多い関心領域としてもよいし、術者に関心領域を再設定するように警告情報を出力してもよい。
関心領域が確定すると、上述したように、超音波観測装置3が、減衰率の設定や、Bモード画像の生成を行う。
以上説明した本発明の実施の形態4では、関心領域内において設定されている領域ごとに輝度が一様であるか否かを判断し、判断結果に応じて領域を移動して、確定された関心領域の各小領域について減衰率を設定するようにした。これにより、関心領域の大きさを維持しつつ、この関心領域における減衰率を適切に設定することができる。このように設定された減衰率を用いることによって、高精度な超音波画像を作成することができる。
なお、上述した実施の形態1~4は、適宜組み合わせることが可能である。例えば、ヒストグラムを平滑化し、このヒストグラムの極大値の差分を算出して、小領域の分割をしたり、さらに実施の形態4を組み合わせて小領域を移動させたりするようにしてもよい。
(実施の形態5)
続いて、本発明の実施の形態5について説明する。図14は、本発明の実施の形態5に係る超音波観測装置を備えた超音波診断システムの構成を示すブロック図である。同図に示す超音波診断システム1Cは、上述した超音波診断システム1の超音波観測装置3に代えて超音波観測装置3Cを備える。超音波観測装置3Cは、上述した超音波観測装置3の構成に対して、画像処理部33に代えて画像処理部33A、判定値算出部34に代えて演算部41を備えている。演算部41は、判定値算出部の機能を担っている。また、送受信部31は、信号増幅部311を有しているものとして説明する。その他の構成は、超音波診断システム1と同様である。以下、送受信部31、画像処理部33Aおよび演算部41について説明する。
続いて、本発明の実施の形態5について説明する。図14は、本発明の実施の形態5に係る超音波観測装置を備えた超音波診断システムの構成を示すブロック図である。同図に示す超音波診断システム1Cは、上述した超音波診断システム1の超音波観測装置3に代えて超音波観測装置3Cを備える。超音波観測装置3Cは、上述した超音波観測装置3の構成に対して、画像処理部33に代えて画像処理部33A、判定値算出部34に代えて演算部41を備えている。演算部41は、判定値算出部の機能を担っている。また、送受信部31は、信号増幅部311を有しているものとして説明する。その他の構成は、超音波診断システム1と同様である。以下、送受信部31、画像処理部33Aおよび演算部41について説明する。
送受信部31は、エコー信号を増幅する信号増幅部311を有する。信号増幅部311は、受信深度が大きいエコー信号ほど高い増幅率で増幅するSTC(Sensitivity Time Control)補正を行う。図15は、信号増幅部311が行う増幅処理における受信深度と増幅率との関係を示す図である。図15に示す受信深度zは、超音波の受信開始時点からの経過時間に基づいて算出される量である。図15に示すように、増幅率β(dB)は、受信深度zが閾値zthより小さい場合、受信深度zの増加に伴ってβ0からβth(>β0)へ線型に増加する。また、増幅率β(dB)は、受信深度zが閾値zth以上である場合、一定値βthをとる。閾値zthの値は、観測対象から受信する超音波信号がほとんど減衰してしまい、ノイズが支配的になるような値である。より一般に、増幅率βは、受信深度zが閾値zthより小さい場合、受信深度zの増加に伴って単調増加すればよい。なお、図15に示す関係は、予め記憶部39に記憶されている。
送受信部31は、信号増幅部311によって増幅されたエコー信号に対してフィルタリング等の処理を施した後、A/D変換することによって時間ドメインのRFデータを生成し、信号処理部32、演算部41および記憶部39へ出力する。なお、超音波内視鏡2が複数の素子をアレイ状に設けた超音波振動子21を電子的に走査させる構成を有する場合、送受信部31は、複数の素子に対応したビーム合成用の多チャンネル回路を有する。
信号増幅部311におけるエコー信号の各種処理周波数帯域は、超音波振動子21による超音波エコーのエコー信号への音響電気変換の線型応答周波数帯域をほぼカバーする広帯域にするとよい。これらにより、後述する周波数スペクトルの近似処理を実行する際、精度のよい近似を行うことが可能となる。
演算部41は、送受信部31が生成したRFデータに対して受信深度によらず増幅率βを一定とするよう増幅補正を行う増幅補正部411と、増幅補正を行ったRFデータに高速フーリエ変換(FFT:Fast Fourier Transform)を施して周波数解析を行うことにより周波数スペクトルを算出する周波数解析部412と、周波数スペクトルの特徴量を算出する特徴量算出部413と、を有する。演算部41は、CPU等の汎用プロセッサ、またはASICもしくはFPGA等の特定の機能を実行する専用の集積回路等を用いて実現される。
図16は、増幅補正部411が行う増幅補正処理における受信深度と増幅率との関係を示す図である。図16に示すように、増幅補正部411が行う増幅補正処理における増幅率β(dB)は、受信深度zがゼロのとき最大値βth-β0をとり、受信深度zがゼロから閾値zth0に達するまで線型に減少し、受信深度zが閾値zth0以上のときゼロである。このように定められる増幅率によって増幅補正部411がデジタルRF信号を増幅補正することにより、信号処理部32におけるSTC補正の影響を相殺し、一定の増幅率βthの信号を出力することができる。なお、増幅補正部411が行う受信深度zと増幅率βの関係は、信号処理部32における受信深度と増幅率の関係に応じて異なることは勿論である。
このような増幅補正を行う理由を説明する。STC補正は、アナログ信号波形の振幅を全周波数帯域にわたって均一に、かつ、深度に対しては単調増加する増幅率で増幅させることで、アナログ信号波形の振幅から減衰の影響を排除する補正処理である。このため、エコー信号の振幅を輝度に変換して表示するBモード画像を生成する場合、かつ、一様な組織を走査した場合には、STC補正を行うことによって深度によらず輝度値が一定になる。すなわち、Bモード画像の輝度値から減衰の影響を排除する効果を得ることができる。
一方、本実施の形態5のように超音波の周波数スペクトルを算出して解析した結果を利用する場合、STC補正でも超音波の伝播に伴う減衰の影響を正確に排除できるわけではない。なぜなら、一般に減衰量は周波数によって異なるが(後述する式(1)を参照)、STC補正の増幅率は距離だけに応じて変化し、周波数依存性がないためである。
上述した問題、すなわち、超音波の周波数スペクトルを算出して解析した結果を利用する場合、STC補正でも超音波の伝播に伴う減衰の影響を正確に排除できるわけではない、という問題を解決するには、Bモード画像を生成する際にSTC補正を施した受信信号を出力する一方、周波数スペクトルに基づいた画像を生成する際に、Bモード画像を生成するための送信とは異なる新たな送信を行い、STC補正を施していない受信信号を出力することが考えられる。ところがこの場合には、受信信号に基づいて生成される画像データのフレームレートが低下してしまうという問題がある。
そこで、本実施の形態では、生成される画像データのフレームレートを維持しつつ、Bモード画像用にSTC補正を施した信号に対してSTC補正の影響を排除するために、増幅補正部411によって増幅率の補正を行う。
周波数解析部412は、増幅補正部411が増幅補正した各音線のRFデータを所定の時間間隔でサンプリングし、サンプルデータを生成する。周波数解析部412は、サンプルデータ群にFFT処理を施すことにより、RFデータ上の複数の箇所(データ位置)における周波数スペクトルを算出する。ここでいう「周波数スペクトル」とは、サンプルデータ群にFFT処理を施すことによって得られた「ある受信深度zにおける強度の周波数分布」を意味する。また、ここでいう「強度」とは、例えばエコー信号の電圧、エコー信号の電力、超音波エコーの音圧、超音波エコーの音響エネルギー等のパラメータ、これらパラメータの振幅や時間積分値やその組み合わせのいずれかを指す。
一般に、周波数スペクトルは、観測対象が生体組織である場合、超音波が走査された生体組織の性状によって異なる傾向を示す。これは、周波数スペクトルが、超音波を散乱する散乱体の大きさ、数密度、音響インピーダンス等と相関を有しているためである。ここでいう「生体組織の性状」とは、例えば悪性腫瘍(癌)、良性腫瘍、内分泌腫瘍、粘液性腫瘍、正常組織、嚢胞、脈管などのことである。
図17は、超音波信号の1つの音線におけるデータ配列を模式的に示す図である。同図に示す音線SRkにおいて、白または黒の長方形は、1つのサンプル点におけるデータを意味している。また、音線SRkにおいて、右側に位置するデータほど、超音波振動子21から音線SRkに沿って計った場合の深い箇所からのサンプルデータである(図17の矢印を参照)。音線SRkは、送受信部31が行うA/D変換におけるサンプリング周波数(例えば50MHz)に対応した時間間隔で離散化されている。図17では、番号kの音線SRkの8番目のデータ位置を受信深度zの方向の初期値Z(k)
0として設定した場合を示しているが、初期値の位置は任意に設定することができる。周波数解析部412による算出結果は複素数で得られ、記憶部39に格納される。
図17に示すデータ群Fj(j=1、2、・・・、K)は、FFT処理の対象となるサンプルデータ群である。一般に、FFT処理を行うためには、サンプルデータ群が2のべき乗のデータ数を有している必要がある。この意味で、サンプルデータ群Fj(j=1、2、・・・、K-1)はデータ数が16(=24)で正常なデータ群である一方、サンプルデータ群FKは、データ数が12であるため異常なデータ群である。異常なデータ群に対してFFT処理を行う際には、不足分だけゼロデータを挿入することにより、正常なサンプルデータ群を生成する処理を行う。この点については、周波数解析部412の処理を説明する際に詳述する(図21を参照)。
図18は、周波数解析部412により算出された周波数スペクトルの例を示す図である。図18では、横軸が周波数fである。また、図18では、縦軸が、強度I0を基準強度Ic(定数)で除した量の常用対数(デシベル表現)I=10log10(I0/Ic)である。図18に示す回帰直線L10(以下、単に直線L10ともいう)については後述する。なお、本実施の形態において、曲線および直線は、離散的な点の集合からなる。
図18に示す周波数スペクトルC1において、以後の演算に使用する周波数帯域の下限周波数fLおよび上限周波数fHは、超音波振動子21の周波数帯域、送受信部31が送信するパルス信号の周波数帯域などをもとに決定されるパラメータである。以下、図18において、下限周波数fLおよび上限周波数fHによって定まる周波数帯域を「周波数帯域F」という。
特徴量算出部413は、複数の周波数スペクトルの特徴量をそれぞれ算出し、超音波が観測対象を伝播する際の互いに異なる減衰特性を与える複数の減衰率候補値の各々において、各周波数スペクトルの特徴量(以下、補正前特徴量という)に対して超音波の減衰の影響を排除する減衰補正を行うことによって各周波数スペクトルの補正特徴量を算出し、該補正特徴量を用いて複数の減衰率候補値の中から観測対象に最適な減衰率を設定する。
特徴量算出部413は、周波数スペクトルを直線で近似することによって減衰補正処理を行う前の周波数スペクトルの特徴量を算出する近似部413aと、近似部413aが算出した補正前特徴量に対して減衰補正を行うことによって特徴量を算出する減衰補正部413bと、減衰補正部413bがすべての周波数スペクトルに対して算出した補正特徴量の統計的なばらつきに基づいて複数の減衰率候補値の中から最適な減衰率を設定する最適減衰率設定部413cと、を有する。
近似部413aは、所定周波数帯域における周波数スペクトルの回帰分析を行って周波数スペクトルを一次式(回帰直線)で近似することにより、この近似した一次式を特徴付ける補正前特徴量を算出する。例えば、図18に示す周波数スペクトルC1の場合、近似部413aは、周波数帯域Fで回帰分析を行い周波数スペクトルC1を一次式で近似することによって回帰直線L10を得る。換言すると、近似部413aは、回帰直線L10の傾きa0、切片b0、および周波数帯域Fの中心周波数fM=(fL+fH)/2の回帰直線上の値であるミッドバンドフィット(Mid-band fit)c0=a0fM+b0を補正前特徴量として算出する。
3つの補正前特徴量のうち、傾きa0は、超音波の散乱体の大きさと相関を有し、一般に散乱体が大きいほど傾きが小さな値を有すると考えられる。また、切片b0は、散乱体の大きさ、音響インピーダンスの差、散乱体の数密度(濃度)等と相関を有している。具体的には、切片b0は、散乱体が大きいほど大きな値を有し、音響インピーダンスの差が大きいほど大きな値を有し、散乱体の数密度が大きいほど大きな値を有すると考えられる。ミッドバンドフィットc0は、傾きa0と切片b0から導出される間接的なパラメータであり、有効な周波数帯域内の中心におけるスペクトルの強度を与える。このため、ミッドバンドフィットc0は、散乱体の大きさ、音響インピーダンスの差、散乱体の数密度に加えて、Bモード画像の輝度とある程度の相関を有していると考えられる。なお、特徴量算出部413は、回帰分析によって二次以上の多項式で周波数スペクトルを近似するようにしてもよい。
減衰補正部413bが行う補正について説明する。一般に、超音波の減衰量A(f,z)は、超音波が受信深度0と受信深度zとの間を往復する間に生じる減衰であり、往復する前後の強度変化(デシベル表現での差)として定義される。減衰量A(f,z)は、一様な組織内では周波数に比例することが経験的に知られており、以下の式(1)で表現される。
A(f,z)=2αzf ・・・(1)
ここで、比例定数αは減衰率と呼ばれる量である。また、zは超音波の受信深度であり、fは周波数である。減衰率αの具体的な値は、観測対象が生体である場合、生体の部位に応じて定まる。減衰率αの単位は、例えばdB/cm/MHzである。なお、本実施の形態において、減衰率αの値を入力部38からの入力によって変更できる構成とすることも可能である。
A(f,z)=2αzf ・・・(1)
ここで、比例定数αは減衰率と呼ばれる量である。また、zは超音波の受信深度であり、fは周波数である。減衰率αの具体的な値は、観測対象が生体である場合、生体の部位に応じて定まる。減衰率αの単位は、例えばdB/cm/MHzである。なお、本実施の形態において、減衰率αの値を入力部38からの入力によって変更できる構成とすることも可能である。
減衰補正部413bは、近似部413aが抽出した補正前特徴量(傾きa0、切片b0、ミッドバンドフィットc0)に対し、以下に示す式(2)~(4)にしたがって減衰補正を行うことにより、補正特徴量a、b、cを算出する。
a=a0+2αz ・・・(2)
b=b0 ・・・(3)
c=c0+A(fM,z)=c0+2αzfM(=afM+b)・・・(4)
式(2)、(4)からも明らかなように、減衰補正部413bは、超音波の受信深度zが大きいほど、補正量が大きい補正を行う。また、式(3)によれば、切片に関する補正は恒等変換である。これは、切片が周波数0(Hz)に対応する周波数成分であって減衰の影響を受けないためである。
a=a0+2αz ・・・(2)
b=b0 ・・・(3)
c=c0+A(fM,z)=c0+2αzfM(=afM+b)・・・(4)
式(2)、(4)からも明らかなように、減衰補正部413bは、超音波の受信深度zが大きいほど、補正量が大きい補正を行う。また、式(3)によれば、切片に関する補正は恒等変換である。これは、切片が周波数0(Hz)に対応する周波数成分であって減衰の影響を受けないためである。
図19は、減衰補正部413bが算出した補正特徴量a、b、cをパラメータとして有する直線を示す図である。直線L1の式は、
I=af+b=(a0+2αz)f+b0 ・・・(5)
で表される。この式(5)からも明らかなように、直線L1は、減衰補正前の直線L10と比較して、傾きが大きく(a>a0)、かつ切片が同じ(b=b0)である。
I=af+b=(a0+2αz)f+b0 ・・・(5)
で表される。この式(5)からも明らかなように、直線L1は、減衰補正前の直線L10と比較して、傾きが大きく(a>a0)、かつ切片が同じ(b=b0)である。
最適減衰率設定部413cは、減衰補正部413bがすべての周波数スペクトルに対して減衰率候補値ごとに算出した補正特徴量の統計的なばらつきが最小である減衰率候補値を最適な減衰率として設定する。本実施の形態では、統計的なばらつきを示す量として分散を適用する。この場合、最適減衰率設定部413cは、分散が最小となる減衰率候補値を最適な減衰率として設定する。上述した3つの補正特徴量a、b、cのうち独立なのは2つである。加えて、補正特徴量bは減衰率に依存しない。したがって、補正特徴量a、cに対して最適な減衰率を設定する場合、最適減衰率設定部413cは、補正特徴量aおよびcのいずれか一方の分散を算出すればよい。
ただし、最適減衰率設定部413cが最適な減衰率を設定する際に用いる補正特徴量は、画像処理部33Aが特徴量画像データを生成する際に用いる補正特徴量と同じ種類であることが好ましい。すなわち、画像処理部33Aが補正特徴量として傾きを用いて特徴量画像データを生成する場合は補正特徴量aの分散を適用し、画像処理部33Aが補正特徴量としてミッドバンドフィットを用いて特徴量画像データを生成する場合は補正特徴量cの分散を適用するのがより好ましい。これは、減衰量A(f,z)を与える式(1)があくまで理想的なものに過ぎず、現実には以下の式(6)の方が適切であることによる。
A(f,z)=2αzf+2α1z ・・・(6)
式(6)の右辺第2項のα1は、超音波の受信深度zに比例して信号強度が変化する大きさを表す係数であり、観測対象の組織が不均一であることや、ビーム合成時のチャンネル数の変更などに起因して発生する信号強度の変化を表す係数である。式(6)の右辺第2項が存在するため、補正特徴量としてミッドバンドフィットを用いて特徴量画像データを生成する場合は、補正特徴量cの分散を用いて最適な減衰率を設定した方が正確に減衰を補正することができる(式(4)を参照)。一方、周波数fに比例する係数である傾きを用いて特徴量画像データを生成する場合は、補正特徴量aの分散を用いて最適な減衰率を設定した方が、右辺第2項の影響を排除して正確に減衰を補正することができる。例えば、減衰率αの単位がdB/cm/MHzである場合、係数α1の単位はdB/cmである。
ここで、統計的なばらつきに基づいて最適な減衰率を設定することができる理由を説明する。観測対象に最適な減衰率を適用した場合、観測対象と超音波振動子21との距離にかかわらず、特徴量は観測対象に固有の値へ収束し、統計的なばらつきが小さくなると考えられる。その一方で、観測対象に適合しない減衰率候補値を最適な減衰率とした場合、減衰補正が過剰であるかまたは不足するため、超音波振動子21との距離に応じて特徴量にずれが生じ、特徴量の統計的なばらつきが大きくなると考えられる。したがって、統計的なばらつきが最も小さい減衰率候補値が、観察対象にとって最適な減衰率であるということができる。
画像処理部33Aは、エコー信号の振幅を輝度に変換して表示する超音波画像であるBモード画像データを生成するBモード画像データ生成部331と、特徴量算出部413が算出した特徴量を視覚情報と関連づけてBモード画像とともに表示する特徴量画像データを生成する特徴量画像データ生成部332と、を有する。
Bモード画像データ生成部331は、信号処理部32から受信したBモード用受信データに対してゲイン処理、コントラスト処理等の公知の技術を用いた信号処理を行うとともに、表示装置4における画像の表示レンジに応じて定まるデータステップ幅に応じたデータの間引き等を行うことによってBモード画像データを生成する。Bモード画像は、色空間としてRGB表色系を採用した場合の変数であるR(赤)、G(緑)、B(青)の値を一致させたグレースケール画像である。
Bモード画像データ生成部331は、信号処理部32からのBモード用受信データに走査範囲を空間的に正しく表現できるよう並べ直す座標変換を施した後、Bモード用受信データ間の補間処理を施すことによってBモード用受信データ間の空隙を埋め、Bモード画像データを生成する。Bモード画像データ生成部331は、生成したBモード画像データを特徴量画像データ生成部332へ出力する。
特徴量画像データ生成部332は、特徴量算出部413が算出した特徴量に関連する視覚情報をBモード画像データにおける画像の各画素に対して重畳することによって特徴量画像データを生成する。特徴量画像データ生成部332は、例えば図17に示す1つのサンプルデータ群Fj(j=1、2、・・・、K)のデータ量に対応する画素領域に対し、そのサンプルデータ群Fjから算出される周波数スペクトルの特徴量に対応する視覚情報を割り当てる。特徴量画像データ生成部332は、例えば上述した傾き、切片、ミッドバンドフィットのいずれか一つに視覚情報としての色相を対応付けることによって特徴量画像データを生成する。なお、特徴量画像データ生成部332が、傾き、切片、ミッドバンドフィットから選択される2つの特徴量の一方に色相を対応付けるとともに、他方に明暗を対応付けることによって特徴量画像データを生成するようにしてもよい。特徴量に関連する視覚情報としては、例えば色相、彩度、明度、輝度値、R(赤)、G(緑)、B(青)などの所定の表色系を構成する色空間の変数を挙げることができる。
図20は、以上の構成を有する超音波観測装置3Cが行う処理の概要を示すフローチャートである。まず、超音波観測装置3Cは、超音波内視鏡2から超音波振動子21による観測対象の測定結果としてのエコー信号を受信する(ステップS301)。
超音波振動子21からエコー信号を受信した信号増幅部311は、そのエコー信号の増幅を行う(ステップS302)。ここで、信号増幅部311は、例えば図15に示す増幅率と受信深度との関係に基づいてエコー信号の増幅(STC補正)を行う。
続いて、Bモード画像データ生成部331は、信号増幅部311が増幅したエコー信号を用いてBモード画像データを生成して、表示装置4へ出力する(ステップS303)。Bモード画像データを受信した表示装置4は、そのBモード画像データに対応するBモード画像を表示する(ステップS304)。
ステップS304に続くステップS305では、関心領域設定部36が、予め設定されている設定条件、または入力部38が受け付けた関心領域の設定指示に応じて、関心領域の設定を行う。
増幅補正部411は、送受信部31から出力された信号に対して受信深度によらず増幅率が一定となる増幅補正を行う(ステップS306)。ここで、増幅補正部411は、例えば図16に示す増幅率と受信深度との関係が成立するように増幅補正を行う。
この後、周波数解析部412は、FFT演算による周波数解析を行うことによって全てのサンプルデータ群に対する周波数スペクトルを算出する(ステップS307)。図21は、ステップS307において周波数解析部412が実行する処理の概要を示すフローチャートである。以下、図21に示すフローチャートを参照して、周波数解析処理を詳細に説明する。
まず、周波数解析部412は、解析対象の音線を識別するカウンタkをk0とする(ステップS321)。
続いて、周波数解析部412は、FFT演算用に取得する一連のデータ群(サンプルデータ群)を代表するデータ位置(受信深度に相当)Z(k)の初期値Z(k)
0を設定する(ステップS322)。例えば、図17では、上述したように、音線SRkの8番目のデータ位置を初期値Z(k)
0として設定した場合を示している。
その後、周波数解析部412は、サンプルデータ群を取得し(ステップS323)、取得したサンプルデータ群に対し、記憶部39が記憶する窓関数を作用させる(ステップS324)。このようにサンプルデータ群に対して窓関数を作用させることにより、サンプルデータ群が境界で不連続になることを回避し、アーチファクトが発生するのを防止することができる。
続いて、周波数解析部412は、データ位置Z(k)のサンプルデータ群が正常なデータ群であるか否かを判定する(ステップS325)。図17を参照した際に説明したように、サンプルデータ群は、2のべき乗のデータ数を有している必要がある。以下、正常なサンプルデータ群のデータ数を2n(nは正の整数)とする。本実施の形態では、データ位置Z(k)が、できるだけZ(k)が属するサンプルデータ群の中心になるよう設定される。具体的には、サンプルデータ群のデータ数は2nであるので、Z(k)はそのサンプルデータ群の中心に近い2n/2(=2n-1)番目の位置に設定される。この場合、サンプルデータ群が正常であるとは、データ位置Z(k)の前方に2n-1-1(=Nとする)個のデータがあり、データ位置Z(k)の後方に2n-1(=Mとする)個のデータがあることを意味する。図17に示す場合、サンプルデータ群F1、F2、F3、・・・、Fk-1はともに正常である。なお、図17ではn=4(N=7,M=8)の場合を例示している。
ステップS325における判定の結果、データ位置Z(k)のサンプルデータ群が正常である場合(ステップS325:Yes)、周波数解析部412は、後述するステップS327へ移行する。
ステップS325における判定の結果、データ位置Z(k)のサンプルデータ群が正常でない場合(ステップS325:No)、周波数解析部412は、不足分だけゼロデータを挿入することによって正常なサンプルデータ群を生成する(ステップS326)。ステップS325において正常でないと判定されたサンプルデータ群(例えば図17のサンプルデータ群FK)は、ゼロデータを追加する前に窓関数が作用されている。このため、サンプルデータ群にゼロデータを挿入してもデータの不連続は生じない。ステップS326の後、周波数解析部412は、後述するステップS327へ移行する。
ステップS327において、周波数解析部412は、サンプルデータ群を用いてFFT演算を行うことにより、振幅の周波数分布である周波数スペクトルを得る(ステップS327)。
続いて、周波数解析部412は、データ位置Z(k)をステップ幅Dで変化させる(ステップS328)。ステップ幅Dは、記憶部39が予め記憶しているものとする。図17では、D=15の場合を例示している。ステップ幅Dは、Bモード画像データ生成部331がBモード画像データを生成する際に利用するデータステップ幅と一致させることが望ましいが、周波数解析部412における演算量を削減したい場合には、ステップ幅Dとしてデータステップ幅より大きい値を設定してもよい。
その後、周波数解析部412は、データ位置Z(k)が音線SRkにおける最大値Z(k)
maxより大きいか否かを判定する(ステップS329)。データ位置Z(k)が最大値Z(k)
maxより大きい場合(ステップS329:Yes)、周波数解析部412はカウンタkを1増加させる(ステップS330)。これは、処理をとなりの音線へ移すことを意味する。一方、データ位置Z(k)が最大値Z(k)
max以下である場合(ステップS329:No)、周波数解析部412はステップS323へ戻る。このようにして、周波数解析部412は、音線SRkに対して、[(Z(k)
max-Z(k)
0+1)/D+1]個のサンプルデータ群に対するFFT演算を行う。ここで、[X]は、Xを超えない最大の整数を表す。
ステップS330の後、周波数解析部412は、カウンタkが最大値kmaxより大きいか否かを判定する(ステップS331)。カウンタkが最大値kmaxより大きい場合(ステップS331:Yes)、周波数解析部412は一連の周波数解析処理を終了する。一方、カウンタkが最大値kmax以下である場合(ステップS331:No)、周波数解析部412はステップS322に戻る。この最大値kmaxは、術者等のユーザが入力部38を通じて任意に指示入力した値、もしくは、記憶部39にあらかじめ設定された値とする。
このようにして、周波数解析部412は、解析対象領域内の(kmax-k0+1)本の音線の各々について複数回のFFT演算を行う。FFT演算の結果は、受信深度および受信方向とともに記憶部39に格納される。
以上説明したステップS307の周波数解析処理に続いて、特徴量算出部413は、複数の周波数スペクトルの補正前特徴量をそれぞれ算出し、超音波が観測対象を伝播する際の互いに異なる減衰特性を与える複数の減衰率候補値の各々において、各周波数スペクトルの補正前特徴量に対して超音波の減衰の影響を排除する減衰補正を行うことによって各周波数スペクトルの補正特徴量を算出し、該補正特徴量を用いて複数の減衰率候補値の中から観測対象に最適な減衰率を設定する(ステップS308~S314)。以下、ステップS308~S314の処理を詳細に説明する。
ステップS308において、近似部413aは、周波数解析部412が算出した複数の周波数スペクトルをそれぞれ回帰分析することにより、各周波数スペクトルに対応する補正前特徴量を算出する(ステップS308)。具体的には、近似部413aは、各周波数スペクトルを回帰分析することによって一次式で近似し、補正前特徴量として傾きa0、切片b0、ミッドバンドフィットc0を算出する。例えば、図18に示す直線L10は、近似部413aが周波数帯域Fの周波数スペクトルC1に対し回帰分析によって近似した回帰直線である。
ステップS309では、最適減衰率設定部413cは、後述する減衰補正を行う際に適用する減衰率候補値αの値を所定の初期値α0に設定する。この初期値α0の値は、予め記憶部39が記憶しておき、最適減衰率設定部413cが記憶部39を参照するようにすればよい。
続いて、減衰補正部413bは、近似部413aが各周波数スペクトルに対して近似した補正前特徴量に対し、減衰率候補値をαとして減衰補正を行うことにより、補正特徴量を算出し、減衰率候補値αとともに記憶部39に格納する(ステップS310)。
ステップS310において、減衰補正部413bは、上述した式(2)、(4)における受信深度zに、超音波信号の音線のデータ配列を用いて得られるデータ位置Z=(fsp/2vs)Dnを代入することによって算出する。ここで、fspはデータのサンプリング周波数、vsは音速、Dはデータステップ幅、nは処理対象の振幅データ群のデータ位置までの音線の1番目のデータからのデータステップ数である。例えば、データのサンプリング周波数fspを50MHzとし、音速vsを1530m/secとし、図17に示すデータ配列を採用してステップ幅Dを15とすると、Z=0.2295n(mm)となる。
最適減衰率設定部413cは、減衰補正部413bが各周波数スペクトルに対して減衰補正することによって得られた複数の補正特徴量のうち代表となる補正特徴量の分散を算出し、減衰率候補値αと対応づけて記憶部39へ格納する(ステップS311)。補正特徴量が傾きa、ミッドバンドフィットcである場合、最適減衰率設定部413cは、例えば、補正特徴量cの分散を算出する。ステップS311において、最適減衰率設定部413cは、特徴量画像データ生成部332が、傾きを用いて特徴量画像データを生成する場合は補正特徴量aの分散を適用し、ミッドバンドフィットを用いて特徴量画像データを生成する場合は補正特徴量cの分散を適用するのが好ましい。
この後、最適減衰率設定部413cは、減衰率候補値αの値をΔαだけ増加させ(ステップS312)、増加後の減衰率候補値αと所定の最大値αmaxとの大小を比較する(ステップS313)。ステップS313における比較の結果、減衰率候補値αが最大値αmaxより大きい場合(ステップS313:Yes)、超音波観測装置3CはステップS314へ移行する。一方、ステップS313における比較の結果、減衰率候補値αが最大値αmax以下である場合(ステップS313:No)、超音波観測装置3CはステップS310へ戻る。
ステップS314において、最適減衰率設定部413cは、記憶部39が記憶する減衰率候補値ごとの分散を参照し、分散が最小である減衰率候補値を最適な減衰率として設定する(ステップS314)。
各データ位置において最適な減衰率が設定されると、超音波観測装置3Cでは、この減衰率を物理量として、関心領域において設定された小領域または分割領域の減衰率の算出、およびその減衰率に基づくBモード画像データの生成を行う(ステップS315)。具体的には、超音波観測装置3Cは、例えば、図8に示すフローチャートのステップS105~S115の処理を行う。例えば、判定部35が、補正特徴量cを物理量として、関心領域における各領域について補正特徴量cのヒストグラムを生成して、対象の領域が一様であるか否かを判定し、領域変更部362および算出領域設定部363が、判定結果に基づいて領域の設定を行う。その後、減衰率設定部37が、各領域の減衰率を設定し、Bモード画像データ生成部331が、設定された減衰率で減衰補正したBモード画像データを生成する。
この後、特徴量画像データ生成部332は、ステップS315においてBモード画像データ生成部331が生成したBモード画像データにおける各画素に対し、ステップS310で算出された補正特徴量に関連づけた視覚情報(例えば色相)を重畳するとともに、最適な減衰率の情報を加えることによって特徴量画像データを生成する(ステップS316)。
ステップS316に続くステップS317では、表示装置4は、制御部40の制御のもと、特徴量画像データ生成部332が生成した特徴量画像データに対応する特徴量画像を表示する。図22は、表示装置4における特徴量画像の表示例を模式的に示す図である。同図に示す特徴量画像201は、Bモード画像に特徴量に関する視覚情報が重畳された画像を表示する重畳画像表示部202と、観測対象の識別情報などを表示する情報表示部203とを有する。なお、情報表示部203に、特徴量の情報、減衰率の情報、近似式の情報、ゲインやコントラスト等の画像情報等をさらに表示するようにしてもよい。また、特徴量画像に対応するBモード画像を特徴量画像と並べて表示してもよい。
以上説明した本発明の実施の形態5では、周波数解析により算出される減衰率を物理量として、関心領域内において設定されている領域ごとに物理量が一様であるか否かを判断し、判断結果に応じて領域を分割し、物理量が一様となった領域について減衰率を設定するようにした。これにより、関心領域の大きさを維持しつつ、この関心領域における減衰率を適切に設定することができる。このように設定された減衰率を用いることによって、高精度な超音波画像を作成することができる。
また、本実施の形態5によれば、超音波が観測対象を伝播する際の互いに異なる減衰特性を与える複数の減衰率候補値の中から観測対象に最適な減衰率を設定し、該最適な減衰率を用いて減衰補正を行うことによって複数の周波数スペクトルの各々の特徴量を算出するため、観測対象に適合した超音波の減衰特性を簡易な計算によって求めることができるとともに、その減衰特性を利用した観測を行うことができる。
また、本実施の形態5によれば、各周波数スペクトルを減衰補正した補正特徴量の統計的なばらつきに基づいて最適な減衰率を設定するため、複数の減衰モデルとフィッティングを行う従来技術と比較して、計算量を削減することができる。
なお、上述した実施の形態5において、最適減衰率設定部413cが、受信深度に対応する深さ方向に沿って対象のデータまでの減衰率を累積した累積減衰率を最適な減衰率として設定するようにしてもよい。
(実施の形態5の変形例1)
続いて、本発明の実施の形態5の変形例1について説明する。図23は、本発明の実施の形態5の変形例1に係る超音波観測装置が行う処理の概要を示すフローチャートである。本変形例1に係る超音波診断システムは、上述した超音波診断システム1Cと同様である。また、本変形例1は、図20に示すステップS315の処理内容が異なる以外は、図20と同様の流れで特徴量画像の表示まで行う。以下、実施の形態5とは異なる処理(関心領域の減衰率の算出、およびその減衰率に基づくBモード画像データの生成)について説明する。
続いて、本発明の実施の形態5の変形例1について説明する。図23は、本発明の実施の形態5の変形例1に係る超音波観測装置が行う処理の概要を示すフローチャートである。本変形例1に係る超音波診断システムは、上述した超音波診断システム1Cと同様である。また、本変形例1は、図20に示すステップS315の処理内容が異なる以外は、図20と同様の流れで特徴量画像の表示まで行う。以下、実施の形態5とは異なる処理(関心領域の減衰率の算出、およびその減衰率に基づくBモード画像データの生成)について説明する。
ステップS401において、演算部41は、各小領域の特徴量(例えば補正特徴量c)の頻度割合に関するヒストグラムを生成する。
その後、演算部41は、ヒストグラムのピークに対応する特徴量を中心とする判定領域を設定する(ステップS402)。図24および図25は、特徴量に対する頻度割合の頻度分布を示す図である。図24および図25は、各特徴量における頻度割合のヒストグラムを曲線近似した曲線L2、L101を示している。演算部41は、例えば、図24、25に示すように、ヒストグラムのピークに対応する特徴量θMを中心とする領域(図24、25では、特徴量θLから特徴量θHまで)を判定領域に設定する。なお、判定領域の範囲は、部位ごとに異なる範囲を設定してもよいし、ユーザによって設定可能としてもよい。
ステップS402に続くステップS403において、総度数に対する判定領域の度数和の割合を算出する。具体的に、演算部41は、設定した判定領域の頻度の総和(度数和)と、全頻度の総和(総度数)とを算出する。その後、演算部41は、総度数に対する度数和の割合を算出する。本変形例1では、補正特徴量cを物理量とし、ステップS403において算出された度数和の割合が判定値となる。
ステップS403に続くステップS404において、判定部35は、判定対象の領域の判定値(度数和の割合)と、記憶部39に記憶されている閾値とを比較して、判定値が閾値以上であるか否かを判断する。判定部35は、判定値が閾値より小さいと判断した場合(ステップS404:No)、対象の小領域が一様ではないと判定し(例えば図25に示す曲線L101を参照)、ステップS405に移行する。ステップS403で用いる閾値は、例えば、過去の施術例に基づいて設定される。
ステップS405において、領域変更部362が、判定対象の領域について、現在設定されている大きさが、最小設定領域であるか否かを判断する。この際、領域変更部362は、判定対象の領域が、最小設定領域であると判断した場合(ステップS405:Yes)、ステップS406に移行する。
ステップS406において、領域変更部362は、対象の領域を非減衰率算出領域として設定し、ステップS410に移行する。
これに対し、領域変更部362は、判定対象の領域が、最小設定領域ではないと判断した場合(ステップS405:No)、ステップS407に移行する。
ステップS407において、領域変更部362は、ステップS108と同様にして、対象の領域をさらに分割する。その後、演算部41は、分割領域について、判定値を算出する(ステップS408)。制御部40は、判定値を算出後、ステップS404に戻り、上述した判定処理を行う。
一方、ステップS404において、判定部35は、判定値が閾値以上であると判断した場合(ステップS404:Yes)、対象の小領域が一様であると判定し(例えば図24に示す曲線L2を参照)、ステップS409に移行する。
ステップS409において、算出領域設定部363は、設定されている領域を減衰率算出領域として設定する。制御部40は、減衰率算出領域の設定後、ステップS410に移行する。
ステップS410において、制御部40は、未判定の領域が残っているか否かを判断する。ここで、制御部40は、未判定の領域が残っていると判断した場合(ステップS410:Yes)、ステップS404に戻り、未判定の領域について、上述した処理を行わせる。これに対し、制御部40は、未判定の領域が残っていないと判断した場合(ステップS410:No)、ステップS411に移行する。
ステップS411において、減衰率設定部37が、減衰率算出領域に設定されている小領域および/または分割領域のそれぞれについて、減衰率を設定する。その後、信号処理部32が、設定された減衰率を用いて、各領域の減衰補正を行う(ステップS412)。
画像処理部33Aは、減衰補正後のBモード用受信データを取得して、超音波画像であるBモード画像を含むBモード画像データを生成する(ステップS413)。ステップS413においてBモード画像データが生成された後、制御部40は、ステップS316に戻り、上述した処理を実行する。
以上説明した本変形例1では、特徴量に基づいて算出される頻度割合を物理量として、関心領域内において設定されている領域ごとに物理量が一様であるか否かを判断し、判断結果に応じて領域を分割し、物理量が一様となった領域について減衰率を設定するようにした。これにより、関心領域の大きさを維持しつつ、この関心領域における減衰率を適切に設定することができる。このように設定された減衰率を用いることによって、高精度な超音波画像を作成することができる。
(実施の形態5の変形例2)
続いて、本発明の実施の形態5の変形例2について説明する。図26は、本発明の実施の形態5の変形例2に係る超音波観測装置が行う処理の概要を示すフローチャートである。本変形例2に係る超音波診断システムは、上述した超音波診断システム1Cと同様である。また、本変形例2は、図20に示すステップS315の処理内容が異なる以外は、図20と同様の流れで特徴量画像の表示まで行う。以下、実施の形態5とは異なる処理(関心領域の減衰率の算出、およびその減衰率に基づくBモード画像データの生成)について説明する。
続いて、本発明の実施の形態5の変形例2について説明する。図26は、本発明の実施の形態5の変形例2に係る超音波観測装置が行う処理の概要を示すフローチャートである。本変形例2に係る超音波診断システムは、上述した超音波診断システム1Cと同様である。また、本変形例2は、図20に示すステップS315の処理内容が異なる以外は、図20と同様の流れで特徴量画像の表示まで行う。以下、実施の形態5とは異なる処理(関心領域の減衰率の算出、およびその減衰率に基づくBモード画像データの生成)について説明する。
ステップS501において、演算部41は、上述したステップS401と同様にして、各小領域の特徴量(例えば補正特徴量c)の頻度割合に関するヒストグラムを生成する。
その後、演算部41は、ヒストグラムのピークに対応する特徴量を中心とする判定領域を設定する(ステップS502)。本変形例2では、判定領域外における頻度割合の値(ピーク値)が判定値となる。
ステップS502に続くステップS503において、判定部35は、判定領域外にピークがある場合、このピーク値(判定値)と、記憶部39に記憶されている閾値とを比較して、判定値が閾値以上であるか否かを判断する。判定部35は、判定値が閾値以上であると判断した場合(ステップS503:Yes)、対象の小領域が一様ではないと判定し、ステップS504に移行する。ステップS503で用いる閾値は、例えば、過去の施術例に基づいて設定される。
図27は、特徴量に対する頻度割合の頻度分布を示す図である。図27は、各特徴量における頻度割合のヒストグラムを曲線近似した曲線L102を示している。図27に示す曲線L102は、判定領域外である特徴量θHよりも大きい特徴量において、頻度割合の閾値STHよりも大きい頻度割合のピークを有している。この場合、判定部35は、対象の小領域が一様ではないと判定する。
ステップS503において、領域変更部362が、判定対象の領域について、現在設定されている大きさが、最小設定領域であるか否かを判断する。この際、領域変更部362は、判定対象の領域が、最小設定領域であると判断した場合(ステップS503:Yes)、ステップS505に移行する。
ステップS505において、領域変更部362は、対象の領域を非減衰率算出領域として設定し、ステップS510に移行する。
これに対し、領域変更部362は、判定対象の領域が、最小設定領域ではないと判断した場合(ステップS504:No)、ステップS506に移行する。
ステップS506において、領域変更部362は、ステップS108と同様にして、対象の領域をさらに分割する。その後、演算部41は、分割領域について、上述しヒストグラムを生成し(ステップS507)、該ヒストグラムについて判定領域の設定を行う(ステップS508)。制御部40は、判定領域を設定後、ステップS503に戻り、上述した判定処理を行う。
一方、ステップS504において、判定部35は、判定値(ピーク値)が閾値より小さい、またはピークが存在しないと判断した場合(ステップS504:Yes)、対象の小領域が一様であると判定し(例えば図24に示す曲線L2を参照)、ステップS509に移行する。なお、判定部35は、そもそも判定領域外にピークがなければ、判定値が閾値より小さいと判定する。
ステップS509において、算出領域設定部363は、設定されている領域を減衰率算出領域として設定する。制御部40は、減衰率算出領域の設定後、ステップS510に移行する。
ステップS510において、制御部40は、未判定の領域が残っているか否かを判断する。ここで、制御部40は、未判定の領域が残っていると判断した場合(ステップS510:Yes)、ステップS503に戻り、未判定の領域について、上述した処理を行わせる。これに対し、制御部40は、未判定の領域が残っていないと判断した場合(ステップS510:No)、ステップS511に移行する。
ステップS511において、減衰率設定部37が、減衰率算出領域に設定されている小領域および/または分割領域のそれぞれについて、減衰率を設定する。その後、信号処理部32が、設定された減衰率を用いて、各領域の減衰補正を行う(ステップS512)。
画像処理部33Aは、減衰補正後のBモード用受信データを取得して、超音波画像であるBモード画像を含むBモード画像データを生成する(ステップS513)。ステップS513においてBモード画像データが生成された後、制御部40は、ステップS316に戻り、上述した処理を実行する。
以上説明した本変形例2では、特徴量に基づいて算出される頻度割合であって、判定領域外のピーク値を物理量として、関心領域内において設定されている領域ごとに物理量が一様であるか否かを判断し、判断結果に応じて領域を分割し、物理量が一様となった領域について減衰率を設定するようにした。これにより、関心領域の大きさを維持しつつ、この関心領域における減衰率を適切に設定することができる。このように設定された減衰率を用いることによって、高精度な超音波画像を作成することができる。
なお、上述した実施の形態5および変形例1、2では、補正特徴量cを物理量として説明したが、実施の形態1~4のように、輝度を物理量としてもよい。
ここまで、本発明を実施するための形態を説明してきたが、本発明は上述した実施の形態によってのみ限定されるべきものではない。例えば、観測対象が生体組織であることを例に説明したが、材料の特性を観測する工業用の内視鏡であっても適用できる。本発明にかかる超音波観測装置は、体内、体外を問わず適用可能である。また、超音波のほか、赤外線などを照射して観測対象の信号を送受信するものであってもよい。
なお、上述した実施の形態1~5では、判定部35が、Bモード画像における輝度、または周波数特徴量に関連した補正特徴量を物理量として、対象の領域が一様であるか否かを判定するものとして説明したが、これに限らない。例えば、物理量として、周波数特徴量に関連した補正特徴量aや、スペクトル強度、スペクトル強度と相関のある値、エラストグラフィにおける変化値、音速などが挙げられる。
なお、上述した実施の形態1~5では、関心領域設定部36が、小領域設定部361と、領域変更部362とを有しているものとして説明したが、関心領域設定部36、小領域設定部361、および領域変更部362が互いに独立していてもよい。
また、超音波観測装置において、各機能を有する回路同士をバスで接続することによって構成してもよいし、一部の機能が他の機能の回路構造に内蔵されるように構成してもよい。
また、本実施の形態では、超音波プローブとしてライトガイド等の光学系を有する超音波内視鏡を用いて説明したが、超音波内視鏡に限らず、撮像光学系および撮像素子を有しない超音波プローブであってもよい。さらに、超音波プローブとして、光学系のない細径の超音波ミニチュアプローブを適用してもよい。超音波ミニチュアプローブは、通常、胆道、胆管、膵管、気管、気管支、尿道、尿管へ挿入され、その周囲臓器(膵臓、肺、前立腺、膀胱、リンパ節等)を観察する際に用いられる。
また、超音波プローブとして、被検体の体表から超音波を照射する体外式超音波プローブを適用してもよい。体外式超音波プローブは、通常、腹部臓器(肝臓、胆嚢、膀胱)、乳房(特に乳腺)、甲状腺を観察する際に体表に直接接触させて用いられる。
また、超音波振動子は、リニア型の振動子でもラジアル型の振動子でもコンベックス型の振動子でも構わない。超音波振動子がリニア型の振動子である場合、その走査領域は矩形(長方形、正方形)をなし、超音波振動子がラジアル型の振動子やコンベックス型の振動子である場合、その走査領域は扇形や円環状をなす。
このように、本発明は、請求の範囲に記載した技術的思想を逸脱しない範囲内において、様々な実施の形態を含みうるものである。
以上のように、本発明にかかる超音波観測装置、超音波観測装置の作動方法および超音波観測装置の作動プログラムは、関心領域の大きさを維持しつつ、この関心領域における減衰率を適切に設定するのに有用である。
1、1A、1B、1C 超音波診断システム
2 超音波内視鏡
3、3A、3B、3C 超音波観測装置
4 表示装置
21 超音波振動子
31 送受信部
32 信号処理部
33、33A 画像処理部
34、34A、34B 判定値算出部
35 判定部
36 関心領域設定部
37 減衰率設定部
38 入力部
39 記憶部
40 制御部
41 演算部
311 信号増幅部
361 小領域設定部
362 領域変更部
363 算出領域設定部
391 関心領域設定情報記憶部
411 増幅補正部
412 周波数解析部
413 特徴量算出部
413a 近似部
413b 減衰補正部
413c 最適減衰率設定部
2 超音波内視鏡
3、3A、3B、3C 超音波観測装置
4 表示装置
21 超音波振動子
31 送受信部
32 信号処理部
33、33A 画像処理部
34、34A、34B 判定値算出部
35 判定部
36 関心領域設定部
37 減衰率設定部
38 入力部
39 記憶部
40 制御部
41 演算部
311 信号増幅部
361 小領域設定部
362 領域変更部
363 算出領域設定部
391 関心領域設定情報記憶部
411 増幅補正部
412 周波数解析部
413 特徴量算出部
413a 近似部
413b 減衰補正部
413c 最適減衰率設定部
Claims (10)
- 観測対象へ超音波を送信し、該観測対象で反射された超音波を受信する超音波振動子から受信した超音波信号に基づく超音波画像データを生成する超音波観測装置であって、
前記超音波画像データに応じた超音波画像内において設定された関心領域に対して、予め設定された条件にしたがって前記関心領域を分割した複数の小領域を設定する小領域設定部と、
予め設定された物理量をもとに各小領域のヒストグラムを生成し、該ヒストグラムに基づいて、前記小領域内の物理量が一様であるか否かを判定するための判定値を前記小領域ごとに算出する判定値算出部と、
前記判定値と、予め設定されている閾値とをもとに、前記小領域内の物理量が一様であるか否かを判定する判定部と、
前記判定部により判定対象の前記小領域内の物理量が一様でないと判定された場合、予め設定された条件にしたがって当該小領域を変更する領域変更部と、
前記判定部により判定対象の前記小領域内の物理量が一様であると判定された場合、当該小領域を減衰率算出対象領域として設定する領域設定部と、
前記減衰率算出対象領域の減衰率を設定する減衰率設定部と、
を備えることを特徴とする超音波観測装置。 - 前記領域変更部は、前記判定部によって判定対象の前記小領域内の物理量が一様でないと判定された場合に、当該小領域を分割して複数の分割領域を設定する
ことを特徴とする請求項1に記載の超音波観測装置。 - 前記判定値算出部による前記判定値の算出、前記判定部による判定、および前記領域変更部による前記分割領域の設定を、前記判定部によって一様であると判定されるか、または、前記分割領域の大きさが、予め設定されている最小設定領域の大きさとなるまで繰り返す
ことを特徴とする請求項2に記載の超音波観測装置。 - 前記減衰率設定部は、前記最小設定領域の大きさの前記分割領域内の物理量が、前記判定部により一様ではないと判定された場合、該分割領域の周囲の前記小領域または前記分割領域の減衰率に基づいて、当該分割領域の減衰率を設定する
ことを特徴とする請求項3に記載の超音波観測装置。 - 前記領域変更部は、前記判定部によって一様でないと判定された前記小領域を含む場合に、前記関心領域を予め設定された方向に移動させる
ことを特徴とする請求項1に記載の超音波観測装置。 - 前記判定値算出部は、前記ヒストグラムのばらつきを算出し、
前記判定部は、前記ばらつきと、前記ばらつきに関して予め設定されている閾値とをもとに、判定対象の前記小領域内の物理量が一様であるか否かを判定する
ことを特徴とする請求項1に記載の超音波観測装置。 - 前記判定値算出部は、前記ヒストグラムの極大値の数を算出し、
前記判定部は、前記極大値の数と、前記極大値の数に関して予め設定されている閾値とをもとに、判定対象の前記小領域内の物理量が一様であるか否かを判定する
ことを特徴とする請求項1に記載の超音波観測装置。 - 前記判定値算出部は、前記ヒストグラムが複数の極大値を有する場合、各極大値に対応する物理量の差を算出し、
前記判定部は、前記物理量の差と、前記物理量の差に関して予め設定されている閾値とをもとに、判定対象の前記小領域内の物理量が一様であるか否かを判定する
ことを特徴とする請求項1に記載の超音波観測装置。 - 超音波信号に基づいて超音波画像データを生成する超音波観測装置の作動方法であって、
小領域設定部が、前記超音波画像データに応じた超音波画像内において設定された関心領域に対して、予め設定された条件にしたがって前記関心領域を分割した複数の小領域を設定する第1領域設定ステップと、
判定値算出部が、予め設定された物理量をもとに各小領域のヒストグラムを生成し、該ヒストグラムに基づいて、前記小領域内の物理量が一様であるか否かを判定するための判定値を前記小領域ごとに算出する判定値算出ステップと、
判定部が、前記判定値と、予め設定されている閾値とをもとに、前記小領域内の物理量が一様であるか否かを判定する判定ステップと、
領域変更部が、前記判定ステップにより判定対象の前記小領域内の物理量が一様でないと判定された場合、予め設定された条件にしたがって当該小領域を変更する領域変更ステップと、
領域設定部が、前記判定ステップにより判定対象の前記小領域内の物理量が一様であると判定された場合、当該小領域を減衰率算出対象領域として設定する第2領域設定ステップと、
減衰率設定部が、前記減衰率算出対象領域の減衰率を設定する減衰率設定ステップと、
を含むことを特徴とする超音波観測装置の作動方法。 - 超音波信号に基づいて超音波画像データを生成する超音波観測装置の作動プログラムであって、
小領域設定部が、前記超音波画像データに応じた超音波画像内において設定された関心領域に対して、予め設定された条件にしたがって前記関心領域を分割した複数の小領域を設定する第1領域設定手順と、
判定値算出部が、予め設定された物理量をもとに各小領域のヒストグラムを生成し、該ヒストグラムに基づいて、前記小領域内の物理量が一様であるか否かを判定するための判定値を前記小領域ごとに算出する判定値算出手順と、
判定部が、前記判定値と、予め設定されている閾値とをもとに、前記小領域内の物理量が一様であるか否かを判定する判定手順と、
領域変更部が、前記判定手順により判定対象の前記小領域内の物理量が一様でないと判定された場合、予め設定された条件にしたがって当該小領域を変更する領域変更手順と、
領域設定部が、前記判定手順により判定対象の前記小領域内の物理量が一様であると判定された場合、当該小領域を減衰率算出対象領域として設定する第2領域設定手順と、
減衰率設定部が、前記減衰率算出対象領域の減衰率を設定する減衰率設定手順と、
を前記超音波観測装置に実行させることを特徴とする超音波観測装置の作動プログラム。
Priority Applications (1)
| Application Number | Priority Date | Filing Date | Title |
|---|---|---|---|
| US16/516,343 US11284862B2 (en) | 2017-01-31 | 2019-07-19 | Ultrasound observation device, method of operating ultrasound observation device, and computer readable recording medium |
Applications Claiming Priority (2)
| Application Number | Priority Date | Filing Date | Title |
|---|---|---|---|
| JP2017015929 | 2017-01-31 | ||
| JP2017-015929 | 2017-01-31 |
Related Child Applications (1)
| Application Number | Title | Priority Date | Filing Date |
|---|---|---|---|
| US16/516,343 Continuation US11284862B2 (en) | 2017-01-31 | 2019-07-19 | Ultrasound observation device, method of operating ultrasound observation device, and computer readable recording medium |
Publications (1)
| Publication Number | Publication Date |
|---|---|
| WO2018142937A1 true WO2018142937A1 (ja) | 2018-08-09 |
Family
ID=63039623
Family Applications (1)
| Application Number | Title | Priority Date | Filing Date |
|---|---|---|---|
| PCT/JP2018/001208 WO2018142937A1 (ja) | 2017-01-31 | 2018-01-17 | 超音波観測装置、超音波観測装置の作動方法および超音波観測装置の作動プログラム |
Country Status (2)
| Country | Link |
|---|---|
| US (1) | US11284862B2 (ja) |
| WO (1) | WO2018142937A1 (ja) |
Cited By (4)
| Publication number | Priority date | Publication date | Assignee | Title |
|---|---|---|---|---|
| JP2020092767A (ja) * | 2018-12-11 | 2020-06-18 | キヤノンメディカルシステムズ株式会社 | 画像解析装置、画像診断装置、モデル学習装置、及びroi設定プログラム |
| WO2020157870A1 (ja) * | 2019-01-30 | 2020-08-06 | オリンパス株式会社 | 超音波観測装置、超音波観測装置の作動方法および超音波観測装置の作動プログラム |
| WO2022054293A1 (ja) * | 2020-09-14 | 2022-03-17 | オリンパス株式会社 | 超音波観測装置、超音波観測装置の作動方法および超音波観測装置の作動プログラム |
| JP7421076B2 (ja) | 2019-12-26 | 2024-01-24 | 株式会社デンソーウェーブ | ロボットの制御装置 |
Citations (2)
| Publication number | Priority date | Publication date | Assignee | Title |
|---|---|---|---|---|
| JP2016116792A (ja) * | 2014-12-22 | 2016-06-30 | オリンパス株式会社 | 超音波観測装置、超音波観測装置の作動方法および超音波観測装置の作動プログラム |
| WO2016103847A1 (ja) * | 2014-12-22 | 2016-06-30 | オリンパス株式会社 | 超音波観測装置、超音波観測装置の作動方法および超音波観測装置の作動プログラム |
Family Cites Families (4)
| Publication number | Priority date | Publication date | Assignee | Title |
|---|---|---|---|---|
| JP4526445B2 (ja) * | 2005-06-15 | 2010-08-18 | オリンパス株式会社 | 撮像装置 |
| TWI389552B (zh) * | 2009-04-28 | 2013-03-11 | Mstar Semiconductor Inc | 影像處理裝置以及影像處理方法 |
| JP2016002208A (ja) | 2014-06-16 | 2016-01-12 | 日立アロカメディカル株式会社 | 超音波診断装置 |
| JP6469448B2 (ja) * | 2015-01-06 | 2019-02-13 | オリンパス株式会社 | 画像処理装置、撮像装置、画像処理方法、および記録媒体 |
-
2018
- 2018-01-17 WO PCT/JP2018/001208 patent/WO2018142937A1/ja active Application Filing
-
2019
- 2019-07-19 US US16/516,343 patent/US11284862B2/en active Active
Patent Citations (2)
| Publication number | Priority date | Publication date | Assignee | Title |
|---|---|---|---|---|
| JP2016116792A (ja) * | 2014-12-22 | 2016-06-30 | オリンパス株式会社 | 超音波観測装置、超音波観測装置の作動方法および超音波観測装置の作動プログラム |
| WO2016103847A1 (ja) * | 2014-12-22 | 2016-06-30 | オリンパス株式会社 | 超音波観測装置、超音波観測装置の作動方法および超音波観測装置の作動プログラム |
Cited By (7)
| Publication number | Priority date | Publication date | Assignee | Title |
|---|---|---|---|---|
| JP2020092767A (ja) * | 2018-12-11 | 2020-06-18 | キヤノンメディカルシステムズ株式会社 | 画像解析装置、画像診断装置、モデル学習装置、及びroi設定プログラム |
| JP7304150B2 (ja) | 2018-12-11 | 2023-07-06 | キヤノンメディカルシステムズ株式会社 | 画像解析装置、画像診断装置、及びroi設定プログラム |
| WO2020157870A1 (ja) * | 2019-01-30 | 2020-08-06 | オリンパス株式会社 | 超音波観測装置、超音波観測装置の作動方法および超音波観測装置の作動プログラム |
| JPWO2020157870A1 (ja) * | 2019-01-30 | 2021-10-21 | オリンパス株式会社 | 超音波観測装置、超音波観測装置の作動方法および超音波観測装置の作動プログラム |
| JP7100160B2 (ja) | 2019-01-30 | 2022-07-12 | オリンパス株式会社 | 超音波観測装置、超音波観測装置の作動方法および超音波観測装置の作動プログラム |
| JP7421076B2 (ja) | 2019-12-26 | 2024-01-24 | 株式会社デンソーウェーブ | ロボットの制御装置 |
| WO2022054293A1 (ja) * | 2020-09-14 | 2022-03-17 | オリンパス株式会社 | 超音波観測装置、超音波観測装置の作動方法および超音波観測装置の作動プログラム |
Also Published As
| Publication number | Publication date |
|---|---|
| US20190336106A1 (en) | 2019-11-07 |
| US11284862B2 (en) | 2022-03-29 |
Similar Documents
| Publication | Publication Date | Title |
|---|---|---|
| US20170007211A1 (en) | Ultrasound observation apparatus, method for operating ultrasound observation apparatus, and computer-readable recording medium | |
| US11284862B2 (en) | Ultrasound observation device, method of operating ultrasound observation device, and computer readable recording medium | |
| US10201329B2 (en) | Ultrasound observation apparatus, method for operating ultrasound observation apparatus, and computer-readable recording medium | |
| US11176640B2 (en) | Ultrasound observation device, method of operating ultrasound observation device, and computer-readable recording medium | |
| US20180271478A1 (en) | Ultrasound observation device, method of operating ultrasound observation device, and computer-readable recording medium | |
| JP6892320B2 (ja) | 超音波観測装置、超音波観測装置の作動方法および超音波観測装置の作動プログラム | |
| CN108366782B (zh) | 超声波诊断装置、超声波诊断装置的工作方法以及记录介质 | |
| JP2016202567A (ja) | 超音波観測装置、超音波観測装置の作動方法および超音波観測装置の作動プログラム | |
| WO2016181869A1 (ja) | 超音波観測装置、超音波観測装置の作動方法および超音波観測装置の作動プログラム | |
| US10617389B2 (en) | Ultrasound observation apparatus, method of operating ultrasound observation apparatus, and computer-readable recording medium | |
| JP2017113145A (ja) | 超音波観測装置、超音波観測装置の作動方法および超音波観測装置の作動プログラム | |
| JP5981072B1 (ja) | 超音波観測装置、超音波観測装置の作動方法および超音波観測装置の作動プログラム | |
| JP6138402B2 (ja) | 超音波観測装置、超音波観測装置の作動方法および超音波観測装置の作動プログラム | |
| JP6022135B1 (ja) | 超音波診断装置、超音波診断装置の作動方法および超音波診断装置の作動プログラム | |
| WO2016181856A1 (ja) | 超音波診断装置、超音波診断装置の作動方法および超音波診断装置の作動プログラム | |
| US20210345990A1 (en) | Ultrasound imaging apparatus, operating method of ultrasound imaging apparatus, and computer-readable recording medium | |
| JP5953457B1 (ja) | 超音波観測装置、超音波観測装置の作動方法および超音波観測装置の作動プログラム | |
| JP6010274B1 (ja) | 超音波観測装置、超音波観測装置の作動方法および超音波観測装置の作動プログラム | |
| EP3238632B1 (en) | Ultrasound observation apparatus, method for operating ultrasound observation apparatus, and program for operating ultrasound observation apparatus | |
| JP2017217313A (ja) | 超音波観測装置、超音波観測装置の作動方法および超音波観測装置の作動プログラム |
Legal Events
| Date | Code | Title | Description |
|---|---|---|---|
| 121 | Ep: the epo has been informed by wipo that ep was designated in this application |
Ref document number: 18747689 Country of ref document: EP Kind code of ref document: A1 |
|
| NENP | Non-entry into the national phase |
Ref country code: DE |
|
| 122 | Ep: pct application non-entry in european phase |
Ref document number: 18747689 Country of ref document: EP Kind code of ref document: A1 |
|
| NENP | Non-entry into the national phase |
Ref country code: JP |