WO2016157455A1 - 部材の管理状況監視プログラム、部材の管理状況監視方法および部材の管理状況監視装置 - Google Patents
部材の管理状況監視プログラム、部材の管理状況監視方法および部材の管理状況監視装置 Download PDFInfo
- Publication number
- WO2016157455A1 WO2016157455A1 PCT/JP2015/060263 JP2015060263W WO2016157455A1 WO 2016157455 A1 WO2016157455 A1 WO 2016157455A1 JP 2015060263 W JP2015060263 W JP 2015060263W WO 2016157455 A1 WO2016157455 A1 WO 2016157455A1
- Authority
- WO
- WIPO (PCT)
- Prior art keywords
- amount
- input
- production
- degree
- product
- Prior art date
- Legal status (The legal status is an assumption and is not a legal conclusion. Google has not performed a legal analysis and makes no representation as to the accuracy of the status listed.)
- Ceased
Links
Images







Classifications
-
- B—PERFORMING OPERATIONS; TRANSPORTING
- B65—CONVEYING; PACKING; STORING; HANDLING THIN OR FILAMENTARY MATERIAL
- B65G—TRANSPORT OR STORAGE DEVICES, e.g. CONVEYORS FOR LOADING OR TIPPING, SHOP CONVEYOR SYSTEMS OR PNEUMATIC TUBE CONVEYORS
- B65G61/00—Use of pick-up or transfer devices or of manipulators for stacking or de-stacking articles not otherwise provided for
-
- G—PHYSICS
- G05—CONTROLLING; REGULATING
- G05B—CONTROL OR REGULATING SYSTEMS IN GENERAL; FUNCTIONAL ELEMENTS OF SUCH SYSTEMS; MONITORING OR TESTING ARRANGEMENTS FOR SUCH SYSTEMS OR ELEMENTS
- G05B19/00—Program-control systems
- G05B19/02—Program-control systems electric
- G05B19/418—Total factory control, i.e. centrally controlling a plurality of machines, e.g. direct or distributed numerical control [DNC], flexible manufacturing systems [FMS], integrated manufacturing systems [IMS] or computer integrated manufacturing [CIM]
-
- G—PHYSICS
- G06—COMPUTING OR CALCULATING; COUNTING
- G06Q—INFORMATION AND COMMUNICATION TECHNOLOGY [ICT] SPECIALLY ADAPTED FOR ADMINISTRATIVE, COMMERCIAL, FINANCIAL, MANAGERIAL OR SUPERVISORY PURPOSES; SYSTEMS OR METHODS SPECIALLY ADAPTED FOR ADMINISTRATIVE, COMMERCIAL, FINANCIAL, MANAGERIAL OR SUPERVISORY PURPOSES, NOT OTHERWISE PROVIDED FOR
- G06Q50/00—Information and communication technology [ICT] specially adapted for implementation of business processes of specific business sectors, e.g. utilities or tourism
- G06Q50/04—Manufacturing
-
- Y—GENERAL TAGGING OF NEW TECHNOLOGICAL DEVELOPMENTS; GENERAL TAGGING OF CROSS-SECTIONAL TECHNOLOGIES SPANNING OVER SEVERAL SECTIONS OF THE IPC; TECHNICAL SUBJECTS COVERED BY FORMER USPC CROSS-REFERENCE ART COLLECTIONS [XRACs] AND DIGESTS
- Y02—TECHNOLOGIES OR APPLICATIONS FOR MITIGATION OR ADAPTATION AGAINST CLIMATE CHANGE
- Y02P—CLIMATE CHANGE MITIGATION TECHNOLOGIES IN THE PRODUCTION OR PROCESSING OF GOODS
- Y02P90/00—Enabling technologies with a potential contribution to greenhouse gas [GHG] emissions mitigation
- Y02P90/02—Total factory control, e.g. smart factories, flexible manufacturing systems [FMS] or integrated manufacturing systems [IMS]
-
- Y—GENERAL TAGGING OF NEW TECHNOLOGICAL DEVELOPMENTS; GENERAL TAGGING OF CROSS-SECTIONAL TECHNOLOGIES SPANNING OVER SEVERAL SECTIONS OF THE IPC; TECHNICAL SUBJECTS COVERED BY FORMER USPC CROSS-REFERENCE ART COLLECTIONS [XRACs] AND DIGESTS
- Y02—TECHNOLOGIES OR APPLICATIONS FOR MITIGATION OR ADAPTATION AGAINST CLIMATE CHANGE
- Y02P—CLIMATE CHANGE MITIGATION TECHNOLOGIES IN THE PRODUCTION OR PROCESSING OF GOODS
- Y02P90/00—Enabling technologies with a potential contribution to greenhouse gas [GHG] emissions mitigation
- Y02P90/30—Computing systems specially adapted for manufacturing
Definitions
- the present invention relates to a member management status monitoring program and the like.
- the usage amount of a member necessary for producing a unit quantity of a product and a part is set in a part composition table that defines the composition of the part.
- the usage amount of the member is used to estimate the inventory of the member. Therefore, it is necessary to accurately estimate the usage amount of the member.
- a technique for calculating the inventory quantity of process parts is known (for example, see Patent Document 1).
- the production instruction computer acquires a barcode for identifying a product from the barcode reader 22 installed in the finished product inspection process of the production line 21, and based on the barcode, the part and the quantity of the part are obtained. It expands to the component level information indicating
- the production instruction computer stores a plurality of barcodes for identifying products in association with data indicating the configuration of the parts used in each product in a storage device, and the product parts corresponding to the acquired barcode Data indicating the configuration is read out from the storage device to be developed into component level information.
- the production instruction computer calculates the used quantity of each used part of the product for the number of products produced, and calculates each of the used quantity of the part and the quantity of the part delivered to each process by the parts transport vehicle 26. Calculate the inventory quantity of process parts.
- the conventional production management system has a problem that it is difficult to accurately estimate the amount of material used.
- the department that manages the results is the production department
- the department that reflects the amount of material used on the parts configuration table is the design department
- the department is often different. For this reason, if the cooperation between departments is not appropriate, the effect of introducing a production management system cannot be fully exhibited.
- the amount of oil and other liquids changes depending on the manufacturing machine and manufacturing procedure, so if the manufacturing machine or manufacturing procedure changes, the change will not be properly communicated between departments, and the design department will use parts. It is difficult to estimate the quantity accurately. As a result, the effect of introducing the production management system cannot be fully exhibited.
- the number of parts used often exceeds 10,000, and there are cases where the number of members defined in the parts composition table is several hundred thousand. Accordingly, it is difficult for the design department to confirm and adjust the usage amount of several hundred thousand members, and it is difficult to accurately estimate the usage amount of all the members.
- the objective is to support the work of accurately estimating the amount of material used to produce a unit quantity of products and parts.
- a product that uses a computer to calculate a first degree of change in cumulative value according to the time of input amount of the member that is input for production to a computer. Is obtained, the amount of the member required to produce the unit product of the obtained product is multiplied by the production amount, the estimated amount of the member is calculated, and the estimated amount of time of the calculated member is calculated. A second degree of change in the accumulated value is calculated, and a process of outputting a ratio between the first degree and the second degree is executed.
- FIG. 1 is a functional block diagram illustrating the configuration of the management system according to the embodiment.
- FIG. 2 is a diagram illustrating an example of an organization chart of a manufacturing department that uses a production management system.
- FIG. 3 is a diagram illustrating an example of the data structure of the input transaction.
- FIG. 4 is a diagram illustrating an example of the data structure of the component configuration table.
- FIG. 5 is a diagram illustrating an example of a product configuration image of the parts configuration table.
- FIG. 6 is a diagram illustrating an example of a data structure of a production performance transaction.
- FIG. 7 is a diagram illustrating an example of a data structure of the threshold value table.
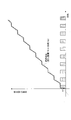
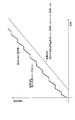
- FIG. 8A is a diagram (1) illustrating the necessity of calculating a cumulative increase tendency in input and estimation.
- FIG. 8A is a diagram (1) illustrating the necessity of calculating a cumulative increase tendency in input and estimation.
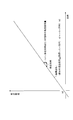
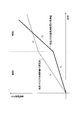
- FIG. 8B is a diagram (2) for explaining the necessity of calculating a cumulative increase tendency in input and estimation.
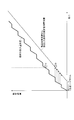
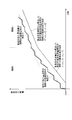
- FIG. 8C is a diagram (3) for explaining the necessity of calculating a cumulative increase tendency in input and estimation.
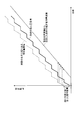
- FIG. 8D is a diagram (4) illustrating the necessity of calculating a cumulative increase tendency in input and estimation.
- FIG. 8E is a diagram (5) for explaining the necessity of calculating a cumulative increase tendency in input and estimation.
- FIG. 8F is a diagram (6) for explaining the necessity of calculating a cumulative increase tendency in input and estimation.
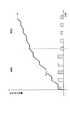
- FIG. 9A is a diagram (1) illustrating calculation of the slope R and the slope C when there are two periods in which the ratio of the number of two products produced differs.
- FIG. 9A is a diagram (1) illustrating calculation of the slope R and the slope C when there are two periods in which the ratio of the number of two products produced differs.
- FIG. 9A is a diagram (1) illustrating calculation of the slope R and the slope C when there are two periods in which the ratio
- FIG. 9B is a diagram (2) illustrating calculation of the slope R and the slope C when there are two periods in which the ratio of the number of two products produced differs.
- FIG. 9C is a diagram (3) illustrating calculation of the slope R and the slope C when there are two periods in which the ratio of the number of two products produced differs.
- FIG. 10 is a diagram for explaining the calculation of the slope R and the slope C when there is a holiday period.
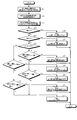
- FIG. 11 is a diagram illustrating an example of a flowchart of the member management status monitoring process according to the embodiment.
- FIG. 12 is a diagram illustrating a specific example of processing by the input cumulative increase tendency calculation unit.
- FIG. 13 is a diagram illustrating a specific example of processing by the estimated cumulative increase tendency calculation unit.
- FIG. 14 is a diagram illustrating a specific example of presentation.
- FIG. 15 is a diagram illustrating another example of a flowchart of the member management status monitoring process according to the embodiment.
- FIG. 16 is a diagram illustrating an example of a computer that executes a member management status monitoring program.
- Embodiments of a member management status monitoring program, a member management status monitoring method, and a member management status monitoring device disclosed in the present application will be described below in detail with reference to the drawings. The present invention is not limited to the embodiments.
- FIG. 1 is a functional block diagram illustrating the configuration of the management system according to the embodiment.
- the management system 100 includes a production management system 9 and a member management status monitoring device 1.
- the production management system 9 includes a receipt / payment subsystem 2, a design subsystem 3, and a production subsystem 4.
- the production management system 9 is a system that manages the flow from product ordering to production to delivery in a factory.
- the production management system 9 initiates production and performs production activities in accordance with the parts configuration table 31 that defines the product configuration.
- the part configuration table 31 includes information regarding the configuration of parts assembled from other parts to configure a product.
- FIG. 2 is a diagram illustrating an example of an organization chart of a manufacturing department that uses a production management system.
- the manufacturing department includes a warehouse / payment department, a design department, a production engineering department, and a production department.
- the warehouse / payment / dispensing department inputs the quantity of the parts input from the parts warehouse to the production department to the payment / submission subsystem 2.
- the warehouse / payment department uses the payment subsystem 2.
- the receipt / payment subsystem 2 includes an input transaction 21 which is data in which the amount of the input material is described.
- the design department designs a product, and sets a member name and a usage amount standard value (hereinafter, synonymous with “use amount”) in the part configuration table 31.
- the production engineering department specifically determines the production equipment (apparatus) and procedure, and sets the process in the parts configuration table 31.
- the design department and the production engineering department use the design subsystem 3.
- the design subsystem 3 includes a part configuration table 31.
- the production department produces products using production facilities (devices) and inputs production results to the production subsystem 4.
- the production subsystem 4 includes a production performance transaction 41.
- the member management status monitoring apparatus 1 monitors the management status of the components recorded by the production management system 9.
- the member management status monitoring apparatus 1 uses the information on the input of the member into the production process and the production results to check whether there is a setting omission of the member on the component configuration table 31 or an abnormality in the usage amount of the member on the component configuration table 31.
- the abnormality of the amount of the inserted member is determined.
- the member management status monitoring device 1 has the input transaction 21 generated by the payment subsystem 2 based on the input and registration operation from the operator, and the production generated by the production subsystem 4 based on the input and registration operation from the operator.
- the member management status monitoring device 1 includes a control unit 10 and a storage unit 20.
- the storage unit 20 includes, for example, a data exchange interface with a service bus when the system is linked, a file input / output interface when the LAN is connected, and an external storage interface when linked via an external storage. It corresponds to a storage device such as a non-volatile semiconductor memory element such as a flash memory (FRAM) (registered trademark) (Ferroelectric Random Access Memory) capable of inputting and / or outputting data via the above.
- the storage unit 20 stores an input transaction 21, a part configuration table 31, a production performance transaction 41, and a threshold table 51.
- the input transaction 21 is a storage area in which data indicating the input amount of a member input from the paying / receiving department to the production department is stored.
- the data stored in the input transaction 21 is generated based on the data input operation by the payment department in the payment subsystem 2.
- data stored in the input transaction 21, that is, data generated based on a data input operation by the paying department may be referred to as an input transaction.
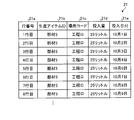
- the data structure of the input transaction 21 will be described with reference to FIG.
- FIG. 3 is a diagram illustrating an example of the data structure of the input transaction. As shown in FIG. 3, the input transaction 21 stores a production item ID (Identifier) 21b, a place code 21c, an input amount 21d, and an input date 21e in association with the line number 21a.
- the production item ID 21b indicates an ID that uniquely identifies a member, part, or product to be input for production.
- the location code 21c indicates a code that identifies the inventory location as coincident. Examples of stock locations include parts warehouses, production lines, and product warehouses.
- the input amount 21d indicates the quantity to be input from the paying / receiving department to the production department.
- the input date 21e indicates the date of input. The insertion date 21e may be shown up to the date and time.
- the line number 21a is “first line”
- the production item ID 21b is “member 5”
- the place code 21c is “process b”
- the input amount 21d is “25 liters”
- the input date 21e is “October” "One day”.
- the part configuration table 31 defines the configuration of products and parts.
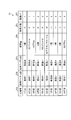
- FIG. 4 is a diagram illustrating an example of the data structure of the component configuration table.
- the parts configuration table 31 is generated in the design subsystem 3 based on data input operations by the design department and the production engineering department.
- a used item ID 31b, a production item ID 31c, a used amount 31d, a used process 31e, and a manufacturing LT 31f are stored in association with the row number 31a.
- Use item ID31b is item ID which shows the member used when producing the item which production item ID31c mentioned later shows among item ID, and a semi-finished product.
- the production item ID 31c indicates an item ID indicating a product to be produced and a semi-finished product among the item IDs.
- the usage amount 31d is the usage amount (usage standard value) of the item indicated by the usage item ID 31b necessary for producing the unit quantity of the item indicated by the production item ID 31c.
- a value estimated by the design department is set in the usage amount 31d.
- the use process 31e indicates a process of producing the item indicated by the production item ID 31c among the process codes.
- the manufacturing lead time (LT) 31f indicates the total of the time / work time required for manufacturing, the physical distribution time in the factory, and the in-process waiting time.
- FIG. 5 is a diagram illustrating an example of a product configuration image of the parts configuration table.
- “Product A” as the production item ID 31c uses “Part A” and “Part I” as the use item ID 31b from the “7th line” and “8th line” of the part configuration table 31.
- “Parts A” as the production item ID 31c are “Part 1”, “Part 2”, and “Part 3” as the used item IDs 31b from the “first row”, “second row”, and “third row” of the parts configuration table 31. use.
- “Member 1” uses “1” as the usage amount 31d in order to produce one “part A”.
- “Member 2” uses “3 ml” as a usage amount 31d in order to produce one “component”.
- “Member 3” uses “10 grams” as a usage amount 31d in order to produce one “part”.
- Part 4 as the production item ID 31c is “member 4”, “member 5”, and “member 6” as the used item ID 31b from the “4th row”, “5th row”, and “6th row” of the part configuration table 31. use. “Member 4” uses “10” as the usage amount 31d in order to produce one “component”. “Member 5” uses “10 milliliters” as a usage amount 31d in order to produce one “component”. “Member 6” uses “50 square centimeters” as a usage amount 31d to produce one “component”.
- “Product B” as the production item ID 31c uses “parts” and “member 7” as the use item IDs 31b from the “9th line” and “10th line” of the parts configuration table 31.
- “Part 4” as the production item ID 31c uses “Member 4”, “Member 5”, and “Member 6” as the use item IDs 31b from “Line 4”, “Line 5”, and “Line 6” of the parts configuration table 31.
- “Member 4” uses “10” as the usage amount 31d in order to produce one “component”.
- “Member 5” uses “10 milliliters” as a usage amount 31d in order to produce one “component”.
- “Member 6” uses “50 square centimeters” as a usage amount 31d to produce one “component”.
- “Member 7” as the production item ID 31c is not set in the parts configuration table 31 as a member necessary for producing the product A.
- “Member 7” uses “50 grams” as a usage amount 31d in order to produce one
- the parts configuration table 31 there are cases where there is no definition of a used member (use item ID 31b), or there is no definition as a member necessary for producing a product or a part even if there is a definition of the used member. Even in such a case, the member management status monitoring apparatus 1 determines that there is no member definition by the control unit 10 described later.
- the fact that there is no definition of the member used is referred to as “no component configuration registration”. If there is a definition of a member to be used but not a member required for production, it is referred to as “part configuration registration omission”.
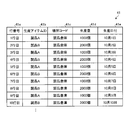
- FIG. 6 is a diagram illustrating an example of a data structure of a production performance transaction.
- the production result transaction 41 is generated in the production subsystem 4 based on a data input operation by the production department.
- the production result transaction 41 stores the production item ID 41b, the location code 41c, the production amount 41d, and the production date 41e in association with the row number 41a.
- the production item ID 41b indicates an ID that uniquely identifies a product and a part to be produced.
- the location code 41c indicates a code that identifies the inventory location as coincident. Examples of the stock location include a production line and a product warehouse.
- the production amount 41d indicates the quantity produced by the production department.
- the production date 41e indicates the date of production.
- the production date 41e may be shown up to the date and time.
- row number 41a is “first row”, “Product A” as the production item ID 41b, “Product warehouse” as the location code 41c, “1000” as the production amount 41d, “October as the production date 41e” "One day”.
- the threshold value table 51 stores threshold values used in determination processing described later. An example of the data structure of the threshold table 51 will be described later.
- the control unit 10 has an internal memory for storing programs and control data that define various processing procedures, and executes various processes using these. And the control part 10 respond
- the estimated cumulative increase tendency calculation unit 12 calculates the estimated usage amount of the member obtained by multiplying the usage amount of the member necessary to produce one unit of the product using the member by the production amount of the product.
- the product includes parts to be produced.
- the estimated cumulative increase tendency calculation unit 12 acquires a product to be produced using a member from the part configuration table 31.
- the estimated cumulative increase tendency calculation unit 12 calculates the usage amount of members necessary for producing the acquired product per unit using the component configuration table 31.
- the estimated cumulative increase tendency calculation unit 12 uses the production performance transaction 41 to acquire the production amount 41d for each product for each production date 41e for each product. Products are differentiated by location even if they are the same product.
- the estimated cumulative increase tendency calculation unit 12 multiplies the calculated usage amount of the member by the production amount 41d for each production date 41e to calculate the estimated usage amount of the member for each production date 41e.
- a least square method can be cited, but the method is not limited to the least square method.
- the estimated accumulated amount of usage may be abbreviated as estimated accumulation.
- the index output unit 13 calculates the ratio between the degree of change of the cumulative value according to the time of the amount of input of the member and the degree of change of the cumulative value according to the time of the estimated usage of the member.
- the index output unit 13 outputs the calculated ratio as an index that quantitatively indicates the discrepancy between the input amount of the member and the estimated usage amount. For example, the index output unit 13 determines the slope value (R) calculated by the input cumulative increase tendency calculation unit 11 and the slope value (C) calculated by the estimated cumulative increase tendency calculation unit 12 for the member for each place. )) As an index.
- the corrective action presentation unit 14 presents the corrective action according to the index of the member.
- the slope value when linearly approximating the cumulative value according to the input amount time is represented as R, and the slope value when linearly approximating the cumulative value according to the estimated usage amount time is described as C.
- R the slope value when linearly approximating the cumulative value according to the input amount time
- C the slope value when linearly approximating the cumulative value according to the estimated usage amount time.
- the corrective action presentation unit 14 determines that “the input result is not input” in which the input amount of the member is not recorded at all.
- the corrective action presentation part 14 determines with the responsibility of the payment / department department which takes charge work.
- the corrective action presentation unit 14 determines that the definition of the member to be used is not registered in the parts configuration table 31 and “parts configuration table is not registered”. Then, the corrective action presentation unit 14 determines that it is the responsibility of the design department responsible for the definition of the parts configuration table 31.
- the corrective action presentation unit 14 determines that the component configuration table 31 indicates “part configuration registration missing” in the used member. Whether or not the difference is large may be determined by a threshold value v, and the threshold value v is 0.4 as an example. Then, the corrective action presentation unit 14 determines the responsibility of the design department responsible for the definition in the parts configuration table 31. When the inclination R is larger than the inclination C and the difference is small but cannot be ignored, the corrective action presentation unit 14 determines that the usage amount in the used member defined in the parts configuration table 31 is too small. That is, it is determined that there is an estimation error in the usage amount in the used member defined in the part configuration table 31. Whether or not the difference is small but cannot be ignored may be determined by a threshold u, and the threshold u is 0.1 as an example. Then, the corrective action presentation unit 14 determines the responsibility of the design department responsible for the definition in the parts configuration table 31.
- the corrective action presentation unit 14 When the inclination C is larger than the inclination R and the difference is large, the corrective action presentation unit 14 is insufficient in the actual input of the amount of the member input, that is, the input of the fact that the member is input is leaked or input too little It is determined that Whether or not the difference is large may be determined by a threshold value v ′, and the threshold value v ′ is 0.6 as an example. And the corrective action presentation part 14 determines with the responsibility of the payment / department department which takes charge work. When the inclination C is larger than the inclination R and the difference is small but cannot be ignored, the corrective action presentation unit 14 determines that the usage amount in the used member defined in the part configuration table 31 is excessive.
- the corrective action presentation unit 14 determines the responsibility of the design department responsible for the definition in the parts configuration table 31.
- the corrective action presentation unit 14 determines that there is no mismatch when the slope R matches the slope C or is sufficiently small even if there is a difference.
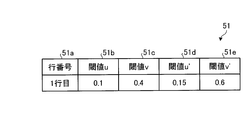
- FIG. 7 is a diagram illustrating an example of a data structure of the threshold value table.
- the threshold value table 51 stores the threshold value u51b, the threshold value v51c, the threshold value u′51d, and the threshold value v′51e in association with the row number 51a.
- the threshold u51b is a lower limit threshold when the slope R is larger than the slope C. That is, the range of 0 or more and less than the threshold value u51b is an allowable range of estimation error when the gradient R is larger than the gradient C.
- the threshold value v51c is an upper limit threshold value when the slope R is larger than the slope C.
- the threshold value u′51d is a lower limit threshold value when the slope C is larger than the slope R. That is, the range of 0 or more and less than the threshold value u′51b is an allowable range of estimation error when the gradient C is larger than the gradient R.
- the threshold value v′51e is an upper limit threshold value when the slope C is larger than the slope R.
- Each threshold value may be specified so that the difference between the results of operation for one year is within + -5%.
- Each threshold value is examined in advance by experiments or the like and stored in the threshold value table 51. Each threshold value can be changed.
- the adjustment amount presenting unit 15 accumulates the estimation error of the usage amount in the member by the slope value when linearly approximating the cumulative value according to the input amount time and the estimated usage amount according to the time. It is calculated using the value of the slope when the value is linearly approximated.
- the adjustment amount presentation unit 15 presents an estimation error of the usage amount in the member and a recommended amount obtained from the estimation error. For example, the adjustment amount presentation unit 15 calculates an estimation error as shown in Expression (1).
- R is a value of a slope when linearly approximating a cumulative value corresponding to the time of input amount in a member.
- C is a value of an inclination when a cumulative value corresponding to the estimated usage amount in the member is linearly approximated.
- the usage amount is assumed to be the value of the usage amount 31d in the member (use item ID 31b) defined in the parts configuration table 31.
- Estimation error (1 ⁇ R / C) ⁇ usage amount ... Equation (1)
- Equation (1) The derivation process of Equation (1) is as follows.
- the product configuration is one product and one member.
- the production amount per unit time of the product is constant, and the amount of one-time charging of members and the charging interval are constant.
- the accurate usage amount is K
- the usage amount 31d defined in the parts configuration table 31 is k
- the usage amount estimation error is ⁇ k.
- the production amount of products produced per unit date and time is S
- the input amount of members introduced per unit date and time is B.
- Equations (2) and (3) yield Equation (4).
- the slope C obtained by linearly approximating the accumulation of the estimated usage amount of the member may be expressed by the following formula (7) because the production amount per unit time of the product is constant.
- a member of interest is used in a plurality of products, but all the used amounts are approximated by considering them as errors at the same ratio.
- the production amount per unit time of the product is constant, and the amount of one-time charging of members and the charging interval are constant.
- the exact usage K i of the product i of interest member, BOM 31 defined usage 31d is k i of the product i of interest member, estimation error of usage .DELTA.k i, estimated usage Assume that the error ratio is ⁇ .
- the production amount of the product i produced per unit date and time is S i
- the input amount of the target member introduced per unit date and time is B.
- the slope C obtained by linearly approximating the accumulation of the estimated usage amount of the member may be expressed by the following formula (13) because the production amount per unit time of the product is constant.
- the member of interest is used in two products for the product configuration, but there are data for two periods in which the ratio of the number of productions of the two products is different.
- the production amount per unit time of each product is constant, and the amount of one-time input and the input interval of the members are constant within two periods in which the ratios of the numbers of two products are different.
- the exact amount of product i of interest member K i, usage 31d is k i defined in BOM 31 in Product i of interest member, estimation error of usage is assumed to be .DELTA.k i.
- Expression (17) is established by Expression (15) and Expression (16).
- the slope R j (the input amount converted per unit date and time) of the j-th period when the cumulative amount of the input amount of the member input from the paying / receiving department to the production department is linearly approximated is the input amount of the member once. Further, since the insertion interval is constant, it may be regarded as the same as the input amount B j of the member input per unit date and time. That is, Expression (18) is established. B j ⁇ R j (18)
- the estimation error of the two products can be calculated by a simultaneous equation of two variables.
- the number of products of 3 or more if it is possible to set the number of product composition ratio sections, a simultaneous equation for obtaining a solution can be established.
- the estimation error is constant as in the second case. It is necessary to perform an approximation based on a hypothesis.
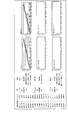
- FIGS. 8A to 8F are diagrams for explaining the necessity of calculating the cumulative increase tendency in the input and estimation.
- the product configuration is one product and one member. It is assumed that the production amount per unit time of the product is constant, and the amount of one-time charging of members and the charging interval are constant.
- a graph is shown that represents the accumulation of the input amount of the member when the input interval of the member is constant.
- the x-axis is the date and time
- the y-axis is the number of members input.
- the slope value R is calculated by the input cumulative increase tendency calculation unit 11.
- a graph is shown that represents the accumulation of estimated usage of members calculated from the production performance of the product.
- the x-axis is the date and time
- the y-axis is the quantity of members.
- the inclination value C is calculated by the estimated cumulative increase tendency calculation unit 12.
- the slope C is expressed by k ⁇ S as shown in the equation (7) because the production amount per unit time of the product is constant.
- k is the usage-amount of the member defined in the parts structure table 31, and S is the production amount per unit time of a product.
- FIG. 8C shows a graph representing the cumulative amount of input of the member shown in FIG. 8A and a graph representing the cumulative amount of estimated usage of the member calculated from the production performance of the product shown in FIG. 8B.
- the x-axis is the date and time
- the y-axis is the quantity of members.
- a certain time is required until a product is produced after a member necessary for production of the product is input from the paying / receiving department to the production department. This fixed time is called production lead time. Therefore, since there is a production lead time, the accumulation of the amount of material input and the accumulation of the estimated usage amount of the member do not coincide with each other at the date and time when the material is loaded.
- spare parts may be put into the production department before production.
- the graph representing the accumulated amount of material input is shifted in the positive direction of the y-axis by a reserve amount for preventing shortage.
- the production department when the product is produced, the parts that were actually in the production department are used. As shown in FIG. 8E, when there is a member in the production department, the accumulated amount of the input member does not coincide with the estimated usage amount of the member at the date when the member is inserted.
- the estimation of the member calculated from the slope R obtained by linearly approximating the accumulation of the input amount in the member and the production results of the product is performed.
- a slope C obtained by linearly approximating the accumulated amount of use is used. That is, by determining whether the inclination R and the inclination C are equal, it is determined whether or not the usage amount k of the member is appropriate. That is, it is determined whether or not the usage amount k of the member is appropriate by determining whether or not the overall increasing trend of the accumulated amount of input in the member is equal to the overall increasing trend of the estimated usage amount in the member. to decide. Such a determination is made by the corrective action presentation unit 14.
- 9A to 9C are diagrams for explaining calculation of the slope R and the slope C when there are two periods in which the ratio of the number of two products produced is different.
- the product 1 and the product 2 are using members of interest.
- a graph representing the accumulation of the production amounts of product 1 and product 2 is shown.
- the x-axis is the date and time, and the y-axis is the actual production quantity.
- S 1 1 is the production amount of the product 1 produced per unit date and time in the period 1.
- S 1 2 is the production of products 1 produced per unit time in the period 2.
- the accumulated production amount of the product 1 is represented.
- S 2 1 is the production amount of the product 2 produced per unit date and time in the period 1.
- S 2 2 is the production of products 2 produced per unit time in the period 2.
- the graph shows the cumulative production of product 2.
- a graph is shown that represents the accumulation of the input amount of the member when the input interval of the member is constant.
- the x-axis is the date and time
- the y-axis is the number of members input.
- the tendency of the cumulative value of the input amount 21d to increase for the member is different between the period 1 and the period 2. That is, the slope value in the period 1 is R 1. Slope value in the period 2 is R 2.
- the slope R 1 when the input amount accumulation in the member is linearly approximated is calculated, and the estimated usage amount in the member calculated from the production results of the product is linearly approximated. It calculates an inclination C 1 when.
- the slope R 1 and the slope C 1 may be used.
- a slope R 2 is calculated when the input amount accumulation in the member is linearly approximated
- a slope C 2 is calculated when the estimated usage amount in the member calculated from the production performance of the product is linearly approximated.
- the slope R 2 and the slope C 2 may be used.
- FIG. 10 is a diagram for explaining the calculation of the slope R and the slope C when there is a holiday period. As shown in the upper diagram of FIG. 10, when there is a holiday period, the member is not inserted and the product using the member is not produced. In such a case, the slope R when the input amount accumulation in the member is linearly approximated, and the slope C when the estimated usage amount accumulation in the member calculated from the production results of the product is linearly approximated are not accurately calculated.
- a slope R obtained by linearly approximating the cumulative amount of material input for business days excluding holidays is calculated.
- a slope C obtained by linearly approximating the accumulation of the estimated usage of the member for business days excluding the holiday period may be calculated. In order to determine whether or not the usage amount of the member is appropriate, the slope R and the slope C may be used.
- FIG. 11 is a diagram illustrating an example of a flowchart of the member management status monitoring process according to the embodiment.
- the input cumulative increase tendency calculation unit 11 calculates a slope R as a result of linear approximation of the accumulated time change of the input amount of the member (step S ⁇ b> 11).
- the input cumulative increase calculation unit 11 uses the input transaction 21 to acquire the input amount 21d for each input date 21e for each place code 21c and each production item ID 21b.
- the production item ID 21b here corresponds to a member.
- the input cumulative increase calculation unit 11 uses the input amount 21d of each input date 21e for one place code 21c and one production item ID 21b to calculate the slope R when the accumulated value corresponding to the input amount time is linearly approximated. Calculate the value.
- the process with respect to the use member of this place code 21c and production item ID21b is demonstrated.
- the estimated cumulative increase tendency calculation unit 12 calculates the estimated usage amount of the used member for each production date based on the production result transaction 41 and the part configuration table 31 (step S12). For example, the estimated cumulative increase tendency calculation unit 12 acquires a product (production item ID 31 c) using the used member (used item ID 31 b) from the component configuration table 31. The estimated cumulative increase tendency calculation unit 12 calculates a usage amount 31d of a used member necessary for producing the acquired product per unit from the parts configuration table 31. The estimated cumulative increase tendency calculation unit 12 uses the production result transaction 41 to acquire the production amount 41d for each product date 41e for each product (production item ID 31c). For each production date 41e, the estimated cumulative increase tendency calculation unit 12 multiplies the calculated usage amount 31d of the used member by the production amount 41d to calculate the estimated usage amount of the used member for each production date 41e.
- the estimated cumulative increase tendency calculation unit 12 calculates the gradient C as a result of linear approximation of the accumulated temporal change of the estimated usage of the used member (step S13). For example, the estimated cumulative increase tendency calculation unit 12 uses the estimated usage amount for each production date 41e to calculate the value of the slope C when the cumulative value corresponding to the estimated usage amount time is linearly approximated.
- the corrective action presentation unit 14 determines whether or not the slope R is 0 (step S14). When it is determined that the slope R is 0 (step S14; Yes), the corrective action presentation unit 14 classifies the determination as determination 1. That is, the corrective action presentation unit 14 determines that the input amount of the member to be used is not recorded at all, and determines that there is “no input result input” and is the responsibility of the paying department responsible for the input operation (step S15). Then, the corrective action presentation unit 14 presents “no input result input” to the paying department. Then, the corrective action presentation unit 14 ends the member management status monitoring process.
- the corrective action presentation unit 14 determines whether the slope C is 0 (step S16). When it is determined that the slope C is 0 (step S16; Yes), the corrective action presentation unit 14 classifies the determination as determination 2. That is, the corrective action presentation unit 14 determines that the definition of the member to be used is not registered in the part configuration table 31 and determines that the design department responsible for the definition “parts configuration table not registered” and the definition in the part configuration table 31 is determined. (Step S17). As an example, in FIG. 5, the definition of the member 8 is not registered in the parts configuration table 31. Then, the corrective action presentation unit 14 presents “no part configuration table registration” to the design department. Then, the corrective action presentation unit 14 ends the member management status monitoring process.
- step S18 determines whether the slope R is greater than the slope C.
- step S18 determines whether (inclination R ⁇ inclination C) / inclination R is greater than the threshold value v (step S18). S19). That is, the corrective action presentation unit 14 determines whether or not the difference between the slope R and the slope C is large.
- the corrective action presentation unit 14 classifies the determination as determination 3. That is, the corrective action presentation unit 14 determines that the registration of the member to be used is missing in the parts configuration table 31, and determines that it is the responsibility of the design department responsible for “parts configuration table registration missing” and the definition in the parts configuration table 31. (Step S20). As an example, in FIG. 5, the member 7 is not registered in the parts configuration table 31, and there is a product A in which the member 7 is forgotten to be defined in the parts configuration table 31. Then, the corrective action presentation unit 14 presents “part configuration table registration omission” to the design department. Then, the corrective action presentation unit 14 ends the member management status monitoring process.
- step S19 When it is determined that (inclination R ⁇ inclination C) / inclination R is equal to or less than the threshold v (step S19; No), the corrective action presentation unit 14 determines that (inclination R ⁇ inclination C) / inclination R is equal to or greater than the threshold u. It is determined whether or not (step S21). That is, the corrective action presentation unit 14 determines whether the difference between the slope R and the slope C is small but not so large that it cannot be ignored.
- the corrective action presentation unit 14 classifies the determination as determination 5. In other words, the corrective action presentation unit 14 determines that the usage amount of the used member defined in the part configuration table 31 is excessive, and the design department responsible for the definition of the “component usage amount under-setting” and the component configuration table 31 The responsibility is determined (step S22). Then, the corrective action presentation unit 14 presents “member usage amount under-setting” to the design department. Then, the corrective action presentation unit 14 ends the member management status monitoring process.
- step S21 When it is determined that (inclination R ⁇ inclination C) / inclination R is not equal to or greater than the threshold u (step S21; No), the corrective action presentation unit 14 proceeds to step S27.
- step S18 determines whether (slope C ⁇ slope R) / slope C is greater than the threshold value v ′. Is determined (step S23). That is, the corrective action presentation unit 14 determines whether or not the difference between the inclination C and the inclination R is large.
- the corrective action presentation unit 14 classifies the determination as determination 4. That is, the corrective action presentation unit 14 determines that the input amount of the used member is insufficiently input, and determines that “the input result input is insufficient” and the responsibility of the paying department responsible for the input operation (step S24). Then, the corrective action presentation unit 14 presents “input record input shortage” to the paying department. Then, the corrective action presentation unit 14 ends the member management status monitoring process.
- the corrective action presentation unit 14 determines that (Slope C ⁇ Slope R) / Slope C is the threshold u. It is determined whether or not it is greater than or equal to '(step S25). That is, the corrective action presentation unit 14 determines whether or not the difference between the inclination C and the inclination R is small enough to be ignored.
- the corrective action presentation unit 14 classifies the determination as determination 6. That is, the corrective action presentation unit 14 determines that the usage amount of the used member defined in the part configuration table 31 is excessive, and the “department usage amount excessive setting” and the design department responsible for the definition in the component configuration table 31 The responsibility is determined (step S26). Then, the corrective action presentation unit 14 presents “part material usage excessive setting” to the design department. Then, the corrective action presentation unit 14 ends the member management status monitoring process.
- step S25 When it is determined that (inclination C ⁇ inclination R) / inclination C is not equal to or greater than the threshold u ′ (step S25; No), the corrective action presentation unit 14 proceeds to step S27.
- step S 27 the corrective action presentation unit 14 classifies the determination 7. That is, the corrective action presentation unit 14 determines that there is no difference between the inclination C and the inclination R, or that the difference is small enough to be ignored even if there is a difference, and determines “no mismatch” (step S27). Then, the corrective action presentation unit 14 ends the member management status monitoring process.
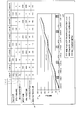
- FIG. 12 is a diagram illustrating a specific example of processing by the input cumulative increase tendency calculation unit.
- FIG. 12 a case where the input transaction 21 in FIG. 3 is referred to will be described.
- the input cumulative increase calculation unit 11 uses the input transaction 21 to acquire the input amount 21d for each input date 21e for each place code 21c and each production item ID 21b.
- “process b” is set as the place code 21c.
- “Member 5” is set as the production item ID 21b. Therefore, the input cumulative increase calculation unit 11 acquires, from the input transaction 21, the input amount 21d that is “member 5” as the production item ID 21b and “process b” as the place code 21c for each input date 21e.
- the amount r1 of the member 5 is shown for each insertion date.
- the input cumulative increase calculation unit 11 calculates the value of the slope R when the input amount accumulation is linearly approximated using the input amount 21d for each input date 21e.
- the reference numeral r2 in FIG. 12 indicates a cumulative value corresponding to the amount of time for which the member 5 is charged.
- the input cumulative increase calculation unit 11 calculates the value of the slope R when linear approximation is performed using the cumulative value corresponding to the time of the input amount of the member 5.
- the graph g1 is a graph that visually represents the accumulation of the input amount of the member 5.
- the x-axis is the date and time, and the y-axis is the number of members input.
- the input cumulative increase calculation unit 11 calculates the value of the slope R
- the value of the slope R may be calculated using the input cumulative without generating the graph g1.
- FIG. 13 is a diagram illustrating a specific example of processing by the estimated cumulative increase tendency calculation unit.
- FIG. 13 demonstrates the case where the parts structure table 31 of FIG. 4 and the production performance transaction 41 of FIG. 6 are referred.
- the estimated cumulative increase tendency calculation unit 12 acquires a product using the member 5 from the part configuration table 31.
- the estimated cumulative increase tendency calculation unit 12 calculates the usage amount of members necessary for producing the acquired product per unit using the component configuration table 31.
- “component” is generated using the member 5 from the fifth row as the row number 31 a of the component configuration table 31 in FIG. 4.
- the amount of use 31d of the member 5 necessary to produce “parts” per unit is “10 milliliters”.
- “Product A” is generated from the 8th row as the row number 31 a of the component configuration table 31 using “component”.
- the amount of “parts” used to generate “product A” per unit is “1”.
- Part B” is generated from the ninth line as the line number 31 a of the part configuration table 31 using “parts”.
- the amount of “parts” used to generate “product B” per unit is “two”.
- the estimated cumulative increase tendency calculation unit 12 uses the production result transaction 41 to calculate the estimated usage amount of the member 5 for each product “date A” for each product “product A” “product B”. Then, the estimated cumulative increase tendency calculating unit 12 adds the estimated usage amount for each production date 41e for each product to calculate the estimated usage amount of the member 5 for each production date 41e.
- the estimated cumulative increase tendency calculation unit 12 uses the production result transaction 41 to acquire the production amount of “October 1st” of the product A as “1000 pieces” from the first row as the row number 41a.
- the production amount of product A on October 1 is indicated by reference numeral r3 in FIG. Then, the estimated cumulative increase tendency calculation unit 12 uses “one” as the amount of “parts” necessary to generate “product A” per unit.
- the estimated cumulative increase tendency calculation unit 12 determines that the usage amount 31d of the member 5 necessary to produce “parts” per unit is “10 milliliters”, so that the estimated usage amount of the member 5 is “10000 milliliters”. (10 liters) ".
- An estimated usage amount of the member 5 is indicated by a symbol r5 in FIG.
- the estimated cumulative increase tendency calculation unit 12 calculates the estimated usage amount of the member 5 from October 2 to October 10 of the product A.
- the estimated cumulative increase tendency calculation unit 12 calculates the estimated usage amount of the member 5 from October 1 to October 10 of the product B.
- the estimated cumulative increase tendency calculation unit 12 adds the estimated usage amount of each member 5 from October 1 to October 10 of the product A and the product B, and then accumulates the estimated usage amount of the member 5. Is calculated.
- reference numeral r ⁇ b> 6 indicates the accumulated estimated usage of the member 5 for each production date.
- the estimated cumulative increase tendency calculation unit 12 calculates the value of the slope C when the estimated usage amount is linearly approximated using the estimated usage amount for each production date 41e.
- the estimated cumulative increase tendency calculation unit 12 calculates the value of the slope C when a linear approximation is performed using the accumulation of the estimated usage of the member 5 indicated by the symbol r6.
- the graph g2 is a graph that visually represents the accumulation of the estimated usage of the member 5.
- the x-axis is the date and time, and the y-axis is the member quantity.
- FIG. 14 is a diagram illustrating a specific example of presentation.
- the determination, the target department, and the contents are presented for each item name.
- the item name corresponds to the member.
- the determination corresponds to the determination number determined by the corrective action presentation unit 14.
- the target department corresponds to the department that is the responsibility of the determination determined by the corrective action presentation unit 14.
- the content corresponds to the content of the determination result determined by the corrective action presentation unit 14, the estimation error calculated by the adjustment amount presentation unit 15, and the recommended value of the usage amount 31d obtained from the estimation error.
- the corrective action presentation unit 14 and the adjustment amount presentation unit 15 indicate that there is a cause in the setting value of the usage amount 31d on the part configuration table 31 of “parts”, that the responsible department is the design department, It can be shown that the usage amount of “I” is “2” more and the recommended setting value is “8”.
- the corrective action presentation unit 14 presents, for each item name, an input graph generated from the accumulation of the input amount of the member and an estimation graph generated from the accumulation of the estimated use amount of the member. Thereby, the corrective action presentation unit 14 can visually present whether there is any point to be corrected from the input results and estimated results in the member.
- the member management status monitoring apparatus 1 calculates the first degree of change in the cumulative value of a certain member according to the time of the input amount of the member input for production. To do.
- the member management status monitoring apparatus 1 acquires a product to be produced using a certain member, multiplies the usage amount of a certain member necessary for producing the obtained product in a unit quantity by the production amount, and estimates an estimated usage amount of the certain member. Is calculated.
- the member management status monitoring apparatus 1 calculates a second degree of change in the cumulative value according to the calculated estimated usage amount of a certain member. And the member management condition monitoring apparatus 1 outputs the ratio of the first degree and the second degree.
- the member management status monitoring apparatus 1 can support an operation of accurately estimating the amount of the member used to produce a unit quantity of the product. Further, the member management status monitoring device 1 identifies a department that needs improvement according to the balance between the input amount and the estimated usage amount during the period of production conditions that can be regarded as the same, and corrective measures for the department, that is, An input work instruction with an accurate input amount can be output.
- the member management status monitoring apparatus 1 notifies different determination results for information regarding members based on the output ratio. According to such a configuration, the member management status monitoring apparatus 1 can cause the notification destination to grasp the problem of information about the member based on different determination results.
- the member management status monitoring apparatus 1 notifies the recommended amount of the member usage based on the output ratio. According to such a configuration, the member management status monitoring apparatus 1 can cause the notification destination to know the recommended amount of the member usage, and can support the estimation operation of the member usage.
- the member management condition monitoring apparatus 1 performed the member management condition monitoring process.
- the present invention is not limited to this, and a system corresponding to the member management status monitoring apparatus 1 may execute the member management status monitoring process. That is, a device corresponding to the input cumulative increase tendency calculation unit 11, a device corresponding to the estimated cumulative increase tendency calculation unit 12, a device corresponding to the index output unit 13, the corrective action presentation unit 14 and the adjustment amount presentation unit 15. Corresponding apparatuses may cooperate to execute the management status monitoring process for members.
- the index output unit 13 calculates (slope R ⁇ gradient C) / slope R as a ratio, and the slope C is larger than the slope R. It has been described that (Slope C ⁇ Slope R) / Slope C is calculated as a ratio.
- the index output unit 13 is not limited to this, and as another example, as shown in the flowchart of FIG. 15, the ratio R / gradient C may be calculated as a ratio.
- each threshold value u, v, u ', and v' shown in FIG. 11 is used for each threshold value in FIG.
- the corrective action presentation unit 14 classifies the judgment as the determination 3 when the slope R / the slope C is larger than 1 / (1-v) (step S31; Yes). , It is determined that it is the responsibility of the design department responsible for the definition of “part configuration table registration missing” and the part configuration table 31.
- the corrective action presentation unit 14 classifies the determination 5 and determines that “the member usage amount is under-set” and the parts configuration table 31.
- the corrective action presentation unit 14 classifies the determination 7 and determines “no mismatch”.
- the corrective action presentation unit 14 classifies the determination as determination 6, and defines “part material usage excessive setting” and the definition in the component configuration table 31. Judging by the design department responsible for If none of the above determinations is found, the corrective action presentation unit 14 classifies the determination as determination 4, and determines that the input department is responsible for the input operation and that it is the responsibility of the paying department that is responsible for the input operation.
- each component of the illustrated apparatus does not necessarily need to be physically configured as illustrated.
- the specific mode of device distribution / integration is not limited to that shown in the figure, and all or part of the device is functionally or physically distributed / integrated in arbitrary units depending on various loads and usage conditions. Can be configured.
- the index output unit 13 and the corrective action presentation unit 14 may be integrated as one unit.
- the corrective action presentation unit 14 may be distributed to a determination unit that determines a corrective action and a presentation unit that presents the corrective action.
- the input transaction 21, the part configuration table 31, the production result transaction 41, and the threshold value table 51 in the production management system 2 may be connected as an external device of the member management status monitoring apparatus 1 via a network.
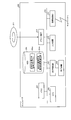
- FIG. 16 is a diagram illustrating an example of a computer that executes a member management status monitoring program.
- the computer 200 includes a CPU 203 that executes various arithmetic processes, an input device 215 that receives input of data from a user, and a display control unit 207 that controls the display device 209.
- the computer 200 also includes a drive device 213 that reads a program and the like from a storage medium, and a communication control unit 217 that exchanges data with other computers via a network.
- the computer 200 also includes a memory 201 that temporarily stores various types of information and an HDD 205.
- the memory 201, CPU 203, HDD 205, display control unit 207, drive device 213, input device 215, and communication control unit 217 are connected by a bus 219.
- the drive device 213 is a device for the removable disk 211, for example.
- the HDD 205 stores a member management status monitoring program 205a and a member management status monitoring processing related information 205b.
- the CPU 203 reads the member management status monitoring program 205a, expands it in the memory 201, and executes it as a process. Such a process corresponds to each functional unit of the member management status monitoring apparatus 1.
- the member management status monitoring processing related information 205 b corresponds to the input transaction 21, the part configuration table 31, the production performance transaction 41, and the threshold table 51.
- the removable disk 211 stores information such as a member management status monitoring program 205a.
- the member management status monitoring program 205a is not necessarily stored in the HDD 205 from the beginning.
- the program is stored in a “portable physical medium” such as a flexible disk (FD), a CD-ROM, a DVD disk, a magneto-optical disk, or an IC card inserted into the computer 200. Then, the computer 200 may read and execute the member management status monitoring program 205a from these.
- a “portable physical medium” such as a flexible disk (FD), a CD-ROM, a DVD disk, a magneto-optical disk, or an IC card inserted into the computer 200.
- the computer 200 may read and execute the member management status monitoring program 205a from these.
Landscapes
- Engineering & Computer Science (AREA)
- Manufacturing & Machinery (AREA)
- Business, Economics & Management (AREA)
- General Physics & Mathematics (AREA)
- Physics & Mathematics (AREA)
- Tourism & Hospitality (AREA)
- General Business, Economics & Management (AREA)
- Marketing (AREA)
- Primary Health Care (AREA)
- Strategic Management (AREA)
- General Health & Medical Sciences (AREA)
- Economics (AREA)
- Human Resources & Organizations (AREA)
- Health & Medical Sciences (AREA)
- Theoretical Computer Science (AREA)
- General Engineering & Computer Science (AREA)
- Quality & Reliability (AREA)
- Automation & Control Theory (AREA)
- Management, Administration, Business Operations System, And Electronic Commerce (AREA)
- General Factory Administration (AREA)
Abstract
部材の管理状況監視プログラムが、ある部材について、生産のために投入された該部材の投入量の時間に応じた累積値の変化の第1の度合いを算出し(S11)、前記部材を用いて生産する製品の情報を取得し、該取得した製品を単位量生産するのに必要な前記部材の量に生産量を乗算し、前記部材の推測量を算出し、該算出した前記部材の推測量の時間に応じた累積値の変化の第2の度合いを算出し(S12)、前記第1の度合いと前記第2の度合いの比を出力する(S18、S19、S21、S23、S25)こととしたので、部材の量を正確に見積もるために、製品に対する部品構成表を修正する作業を支援できる。
Description
本発明は、部材の管理状況監視プログラムなどに関する。
生産管理システムでは、製品および部品を単位数量生産するために必要な部材の使用量が、部品の構成を定義する部品構成表に設定される。生産管理システムでは、例えば、この部材の使用量を用いて、部材の在庫を推定する。したがって、部材の使用量が正確に見積もられることが必要である。
工程の部品の在庫数量を算出する技術が知られている(例えば、特許文献1など参照)。かかる技術では、生産指示コンピュータは、生産ライン21の完成品検査工程に設置されているバーコードリーダ22から製品を特定するバーコードを取得し、そのバーコードに基づいて部品とその部品の数量とを示す部品レベルの情報に展開する。生産指示コンピュータは、製品を特定する複数のバーコードとそれぞれの製品で使用される部品の構成を示すデータとを対応付けて記憶装置に記憶しており、取得したバーコードに対応する製品の部品構成を示すデータを記憶装置から読み出すことで部品レベルの情報に展開する。そして、生産指示コンピュータは、生産された台数分の製品の使用された各部品の使用数量を算出し、その部品の使用数量と、部品運搬車26が各工程に配送した部品の数量とから各工程の部品の在庫数量を算出する。
しかしながら、従来の生産管理システムでは、部材の使用量を正確に見積もることが困難であるという問題がある。
生産管理システムを用いる工場では、一例として、実績を管理する部門は生産部門であり、部品構成表上の部材の使用量に反映する部門が設計部門であるなど部門が異なることが多い。このため、部門間の連携が適切でないと、生産管理システムの導入の効果を十分に発揮できない。例えば、油などの液体の使用量は製造機械や製造手順により変化するため、製造機械や製造手順が変化した場合には変化したことを部門間で適切に伝えないと、設計部門では部材の使用量を正確に見積もることが困難となる。この結果、生産管理システムの導入の効果を十分に発揮できない。
また、製品の種類が1千以下の小規模の工場であっても、使用する部品は1万点を超えることも多く、部品構成表に定義する部材は数10万となる場合がある。したがって、数10万の部材の使用量を、設計部門が確認し、調整することは膨大な工数がかかり、全ての部材の使用量を正確に見積もることは困難である。
1つの側面では、製品や部品を単位数量生産するために必要な部材の使用量を正確に見積もる作業を支援することを目的とする。
1つの態様では、コンピュータに、ある部材について、生産のために投入された該部材の投入量の時間に応じた累積値の変化の第1の度合いを算出し、前記部材を用いて生産する製品の情報を取得し、該取得した製品を単位量生産するのに必要な前記部材の量に生産量を乗算し、前記部材の推測量を算出し、該算出した前記部材の推測量の時間に応じた累積値の変化の第2の度合いを算出し、前記第1の度合いと前記第2の度合いの比を出力する、処理を実行させる。
1つの態様によれば、製品や部品を単位数量生産するために必要な部材の使用量を正確に見積もる作業を支援することができる。
以下に、本願の開示する部材の管理状況監視プログラム、部材の管理状況監視方法および部材の管理状況監視装置の実施例を図面に基づいて詳細に説明する。なお、実施例によりこの発明が限定されるものではない。
[実施例に係る管理システムの構成]
図1は、実施例に係る管理システムの構成を示す機能ブロック図である。図1に示すように、管理システム100は、生産管理システム9および部材管理状況監視装置1を有する。生産管理システム9は、受払サブシステム2と、設計サブシステム3と、生産サブシステム4とを有する。生産管理システム9は、工場において、製品の受注から生産、納品に至るまでの流れを管理するシステムである。生産管理システム9は、製品の構成を定義する部品構成表31に従って、生産の着手や、生産活動を行う。部品構成表31は、製品を構成するために他の部品から組み立てられる部品の構成に関する情報を含む。
図1は、実施例に係る管理システムの構成を示す機能ブロック図である。図1に示すように、管理システム100は、生産管理システム9および部材管理状況監視装置1を有する。生産管理システム9は、受払サブシステム2と、設計サブシステム3と、生産サブシステム4とを有する。生産管理システム9は、工場において、製品の受注から生産、納品に至るまでの流れを管理するシステムである。生産管理システム9は、製品の構成を定義する部品構成表31に従って、生産の着手や、生産活動を行う。部品構成表31は、製品を構成するために他の部品から組み立てられる部品の構成に関する情報を含む。
生産管理システム9は、例えば、図2に示すような体制で運用される。図2は、生産管理システムを使う製造部門の組織図の一例を示す図である。図2に示すように、製造部門には、倉庫/受払部門と、設計部門と、生産技術部門と、生産部門とが含まれる。倉庫/受払部門は、部材を部材倉庫から生産部門に投入した量を受払サブシステム2に入力する。倉庫/受払部門は、受払サブシステム2を使用する。受払サブシステム2は、部材を投入した量が記載されるデータである投入トランザクション21を含む。設計部門は、製品を設計し、部品構成表31に部材名と使用量標準値(以降、「使用量」と同義)を設定する。生産技術部門は、生産設備(装置)や手順を具体的に決定し、部品構成表31に工程を設定する。設計部門および生産技術部門は、設計サブシステム3を使用する。設計サブシステム3は、部品構成表31を含む。生産部門は、生産設備(装置)を使って製品を生産し、生産実績を生産サブシステム4に入力する。生産サブシステム4は、生産実績トランザクション41を含む。
図1に戻って、部材管理状況監視装置1は、生産管理システム9によって記録される部材の管理状況を監視する。部材管理状況監視装置1は、部材の生産工程への投入と生産実績の情報を用いて、部品構成表31上の部材の設定漏れの有無や、部品構成表31上の部材の使用量の異常や、部材の投入量の異常を判定する。すなわち、部材管理状況監視装置1は、オペレータからの入力や登録操作に基づき受払サブシステム2により生成される投入トランザクション21や、オペレータからの入力や登録操作に基づき生産サブシステム4により生成される生産実績トランザクション41を用いて、オペレータからの入力や登録操作に基づき設計サブシステム3により生成される部品構成表31の構成の正しさや、登録されている使用量の精度や、部材の投入量が受払サブシステム2に確実に入力されているかどうかを自動判定する。
部材管理状況監視装置1は、制御部10と、記憶部20とを有する。記憶部20は、例えば、システム連携されている場合にはサービスバスなどとのデータ交換インタフェース、LAN接続されている場合にはファイル入出力インタフェース、外部記憶を介した連携の場合には外部記憶インタフェースなどを介してデータの入力および(または)出力が可能な、フラッシュメモリ(Flash Memory)やFRAM(登録商標)(Ferroelectric Random Access Memory)などの不揮発性の半導体メモリ素子などの記憶装置に対応する。記憶部20は、投入トランザクション21、部品構成表31、生産実績トランザクション41および閾値テーブル51を格納する。
投入トランザクション21は、受払部門から生産部門に投入される部材の投入量を示すデータが格納される記憶領域である。投入トランザクション21に格納されるデータは、受払サブシステム2内で受払部門によるデータ入力操作に基づき生成される。以下の説明において、投入トランザクション21に記憶されるデータ、すなわち、受払部門によるデータ入力操作に基づき生成されるデータを指して、投入トランザクションと記載する場合がある。投入トランザクション21のデータ構造を、図3を参照して説明する。図3は、投入トランザクションのデータ構造の一例を示す図である。図3に示すように、投入トランザクション21は、生産アイテムID(Identifier)21b、場所コード21c、投入量21dおよび投入日付21eを行番号21aに対応付けて記憶する。生産アイテムID21bは、生産にあたり投入する部材、部品、製品を一意に特定するIDを示す。場所コード21cは、在庫場所を一致に特定するコードを示す。在庫場所には、例えば、部品倉庫、製造ライン、製品倉庫が挙げられる。投入量21dは、受払部門から生産部門に投入する数量を示す。投入日付21eは、投入した日付を示す。投入日付21eは、日時まで示すようにしても良い。
一例として、行番号21aが「1行目」である場合、生産アイテムID21bとして「部材5」、場所コード21cとして「工程ロ」、投入量21dとして「25リットル」、投入日付21eとして「10月1日」と記憶している。
図1に戻って、部品構成表31は、製品および部品の構成を定義する。ここで、部品構成表31のデータ構造の一例を、図4を参照して説明する。図4は、部品構成表のデータ構造の一例を示す図である。部品構成表31は、設計サブシステム3内で設計部門および生産技術部門によるデータ入力操作に基づき生成される。図4に示すように、部品構成表31には、使用アイテムID31b、生産アイテムID31c、使用量31d、使用工程31eおよび製造LT31fを行番号31aに対応付けて記憶する。使用アイテムID31bは、アイテムIDのうち、後述する生産アイテムID31cが示すアイテムを生産する際に用いられる部材、半製品を示すアイテムIDである。生産アイテムID31cは、アイテムIDのうち、生産する製品、半製品を示すアイテムIDを示す。使用量31dは、生産アイテムID31cが示すアイテムを単位数量生産するために必要な使用アイテムID31bが示すアイテムの使用量(使用量標準値)である。使用量31dには、設計部門によって推定された値が設定される。使用工程31eは、工程コードのうち、生産アイテムID31cが示すアイテムを生産する工程を示す。製造リードタイム(LT:lead time)31fは、製造に必要な時間・作業時間と工場内物流時間と仕掛待ち時間の総計を示す。
一例として、行番号31aが「5行目」である場合、使用アイテムID31bとして「部材5」、生産アイテムID31cとして「部品い」、使用量31dとして「10ミリリットル」、使用工程31eとして「ロ」、製造LT31fとして「2」と記憶している。
図4で示した部品構成表31の製品構成イメージを、図5を参照して説明する。図5は、部品構成表の製品構成イメージの一例を示す図である。
生産アイテムID31cとしての「製品A」は、部品構成表31の「7行目」「8行目」から、使用アイテムID31bとして「部品あ」、「部品い」を使用する。生産アイテムID31cとしての「部品あ」は、部品構成表31の「1行目」「2行目」「3行目」から、使用アイテムID31bとして「部材1」「部材2」「部材3」を使用する。「部材1」は「部品あ」を1個生産するために使用量31dとして「1個」を使用する。「部材2」は「部品あ」を1個生産するために使用量31dとして「3ミリリットル」を使用する。「部材3」は「部品あ」を1個生産するために使用量31dとして「10グラム」を使用する。生産アイテムID31cとしての「部品い」は、部品構成表31の「4行目」「5行目」「6行目」から、使用アイテムID31bとして「部材4」「部材5」「部材6」を使用する。「部材4」は「部品い」を1個生産するために使用量31dとして「10個」を使用する。「部材5」は「部品い」を1個生産するために使用量31dとして「10ミリリットル」を使用する。「部材6」は「部品い」を1個生産するために使用量31dとして「50平方センチメートル」を使用する。
生産アイテムID31cとしての「製品B」は、部品構成表31の「9行目」「10行目」から、使用アイテムID31bとして「部品い」、「部材7」を使用する。生産アイテムID31cとしての「部品い」は、部品構成表31の「4行目」「5行目」「6行目」から使用アイテムID31bとして「部材4」「部材5」「部材6」を使用する。「部材4」は「部品い」を1個生産するために使用量31dとして「10個」を使用する。「部材5」は「部品い」を1個生産するために使用量31dとして「10ミリリットル」を使用する。「部材6」は「部品い」を1個生産するために使用量31dとして「50平方センチメートル」を使用する。生産アイテムID31cとしての「部材7」は、製品Aを生産するために必要な部材として部品構成表31に設定されていない。「部材7」は「製品B」を1個生産するために使用量31dとして「50グラム」を使用する。
なお、部品構成表31には、使用部材(使用アイテムID31b)の定義がない場合や、使用部材の定義があっても製品や部品を生産するために必要な部材として定義がない場合がある。このような場合であっても、部材管理状況監視装置1は、後述する制御部10によって部材の定義がないことを判定する。使用部材の定義がないことを「部品構成登録なし」というものとする。使用部材の定義があるが生産に必要な部材として定義がないことを「部品構成登録抜け」というものとする。
図1に戻って、生産実績トランザクション41は、製品の生産実績を記憶する。ここで、生産実績トランザクション41のデータ構造の一例を、図6を参照して説明する。図6は、生産実績トランザクションのデータ構造の一例を示す図である。生産実績トランザクション41は、生産サブシステム4内で生産部門によるデータ入力操作に基づき生成される。図6に示すように、生産実績トランザクション41は、生産アイテムID41b、場所コード41c、生産量41dおよび生産日付41eを行番号41aに対応付けて記憶する。生産アイテムID41bは、生産する製品、部品を一意に特定するIDを示す。場所コード41cは、在庫場所を一致に特定するコードを示す。在庫場所には、例えば、製造ライン、製品倉庫が挙げられる。生産量41dは、生産部門によって生産した数量を示す。生産日付41eは、生産した日付を示す。生産日付41eは、日時まで示すようにしても良い。
一例として、行番号41aが「1行目」である場合、生産アイテムID41bとして「製品A」、場所コード41cとして「製品倉庫」、生産量41dとして「1000個」、生産日付41eとして「10月1日」と記憶している。
図1に戻って、閾値テーブル51は、後述する判定処理で用いられる閾値を記憶する。なお、閾値テーブル51のデータ構造の一例は、後述する。
制御部10は、各種の処理手順を規定したプログラムや制御データを格納するための内部メモリを有し、これらによって種々の処理を実行する。そして、制御部10は、例えば、ASIC(Application Specific Integrated Circuit)やFPGA(Field Programmable Gate Array)などの集積回路の電子回路に対応する。または、制御部10は、CPU(Central Processing Unit)やMPU(Micro Processing Unit)などの電子回路に対応する。さらに、制御部10は、投入累積増加傾向算出部11、推定累積増加傾向算出部12、指標出力部13、是正措置提示部14および調整量提示部15を有する。
投入累積増加傾向算出部11は、部材について、生産のために投入された部材の投入量の時間に応じた累積値の変化の度合いを算出する。例えば、投入累積増加傾向算出部11は、投入トランザクション21を用いて、部材毎に、各部材に対する、投入日付21e毎の投入量21dを取得する。部材は、同じ部材であっても場所毎に区別される。投入累積増加傾向算出部11は、投入日付21e毎の投入量21dを用いて、投入量の時間に応じた累積値を線形近似したときの傾きの値を算出する。すなわち、投入累積増加傾向算出部11は、部材について、投入量21dの累積値が増える傾向をy=Rx+b1で近似し、傾きの値Rを算出する。線形近似の方法には、一例として、最小二乗法が挙げられるが、最小二乗法に限定されない。
推定累積増加傾向算出部12は、部材を用いる製品を1単位生産するのに必要な部材の使用量に、当該製品の生産量を乗じて得られた当該部材の推定使用量を算出する。製品には、生産する部品も含まれる。例えば、推定累積増加傾向算出部12は、部品構成表31から、部材を用いて生産する製品を取得する。推定累積増加傾向算出部12は、取得した製品を1単位当たり生産するために必要な部材の使用量を、部品構成表31を用いて算出する。推定累積増加傾向算出部12は、生産実績トランザクション41を用いて、製品毎に、各製品に対する、生産日付41e毎の生産量41dを取得する。製品は、同じ製品であっても場所毎に区別される。推定累積増加傾向算出部12は、生産日付41e毎に、算出した部材の使用量に生産量41dを乗算し、生産日付41e毎の部材の推定使用量を算出する。
また、推定累積増加傾向算出部12は、部材の推定使用量の時間に応じた累積値の変化の度合いを算出する。例えば、推定累積増加傾向算出部12は、生産日付41e毎の推定使用量を用いて、推定使用量の時間に応じた累積値を線形近似したときの傾きの値を算出する。すなわち、推定累積増加傾向算出部12は、部材について、推定使用量の累積値が増える傾向をy=Cx+b2で近似し、傾きの値Cを算出する。線形近似の方法には、一例として、最小二乗法が挙げられるが、最小二乗法に限定されない。なお、以下の説明において、該推定した使用量の累積値を、推定累積と略称する場合がある。
指標出力部13は、部材の投入量の時間に応じた累積値の変化の度合いと、部材の推定使用量の時間に応じた累積値の変化の度合いとの比を算出する。指標出力部13は、算出した比を、部材の投入量と推定使用量との不一致を定量的に示す指標として出力する。例えば、指標出力部13は、場所毎の部材に対して、投入累積増加傾向算出部11によって算出された傾きの値(R)と推定累積増加傾向算出部12によって算出された傾きの値(C)との比を指標として算出する。指標として算出される比の一例として、傾きRが傾きCより大きい場合には、(傾きR-傾きC)/傾きRを比として算出し、傾きCが傾きRより大きい場合には、(傾きC-傾きR)/傾きCを比として算出する。そして、指標出力部13は、算出した比を出力する。
是正措置提示部14は、部材における指標に応じて是正措置を提示する。例えば、部材について、投入量の時間に応じた累積値を線形近似したときの傾きの値をRとして、推定使用量の時間に応じた累積値を線形近似したときの傾きの値をCとして説明する。是正措置提示部14は、傾きRが0である場合には、部材の投入量が全く記録されていない「投入実績入力なし」と判定する。そして、是正措置提示部14は、投入業務を担う受払部門の責務と判定する。是正措置提示部14は、傾きCが0である場合には、部品構成表31に使用部材の定義が登録されていない「部品構成表登録なし」と判定する。そして、是正措置提示部14は、部品構成表31の定義を担う設計部門の責務と判定する。
是正措置提示部14は、傾きRが傾きCより大きく、差異が大きい場合には、部品構成表31に、使用部材における「部品構成登録抜け」であると判定する。差異が大きいか否かは、閾値vによって定めれば良く、閾値vは、一例として0.4である。そして、是正措置提示部14は、部品構成表31への定義を担う設計部門の責務と判定する。是正措置提示部14は、傾きRが傾きCより大きく、差異が小さいが無視できない場合には、部品構成表31に定義された使用部材における使用量が過少であると判定する。すなわち、部品構成表31に定義された使用部材における使用量に見積もり誤差があると判定される。差異が小さいが無視できないか否かは、閾値uによって定めれば良く、閾値uは、一例として0.1である。そして、是正措置提示部14は、部品構成表31への定義を担う設計部門の責務と判定する。
是正措置提示部14は、傾きCが傾きRより大さく、差異が大きい場合には、部材の投入量の実績入力不足、すなわち、部材が投入されている事実の入力が漏れているまたは過少入力されていると判定する。差異が大きいか否かは、閾値v´によって定めれば良く、閾値v´は、一例として0.6である。そして、是正措置提示部14は、投入業務を担う受払部門の責務と判定する。是正措置提示部14は、傾きCが傾きRより大きく、差異が小さいが無視できない場合には、部品構成表31に定義された使用部材における使用量が過大であると判定する。すなわち、部品構成表31に定義された使用部材における使用量に見積もり誤差があると判定される。差異が小さいが無視できないか否かは、閾値u´によって定めれば良く、閾値u´は、一例として0.15である。そして、是正措置提示部14は、部品構成表31への定義を担う設計部門の責務と判定する。
是正措置提示部14は、傾きRが傾きCと一致するか、差異があっても十分小さい場合には、不一致はないと判定する。
ここで、閾値テーブル51のデータ構造を、図7を参照して説明する。図7は、閾値テーブルのデータ構造の一例を示す図である。図7に示すように、閾値テーブル51には、閾値u51b、閾値v51c、閾値u´51dおよび閾値v´51eを行番号51aに対応付けて記憶する。閾値u51bは、傾きRが傾きCより大きい場合の下限の閾値である。すなわち、0以上閾値u51b未満は、傾きRが傾きCより大きい場合の見積もり誤差の許容範囲となる。閾値v51cは、傾きRが傾きCより大きい場合の上限の閾値である。閾値u´51dは、傾きCが傾きRより大きい場合の下限の閾値である。すなわち、0以上閾値u´51b未満は、傾きCが傾きRより大きい場合の見積もり誤差の許容範囲となる。閾値v´51eは、傾きCが傾きRより大きい場合の上限の閾値である。なお、各閾値は、1年間稼働した結果の差異が+-5%以内を許容範囲とするように規定されれば良い。各閾値は、あらかじめ実験などで調べられ、閾値テーブル51に記憶される。各閾値は、変更可能である。
図1に戻って、調整量提示部15は、部材における使用量の見積もり誤差を、投入量の時間に応じた累積値を線形近似したときの傾きの値および推定使用量の時間に応じた累積値を線形近似したときの傾きの値を用いて算出する。調整量提示部15は、部材における使用量の見積もり誤差および見積もり誤差から得られる推奨量を提示する。例えば、調整量提示部15は、見積もり誤差を、式(1)のように算出する。なお、Rは、部材における投入量の時間に応じた累積値を線形近似したときの傾きの値であるとする。Cは、部材における推定使用量の時間に応じた累積値を線形近似したときの傾きの値であるとする。使用量は、部品構成表31に定義された、部材(使用アイテムID31b)における使用量31dの値であるとする。
見積もり誤差=(1-R/C)×使用量・・・式(1)
見積もり誤差=(1-R/C)×使用量・・・式(1)
[式(1)の導出過程]
式(1)の導出過程は以下のとおりである。
式(1)の導出過程は以下のとおりである。
1つの例として、製品構成が、1製品、1部材である場合とする。ここでは、製品の単位時間当たりの生産量が一定であり、部材の1回の投入量および投入間隔が一定であるとする。部材について、正確な使用量がK、部品構成表31に定義された使用量31dがk、使用量の見積もり誤差がΔkであるとする。また、単位日時当たり生産された製品の生産量がS、単位日時当たり投入された部材の投入量がBであるとする。すると、以下のように、式(2)、式(3)が成り立つ。
k=K+Δk・・・式(2)
B=K×S ・・・式(3)
k=K+Δk・・・式(2)
B=K×S ・・・式(3)
式(2)(3)により、式(4)となる。
B=(k-Δk)×S=k×S×(1-Δk/k)・・・式(4)
B=(k-Δk)×S=k×S×(1-Δk/k)・・・式(4)
すると、以下のように、式(5)が成り立つ。
Δk/k=1-B/(k×S)・・・式(5)
Δk/k=1-B/(k×S)・・・式(5)
ここで、受払部門から生産部門に投入された部材の投入量の累積を直線近似したときの傾きR(単位日時当たり換算の投入量)は、部材の1回の投入量および投入間隔が一定であるため、単位日時当たり投入された部材の投入量Bと同じとみなして良い。すなわち、式(6)が成り立つ。
B≒R・・・式(6)
B≒R・・・式(6)
そして、部材の推定使用量の累積を直線近似したときの傾きCは、製品の単位時間当たりの生産量が一定であるため、以下の式(7)として良い。
C≒k×S・・・式(7)
C≒k×S・・・式(7)
そして、式(6)(7)を式(5)に代入すると、Δk≒(1-R/C)×kとなる。すなわち、式(1)が導出される。
別の例として、製品構成について、注目している部材が複数製品で使用されているが、全ての使用量が同一の比率で誤差とみなして近似する場合とする。ここでは、製品の単位時間当たりの生産量が一定であり、部材の1回の投入量および投入間隔が一定であるとする。注目部材の製品iでの正確な使用量がKi、注目部材の製品iでの部品構成表31に定義された使用量31dがki、使用量の見積もり誤差がΔki、使用量の見積もり誤差比率がΔであるとする。また、単位日時当たり生産された製品iの生産量がSi、単位日時当たり投入された注目部材の投入量がBであるとする。すると、以下のように、式(8)、式(9)、式(10)が成り立つ。
ki=Ki+Δki・・・式(8)
Δki=Δ×ki ・・・式(9)
B=Σi(Ki×Si)・・・式(10)
ki=Ki+Δki・・・式(8)
Δki=Δ×ki ・・・式(9)
B=Σi(Ki×Si)・・・式(10)
式(8)(9)を式(10)に代入すると、式(11)となる。
B=Σi{(ki-Δ×ki)×Si}=(1-Δ)×Σi(ki×Si)・・・式(11)
B=Σi{(ki-Δ×ki)×Si}=(1-Δ)×Σi(ki×Si)・・・式(11)
ここで、受払部門から生産部門に投入された部材の投入量の累積を直線近似したときの傾きR(単位日時当たり換算の投入量)は、部材の1回の投入量および投入間隔が一定であるため、単位日時当たり投入された部材の投入量Bと同じとみなして良い。すなわち、式(12)が成り立つ。
B≒R・・・式(12)
B≒R・・・式(12)
そして、部材の推定使用量の累積を直線近似したときの傾きCは、製品の単位時間当たりの生産量が一定であるため、以下の式(13)として良い。
C≒Σi(ki×Si)・・・式(13)
C≒Σi(ki×Si)・・・式(13)
そして、式(12)(13)を式(11)に代入すると、式(14)となる。
R≒(1-Δ)×C・・・式(14)
R≒(1-Δ)×C・・・式(14)
そして、式(14)を式(9)に代入すると、Δki≒(1-R/C)×kiとなる。すなわち、式(1)が導出される。
さらに、別の例として、製品構成について、注目している部材が2製品で使用されているが、2製品の生産数の比率が異なる2つの期間のデータが存在する場合とする。ここでは、2製品の生産数の比率が異なる2つの期間内では、それぞれの製品の単位時間当たりの生産量が一定であり、部材の1回の投入量および投入間隔が一定であるとする。注目部材の製品iでの正確な使用量がKi、注目部材の製品iでの部品構成表31に定義された使用量31dがki、使用量の見積もり誤差がΔkiであるとする。また、j番目の期間に単位日時当たり生産された製品iの生産量がSi
j、j番目の期間に単位日時当たり投入された注目部材の投入量がBjであるとする。すると、以下のように、式(15)、式(16)が成り立つ。


式(15)、式(16)により、式(17)が成り立つ。

ここで、受払部門から生産部門に投入された部材の投入量の累積を直線近似したときのj番目の期間の傾きRj(単位日時当たり換算の投入量)は、部材の1回の投入量および投入間隔が一定であるため、単位日時当たり投入された部材の投入量Bjと同じとみなして良い。すなわち、式(18)が成り立つ。
Bj≒Rj・・・式(18)
Bj≒Rj・・・式(18)
そして、部材の推定使用量の累積を直線近似したときの傾きCjは、製品の単位時間当たりの生産量が一定であるため、以下の式(19)として良い。
Cj≒Σi(ki×Si j)・・・式(19)
Cj≒Σi(ki×Si j)・・・式(19)
そして、式(18)(19)を式(17)に代入すると、式(20)となる。

そして、式(20)の連立方程式を解くと、注目部材の製品毎の使用量の見積もり誤差Δk1、Δk2を算出することができる。すなわち、式(1)が導出される。
なお、式(20)では、製品構成について、注目部材が2製品で使用されている場合であるため、2変数の連立方程式で2製品の見積もり誤差を算出できる。3以上の製品数の場合には、その数だけの製品の構成比の区間を設定することができれば、解が得られる連立方程式が立てられる。しかし、現実的には、千単位以上の製品の種類が存在するため、その数だけの製品の構成比の区間を設定不可能である。そこで、設定可能な区間の数に合わせて、見積もり発生誤差の発生率が近いと考えられる部材と製品の組合せのグループを作成し、そのグループ内では、2番目のケースのような見積もり誤差一定の仮説に基づく近似を行う必要がある。
[投入累積増加傾向算出、推定累積増加傾向算出の必要性の説明]
次に、投入累積増加傾向算出および推定累積増加傾向算出の必要性について、図8A~図8Fを参照して説明する。図8A~図8Fは、投入および推定における累積増加傾向の算出の必要性を説明する図である。なお、ここでは、製品構成が、1製品、1部材である場合とする。製品の単位時間当たりの生産量が一定であり、部材の1回の投入量および投入間隔が一定であるとする。
次に、投入累積増加傾向算出および推定累積増加傾向算出の必要性について、図8A~図8Fを参照して説明する。図8A~図8Fは、投入および推定における累積増加傾向の算出の必要性を説明する図である。なお、ここでは、製品構成が、1製品、1部材である場合とする。製品の単位時間当たりの生産量が一定であり、部材の1回の投入量および投入間隔が一定であるとする。
図8Aに示すように、部材の投入間隔が一定である場合の部材の投入量の累積を表すグラフが表わされている。x軸は日時、y軸は部材の投入数量である。ここでは、部材について、投入量21dの累積値が増える傾向は、y=Rx+b1(x:日時)で近似され、傾きの値Rが算出される。傾きの値Rは、投入累積増加傾向算出部11によって算出される。
図8Bに示すように、製品の生産実績から算出した部材の推定使用量の累積を表すグラフが表わされている。x軸は日時、y軸は部材の数量である。ここでは、部材について、推定使用量の累積値が増える傾向は、y=Cx+b2(x:日時)で近似され、傾きの値Cが算出される。傾きの値Cは、推定累積増加傾向算出部12によって算出される。この傾きCは、製品の単位時間当たりの生産量が一定であるため、式(7)で示したように、k×Sで表わされる。なお、kは、部品構成表31に定義された部材の使用量であり、Sは、製品の単位時間当たりの生産量である。
図8Cには、図8Aで示した部材の投入量の累積を表すグラフと、図8Bで示した製品の生産実績から算出した部材の推定使用量の累積を表すグラフが表わされている。x軸は日時、y軸は部材の数量である。図8Cに示すように、製品が生産されるまでには、製品の生産に必要な部材を受払部門から生産部門に投入してから一定時間が必要である。この一定時間のことを生産リードタイムという。したがって、生産リードタイムがあるため、部材を投入した日時において、部材の投入量の累積と部材の推定使用量の累積は、一致するわけではない。
ここで、受払部門では、部材の欠品を予防するために、予備分の部材を生産前に生産部門に投入する場合がある。このような場合には、図8Dに示すように、部材の投入量の累積を表すグラフが、欠品予防のための予備分だけy軸のプラス方向にシフトすることになる。
さらに、生産部門では、製品を生産する際、実際に生産部門にあった部材が使用される。図8Eに示すように、既に生産部門に部材があった場合には、部材を投入した日時において、部材の投入量の累積と部材の推定使用量の累積は、一致するわけではない。
ここで、注意が必要なのは、既に生産工程にあった部材が大量の場合は、図8Eの投入量の累積が、推定使用量よりも、見かけ上小さくなる場合があることである。その場合には、見かけ上のリードタイムは、マイナスの値となる。すなわち、時々刻々の投入量と推定使用量との対応関係を見つけることは不可能である。その代わり、生産条件が同一と見なせる一定期間に於ける、投入量および推定使用量との該期間内の増加傾向の比較を行うことを考える。
したがって、図8Fに示すように、部材の使用量kが適切か否かの判断には、部材における投入量の累積を直線近似したときの傾きRと、製品の生産実績から算出した部材における推定使用量の累積を直線近似したときの傾きCとを用いるのである。すなわち、傾きRと傾きCとが等しいかどうかを判断することで、部材の使用量kが適切か否かを判断する。すなわち、部材における投入量の累積の全体的な増加傾向と部材における推定使用量の累積の全体的増加傾向とが等しいか否かを判断することで、部材の使用量kが適切か否かを判断する。かかる判断は、是正措置提示部14によって行われる。
なお、注目している部材が2製品で使用されており、2製品の生産数の比率が異なる2つの期間がある場合であっても、それぞれの期間で、傾きRおよび傾きCが算出されれば良い。図9A~図9Cは、2製品の生産数の比率が異なる2つの期間がある場合の傾きRおよび傾きCの算出について説明する図である。ここでは、製品1および製品2が、注目している部材を使用しているものとする。
図9Aに示すように、製品1および製品2のそれぞれの生産量の累積を表すグラフが表わされている。x軸は日時、y軸は生産実績数量である。S1
1は、期間1で単位日時当たり生産された製品1の生産量である。S1
2は、期間2で単位日時当たり生産された製品1の生産量である。グラフには、製品1の生産量の累積が表わされている。S2
1は、期間1で単位日時当たり生産された製品2の生産量である。S2
2は、期間2で単位日時当たり生産された製品2の生産量である。グラフには、製品2の生産量の累積が表わされている
図9Bに示すように、部材の投入間隔が一定である場合の部材の投入量の累積を表すグラフが表わされている。x軸は日時、y軸は部材の投入数量である。ここでは、部材について、投入量21dの累積値が増える傾向は、期間1と期間2とで異なる。すなわち、期間1での傾きの値はR1である。期間2での傾きの値はR2である。
したがって、図9Cに示すように、期間1では、部材における投入量の累積を直線近似したときの傾きR1を算出し、製品の生産実績から算出した部材における推定使用量の累積を直線近似したときの傾きC1を算出する。そして、部材の使用量kが適切か否かの判断には、傾きR1と、傾きC1とを用いれば良い。期間2では、部材における投入量の累積を直線近似したときの傾きR2を算出し、製品の生産実績から算出した部材における推定使用量の累積を直線近似したときの傾きC2を算出する。そして、部材の使用量kが適切か否かの判断には、傾きR2と、傾きC2とを用いれば良い。
また、生産期間内に休日期間がある場合には、休日期間分を除外したうえで、部材における投入量の累積を直線近似したときの傾きRと、製品の生産実績から算出した部材における推定使用量の累積を直線近似したときの傾きCを算出すれば良い。図10は、休日期間がある場合の傾きRおよび傾きCの算出について説明する図である。図10上図に示すように、休日期間がある場合には、部材が投入されないし、部材を用いた製品の生産が行われない。このような場合には、部材における投入量の累積を直線近似したときの傾きR、製品の生産実績から算出した部材における推定使用量の累積を直線近似したときの傾きCは、正確に算出されない。そこで、図10下図に示すように、休日期間分を除外した営業日に対して、部材の投入量の累積を直線近似したときの傾きRを算出すれば良い。休日期間分を除外した営業日に対して、部材の推定使用量の累積を直線近似したときの傾きCを算出すれば良い。そして、部材の使用量が適切か否かの判断には、傾きRと、傾きCとを用いれば良い。
[部材の管理状況監視処理のフローチャート]
次に、部材の管理状況監視処理のフローチャートの一例を、図11を参照して説明する。図11は、実施例に係る部材の管理状況監視処理のフローチャートの一例を示す図である。
次に、部材の管理状況監視処理のフローチャートの一例を、図11を参照して説明する。図11は、実施例に係る部材の管理状況監視処理のフローチャートの一例を示す図である。
図11に示すように、投入累積増加傾向算出部11は、部材の投入量の累積の時間変化を線形近似した結果の傾きRを算出する(ステップS11)。例えば、投入累積増加算出部11は、投入トランザクション21を用いて、場所コード21c毎および生産アイテムID21b毎に、投入日付21e毎の投入量21dを取得する。ここでいう生産アイテムID21bが、部材に対応する。投入累積増加算出部11は、1つの場所コード21c且つ1つの生産アイテムID21bに対する各投入日付21eの投入量21dを用いて、投入量の時間に応じた累積値を直線近似したときの傾きRの値を算出する。以下では、この場所コード21c且つ生産アイテムID21bの使用部材に対する処理の説明を行う。
推定累積増加傾向算出部12は、生産実績トランザクション41と部品構成表31を基に、生産日付毎の使用部材の推定使用量を算出する(ステップS12)。例えば、推定累積増加傾向算出部12は、部品構成表31から、使用部材(使用アイテムID31b)を用いる製品(生産アイテムID31c)を取得する。推定累積増加傾向算出部12は、部品構成表31から、取得した製品を1単位当たり生産するために必要な使用部材の使用量31dを算出する。推定累積増加傾向算出部12は、生産実績トランザクション41を用いて、取得した製品(生産アイテムID31c)毎に、各製品に対する、生産日付41e毎の生産量41dを取得する。推定累積増加傾向算出部12は、生産日付41e毎に、算出した使用部材の使用量31dに生産量41dを乗算し、生産日付41e毎の使用部材の推定使用量を算出する。
推定累積増加傾向算出部12は、使用部材の推定使用量の累積の時間変化を線形近似した結果の傾きCを算出する(ステップS13)。例えば、推定累積増加傾向算出部12は、生産日付41e毎の推定使用量を用いて、推定使用量の時間に応じた累積値を直線近似したときの傾きCの値を算出する。
続いて、是正措置提示部14は、傾きRが0であるか否かを判定する(ステップS14)。傾きRが0であると判定した場合には(ステップS14;Yes)、是正措置提示部14は、判定1に分類する。すなわち、是正措置提示部14は、使用部材の投入量が全く記録されていないと判断し、「投入実績入力なし」且つ投入業務を担う受払部門の責務と判定する(ステップS15)。そして、是正措置提示部14は、「投入実績入力なし」を受払部門に提示する。そして、是正措置提示部14は、部材の管理状況監視処理を終了する。
傾きRが0でないと判定した場合には(ステップS14;No)、是正措置提示部14は、傾きCが0であるか否かを判定する(ステップS16)。傾きCが0であると判定した場合には(ステップS16;Yes)、是正措置提示部14は、判定2に分類する。すなわち、是正措置提示部14は、部品構成表31に使用部材の定義が登録されていないと判断し、「部品構成表登録なし」且つ部品構成表31への定義を担う設計部門の責務と判定する(ステップS17)。一例として、図5において、部材8の定義が、部品構成表31に登録されていない場合である。そして、是正措置提示部14は、「部品構成表登録なし」を設計部門に提示する。そして、是正措置提示部14は、部材の管理状況監視処理を終了する。
傾きCが0でないと判定した場合には(ステップS16;No)、是正措置提示部14は、傾きRが傾きCより大きいか否かを判定する(ステップS18)。傾きRが傾きCより大きいと判定した場合には(ステップS18;Yes)、是正措置提示部14は、(傾きR-傾きC)/傾きRが閾値vより大きいか否かを判定する(ステップS19)。すなわち、是正措置提示部14は、傾きRと傾きCとの差異が大きいか否かを判定する。
(傾きR-傾きC)/傾きRが閾値vより大きいと判定した場合には(ステップS19;Yes)、是正措置提示部14は、判定3に分類する。すなわち、是正措置提示部14は、部品構成表31に使用部材の登録が抜けていると判断し、「部品構成表登録抜け」且つ部品構成表31への定義を担う設計部門の責務と判定する(ステップS20)。一例として、図5において、部材7が、部品構成表31に登録されていない場合であり、部品構成表31に部材7を定義し忘れた製品Aがある場合である。そして、是正措置提示部14は、「部品構成表登録抜け」を設計部門に提示する。そして、是正措置提示部14は、部材の管理状況監視処理を終了する。
(傾きR-傾きC)/傾きRが閾値v以下であると判定した場合には(ステップS19;No)、是正措置提示部14は、(傾きR-傾きC)/傾きRが閾値u以上である否かを判定する(ステップS21)。すなわち、是正措置提示部14は、傾きRと傾きCとの差異が小さいが無視できない程度に大きいか否かを判定する。
(傾きR-傾きC)/傾きRが閾値u以上であると判定した場合には(ステップS21;Yes)、是正措置提示部14は、判定5に分類する。すなわち、是正措置提示部14は、部品構成表31に定義された使用部材の使用量が過少であると判断し、「部材使用量過少設定」且つ部品構成表31への定義を担う設計部門の責務と判定する(ステップS22)。そして、是正措置提示部14は、「部材使用量過少設定」を設計部門に提示する。そして、是正措置提示部14は、部材の管理状況監視処理を終了する。
(傾きR-傾きC)/傾きRが閾値u以上でないと判定した場合には(ステップS21;No)、是正措置提示部14は、ステップS27に移行する。
ステップS18において、傾きRが傾きCより大きくないと判定した場合には(ステップS18;No)、是正措置提示部14は、(傾きC-傾きR)/傾きCが閾値v´より大きいか否かを判定する(ステップS23)。すなわち、是正措置提示部14は、傾きCと傾きRとの差異が大きいか否かを判定する。
(傾きC-傾きR)/傾きCが閾値v´より大きいと判定した場合には(ステップS23;Yes)、是正措置提示部14は、判定4に分類する。すなわち、是正措置提示部14は、使用部材の投入量の入力不足であると判断し、「投入実績入力不足」且つ投入業務を担う受払部門の責務と判定する(ステップS24)。そして、是正措置提示部14は、「投入実績入力不足」を受払部門に提示する。そして、是正措置提示部14は、部材の管理状況監視処理を終了する。
(傾きC-傾きR)/傾きCが閾値v´以下であると判定した場合には(ステップS23;No)、是正措置提示部14は、(傾きC-傾きR)/傾きCが閾値u´以上である否かを判定する(ステップS25)。すなわち、是正措置提示部14は、傾きCと傾きRとの差異が小さいが無視できない程度に大きいか否かを判定する。
(傾きC-傾きR)/傾きCが閾値u´以上であると判定した場合には(ステップS25;Yes)、是正措置提示部14は、判定6に分類する。すなわち、是正措置提示部14は、部品構成表31に定義された使用部材の使用量が過大であると判断し、「部材使用量過大設定」且つ部品構成表31への定義を担う設計部門の責務と判定する(ステップS26)。そして、是正措置提示部14は、「部材使用量過大設定」を設計部門に提示する。そして、是正措置提示部14は、部材の管理状況監視処理を終了する。
(傾きC-傾きR)/傾きCが閾値u´以上でないと判定した場合には(ステップS25;No)、是正措置提示部14は、ステップS27に移行する。
ステップS27において、是正措置提示部14は、判定7に分類する。すなわち、是正措置提示部14は、傾きCと傾きRとの差異がないか、または差異があっても無視できる程度に小さいと判断し、「不一致なし」と判定する(ステップS27)。そして、是正措置提示部14は、部材の管理状況監視処理を終了する。
[投入累積増加傾向算出部の処理の具体例]
次に、投入累積増加傾向算出部11による処理の具体例を、図12を参照して説明する。図12は、投入累積増加傾向算出部による処理の具体例を示す図である。なお、図12では、図3の投入トランザクション21を参照した場合について説明する。
次に、投入累積増加傾向算出部11による処理の具体例を、図12を参照して説明する。図12は、投入累積増加傾向算出部による処理の具体例を示す図である。なお、図12では、図3の投入トランザクション21を参照した場合について説明する。
投入累積増加算出部11は、投入トランザクション21を用いて、場所コード21c毎および生産アイテムID21b毎に、各投入日付21eの投入量21dを取得する。ここでは、投入トランザクション21には、場所コード21cとして「工程ロ」が設定されている。生産アイテムID21bとして「部材5」が設定されている。したがって、投入累積増加算出部11は、投入トランザクション21から、生産アイテムID21bとして「部材5」且つ場所コード21cとして「工程ロ」である投入量21dを、投入日付21e毎に取得する。図12の符号r1には、部材5の投入量が投入日付毎に示されている。
そして、投入累積増加算出部11は、投入日付21e毎の投入量21dを用いて、投入量の累積を直線近似したときの傾きRの値を算出する。ここでは、図12の符号r2には、部材5の投入量の時間に応じた累積値が示されている。投入累積増加算出部11は、この部材5の投入量の時間に応じた累積値を用いて、直線近似したときの傾きRの値を算出する。ここでは、投入累積増加算出部11は、y=20x+2に直線近似し、傾きRの値を20と算出する。
グラフg1は、部材5の投入量の累積を視覚的に表したグラフである。x軸は日時、y軸は部材の投入数量である。実線は、部材5の投入量の累積の折れ線グラフであり、破線は、直線近似した結果を示すy=20x+2のグラフである。なお、投入累積増加算出部11が、傾きRの値を算出する際には、グラフg1を生成せずに、投入累積を用いて傾きRの値を算出すれば良い。
[推定累積増加傾向算出部の処理の具体例]
次に、推定累積増加傾向算出部12による処理の具体例を、図13を参照して説明する。図13は、推定累積増加傾向算出部による処理の具体例を示す図である。なお、図13では、図4の部品構成表31および図6の生産実績トランザクション41を参照した場合について説明する。
次に、推定累積増加傾向算出部12による処理の具体例を、図13を参照して説明する。図13は、推定累積増加傾向算出部による処理の具体例を示す図である。なお、図13では、図4の部品構成表31および図6の生産実績トランザクション41を参照した場合について説明する。
推定累積増加傾向算出部12は、部品構成表31から、部材5を用いる製品を取得する。推定累積増加傾向算出部12は、取得した製品を1単位当たり生産するために必要な部材の使用量を、部品構成表31を用いて算出する。ここでは、図4の部品構成表31の行番号31aとして5行目から、部材5を用いて「部品い」が生成される。「部品い」を1単位当たり生産するために必要な部材5の使用量31dは、「10ミリリットル」である。部品構成表31の行番号31aとして8行目から、「部品い」を用いて「製品A」が生成される。「製品A」を1単位当たり生成するために必要な「部品い」の使用量は、「1個」である。部品構成表31の行番号31aとして9行目から、「部品い」を用いて「部品B」が生成される。「製品B」を1単位当たり生成するために必要な「部品い」の使用量は、「2個」である。
そして、推定累積増加傾向算出部12は、生産実績トランザクション41を用いて、「製品A」「製品B」毎に、各製品に対する、生産日付41e毎の部材5の推定使用量を算出する。そして、推定累積増加傾向算出部12は、各製品に対する生産日付41e毎の推定使用量を加算して、生産日付41e毎の部材5の推定使用量を算出する。ここでは、推定累積増加傾向算出部12は、生産実績トランザクション41を用いて、製品Aの「10月1日」の生産量を、行番号41aとして1行目から「1000個」と取得する。図13の符号r3には、製品Aの10月1日の生産量が示されている。そして、推定累積増加傾向算出部12は、「製品A」を1単位当たり生成するために必要な「部品い」の使用量は「1個」であるので、「部品い」の推定個数を「1000個」と算出する。図13の符号r4には、「部品い」の推定個数が示されている。そして、推定累積増加傾向算出部12は、「部品い」を1単位当たり生産するために必要な部材5の使用量31dは「10ミリリットル」であるので、部材5の推定使用量を「10000ミリリットル(10リットル)」と算出する。図13の符号r5には、部材5の推定使用量が示されている。同様に、推定累積増加傾向算出部12は、製品Aの10月2日から10月10日までの部材5の推定使用量を算出する。同様に、推定累積増加傾向算出部12は、製品Bの10月1日から10月10日までの部材5の推定使用量を算出する。そして、推定累積増加傾向算出部12は、製品Aおよび製品Bの10月1日から10月10日までのそれぞれの部材5の推定使用量を加算したうえで、部材5の推定使用量の累積を算出する。図13の符号r6には、部材5の推定使用量の累積が生産日付毎に示されている。
そして、推定累積増加傾向算出部12は、生産日付41e毎の推定使用量を用いて、推定使用量の累積を直線近似したときの傾きCの値を算出する。ここでは、推定累積増加傾向算出部12は、符号r6に示される部材5の推定使用量の累積を用いて、直線近似したときの傾きCの値を算出する。ここでは、推定累積増加傾向算出部12は、y=25x+12に直線近似し、傾きCの値を25と算出する。
グラフg2は、部材5の推定使用量の累積を視覚的に表したグラフである。x軸は日時、y軸は部材数量である。実線は、部材5の推定使用量の累積の折れ線グラフであり、破線は、直線近似した結果を示すy=25x+12のグラフである。なお、推定累積増加傾向算出部12が、傾きCの値を算出する際には、グラフg2を生成せずに、推定使用量の累積を用いて傾きCの値を算出すれば良い。
[提示の具体例]
次に、是正措置提示部14および調整量提示部15による提示の具体例を、図14を参照して説明する。図14は、提示の具体例を示す図である。図14に示すように、アイテム名毎に、判定、対象部門、内容が提示される。アイテム名は、部材に対応する。判定は、是正措置提示部14によって判定された判定の番号に対応する。対象部門は、是正措置提示部14によって判定された判定の責務対象の部門に対応する。内容は、是正措置提示部14によって判定された判定結果の内容、調整量提示部15によって算出された見積もり誤差および見積もり誤差から得られる使用量31dの推奨値に対応する。一例として、アイテム名が「部材5」である場合に、判定として「(判定)6」、対象部門として「設計部門」と提示される。内容として「部材使用量過大設定、部品い 使用量が2多い、部品い 設定推奨値 8」と提示される。これにより、是正措置提示部14および調整量提示部15は、「部品い」の部品構成表31上の使用量31dの設定値に原因があること、責務部門が設計部門であること、「部品い」の使用量が「2」多く、推奨設定値が「8」であることを提示することができる。
次に、是正措置提示部14および調整量提示部15による提示の具体例を、図14を参照して説明する。図14は、提示の具体例を示す図である。図14に示すように、アイテム名毎に、判定、対象部門、内容が提示される。アイテム名は、部材に対応する。判定は、是正措置提示部14によって判定された判定の番号に対応する。対象部門は、是正措置提示部14によって判定された判定の責務対象の部門に対応する。内容は、是正措置提示部14によって判定された判定結果の内容、調整量提示部15によって算出された見積もり誤差および見積もり誤差から得られる使用量31dの推奨値に対応する。一例として、アイテム名が「部材5」である場合に、判定として「(判定)6」、対象部門として「設計部門」と提示される。内容として「部材使用量過大設定、部品い 使用量が2多い、部品い 設定推奨値 8」と提示される。これにより、是正措置提示部14および調整量提示部15は、「部品い」の部品構成表31上の使用量31dの設定値に原因があること、責務部門が設計部門であること、「部品い」の使用量が「2」多く、推奨設定値が「8」であることを提示することができる。
加えて、アイテム名毎に、部材の投入量の累積から生成される投入グラフ、部材の推定使用量の累積から生成される推定グラフが是正措置提示部14によって提示される。これにより、是正措置提示部14は、部材における投入実績と推定実績とから何らかの是正すべき点があるか否かを視覚的に提示することができる。
[実施例の効果]
このようにして、上記実施例では、部材管理状況監視装置1は、ある部材について、生産のために投入された該部材の投入量の時間に応じた累積値の変化の第1の度合いを算出する。部材管理状況監視装置1は、ある部材を用いて生産する製品を取得し、取得した製品を単位量生産するのに必要なある部材の使用量に生産量を乗算し、ある部材の推定使用量を算出する。部材管理状況監視装置1は、算出したある部材の推定使用量の時間に応じた累積値の変化の第2の度合いを算出する。そして、部材管理状況監視装置1は、第1の度合いと第2の度合いの比を出力する。かかる構成によれば、部材管理状況監視装置1は、製品を単位量生産するのに必要な部材の使用量を正確に見積もる作業を支援することができる。また、部材管理状況監視装置1は、同一と見なせる生産条件の期間中の投入量と推定使用量とのバランス状況によって、改善が必要な部門の特定を行なうとともに、該部門に対する是正措置、すなわち、正確な投入量の入力作業指示を出力することができる。
このようにして、上記実施例では、部材管理状況監視装置1は、ある部材について、生産のために投入された該部材の投入量の時間に応じた累積値の変化の第1の度合いを算出する。部材管理状況監視装置1は、ある部材を用いて生産する製品を取得し、取得した製品を単位量生産するのに必要なある部材の使用量に生産量を乗算し、ある部材の推定使用量を算出する。部材管理状況監視装置1は、算出したある部材の推定使用量の時間に応じた累積値の変化の第2の度合いを算出する。そして、部材管理状況監視装置1は、第1の度合いと第2の度合いの比を出力する。かかる構成によれば、部材管理状況監視装置1は、製品を単位量生産するのに必要な部材の使用量を正確に見積もる作業を支援することができる。また、部材管理状況監視装置1は、同一と見なせる生産条件の期間中の投入量と推定使用量とのバランス状況によって、改善が必要な部門の特定を行なうとともに、該部門に対する是正措置、すなわち、正確な投入量の入力作業指示を出力することができる。
また、上記実施例では、部材管理状況監視装置1は、出力された比に基づいて、部材に関する情報について、異なる判定結果を通知する。かかる構成によれば、部材管理状況監視装置1は、異なる判定結果に基づいて、部材に関する情報の問題点を通知先に把握させることができる。
また、上記実施例では、部材管理状況監視装置1は、出力された比に基づいて、部材の使用量の推奨量を通知する。かかる構成によれば、部材管理状況監視装置1は、部材の使用量の推奨量を通知先に把握させることができ、部材の使用量の見積もり作業を支援することができる。
[その他]
なお、実施例では、部材管理状況監視装置1が部材の管理状況監視処理を実行すると説明した。しかしながら、これに限定されず、部材管理状況監視装置1に相当するシステムが部材の管理状況監視処理を実行するようにしても良い。すなわち、投入累積増加傾向算出部11に相当する装置と、推定累積増加傾向算出部12に相当する装置と、指標出力部13に相当する装置と、是正措置提示部14および調整量提示部15に相当する装置とが、協働して部材の管理状況監視処理を実行しても良い。
なお、実施例では、部材管理状況監視装置1が部材の管理状況監視処理を実行すると説明した。しかしながら、これに限定されず、部材管理状況監視装置1に相当するシステムが部材の管理状況監視処理を実行するようにしても良い。すなわち、投入累積増加傾向算出部11に相当する装置と、推定累積増加傾向算出部12に相当する装置と、指標出力部13に相当する装置と、是正措置提示部14および調整量提示部15に相当する装置とが、協働して部材の管理状況監視処理を実行しても良い。
また、実施例では、指標出力部13は、一例として、傾きRが傾きCより大きい場合には、(傾きR-傾きC)/傾きRを比として算出し、傾きCが傾きRより大きい場合には、(傾きC-傾きR)/傾きCを比として算出すると説明した。しかしながら、指標出力部13は、これに限定されず、別の例として、図15のフローチャートに示すように、傾きR/傾きCを比として算出するようにしても良い。なお、図15中の各閾値は、図11に示す各閾値u,v,u´およびv´を用いている。傾きR/傾きCを比とした場合には、是正措置提示部14は、傾きR/傾きCが1/(1-v)より大きい場合には(ステップS31;Yes)、判定3に分類し、「部品構成表登録抜け」且つ部品構成表31への定義を担う設計部門の責務と判定する。是正措置提示部14は、傾きR/傾きCが1/(1-u)以上の場合には(ステップS33;Yes)、判定5に分類し、「部材使用量過少設定」且つ部品構成表31への定義を担う設計部門の責務と判定する。是正措置提示部14は、傾きR/傾きCが1-u’より小さい場合には(ステップS35;Yes)、判定7に分類し、「不一致なし」と判定する。是正措置提示部14は、傾きR/傾きCが1-v’以下の場合には(ステップS37;Yes)、判定6に分類し、「部材使用量過大設定」且つ部品構成表31への定義を担う設計部門の責務と判定する。是正措置提示部14は、上記いずれの判定にも当たらない場合には、判定4に分類し、「投入実績入力不足」且つ投入業務を担う受払部門の責務と判定する。
また、図示した装置の各構成要素は、必ずしも物理的に図示の如く構成されていることを要しない。すなわち、装置の分散・統合の具体的態様は図示のものに限られず、その全部または一部を、各種の負荷や使用状況などに応じて、任意の単位で機能的または物理的に分散・統合して構成することができる。例えば、指標出力部13と是正措置提示部14とを1個の部として統合しても良い。また、是正措置提示部14を、是正措置を判定する判定部と、是正措置を提示する提示部に分散しても良い。また、生産管理システム2内の投入トランザクション21、部品構成表31、および生産実績トランザクション41や、閾値テーブル51を部材管理状況監視装置1の外部装置としてネットワーク経由で接続するようにしても良い。
また、上記実施例で説明した各種の処理は、あらかじめ用意されたプログラムをパーソナルコンピュータやワークステーションなどのコンピュータで実行することによって実現することができる。そこで、以下では、図1に示した部材管理状況監視装置1と同様の機能を実現する部材の管理状況監視プログラムを実行するコンピュータの一例を説明する。図16は、部材の管理状況監視プログラムを実行するコンピュータの一例を示す図である。
図16に示すように、コンピュータ200は、各種演算処理を実行するCPU203と、ユーザからのデータの入力を受け付ける入力装置215と、表示装置209を制御する表示制御部207とを有する。また、コンピュータ200は、記憶媒体からプログラムなどを読取るドライブ装置213と、ネットワークを介して他のコンピュータとの間でデータの授受を行う通信制御部217とを有する。また、コンピュータ200は、各種情報を一時記憶するメモリ201と、HDD205を有する。そして、メモリ201、CPU203、HDD205、表示制御部207、ドライブ装置213、入力装置215、通信制御部217は、バス219で接続されている。
ドライブ装置213は、例えばリムーバブルディスク211用の装置である。HDD205は、部材の管理状況監視プログラム205aおよび部材の管理状況監視処理関連情報205bを記憶する。
CPU203は、部材の管理状況監視プログラム205aを読み出して、メモリ201に展開し、プロセスとして実行する。かかるプロセスは、部材管理状況監視装置1の各機能部に対応する。部材の管理状況監視処理関連情報205bは、投入トランザクション21、部品構成表31、生産実績トランザクション41および閾値テーブル51に対応する。そして、例えばリムーバブルディスク211が、部材の管理状況監視プログラム205aなどの各情報を記憶する。
なお、部材の管理状況監視プログラム205aについては、必ずしも最初からHDD205に記憶させておかなくても良い。例えば、コンピュータ200に挿入されるフレキシブルディスク(FD)、CD-ROM、DVDディスク、光磁気ディスク、ICカードなどの「可搬用の物理媒体」に当該プログラムを記憶させておく。そして、コンピュータ200がこれらから部材の管理状況監視プログラム205aを読み出して実行するようにしても良い。
100 管理システム
1 部材管理状況監視装置
2 受払サブシステム
3 設計サブシステム
4 生産サブシステム
9 生産管理システム
10 制御部
11 投入累積増加傾向算出部
12 推定累積増加傾向算出部
13 指標出力部
14 是正措置提示部
15 調整量提示部
20 記憶部
21 投入トランザクション
31 部品構成表
41 生産実績トランザクション
1 部材管理状況監視装置
2 受払サブシステム
3 設計サブシステム
4 生産サブシステム
9 生産管理システム
10 制御部
11 投入累積増加傾向算出部
12 推定累積増加傾向算出部
13 指標出力部
14 是正措置提示部
15 調整量提示部
20 記憶部
21 投入トランザクション
31 部品構成表
41 生産実績トランザクション
Claims (11)
- コンピュータに、
ある部材について、生産のために投入された該部材の投入量の時間に応じた累積値の変化の第1の度合いを算出し、
前記部材を用いて生産する製品の情報を取得し、
該取得した製品を単位量生産するのに必要な前記部材の量に生産量を乗算し、前記部材の推測量を算出し、
該算出した前記部材の推測量の時間に応じた累積値の変化の第2の度合いを算出し、
前記第1の度合いと前記第2の度合いの比を出力する
処理を実行させる部材の管理状況監視プログラム。 - 該出力する処理によって出力された比の値に基づいて、前記部材に関する情報について、異なる判定結果を通知する
処理を実行させる請求項1に記載の部材の管理状況監視プログラム。 - 該出力する処理によって出力された比に基づいて、前記部材の量の推奨量を通知する
処理を実行させる請求項1に記載の部材の管理状況監視プログラム。 - コンピュータが、
ある部材について、生産のために投入された該部材の投入量の時間に応じた累積値の変化の第1の度合いを算出し、
前記部材を用いて生産する製品の情報を取得し、
該取得した製品を単位量生産するのに必要な前記部材の量に生産量を乗算し、前記部材の推測量を算出し、
該算出した前記部材の推測量の時間に応じた累積値の変化の第2の度合いを算出し、
前記第1の度合いと前記第2の度合いの比を出力する
処理を実行する部材の管理状況監視方法。 - ある部材について、生産のために投入された該部材の投入量の時間に応じた累積値の変化の第1の度合いを算出する第1の算出部と、
前記部材を用いて生産する製品の情報を取得し、取得した製品を単位量生産するのに必要な前記部材の量に生産量を乗算し、前記部材の推測量を算出し、算出された前記部材の推測量の時間に応じた累積値の変化の第2の度合いを算出する第2の算出部と、
前記第1の算出部によって算出された第1の度合いと前記第2の算出部によって算出された第2の度合いの比を出力する出力部と、
を有することを特徴とする部材の管理状況監視装置。 - コンピュータが、
ある製品について、生産に必要な部材の情報と、該製品を単位量当たり生産するのに必要な該部材の量と、生産のために投入された該部材の投入量と、該ある製品の生産量との情報を取得し、
時間に応じた前記投入量の累積値の変化の度合いと、前記生産量と前記部材の量とに基づいて算出される、前記ある製品の生産に係り払い出された前記部材の推測量の、時間に応じた累積値の変化の度合いとの大小関係に応じて異なる通知を行う
処理を実行する部材の管理状況監視方法。 - さらに、時間と前記部材の量とをそれぞれ軸にとり、前記投入量の累積値の変化の度合いを示す線分と、前記推測量の累積値の変化の度合いを示す線分とを配置したグラフを生成し、
前記通知する処理は、前記通知とともに前記グラフを出力する
ことを特徴とする請求項6に記載の部材の管理状況監視方法。 - 前記通知する処理は、前記投入量の累積値の変化の度合いが前記部材の推測量の累積値の変化の度合いより第1の閾値以上第2の閾値以下だけ大きい場合には、前記部材の量が過少設定である旨を前記部材の情報を定義する部門に通知する
ことを特徴とする請求項6または請求項7に記載の部材の管理状況監視方法。 - 前記通知する処理は、前記投入量の累積値の変化の度合いが前記部材の推測量の累積値の変化の度合いより第1の閾値以上第2の閾値以下だけ小さい場合には、前記部材の量が過大設定である旨を前記部材の情報を定義する部門に通知する
ことを特徴とする請求項6または請求項7に記載の部材の管理状況監視方法。 - 単位当たりの特定の製品の生産に用いる特定の部材の量として登録された値を記憶する記憶部と、
前記特定の部材の消費量として入力された消費量と、前記特定の製品の生産実績の数とを受信する受信部と、
入力された前記消費量と、入力された前記生産実績の数の前記単位の換算値に対応する値との間の関係が、前記記憶部に記憶された値に相当する数倍を下回る関係かまたは超える関係かに応じて、登録された前記値が不足または過多であることの判定を行う制御部と、
を備えたことを特徴とする部材の管理状況監視装置。 - 単位当たりの特定の製品の生産に用いる特定の部材の量として登録された値を記憶する記憶部と、
前記特定の部材の消費量として入力された消費量と、前記特定の製品の生産実績の数とを受信する受信部と、
入力された前記消費量と、入力された前記生産実績の数の前記単位の換算値に対応する値との間の関係が、前記記憶部に記憶された値に相当する数倍の関係からずれる程度に応じて、登録された前記値、または、入力された前記消費量若しくは入力された前記製造数の異常を検出する制御部と、
を備えたことを特徴とする部材の管理状況監視装置。
Priority Applications (3)
| Application Number | Priority Date | Filing Date | Title |
|---|---|---|---|
| PCT/JP2015/060263 WO2016157455A1 (ja) | 2015-03-31 | 2015-03-31 | 部材の管理状況監視プログラム、部材の管理状況監視方法および部材の管理状況監視装置 |
| CN201580077073.3A CN107407929B (zh) | 2015-03-31 | 2015-03-31 | 存储构件的管理状况监视程序的存储介质、构件的管理状况监视方法以及构件的管理状况监视装置 |
| JP2017508961A JP6443538B2 (ja) | 2015-03-31 | 2015-03-31 | 部材の管理状況監視プログラム、部材の管理状況監視方法および部材の管理状況監視装置 |
Applications Claiming Priority (1)
| Application Number | Priority Date | Filing Date | Title |
|---|---|---|---|
| PCT/JP2015/060263 WO2016157455A1 (ja) | 2015-03-31 | 2015-03-31 | 部材の管理状況監視プログラム、部材の管理状況監視方法および部材の管理状況監視装置 |
Publications (1)
| Publication Number | Publication Date |
|---|---|
| WO2016157455A1 true WO2016157455A1 (ja) | 2016-10-06 |
Family
ID=57006659
Family Applications (1)
| Application Number | Title | Priority Date | Filing Date |
|---|---|---|---|
| PCT/JP2015/060263 Ceased WO2016157455A1 (ja) | 2015-03-31 | 2015-03-31 | 部材の管理状況監視プログラム、部材の管理状況監視方法および部材の管理状況監視装置 |
Country Status (3)
| Country | Link |
|---|---|
| JP (1) | JP6443538B2 (ja) |
| CN (1) | CN107407929B (ja) |
| WO (1) | WO2016157455A1 (ja) |
Families Citing this family (3)
| Publication number | Priority date | Publication date | Assignee | Title |
|---|---|---|---|---|
| JP7124200B2 (ja) * | 2019-02-21 | 2022-08-23 | 本田技研工業株式会社 | 部品保管位置決定装置、部品保管位置決定方法および部品管理システム |
| JP7295557B2 (ja) * | 2019-05-23 | 2023-06-21 | 株式会社イシダ | 食品生産管理システム |
| CN113902367A (zh) * | 2021-10-11 | 2022-01-07 | 深圳工博达策科技有限公司 | 一种用于离散制造业的产品入库统计方法和系统 |
Citations (3)
| Publication number | Priority date | Publication date | Assignee | Title |
|---|---|---|---|---|
| JP2000029950A (ja) * | 1998-07-14 | 2000-01-28 | Fujitsu Ltd | 投入計画作成システム及び投入計画作成方法並びにそのプログラムを格納した記憶媒体 |
| JP2002062925A (ja) * | 2000-08-23 | 2002-02-28 | Nec Corp | 生産管理方法および装置 |
| JP2003005817A (ja) * | 2001-06-18 | 2003-01-08 | Dainippon Printing Co Ltd | 材料発注システム |
-
2015
- 2015-03-31 JP JP2017508961A patent/JP6443538B2/ja active Active
- 2015-03-31 CN CN201580077073.3A patent/CN107407929B/zh active Active
- 2015-03-31 WO PCT/JP2015/060263 patent/WO2016157455A1/ja not_active Ceased
Patent Citations (3)
| Publication number | Priority date | Publication date | Assignee | Title |
|---|---|---|---|---|
| JP2000029950A (ja) * | 1998-07-14 | 2000-01-28 | Fujitsu Ltd | 投入計画作成システム及び投入計画作成方法並びにそのプログラムを格納した記憶媒体 |
| JP2002062925A (ja) * | 2000-08-23 | 2002-02-28 | Nec Corp | 生産管理方法および装置 |
| JP2003005817A (ja) * | 2001-06-18 | 2003-01-08 | Dainippon Printing Co Ltd | 材料発注システム |
Also Published As
| Publication number | Publication date |
|---|---|
| JPWO2016157455A1 (ja) | 2017-12-21 |
| CN107407929B (zh) | 2019-07-02 |
| JP6443538B2 (ja) | 2018-12-26 |
| CN107407929A (zh) | 2017-11-28 |
Similar Documents
| Publication | Publication Date | Title |
|---|---|---|
| JP5986531B2 (ja) | 生産管理システム、及び管理方法 | |
| US8036957B2 (en) | Method for managing inventory under price protection | |
| US20080270269A1 (en) | Method for stock record verification for small inventory populations | |
| WO2004022463A1 (ja) | 安全在庫量算出方法、安全在庫量算出装置、発注点算出方法、発注点算出装置及び発注量算出方法 | |
| Schwarz | The economic order-quantity (EOQ) model | |
| US20140316940A1 (en) | Method, apparatus, and computer program product for determining participant ratings | |
| US20080103874A1 (en) | Method for forecasting a future inventory demand | |
| JP6443538B2 (ja) | 部材の管理状況監視プログラム、部材の管理状況監視方法および部材の管理状況監視装置 | |
| US20190236694A1 (en) | Predictive risk management for supply chain receivables financing | |
| CN113039525A (zh) | 用于多阶段任务分配系统中的行为配对的技术 | |
| KR102234497B1 (ko) | 상품 판매 관리 정보를 제공하는 전자 장치 및 그 방법 | |
| JP5171320B2 (ja) | 企業型確定拠出年金における社員向けポートフォリオ乖離警告システム及び方法 | |
| CN103154904A (zh) | 操作管理设备、操作管理方法和程序 | |
| CN115587841A (zh) | 预测数据处理系统以及预测数据处理方法 | |
| US20050027487A1 (en) | Product defect analysis and resolution system | |
| US20160019507A1 (en) | Transaction Support Device, Transaction Support System, Transaction Support Method, and Program | |
| JP5899188B2 (ja) | 利率設定方法および装置 | |
| CN120280107A (zh) | 一种医用耗材全流程溯源管理系统 | |
| US20120089489A1 (en) | Component safety inventory amount calculating method, program for executing same, and device for executing same | |
| Cuculoski | Obsolescence management of electronic and control systems | |
| JP5734218B2 (ja) | 情報出力装置、情報出力方法、及びプログラム | |
| CN116645195A (zh) | 一种管理消费金融业务的方法及装置 | |
| JP6174098B2 (ja) | 計画支援装置、サプライチェーン管理システム及び計画支援プログラム | |
| KR101630033B1 (ko) | 원금이자 분리 관리 장치 및 방법 | |
| US20210295404A1 (en) | System and method for inventory based product demand transfer estimation in retail |
Legal Events
| Date | Code | Title | Description |
|---|---|---|---|
| 121 | Ep: the epo has been informed by wipo that ep was designated in this application |
Ref document number: 15887607 Country of ref document: EP Kind code of ref document: A1 |
|
| ENP | Entry into the national phase |
Ref document number: 2017508961 Country of ref document: JP Kind code of ref document: A |
|
| NENP | Non-entry into the national phase |
Ref country code: DE |
|
| 122 | Ep: pct application non-entry in european phase |
Ref document number: 15887607 Country of ref document: EP Kind code of ref document: A1 |