WO2016009662A1 - 交通量計測装置、交通量計測方法、および交通量計測プログラム - Google Patents
交通量計測装置、交通量計測方法、および交通量計測プログラム Download PDFInfo
- Publication number
- WO2016009662A1 WO2016009662A1 PCT/JP2015/052903 JP2015052903W WO2016009662A1 WO 2016009662 A1 WO2016009662 A1 WO 2016009662A1 JP 2015052903 W JP2015052903 W JP 2015052903W WO 2016009662 A1 WO2016009662 A1 WO 2016009662A1
- Authority
- WO
- WIPO (PCT)
- Prior art keywords
- intersection
- vehicle
- vehicles
- speed
- passed
- Prior art date
- Legal status (The legal status is an assumption and is not a legal conclusion. Google has not performed a legal analysis and makes no representation as to the accuracy of the status listed.)
- Ceased
Links
Images




Classifications
-
- G—PHYSICS
- G08—SIGNALLING
- G08G—TRAFFIC CONTROL SYSTEMS
- G08G1/00—Traffic control systems for road vehicles
- G08G1/01—Detecting movement of traffic to be counted or controlled
-
- G—PHYSICS
- G08—SIGNALLING
- G08G—TRAFFIC CONTROL SYSTEMS
- G08G1/00—Traffic control systems for road vehicles
- G08G1/01—Detecting movement of traffic to be counted or controlled
- G08G1/04—Detecting movement of traffic to be counted or controlled using optical or ultrasonic detectors
Definitions
- This invention relates to a technique for measuring the traffic volume at an intersection where a signal lamp is installed.
- signal control parameters are determined according to traffic volume at intersections where signal lamps are installed (especially important intersections where traffic congestion is likely to occur).
- the signal control parameters are cycle, split and offset.
- the cycle is a parameter that determines the time of one cycle of the signal lamp.
- the split is a parameter that determines the time of each display in one cycle.
- the offset is a parameter that determines a time difference in cycle start timing with signal lamps installed at nearby intersections.
- SCATS System Coordinated Adaptive System
- DS Degreeof Saturation
- DS is detected for each inflow path at the intersection.
- DS is a period during which the right of traffic is given to a group of vehicles traveling on the inflow path for each cycle of the signal lamp (period in which the signal lamp display for the group of vehicles traveling on the inflow path is green. In the middle), it is obtained by detecting the number n of vehicles passing through the vehicle detection area defined before the stop line of the intersection and the inter-vehicle time T when the vehicle is not located in the vehicle detection area.
- a loop coil type vehicle detection sensor is embedded in the vehicle detection region.
- the loop coil is embedded for each lane before the stop line of the lane.
- the inter-vehicle time T is the total time during which the loop coil type vehicle detection sensor has detected the vehicle during the displayed period.
- the passing number n is the total number of vehicles detected by the loop coil type vehicle detection sensor during the displayed period.
- the saturated traffic flow rate t is a value set in advance in consideration of the road conditions near the intersection.
- DS 1.0 when the actual inter-vehicle time T in the vehicle detection area coincides with the product of the set saturated traffic flow rate t and the number of passing vehicles n.
- the number of passing vehicles n decreases, but the inter-vehicle time T increases, so DS ⁇ 1.0 (usually, DS decreases as the degree of desaturation increases).
- DS>1.0 usually, the DS increases as the degree of supersaturation increases.
- Patent Documents 1 and 2 do not assume that vehicle detection is performed within an intersection. That is, an image picked up in the intersection is not processed, and the DS used in the above-described SCATS is not obtained. Therefore, the techniques described in Patent Documents 1 and 2 cannot be used in SCAT.
- An object of the present invention is to provide a technique capable of obtaining the saturation of the inflow path at the intersection and reducing the labor and cost for maintenance management.
- the traffic volume measuring device of the present invention is configured as follows to achieve the above object.
- the captured image obtained by capturing the inside of the intersection where the signal lamp is installed is input to the captured image input unit.
- the tracking unit processes the captured image input to the captured image input unit and tracks a vehicle traveling in the intersection.
- the measurement value acquisition unit acquires a representative value of the number of vehicles that have passed through the intersection and the speed of the vehicle that has passed through the intersection, for each inflow path of the vehicle to the intersection, based on the tracking result of the vehicle in the tracking unit.
- the saturation estimation unit uses a representative value of the number of vehicles that have passed through the intersection acquired by the measurement value acquisition unit and the vehicle speed for each inflow route of the vehicle to the intersection, and the degree of saturation (DS: Degree of Saturation). ).
- the representative value (V) of the passing vehicle speed increases as the number of passing vehicles (Q) decreases.
- the representative value (V) of the speed of the passing vehicle decreases as the number of passing vehicles (Q) decreases. Therefore, it is impossible to determine whether the vehicle is non-saturated or over-saturated only by the number of passing vehicles (Q).
- the speed of the passing vehicle is different between the non-saturated state and the over-saturated state, by using the representative value (V) of the passing vehicle speed in addition to the number of passing vehicles, It is possible to determine whether there is a supersaturated state (DS> 1.0). Therefore, the DS can be accurately estimated by using the number of passing vehicles (Q) and the representative value (V) of the passing vehicle speed.
- the tracking unit processes an image captured in the intersection and tracks the vehicle traveling in the intersection. From the tracking result, the number of passing vehicles (Q) and the representative value (V) of the passing vehicle speed are obtained. ), The labor and cost for maintenance management can be reduced.
- the captured image processed by the tracking unit is the number of passing vehicles based on the tracking result obtained by tracking the vehicle traveling in the intersection.
- (Q) and the area inside the intersection where the representative value (V) of the speed of the passing vehicle can be acquired need not be imaged, and the entire area inside the intersection may not be imaged. Conversely, the area outside the intersection May be imaged.
- a pre-clogging determination unit that determines, based on the saturation estimated by the saturation estimation unit, whether the outflow channel is in a clogged state in which the outflow channel is clogged with the vehicle is provided for each vehicle outflow channel at the intersection. Good.
- the representative value (V) is preferably limited to a straight-ahead vehicle.
- the tracking unit can suppress the processing load by switching the tracking area in the intersection where the traveling vehicle is tracked according to the change in the present indication at the intersection.
- the saturation of the inflow path at the intersection can be obtained, and the labor and cost for maintenance management can be reduced.
- FIG. 1 is a block diagram showing a configuration of a main part of a traffic measuring device according to this example.
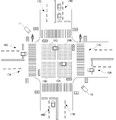
- FIG. 2 is a schematic plan view showing an installation example of the video camera at the intersection.
- the traffic measuring device 1 processes images captured in the intersection with two video cameras 10 and 11, and estimates the degree of saturation (DS) for each of the inflow paths 16A to 16D. Then, it is determined whether or not a clogging has occurred in each of the outflow paths 17A to 17D.
- DS is a value indicating the degree of congestion (congestion) in vehicles traveling on the inflow paths 16A to 16D. For clogging, the outflow paths 17A to 17D are congested, and when the driver enters the intersection, pause before the intersection (pause to check whether the entry space of the vehicle is on the outflow path side) ).
- video cameras 10 and 11 are installed at two corners that are not adjacent to the intersection.
- One video camera 10 is installed at an angle at which the detection areas 15A and 15B obtained by dividing the intersection into four are within the imaging area.
- the other video camera 11 is installed at an angle at which the detection areas 15C and 15D obtained by dividing the intersection into four are within the imaging area.
- the video cameras 10 and 11 can secure the above-described imaging area by using a wide-angle lens as the imaging lens.
- the frame rate of the video cameras 10 and 11 is several tens of frames / sec (for example, 30 frames / sec).
- the video cameras 10 and 11 preferably have megapixels (for example, about 1300 ⁇ 1000 in length ⁇ width) to ensure a certain level of resolution.
- inflow paths 16A to 16D and the outflow paths 17A to 17D at the intersection may or may not be within the imaging area of the video cameras 10 and 11.
- two video cameras 10 and 11 are installed at the intersection, but one video camera may be installed.
- the entire detection areas 15A to 15D are imaged with one video camera.
- four video cameras may be installed, and detection areas 15A to 15D to be imaged may be assigned to each video camera. That is, the number of video cameras is not limited as long as the detection areas 15A to 15D can be imaged.
- This detection area corresponds to the tracking area referred to in the present invention.
- the straight vehicle that has entered the intersection from the inflow path 16A passes through the detection areas 15A and 15D in this order and enters the outflow path 17A.
- a straight vehicle that has entered the intersection from the inflow path 16B passes through the detection areas 15B and 15A in this order and enters the outflow path 17B.
- a straight vehicle entering the intersection from the inflow path 16C passes through the detection areas 15C and 15B in this order and enters the outflow path 17C.
- a straight vehicle entering the intersection from the inflow path 16D passes through the detection areas 15D and 15C in this order and enters the outflow path 17D.
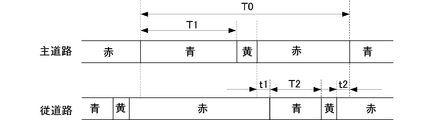
- FIG. 3 is a diagram showing a change in the display of the signal lamp installed at the intersection.
- FIG. 3 shows an example in which the display of the signal lamp changes in the order of blue, yellow, and red.
- the change in the display of the signal lamp will be briefly described with the left-right road in FIG. 2 as the main road and the up-and-down road as the secondary road.
- the signal lamps on the main road side and the secondary road side are switched in order of blue, yellow, and red.
- T1 shown in FIG. 3 is the blue time (split) of the main road.
- T2 is the blue time (split) of the secondary road.
- T0 is a cycle of the signal lamp.
- the signal light on the secondary road is always red when the signal light on the main road is blue or yellow, and conversely, the signal light on the main road is blue, Or when it is yellow, it is always red.
- clearance times t1 and t2 shown in FIG. 3 are provided in which the main road side signal lamp and the secondary road side signal lamp are both red at the time of switching.
- the cycle and split of the signal lamp installed at this intersection is determined by a signal control device (not shown). Specifically, the signal control device is installed at this intersection based on the DS of each of the inflow channels 16A to 16D estimated by the traffic volume measuring device 1 according to this example and the result of the clogging of each of the outflow channels 17A to 17D. Determine the cycle or split of the signal lamp that is being used.
- the traffic volume measuring apparatus 1 includes a control unit 2, an image input unit 3, an image processing processor 4, and an input / output unit 5 as shown in FIG.
- the control unit 2 controls the operation of each part of the main body of the traffic measuring device 1.
- the frame image in the intersection captured by the two connected video cameras 10 and 11 is input to the image input unit 3.
- the image input unit 3 includes an image memory that temporarily stores the input frame image.
- the image input unit 3 corresponds to the captured image input unit referred to in the present invention.
- the image processor 4 processes the frame image input from one video camera 10 when the current display is the vehicle group of the main road in FIG. 2 (when the signal lamp on the main road side is blue), The vehicle traveling in the detection region 15A is tracked, and the frame image input from the other video camera 11 is processed to track the vehicle traveling in the detection region 15C. Further, the image processor 4 processes a frame image input from one video camera 10 when the current display is a group of vehicles on the secondary road in FIG. 2 (when the signal lamp on the secondary road side is blue). Thus, the vehicle traveling in the detection area 15B is tracked, and the frame image input from the other video camera 11 is processed to track the vehicle traveling in the detection area 15D.
- the image processor 4 switches the detection areas 15A to 15D for tracking the vehicle passing through the intersection in accordance with the change in the display installed at the intersection.
- the image processor 4 estimates the DS for each of the inflow paths 16A to 16D using the tracking results of the vehicles in the detection areas 15A to 15D. Further, the image processor 4 determines whether or not a clogging has occurred for each of the outflow paths 17A to 17D, using the tracking results of the vehicles in the detection areas 15A to 15D.
- the image processor 4 corresponds to a computer that executes the traffic volume measuring method according to the present invention.
- the image processor 4 corresponds to a computer that executes a traffic volume measurement program according to the present invention.
- a signal control device (not shown) is connected to the input / output unit 5.
- the input / output unit 5 outputs the DS of each of the inflow channels 16A to 16D and the clogging determination result of each of the outflow channels 17A to 17D estimated by the image processor 4 to the signal control device.
- the input / output unit 5 receives a signal indicating a display state of a signal lamp installed at an intersection (a signal indicating a period when a vehicle on the main road is displayed, and a vehicle on the secondary road from the signal control device). The signal indicating the period shown in FIG.
- the signal control device determines a signal control parameter for controlling the signal lamp installed at the intersection based on the DS of each of the inflow paths 16A to 16D and the result of the clogging of each of the outflow paths 17A to 17D.
- the signal control parameter determines the cycle T0 and the splits T1 and T2 shown in FIG. Clearance time t1, t2, yellow time, etc. are predetermined.
- the signal control device controls the display of the signal lamp with the determined signal control parameter.
- This signal control apparatus determines a signal control parameter by, for example, a method according to a known SCATS (Sydney Coordinated Adaptive System).
- FIG. 4 is a functional block diagram showing the functional configuration of the image processor.
- the image processing processor 4 includes a first image processing unit 41 and a second image processing unit 42.
- the first image processing unit 41 processes a captured image in the intersection captured by one video camera 10.
- the second image processing unit 42 processes the captured image in the intersection captured by the other video camera 11.
- the first image processing unit 41 and the second image processing unit 42 differ only in the video cameras 10 and 11 that capture images to be processed, and have the same functional configuration.
- the first image processing unit 41 includes a vehicle tracking unit 411, a passing number acquisition unit 412, a vehicle speed acquisition unit 413, a DS estimation unit 414, and a clogging determination unit 415.
- the vehicle tracking unit 411 processes the frame image input from the one video camera 10 to the image input unit 3 when the current indication is the vehicle group of the main road in FIG. Track the vehicle passing 15A.
- the vehicle tracking unit 411 processes the frame image input from one video camera 10 and tracks the vehicle passing through the detection area 15B when the current display is a group of vehicles traveling on the secondary road in FIG. .
- the tracking of a vehicle is performed by processing a frame image captured by one video camera 10 in time series to detect a captured vehicle, and the vehicle ID, detection time (frame image capturing time), position (intersection) This can be done by generating an object map that associates coordinates indicating the upper position). Since a technique for processing a captured image of the video camera 10 and tracking an imaged object (a vehicle in this case) is well known, detailed description thereof is omitted.
- the passing number acquisition unit 412 acquires the number of vehicles (straight vehicles) that have traveled straight through the intersection using the object map generated by the vehicle tracking unit 411 for each cycle of the signal lamp. That is, the passing number acquisition unit 412 is a vehicle that has passed through the detection region 15A in the left-right direction when the current indication in one cycle is a group of vehicles traveling on the main road in FIG. 2 (period T1 shown in FIG. 3).
- the detection region 15B is passed in the vertical direction. Acquire the number of vehicles (straight vehicles). The movement trajectory of each vehicle is obtained from the object map.
- the vehicle speed acquisition unit 413 calculates a representative value of the speed of the vehicle that has traveled straight through the intersection.
- This representative value may be an average value of the speed of the straight-ahead vehicle or a median value. That is, the vehicle speed acquisition unit 413 travels straight in the left-right direction through the detection area 15A when the current indication in one cycle is a group of vehicles traveling on the main road in FIG. 2 (period T1 shown in FIG. 3).
- the detection region 15B is passed in the vertical direction. A representative value of the speed of the straight vehicle is calculated.
- the speed of each vehicle is obtained by dividing the moving distance of the vehicle by the time during which the vehicle tracking unit 411 was tracking the vehicle (moving distance / tracking time).
- the movement distance may be calculated from the movement locus of the vehicle obtained from the object map.
- the detection area 15A in FIG. The length in the left-right direction and the length in the vertical direction of the detection region 15B in FIG. 2 may be determined.
- the tracking time is a time difference between the imaging time of the frame image in which the vehicle is first detected and the imaging time of the frame image in which the vehicle is last detected.
- the passing number acquisition unit 412 and the vehicle speed acquisition unit 413 correspond to the measurement value acquisition unit referred to in the present invention.
- the DS estimation unit 414 estimates the DS of the inflow path 16A and the inflow path 16B for each cycle of the signal lamp.
- the DS of the inflow channel 16A indicates the number of straight-ahead vehicles passing through the detection area 15A acquired by the passing number acquisition unit 412 and the vehicle speed when the cycle is a group of vehicles traveling on the main road in FIG. It is estimated based on the representative value of the speed of the straight-ahead vehicle that has passed through the detection area 15A acquired by the acquisition unit 413.
- the DS of the inflow channel 16B is the number of straight-ahead vehicles passing through the detection area 15B acquired by the passing number acquisition unit 412 when the current cycle is a group of vehicles traveling on the secondary road in FIG. It is estimated based on the representative value of the speed of the straight-ahead vehicle passing through the detection area 15B acquired by the vehicle speed acquisition unit 413.
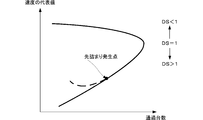
- the relationship shown in FIG. 5 is known as the relationship between the number of vehicles that have passed the intersection at blue hours and the representative value of the speed of the vehicle that has passed the intersection at blue hours.
- QV plot the relationship between the number of vehicles that have passed the intersection at blue hours and the representative value of the speed of the vehicle that has passed the intersection at blue hours.
- the representative value (V) of the speed of the passing vehicle increases as the number of passing vehicles (Q) decreases.
- the representative value (V) of the speed of the passing vehicle decreases as the number of passing vehicles (Q) decreases.
- the QV plot shown in FIG. 5 varies depending on the road structure (uphill, downhill, etc.) and the surrounding environment (good visibility, etc.). That is, the QV plot is different for each inflow path.
- the DS of the inflow path decreases as the speed of the vehicle increases, and the DS of the inflow path increases as the speed of the vehicle decreases.
- the DS value of the inflow channel does not change evenly in the vertical axis (speed) direction of FIG.
- the QV plot shown by the solid line in FIG. 5 is a state where no clogging has occurred in the outflow channel.
- the driver temporarily stops the car before the intersection, enters the intersection after confirming that there is an entry space for the vehicle on the outflow road side, and passes. For this reason, as indicated by a broken line in FIG. 5, the speed of the vehicle passing through the intersection is higher when the clogging occurs in the outflow path than when the clogging occurs in the outflow path. .
- the DS estimation unit 414 estimates the DS of the inflow channel 16A using the DS estimation data of the inflow channel 16A, and estimates the DS of the inflow channel 16D using the DS estimation data of the inflow channel 16B.
- the first image processing unit 41 stores the DS estimation data of the inflow channel 16A and the DS estimation data of the inflow channel 16B in a memory (not shown).
- the configuration of the DS estimation unit 414 that accepts the input of the number of passing vehicles (Q) and the representative value (V) of the passing vehicle speed corresponds to the measured value input unit referred to in the present invention.
- the clogging determination unit 415 determines whether clogging has occurred in the outflow path 17A and the outflow path 17B for each cycle of the signal lamp. In the cycle, the clogging determination unit 415 determines that the representative value of the speed of the vehicle that has passed through the detection region 15A in the left-right direction during the period T1 shown in FIG. 3 corresponds to the DS of the inflow path 16A estimated by the DS estimation unit 414. If the speed is higher than the speed on the QV plot, it is determined that the clogging has occurred in the outflow path 17A.
- the clogging determination unit 415 determines the representative value of the speed of the vehicle that has passed through the detection region 15A in the left-right direction during the period T1 shown in FIG. If the speed is equal to or lower than the speed on the QV plot with respect to DS, it is determined that no clogging has occurred in the outflow path 17A. In addition, in the cycle, the clogging determination unit 415 determines the representative value of the speed of the vehicle that has passed through the detection region 15B in the vertical direction during the period T2 illustrated in FIG. 3 in the inflow path 16B estimated by the DS estimation unit 414. If the speed is higher than the speed on the QV plot with respect to DS, it is determined that the clogging has occurred in the outflow path 17B.
- the second image processing unit 42 includes a vehicle tracking unit 421, a passing number acquisition unit 422, a vehicle speed acquisition unit 423, a DS estimation unit 424, and a clogging determination unit 425.
- the vehicle tracking unit 421, the passing number acquisition unit 422, the vehicle speed acquisition unit 423, the DS estimation unit 424, and the clogging determination unit 425 are respectively included in the first image processing unit 41. This is the same as the number acquisition unit 412, the vehicle speed acquisition unit 413, the DS estimation unit 414, and the clogging determination unit 415.
- the second image processing unit 42 stores the DS estimation data of the inflow channel 16C and the DS estimation data of the inflow channel 16D in a memory (not shown). In addition, the second image processing unit 42 acquires the number of vehicles (straightly traveling vehicles) that have passed through the detection region 15C in the left-right direction and the representative value of the vehicle speed when the current display is the vehicle group of the main road in FIG. Then, the DS of the inflow path 16C is estimated, and it is determined whether or not the outflow path 17C is in a clogged state.
- the second image processing unit 42 obtains the representative value of the number of vehicles (straightly traveling vehicles) passing through the detection area 15D in the vertical direction and the vehicle speed when the current display is the group of vehicles on the secondary road in FIG. Then, the DS of the inflow path 16D is estimated, and it is determined whether or not the outflow path 17D is in a clogged state.
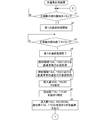
- FIG. FIG. 7 is a flowchart showing the operation of the traffic measuring device.
- a signal indicating the display state of the signal lamp installed at the intersection is input from the signal control device to the input / output unit 5.
- captured images within the intersection captured by the video cameras 10 and 11 installed at the intersection are input to the image input unit 3.
- the traffic volume measuring device 1 starts the first tracking process (s2) at the display start timing on the main road side (green signal start timing on the main road side) in FIG. 2 (s1).
- the vehicle tracking unit 411 processes an image in the intersection imaged by the video camera 10, and tracks the vehicle that has passed through the detection area 15A, and the vehicle tracking unit 421 performs the video camera 11. This is a process of processing the image in the intersection imaged in step 1 and tracking the vehicle that has passed through the detection region 15C.
- the image processor 4 ends the first tracking process started in s2 (s4) when the main road side display end timing (main road side green light end timing) in FIG. 2 is reached (s3).
- the image processor 4 acquires the number of straight-ahead vehicles that have passed through the detection areas 15A and 15C based on the vehicle tracking results executed by the vehicle tracking units 411 and 421 (s5).
- the passing number acquisition unit 412 acquires the number of straight-ahead vehicles that have passed through the detection area 15A. Further, the passing number acquisition unit 422 acquires the number of straight-ahead vehicles that have passed through the detection region 15C.
- the image processor 4 acquires a representative value of the speed of the straight vehicle passing through the detection areas 15A and 15C based on the vehicle tracking results executed by the vehicle tracking units 411 and 421 (s6).
- the vehicle speed acquisition unit 413 acquires a representative value of the speed of the straight vehicle that has passed through the detection region 15A.
- the vehicle speed acquisition unit 423 acquires a representative value of the speed of the straight vehicle that has passed through the detection region 15C.
- the representative value of the speed of the straight vehicle may be an average value of the speed of the straight vehicle or a median value.
- the image processor 4 estimates the DS of the inflow channels 16A and 16C (s7).
- the DS estimation unit 414 stores the DS estimation data of the inflow path 16A, the number of straight-ahead vehicles that have passed the detection area 15A acquired in s5, and the representative speed of the straight-ahead vehicle that has passed the detection area 15A acquired in s6
- the DS of this inflow channel 16A is estimated using the value.
- the DS estimation unit 424 stores the DS estimation data of the inflow path 16C stored therein, the number of straight-ahead vehicles that have passed the detection area 15C acquired in s5, and the speed of the straight-ahead vehicle that has passed the detection area 15C acquired in s6. Is used to estimate the DS of the inflow channel 16C.
- the image processor 4 determines whether or not a pre-clogging has occurred in the outflow channels 17A and 17C (s8).
- the clogging determination unit 415 compares the representative value of the speed of the straight vehicle that has passed through the detection area 15A acquired in s6 with the speed on the QV plot with respect to the DS of the inflow path 16A calculated in s7, and acquires it in s6. If the representative value of the speed of the straight vehicle that has passed through the detected area 15A is faster, it is determined that the clogging has occurred in the outflow path 17A.
- the clogging determination unit 425 compares the representative value of the speed of the straight vehicle that has passed the detection region 15C acquired in s6 with the speed on the QV plot for the DS of the inflow path 16C calculated in s7, and s6 If the representative value of the speed of the straight vehicle that has passed through the detection area 15C acquired in step S3 is faster, it is determined that the clogging has occurred in the outflow path 17C.
- the traffic volume measuring device 1 outputs the DS of the inflow channels 16A and 16C estimated in s7 and the determination result of the clogging of the outflow channels 17A and 17C determined in s8 to the signal control device (s9).
- the traffic volume measuring device 1 starts the second tracking process (s11) when the display start timing on the secondary road side in FIG. 2 (green signal start timing on the secondary road side) is reached (s10).
- the vehicle tracking unit 411 processes an image in the intersection imaged by the video camera 10, and tracks the vehicle that has passed the detection area 15B. This is a process of processing the image in the intersection imaged in step 1 and tracking the vehicle that has passed through the detection region 15D.
- the image processor 4 ends the second tracking process started at s11 (s13) when the display end timing (green signal end timing on the slave road) in FIG. 2 is reached (s12).
- the image processor 4 acquires the number of straight-ahead vehicles that have passed through the detection areas 15B and 15D based on the vehicle tracking results executed by the vehicle tracking units 411 and 421 (s14).
- the passing number acquisition unit 412 acquires the number of straight-ahead vehicles that have passed through the detection area 15B.
- the passing number acquisition unit 422 acquires the number of straight-ahead vehicles that have passed through the detection area 15D.
- the image processor 4 acquires a representative value of the speed of the straight vehicle passing through the detection areas 15B and 15D based on the vehicle tracking results executed by the vehicle tracking units 411 and 421 (s15).
- the vehicle speed acquisition unit 413 acquires a representative value of the speed of the straight vehicle that has passed the detection region 15B.
- the vehicle speed acquisition unit 423 acquires a representative value of the speed of the straight vehicle that has passed through the detection region 15D.
- the representative value of the speed of the straight vehicle may be an average value of the speed of the straight vehicle or a median value.
- the image processor 4 estimates the DS of the inflow channels 16B and 16D (s16).
- the DS estimation unit 414 stores the DS estimation data of the inflow path 16B, the number of straight-ahead vehicles that have passed the detection area 15B acquired in s14, and the representative speed of the straight-ahead vehicle that has passed the detection area 15B acquired in s15 The DS of this inflow channel 16B is estimated using the value.
- the DS estimation unit 424 stores the DS estimation data of the inflow path 16D, the number of straight-ahead vehicles that have passed the detection area 15D acquired in s14, and the speed of the straight-ahead vehicle that has passed the detection area 15D acquired in s15. Is used to estimate the DS of the inflow channel 16D.
- the image processor 4 determines whether or not a clogging has occurred in the outflow channels 17B and 17D (s17).
- the clogging determination unit 415 compares the representative value of the speed of the straight vehicle that has passed through the detection region 15B acquired in s15 with the speed on the QV plot with respect to the DS of the inflow path 16B estimated in s16, and acquired in s15. If the representative value of the speed of the straight traveling vehicle that has passed through the detected area 15B is faster, it is determined that the clogging has occurred in the outflow path 17B.
- the clogging determination unit 425 compares the representative value of the speed of the straight vehicle that has passed the detection region 15D acquired in s15 with the speed on the QV plot with respect to the DS of the inflow path 16D estimated in s16, and s15 If the representative value of the speed of the straight vehicle that has passed through the detection region 15D acquired in step S3 is faster, it is determined that the clogging has occurred in the outflow path 17D.
- the traffic measuring device 1 outputs the DS of the inflow channels 16B and 16D calculated in s16 and the determination result of the clogging of the outflow channels 17B and 17D determined in s17 to the signal control device (s18), and returns to s1 described above. .
- the traffic volume measuring device 1 can process the image captured in the intersection and estimate the DS of each of the inflow paths 16A to 16D. Therefore, labor and cost for maintenance management can be reduced. Further, since the traffic volume measuring apparatus 1 estimates and outputs the DS of each of the inflow paths 16A to 16D, it can be used as an apparatus for measuring the traffic volume at the intersection where the signal lamp is controlled by SCATS.
- the traffic volume measuring device 1 estimates the DS of each inflow path 16A to 16D by excluding the right turn vehicle and the left turn vehicle in which the speed varies due to pedestrians and oncoming vehicles. Can be secured sufficiently.
- the detection areas 15A to 15D may be extended in the traveling direction of the vehicle within the intersection.
- each of the detection areas 15A to 15D has an overlapping area overlapping with the other detection areas 15A to 15D.
- Each of the detection areas 15A to 15D may be set in any manner as long as it is within the imaging area of the video cameras 10 and 11. That is, the detection areas 15A to 15D can be arbitrarily set by adjusting the imaging areas of the video cameras 10 and 11.
- the DS of each inflow channel 16A to 16D may be estimated for each vehicle branch direction (straight, right turn, left turn).
- DS estimation data is stored for each inflow path 16A to 16D for each branch direction.
- the passing number acquisition units 412 and 422 acquire the number of vehicles for each branch direction, and the vehicle speed acquisition units 413 and 423 acquire the representative value of the vehicle speed for each branch direction.
- the DS estimation units 414 and 424 may estimate the DS of each of the inflow channels 16A to 16D for each branch direction (straight, right turn, left turn) of the vehicle.
Landscapes
- Physics & Mathematics (AREA)
- General Physics & Mathematics (AREA)
- Traffic Control Systems (AREA)
Abstract
画像入力部(3)には、信号灯器が設置された交差点内を撮像した撮像画像が入力される。車両追跡部(411、421)は、画像入力部(3)に入力された撮像画像を処理し、交差点内を走行する車両を追跡する。車両追跡部(411、421)における車両の追跡結果に基づき、交差点への車両の流入路別に、通過台数取得部(412、422)が交差点を通過した車両の台数を取得するとともに、車両速度取得部(413、423)が交差点を通過した車両の速度の代表値を取得する。そして、DS推定部(414、424)が、交差点への車両の流入路別に、交差点を通過した車両の台数、および車両の速度の代表値を用いてDSを推定する。
Description
この発明は、信号灯器が設置された交差点の交通量を計測する技術に関する。
従来、信号灯器が設置されている交差点(特に、渋滞が発生しやすい重要交差点)では、交通量に応じて信号制御パラメータを決定することが行われている。信号制御パラメータは、サイクル、スプリット、オフセットである。サイクルは、信号灯器の1周期の時間を決定するパラメータである。スプリットは、1サイクルにおける各現示の時間を決定するパラメータである。オフセットは、周辺の交差点に設置されている信号灯器とのサイクルの開始タイミングの時間差を決定するパラメータである。
例えば、SCATS(Sydney Coordinated AdaptiveSystem)と呼ばれる信号制御の方式がある。このSCATSは、信号制御パラメータの決定に、飽和度(DS:Degreeof Saturation)というパラメータを使用する。DSは、交差点の流入路毎に検出される。DSは、信号灯器のサイクル毎に、その流入路を走行する車両群に通行権が与えられている現示期間中に(その流入路を走行する車両群に対する信号灯器の表示が青信号である期間中に)、交差点の停止線手前に定めた車両検知領域を通過した車両の通過台数nと、この車両検知領域に車両が位置していなかった車間時間Tと、を検出することで得られる。
具体的には、車両検知領域にはループコイル式の車両検知センサが埋設されている。ループコイルは、車線毎に、その車線の停止線手前に埋設されている。車間時間Tは、このループコイル式の車両検知センサが現示期間中に車両を検出していた合計時間である。通過台数nは、現示期間中にループコイル式の車両検知センサが検知した車両の合計台数である。
DSは、以下の式から得られる。
DS=g’/g
g’=g-(T-t×n)
g’:有効青時間
t:飽和流時における1台あたりの車間時間(飽和交通流率)
飽和交通流率tは、交差点付近の道路状況等を考慮して予め設定されている値である。
g’=g-(T-t×n)
g’:有効青時間
t:飽和流時における1台あたりの車間時間(飽和交通流率)
飽和交通流率tは、交差点付近の道路状況等を考慮して予め設定されている値である。
上記式から明らかなように、車両検知領域における実際の車間時間Tが設定されている飽和交通流率tと通過台数nとの積に一致したとき、DS=1.0になる。また、非飽和状態であるときには、車両の通過台数nは少なくなるが、車間時間Tが長くなるので、DS<1.0になる(通常、非飽和の度合いが高くなるにつれて、DSが小さくなる。)。さらに、過飽和状態であるとき、車両の通過台数nは少なくなるが、車間時間Tが短くなるので、DS>1.0になる(通常、過飽和の度合いが高くなるにつれて、DSが大きくなる。)。
また、すでに、交差点内を撮像した画像を処理し、交差点内の交通量を計測することや、その計測結果を用いて信号制御パラメータを決定する信号制御の方式も提案されている(特許文献1、2等参照)。
しかしながら、特許文献1、2等に記載されている技術は、車両検知を交差点内にすることを想定したものではない。すなわち、交差点内を撮像した画像を処理し、上述のSCATSで使用するDSを得るものではなかった。したがって、特許文献1、2等に記載されている技術をSCATで使用することができなかった。
また、ループコイル式の車両検知センサは道路に埋めるので、保守管理に手間やコストがかかる。このため、保守管理にかかる手間を削減する要望がある。また、センサの選択の多様化も要望としてあり、ループコイル式の車両検知センサを、保守管理しやすいセンサ(例えば交差点内を撮像するビデオカメラ等の画像センサ)に置き換える技術の実現が求められている。
この発明の目的は、交差点の流入路の飽和度を得ることができ、保守管理にかかる手間やコストが抑えられる技術を提供することにある。
特に、交差点内を撮像した画像を処理して、交差点の流入路の飽和度を得ることができる技術を提供することにある。
この発明の交通量計測装置は、上記目的を達するために、以下のように構成している。
撮像画像入力部には、信号灯器が設置された交差点内を撮像した撮像画像が入力される。追跡部は、撮像画像入力部に入力された撮像画像を処理し、交差点内を走行する車両を追跡する。計測値取得部は、追跡部における車両の追跡結果に基づき、交差点への車両の流入路別に、交差点を通過した車両の台数、および交差点を通過した車両の速度の代表値を取得する。そして、飽和度推定部は、交差点への車両の流入路別に、計測値取得部が取得した交差点を通過した車両の台数、および車両の速度の代表値を用いて飽和度(DS:Degree of Saturation)を推定する。
一般に、非飽和時(非渋滞時)には、通過車両の台数(Q)が少なくなるにつれて、通過車両の速度の代表値(V)は大きくなる。一方で、過飽和時(渋滞時)には、通過車両の台数(Q)が少なくなるにつれて、通過車両の速度の代表値(V)は小さくなる。したがって、通過車両の台数(Q)だけでは、非飽和時であるのか、過飽和時であるのか判断できない。しかしながら、非飽和時と、過飽和時とで通過車両の速度が異なるので、通過台数に加えて通過車両の速度の代表値(V)を用いることで、非飽和状態(DS<1.0)であるか、過飽和状態(DS>1.0)であるか判断できる。したがって、通過車両の台数(Q)と、通過車両の速度の代表値(V)とを用いることで、DSを精度よく推定することができる。
この構成では、追跡部が、交差点内を撮像した画像を処理して、交差点内を走行する車両を追跡した追跡結果から、通過車両の台数(Q)、および通過車両の速度の代表値(V)を取得する構成であるので、保守管理にかかる手間やコストが抑えられる。
なお、追跡部が処理する撮像画像(すなわち、撮像画像入力部に入力される交差点内を撮像した撮像画像)は、追跡部が交差点内を走行する車両を追跡した追跡結果から、通過車両の台数(Q)、および通過車両の速度の代表値(V)が取得できる交差点内の領域が撮像されていればよく、交差点内全体が撮像されていなくてもよいし、逆に、交差点外の領域が撮像されていてもよい。
また、交差点の車両の流出路別に、その流出路が車両で詰まっている先詰まり状態であるかどうかを、飽和度推定部が推定した飽和度に基づいて判定する先詰まり判定部を備えてもよい。
また、右折車両や、左折車両は、歩行者や対向車等の影響を受けて、速度が低速になることがあるので、DSの推定に用いる通過車両の台数(Q)、および通過車両の速度の代表値(V)については、直進車両に限定するのが好ましい。
また、追跡部は、走行する車両を追跡する前記交差点内の追跡エリアを、この交差点における現示の変化に応じて切り替えることで、処理負荷を抑えることができる。
この発明によれば、交差点の流入路の飽和度を得ることができ、保守管理にかかる手間やコストが抑えられる。
以下、この発明の実施形態である交通量計測装置について説明する。
図1は、この例にかかる交通量計測装置の主要部の構成を示すブロック図である。図2は、交差点におけるビデオカメラの設置例を示す概略の平面図である。この例にかかる交通量計測装置1は、2台のビデオカメラ10、11で交差点内を撮像した画像を処理し、各流入路16A~16Dについて飽和度(DS:Degree of Saturation)を推定するとともに、各流出路17A~17Dについて先詰まりが発生しているかどうかを判定する。DSは、流入路16A~16Dが走行する車両で混雑(渋滞)している度合いを示す値である。先詰まりは、流出路17A~17Dが渋滞しており、ドライバーが交差点に進入するときに、交差点の手前で一時停止(自車の進入スペースが流出路側にあるかどうかの確認のための一時停止)する状況である。
また、図2に示すように、この例では、交差点の隣接していない2つの角にビデオカメラ10、11を設置している。一方のビデオカメラ10は、交差点内を4つに区分した検知領域15A、15Bが撮像エリアに収まるアングルで設置している。他方のビデオカメラ11は、交差点内を4つに区分した検知領域15C、15Dが撮像エリアに収まるアングルで設置している。ビデオカメラ10、11は、例えば、撮像レンズとして広角レンズを使用することで、上述の撮像エリアを確保することができる。ビデオカメラ10、11のフレームレートは、数十フレーム/sec(例えば、30フレーム/sec)である。また、ビデオカメラ10、11は、ある程度の解像度を確保するため、メガピクセル(例えば、縦×横が1300×1000程度)の撮像素子を備えたものを使用するのが好ましい。
なお、交差点の流入路16A~16Dや、流出路17A~17Dは、ビデオカメラ10、11の撮像エリアに収まっていてもよいし、収まっていなくてもよい。
また、この例は、2台のビデオカメラ10、11を交差点に設置するものであるが、設置するビデオカメラは1台であってもよい。この場合、1台のビデオカメラで検知領域15A~15D全体を撮像する。また、設置するビデオカメラを4台とし、ビデオカメラ毎に、撮像する検知領域15A~15Dを割り当ててもよい。すなわち、検知領域15A~15Dを撮像することができれば、ビデオカメラの台数は何台であってもよい。この検知領域が、この発明で言う追跡エリアに相当する。
図2に示すように、流入路16Aから交差点に進入した直進車両は、検知領域15A、15Dをこの順に通り、流出路17Aに入る。流入路16Bから交差点に進入した直進車両は、検知領域15B、15Aをこの順に通り、流出路17Bに入る。流入路16Cから交差点に進入した直進車両は、検知領域15C、15Bをこの順に通り、流出路17Cに入る。流入路16Dから交差点に進入した直進車両は、検知領域15D、15Cをこの順に通り、流出路17Dに入る。
図3は、交差点に設置されている信号灯器の表示の変化を示す図である。図3は、信号灯器の表示が青、黄、赤の順に変化する場合を例にしている。ここでは、図2おける左右方向の道路を主道路、上下方向の道路を従道路として信号灯器の表示の変化を簡単に説明する。主道路側、および従道路側の信号灯器は青、黄、赤の順に切り替わる。図3に示す、T1が、主道路の青時間(スプリット)である。また、T2は、従道路の青時間(スプリット)である。また、T0が、信号灯器のサイクルである。
また、従道路側の信号灯器は、主道路側の信号灯器が青、または黄であるとき、常に赤であり、反対に、主道路側の信号灯器は、従道路側の信号灯器が青、または黄であるとき、常に赤である。また、現示の切り換わり時に、主道路側の信号灯器、および従道路側の信号灯器がともに赤であるクリアランス時間(図3に示す、t1、t2)を設けている。
この交差点に設置されている信号灯器のサイクルやスプリットは、信号制御装置(不図示)によって決定される。具体的には、信号制御装置は、この例にかかる交通量計測装置1が推定した各流入路16A~16DのDS、および各流出路17A~17Dの先詰まり判定結果に基づき、この交差点に設置されている信号灯器のサイクルやスプリットを決定する。
この例にかかる交通量計測装置1は、図1に示すように、制御部2と、画像入力部3と、画像処理プロセッサ4と、入出力部5と、を備えている。
制御部2は、交通量計測装置1本体各部の動作を制御する。
画像入力部3には、接続されている2台のビデオカメラ10、11で撮像した交差点内のフレーム画像が入力される。画像入力部3は、入力されたフレーム画像を一時的に記憶する画像メモリを備えている。この画像入力部3が、この発明で言う撮像画像入力部に相当する。
画像処理プロセッサ4は、現示が図2における主道路の車両群であるとき(主道路側の信号灯器が青であるとき)、一方のビデオカメラ10から入力されたフレーム画像を処理して、検知領域15A内を走行する車両を追跡するとともに、他方のビデオカメラ11から入力されたフレーム画像を処理して、検知領域15C内を走行する車両を追跡する。また、画像処理プロセッサ4は、現示が図2における従道路の車両群であるとき(従道路側の信号灯器が青であるとき)、一方のビデオカメラ10から入力されたフレーム画像を処理して、検知領域15B内を走行する車両を追跡するとともに、他方のビデオカメラ11から入力されたフレーム画像を処理して、検知領域15D内を走行する車両を追跡する。
このように、画像処理プロセッサ4は、交差点に設置された現示の変化に応じて、交差点を通過する車両を追跡する検知領域15A~15Dを切り替える。
また、画像処理プロセッサ4は、各検知領域15A~15Dにおける車両の追跡結果を用いて、流入路16A~16D毎に、DSを推定する。また、画像処理プロセッサ4は、各検知領域15A~15Dにおける車両の追跡結果を用いて、流出路17A~17D毎に、先詰まりが発生しているかどうかを判定する。
この画像処理プロセッサ4が実行する処理の詳細については、後述する。この画像処理プロセッサ4が、この発明にかかる交通量計測方法を実行するコンピュータに相当する。また、この画像処理プロセッサ4が、この発明にかかる交通量計測プログラムを実行させるコンピュータに相当する。
入出力部5には、図示していない信号制御装置が接続されている。入出力部5は、画像処理プロセッサ4で推定された各流入路16A~16DのDS、および各流出路17A~17Dの先詰まり判定結果を信号制御装置に出力する。また、入出力部5には、信号制御装置から、交差点に設置されている信号灯器の表示状態を示す信号(主道路の車両が現示である期間を示す信号、および従道路の車両が現示である期間を示す信号)が入力されている。
信号制御装置は、各流入路16A~16DのDS、および各流出路17A~17Dの先詰まり判定結果に基づき、この交差点に設置されている信号灯器を制御する信号制御パラメータを決定する。信号制御パラメータは、図2に示す、サイクルT0、スプリットT1,T2を決定するものである。クリアランス時間t1、t2や、黄時間等は、予め定められている。信号制御装置は、決定した信号制御パラメータで信号灯器の表示を制御する。この信号制御装置は、例えば公知のSCATS(Sydney Coordinated Adaptive System)にかかる方式で、信号制御パラメータを決定する。
図4は、画像処理プロセッサの機能構成を示す機能ブロック図である。画像処理プロセッサ4は、第1の画像処理部41と、第2の画像処理部42と、を備えている。第1の画像処理部41は、一方のビデオカメラ10で撮像した交差点内の撮像画像を処理する。第2の画像処理部42は、他方のビデオカメラ11で撮像した交差点内の撮像画像を処理する。第1の画像処理部41と、第2の画像処理部42とは、処理する画像を撮像しているビデオカメラ10、11が異なるだけであって、機能構成については同じである。
第1の画像処理部41は、車両追跡部411と、通過台数取得部412と、車両速度取得部413と、DS推定部414と、先詰まり判定部415と、を備えている。
車両追跡部411は、信号灯器のサイクル毎に、現示が図2における主道路の車両群であるとき、一方のビデオカメラ10から画像入力部3に入力されたフレーム画像を処理し、検知領域15Aを通過する車両を追跡する。また、車両追跡部411は、現示が図2における従道路を走行する車両群であるとき、一方のビデオカメラ10から入力されたフレーム画像を処理し、検知領域15Bを通過する車両を追跡する。車両の追跡は、一方のビデオカメラ10が撮像したフレーム画像を時系列に処理して撮像されている車両を検出するとともに、その車両のID、検出時刻(フレーム画像の撮像時刻)、位置(交差点上の位置を示す座標)を対応付けたオブジェクトマップを生成することにより行える。ビデオカメラ10の撮像画像を処理し、撮像されているオブジェクト(ここでは車両)を追跡する技術については、公知であるので、詳細な説明を省略する。
通過台数取得部412は、信号灯器のサイクル毎に、車両追跡部411において生成されたオブジェクトマップを用いて、交差点を直進した車両(直進車両)の台数を取得する。すなわち、通過台数取得部412は、1サイクル中における現示が図2における主道路を走行する車両群であるとき(図3に示したT1の期間)、検知領域15Aを左右方向に通行した車両(直進車両)の台数を取得し、1サイクル中における現示が図2における従道路を走行する車両群であるとき(図3に示したT2の期間)、検知領域15Bを上下方向に通行した車両(直進車両)の台数を取得する。各車両の移動軌跡は、オブジェクトマップから得られる。
車両速度取得部413は、交差点を直進した車両の速度の代表値を算出する。この代表値は、直進車両の速度の平均値であってもよいし、中央値であってもよい。すなわち、車両速度取得部413は、1サイクル中における現示が図2における主道路を走行する車両群であるとき(図3に示したT1の期間)、検知領域15Aを左右方向に通行した直進車両の速度の代表値を算出し、1サイクル中における現示が図2における従道路を走行する車両群であるとき(図3に示したT2の期間)、検知領域15Bを上下方向に通行した直進車両の速度の代表値を算出する。各車両の速度は、その車両の移動距離を、車両追跡部411がその車両を追跡していた時間で除する(移動距離/追跡時間)ことで得られる。移動距離は、オブジェクトマップから得られる車両の移動軌跡から算出してもよいが、通常、直進車両が交差点内で蛇行することはないので、処理負荷を抑える観点から、図2における検知領域15Aの左右方向の長さと、図2における検知領域15Bの上下方向の長さとを定めておいてもよい。また、追跡時間は、その車両が最初に検出されたフレーム画像の撮像時刻と、その車両が最後に検出されたフレーム画像の撮像時刻と、の時間差である。
この通過台数取得部412、および車両速度取得部413が、この発明で言う計測値取得部に相当する。
DS推定部414は、信号灯器の1サイクル毎に、流入路16A、および流入路16BのDSを推定する。流入路16AのDSは、そのサイクルの現示が図2における主道路を走行する車両群であるときに、通過台数取得部412が取得した検知領域15Aを通行した直進車両の台数と、車両速度取得部413が取得した検知領域15Aを通行した直進車両の速度の代表値とに基づいて推定される。また、流入路16BのDSは、そのサイクルの現示が図2における従道路を走行する車両群であるときに、通過台数取得部412が取得した検知領域15Bを通行した直進車両の台数と、車両速度取得部413が取得した検知領域15Bを通行した直進車両の速度の代表値とに基づいて推定される。
青時間に交差点を通過した車両の台数と、青時間に交差点を通過した車両の速度の代表値との関係として、図5に示す関係(所謂、QVプロット)が知られている。一般に、非飽和時(非渋滞時)には、通過車両の台数(Q)が少なくなるにつれて、通過車両の速度の代表値(V)は大きくなる。一方で、過飽和時(渋滞時)には、通過車両の台数(Q)が少なくなるにつれて、通過車両の速度の代表値(V)は小さくなる。
図5に示すQVプロットは、道路の構造(上り坂や下り坂等)や周辺環境(見通しの良さ等)によって変化する。すなわち、QVプロットは、流入路毎に異なる。図5において、流入路のDSがDS=1になる点は、通過台数がピークになる点である。
また、車両の速度は、DS<1のとき、DS=1である点における車両の速度よりも速くなり、DS>1のとき、DS=1である点における車両の速度よりも遅くなる。図5に示すように、車両の速度が速くなるにつれて、流入路のDSは小さくなり、車両の速度が遅くなるにつれて、流入路のDSは大きくなる。但し、流入路のDSの値は、図5の縦軸(速度)方向に均等に変化するわけではない。
図5に実線で示すQVプロットは、流出路において先詰まりが発生していない状態である。一方、流出路において先詰まりが発生している場合、ドライバーは、交差点の手前で車を一時停車し、流出路側に自車の進入スペースがあることを確認して交差点に進入し、通過する。このため、図5に破線で示すように、交差点を通過する車両の速度は、流出路において先詰まりが発生している場合のほうが、流出路において先詰まりが発生していない場合よりも速くなる。
したがって、流入路のDSと、その流入路のQVプロットとの関係を示すデータ(以下、DS推定データと言う。)を予め設定しておくことで、青時間に交差点を通過した直進車両の台数と、青時間に交差点を通過した直進車両の速度の代表値とに基づいて、その時点における流入路のDSを推定することができる。すなわち、DS推定部414は、流入路16AのDS推定データを用いて、この流入路16AのDSを推定し、流入路16BのDS推定データを用いて、この流入路16DのDSを推定する。第1の画像処理部41は、流入路16AのDS推定データ、および流入路16BのDS推定データを図示していないメモリに記憶している。
DS推定部414に設けられている、通過車両の台数(Q)および通過車両の速度の代表値(V)の入力を受け付ける構成が、この発明で言う計測値入力部に相当する。
先詰まり判定部415は、信号灯器の1サイクル毎に、流出路17A、および流出路17Bについて先詰まりが発生しているかどうかを判定する。先詰まり判定部415は、そのサイクルにおいて、図3に示したT1の期間に検知領域15Aを左右方向に通行した車両の速度の代表値が、DS推定部414が推定した流入路16AのDSに対するQVプロット上の速度よりも速ければ、流出路17Aにおいて先詰まりが発生していると判定する。言い換えれば、先詰まり判定部415は、そのサイクルにおいて、図3に示したT1の期間に検知領域15Aを左右方向に通行した車両の速度の代表値が、DS推定部414が推定した流入路16AのDSに対するQVプロット上の速度以下であれば、流出路17Aにおいて先詰まりが発生していないと判定する。また、先詰まり判定部415は、そのサイクルにおいて、図3に示したT2の期間に検知領域15Bを上下方向に通行した車両の速度の代表値が、DS推定部414が推定した流入路16BのDSに対するQVプロット上の速度よりも速ければ、流出路17Bにおいて先詰まりが発生していると判定する。
また、第2の画像処理部42は、車両追跡部421と、通過台数取得部422と、車両速度取得部423と、DS推定部424と、先詰まり判定部425と、を備えている。車両追跡部421、通過台数取得部422、車両速度取得部423、DS推定部424、および先詰まり判定部425は、それぞれ、第1の画像処理部41が備える、上述した車両追跡部411、通過台数取得部412、車両速度取得部413、DS推定部414、および先詰まり判定部415と同じである。
但し、第2の画像処理部42は、流入路16CのDS推定データ、および流入路16DのDS推定データを図示していないメモリに記憶している。また、第2の画像処理部42は、現示が図2における主道路の車両群であるとき検知領域15Cを左右方向に通行した車両(直進車両)の台数、および車両速度の代表値を取得し、流入路16CのDSを推定するとともに、流出路17Cが先詰まり状態であるかどうかを判定する。また、第2の画像処理部42は、現示が図2における従道路の車両群であるとき検知領域15Dを上下方向に通行した車両(直進車両)の台数、および車両速度の代表値を取得し、流入路16DのDSを推定するとともに、流出路17Dが先詰まり状態であるかどうかを判定する。
以下、この例にかかる交通量計測装置1の動作について説明する。図6。および図7は、交通量計測装置の動作を示すフローチャートである。
交通量計測装置1には、信号制御装置から交差点に設置されている信号灯器の表示状態を示す信号が入出力部5に入力されている。また、交差点に設置されているビデオカメラ10、11が撮像した交差点内の撮像画像が画像入力部3に入力されている。
交通量計測装置1は、図2における主道路側の現示開始タイミング(主道路側の青信号開始タイミング)になると(s1)、第1の追跡処理を開始する(s2)。s2にかかる第1の追跡処理は、車両追跡部411がビデオカメラ10で撮像した交差点内の画像を処理し、検知領域15Aを通過した車両を追跡する処理、および車両追跡部421がビデオカメラ11で撮像した交差点内の画像を処理し、検知領域15Cを通過した車両を追跡する処理である。画像処理プロセッサ4は、図2における主道路側の現示終了タイミング(主道路側の青信号終了タイミング)になると(s3)、s2で開始した第1の追跡処理を終了する(s4)。
画像処理プロセッサ4は、車両追跡部411、421で実行した車両の追跡結果に基づき、検知領域15A、15Cを通過した直進車両の台数を取得する(s5)。通過台数取得部412が、検知領域15Aを通過した直進車両の台数を取得する。また、通過台数取得部422が、検知領域15Cを通過した直進車両の台数を取得する。
また、画像処理プロセッサ4は、車両追跡部411、421で実行した車両の追跡結果に基づき、検知領域15A、15Cを通過した直進車両の速度の代表値を取得する(s6)。車両速度取得部413が、検知領域15Aを通過した直進車両の速度の代表値を取得する。また、車両速度取得部423が、検知領域15Cを通過した直進車両の速度の代表値を取得する。直進車両の速度の代表値は、直進車両の速度の平均値であってもよいし、中央値であってもよい。
画像処理プロセッサ4は、流入路16A、16CのDSを推定する(s7)。DS推定部414が、記憶している流入路16AのDS推定データ、s5で取得した検知領域15Aを通過した直進車両の台数、およびs6で取得した検知領域15Aを通過した直進車両の速度の代表値を用いて、この流入路16AのDSを推定する。また、DS推定部424が、記憶している流入路16CのDS推定データ、s5で取得した検知領域15Cを通過した直進車両の台数、およびs6で取得した検知領域15Cを通過した直進車両の速度の代表値を用いて、この流入路16CのDSを推定する。
また、画像処理プロセッサ4は、流出路17A、17Cについて先詰まりが発生しているかどうかを判定する(s8)。先詰まり判定部415は、s6で取得した検知領域15Aを通過した直進車両の速度の代表値と、s7で算出した流入路16AのDSに対するQVプロット上の速度と、を比較し、s6で取得した検知領域15Aを通過した直進車両の速度の代表値のほうが速ければ、流出路17Aにおいて先詰まりが発生していると判定する。また、先詰まり判定部425は、s6で取得した検知領域15Cを通過した直進車両の速度の代表値と、s7で算出した流入路16CのDSに対するQVプロット上の速度と、を比較し、s6で取得した検知領域15Cを通過した直進車両の速度の代表値のほうが速ければ、流出路17Cにおいて先詰まりが発生していると判定する。
交通量計測装置1は、s7で推定した流入路16A、16CのDS、およびs8で判定した流出路17A、17Cの先詰まり判定結果を信号制御装置に出力する(s9)。
交通量計測装置1は、図2における従道路側の現示開始タイミング(従道路側の青信号開始タイミング)になると(s10)、第2の追跡処理を開始する(s11)。s11にかかる第2の追跡処理は、車両追跡部411がビデオカメラ10で撮像した交差点内の画像を処理し、検知領域15Bを通過した車両を追跡する処理、および車両追跡部421がビデオカメラ11で撮像した交差点内の画像を処理し、検知領域15Dを通過した車両を追跡する処理である。画像処理プロセッサ4は、図2における従道路側の現示終了タイミング(従道路側の青信号終了タイミング)になると(s12)、s11で開始した第2の追跡処理を終了する(s13)。
画像処理プロセッサ4は、車両追跡部411、421で実行した車両の追跡結果に基づき、検知領域15B、15Dを通過した直進車両の台数を取得する(s14)。通過台数取得部412が、検知領域15Bを通過した直進車両の台数を取得する。また、通過台数取得部422が、検知領域15Dを通過した直進車両の台数を取得する。
また、画像処理プロセッサ4は、車両追跡部411、421で実行した車両の追跡結果に基づき、検知領域15B、15Dを通過した直進車両の速度の代表値を取得する(s15)。車両速度取得部413が、検知領域15Bを通過した直進車両の速度の代表値を取得する。また、車両速度取得部423が、検知領域15Dを通過した直進車両の速度の代表値を取得する。直進車両の速度の代表値は、直進車両の速度の平均値であってもよいし、中央値であってもよい。
画像処理プロセッサ4は、流入路16B、16DのDSを推定する(s16)。DS推定部414が、記憶している流入路16BのDS推定データ、s14で取得した検知領域15Bを通過した直進車両の台数、およびs15で取得した検知領域15Bを通過した直進車両の速度の代表値を用いて、この流入路16BのDSを推定する。また、DS推定部424が、記憶している流入路16DのDS推定データ、s14で取得した検知領域15Dを通過した直進車両の台数、およびs15で取得した検知領域15Dを通過した直進車両の速度の代表値を用いて、この流入路16DのDSを推定する。
また、画像処理プロセッサ4は、流出路17B、17Dについて先詰まりが発生しているかどうかを判定する(s17)。先詰まり判定部415は、s15で取得した検知領域15Bを通過した直進車両の速度の代表値と、s16で推定した流入路16BのDSに対するQVプロット上の速度と、を比較し、s15で取得した検知領域15Bを通過した直進車両の速度の代表値のほうが速ければ、流出路17Bにおいて先詰まりが発生していると判定する。また、先詰まり判定部425は、s15で取得した検知領域15Dを通過した直進車両の速度の代表値と、s16で推定した流入路16DのDSに対するQVプロット上の速度と、を比較し、s15で取得した検知領域15Dを通過した直進車両の速度の代表値のほうが速ければ、流出路17Dにおいて先詰まりが発生していると判定する。
交通量計測装置1は、s16で算出した流入路16B、16DのDS、およびs17で判定した流出路17B、17Dの先詰まり判定結果を信号制御装置に出力し(s18)、上述したs1に戻る。
このように、この例にかかる交通量計測装置1は、交差点内を撮像した画像を処理し、各流入路16A~16DのDSを推定することができる。したがって、保守管理にかかる手間やコストが抑えられる。また、この交通量計測装置1は、各流入路16A~16DのDSを推定し、出力するので、SCATSで信号灯器を制御している交差点の交通量を計測する装置として利用できる。
また、各流出路17A~17Dの状態をセンシングすることなく、先詰まりが発生しているかどうかを判定することができる。
また、この例にかかる交通量計測装置1は、歩行者や対向車等によって速度にばらつきが生じる右折車両や左折車両を除外して、各流入路16A~16DのDSを推定するので、その制度を十分に確保することができる。
なお、交差点を通過した車両の速度の検出精度は、その車両の走行方向の距離が長くなるにつれて高くなる。したがって、図8に示すように、交差点内において、各検知領域15A~15Dを車両の走行方向に延ばしてもよい。この場合、各検知領域15A~15Dは、図8に示すように、他の検知領域15A~15Dと重なる重複領域を有することになる。各検知領域15A~15Dは、ビデオカメラ10、11の撮像エリア内であれば、どのように設定してもよい。すなわち、検知領域15A~15Dは、ビデオカメラ10、11の撮像エリアを調整することによって、任意に設定できる。
また、各流入路16A~16DのDSを車両の分岐方向別(直進、右折、左折別)に推定してもよい。この場合、各流入路16A~16Dについて、分岐方向別にDS推定データを記憶する。また、通過台数取得部412、422は、分岐方向別に車両の台数を取得し、車両速度取得部413、423は、分岐方向別に車両の速度の代表値を取得する。そして、DS推定部414、424において、各流入路16A~16DのDSを車両の分岐方向別(直進、右折、左折別)に推定してもよい。
1…交通量計測装置
2…制御部
3…画像入力部
4…画像処理プロセッサ
5…入出力部
10、11…ビデオカメラ
15A~15D検知領域
16A~16D流入路
17A~17D…流出路
41…第1の画像処理部
42…第2の画像処理部
411、421…車両追跡部
412、422…通過台数取得部
413、423…車両速度取得部
414、424…DS推定部
415、425…先詰まり判定部
2…制御部
3…画像入力部
4…画像処理プロセッサ
5…入出力部
10、11…ビデオカメラ
15A~15D検知領域
16A~16D流入路
17A~17D…流出路
41…第1の画像処理部
42…第2の画像処理部
411、421…車両追跡部
412、422…通過台数取得部
413、423…車両速度取得部
414、424…DS推定部
415、425…先詰まり判定部
Claims (10)
- 信号灯器が設置された交差点内を撮像した撮像画像が入力される撮像画像入力部と、
前記撮像画像入力部に入力された撮像画像を処理し、前記交差点内を走行する車両を追跡する追跡部と、
前記追跡部における車両の追跡結果に基づき、前記交差点への車両の流入路別に、前記交差点を通過した車両の台数、および前記交差点を通過した車両の速度の代表値を取得する計測値取得部と、
前記交差点への車両の流入路別に、前記計測値取得部が取得した前記交差点を通過した車両の台数、および車両の速度の代表値を用いて飽和度を推定する飽和度推定部と、を備えた交通量計測装置。 - 前記交差点の車両の流出路別に、その流出路が車両で詰まっている先詰まり状態であるかどうかを、前記飽和度推定部が推定した飽和度に基づいて判定する先詰まり判定部を備えた請求項1に記載の交通量計測装置。
- 前記計測値取得部は、前記交差点への車両の流入路別に、前記交差点内を直進で通過した車両の台数、および前記交差点を直進で通過した車両の速度の代表値を取得し、
前記飽和度推定部は、前記交差点への車両の流入路別に、前記計測値取得部が取得した前記交差点を直進で通過した車両の台数、および前記交差点を直進で通過した車両の速度の代表値を用いて飽和度を推定する、請求項1、または2に記載の交通量計測装置。 - 前記追跡部は、走行する車両を追跡する前記交差点内の追跡エリアを、この交差点における現示の変化に応じて切り替える、請求項1~3のいずれかに記載の交通量計測装置。
- 前記計測値取得部は、前記交差点への車両の流入路別に、前記交差点を通過した車両の速度の平均値を代表値として取得する、請求項1~4のいずれかに記載の交通量計測装置。
- 信号灯器が設置された交差点内への車両の流入路別に、前記交差点を通過した車両の台数、および前記交差点を通過した車両の速度の代表値が計測値として入力される計測値入力部と、
前記交差点への車両の流入路別に、前記計測値入力部に入力された前記交差点を通過した車両の台数、および車両の速度の代表値を用いて飽和度を推定する飽和度推定部と、を備えた交通量計測装置。 - 撮像画像入力部に入力された、信号灯器が設置された交差点内を撮像した撮像画像を処理し、前記交差点内を走行する車両を追跡する追跡ステップと、
前記追跡ステップによる車両の追跡結果に基づき、前記交差点への車両の流入路別に、前記交差点を通過した車両の台数、および前記交差点を通過した車両の速度の代表値を取得する計測値取得ステップと、
前記交差点への車両の流入路別に、前記計測値取得ステップで取得した前記交差点を通過した車両の台数、および車両の速度の代表値を用いて飽和度を推定する飽和度推定ステップと、をコンピュータが実行する交通量計測方法。 - 信号灯器が設置された交差点内への車両の流入路別に、前記交差点を通過した車両の台数、および前記交差点を通過した車両の速度の代表値を計測値として計測値入力部に入力する計測値入力ステップと、
前記交差点への車両の流入路別に、前記計測値入力部に入力された前記交差点を通過した車両の台数、および車両の速度の代表値を用いて飽和度を推定する飽和度推定ステップと、をコンピュータが実行する交通量計測方法。 - 撮像画像入力部に入力された、信号灯器が設置された交差点内を撮像した撮像画像を処理し、前記交差点内を走行する車両を追跡する追跡ステップと、
前記追跡ステップによる車両の追跡結果に基づき、前記交差点への車両の流入路別に、前記交差点を通過した車両の台数、および前記交差点を通過した車両の速度の代表値を取得する計測値取得ステップと、
前記交差点への車両の流入路別に、前記計測値取得ステップで取得した前記交差点を通過した車両の台数、および車両の速度の代表値を用いて飽和度を推定する飽和度推定ステップと、をコンピュータに実行させる交通量計測プログラム。 - 信号灯器が設置された交差点内への車両の流入路別に、前記交差点を通過した車両の台数、および前記交差点を通過した車両の速度の代表値を計測値として計測値入力部に入力する計測値入力ステップと、
前記交差点への車両の流入路別に、前記計測値入力部に入力された前記交差点を通過した車両の台数、および車両の速度の代表値を用いて飽和度を推定する飽和度推定ステップと、をコンピュータに実行させる交通量計測プログラム。
Applications Claiming Priority (2)
| Application Number | Priority Date | Filing Date | Title |
|---|---|---|---|
| JP2014-144662 | 2014-07-15 | ||
| JP2014144662A JP6379774B2 (ja) | 2014-07-15 | 2014-07-15 | 交通量計測装置、交通量計測方法、および交通量計測プログラム |
Publications (1)
| Publication Number | Publication Date |
|---|---|
| WO2016009662A1 true WO2016009662A1 (ja) | 2016-01-21 |
Family
ID=55078168
Family Applications (1)
| Application Number | Title | Priority Date | Filing Date |
|---|---|---|---|
| PCT/JP2015/052903 Ceased WO2016009662A1 (ja) | 2014-07-15 | 2015-02-03 | 交通量計測装置、交通量計測方法、および交通量計測プログラム |
Country Status (2)
| Country | Link |
|---|---|
| JP (1) | JP6379774B2 (ja) |
| WO (1) | WO2016009662A1 (ja) |
Cited By (2)
| Publication number | Priority date | Publication date | Assignee | Title |
|---|---|---|---|---|
| CN108280999A (zh) * | 2018-01-31 | 2018-07-13 | 迈锐数据(北京)有限公司 | 一种交通饱和度判定系统、方法及装置 |
| US11565193B2 (en) * | 2017-04-11 | 2023-01-31 | Shimadzu Corporation | Component extraction apparatus |
Families Citing this family (3)
| Publication number | Priority date | Publication date | Assignee | Title |
|---|---|---|---|---|
| CN108734967B (zh) * | 2017-04-20 | 2021-09-28 | 杭州海康威视数字技术股份有限公司 | 违章车辆监控方法、装置及系统 |
| JP6849973B2 (ja) * | 2018-03-08 | 2021-03-31 | Necプラットフォームズ株式会社 | 交通信号制御装置、交通信号制御方法、および交通信号制御プログラム |
| JP7071019B2 (ja) * | 2021-03-05 | 2022-05-18 | Necプラットフォームズ株式会社 | 交通信号制御装置、交通信号制御方法、および交通信号制御プログラム |
Citations (3)
| Publication number | Priority date | Publication date | Assignee | Title |
|---|---|---|---|---|
| JPH04211900A (ja) * | 1990-04-27 | 1992-08-03 | Hitachi Ltd | 交通流計測装置及び交通流計測制御装置 |
| JPH04352300A (ja) * | 1991-05-30 | 1992-12-07 | Matsushita Electric Ind Co Ltd | 車両動態計測装置 |
| JP2013080445A (ja) * | 2011-10-05 | 2013-05-02 | Sumitomo Electric Ind Ltd | 先詰判定装置、コンピュータプログラム及び先詰判定方法 |
-
2014
- 2014-07-15 JP JP2014144662A patent/JP6379774B2/ja active Active
-
2015
- 2015-02-03 WO PCT/JP2015/052903 patent/WO2016009662A1/ja not_active Ceased
Patent Citations (3)
| Publication number | Priority date | Publication date | Assignee | Title |
|---|---|---|---|---|
| JPH04211900A (ja) * | 1990-04-27 | 1992-08-03 | Hitachi Ltd | 交通流計測装置及び交通流計測制御装置 |
| JPH04352300A (ja) * | 1991-05-30 | 1992-12-07 | Matsushita Electric Ind Co Ltd | 車両動態計測装置 |
| JP2013080445A (ja) * | 2011-10-05 | 2013-05-02 | Sumitomo Electric Ind Ltd | 先詰判定装置、コンピュータプログラム及び先詰判定方法 |
Non-Patent Citations (1)
| Title |
|---|
| SHUNSUKE KAMIJO ET AL.: "Kotsuryu no Seimitsu Keisoku Gazo Shori Gijutsu ni yoru Kotsuryu Keisoku no Koseidoka Tei Cost-ka", IMAGE LAB, vol. 14, no. 1, 2003, pages 6 - 8 * |
Cited By (2)
| Publication number | Priority date | Publication date | Assignee | Title |
|---|---|---|---|---|
| US11565193B2 (en) * | 2017-04-11 | 2023-01-31 | Shimadzu Corporation | Component extraction apparatus |
| CN108280999A (zh) * | 2018-01-31 | 2018-07-13 | 迈锐数据(北京)有限公司 | 一种交通饱和度判定系统、方法及装置 |
Also Published As
| Publication number | Publication date |
|---|---|
| JP2016021158A (ja) | 2016-02-04 |
| JP6379774B2 (ja) | 2018-08-29 |
Similar Documents
| Publication | Publication Date | Title |
|---|---|---|
| KR101988811B1 (ko) | 신호기 인식 장치 및 신호기 인식 방법 | |
| KR101942214B1 (ko) | 신호기 검출 장치 및 신호기 검출 방법 | |
| US10671859B2 (en) | Travel assistance device and travel assistance method using travel assistance device | |
| JP4603970B2 (ja) | 道路区画線検出装置 | |
| JP6379774B2 (ja) | 交通量計測装置、交通量計測方法、および交通量計測プログラム | |
| US10964217B2 (en) | Travel control method and travel control apparatus | |
| JP4962581B2 (ja) | 区画線検出装置 | |
| JP5375814B2 (ja) | 露出制御装置 | |
| US11468691B2 (en) | Traveling lane recognition apparatus and traveling lane recognition method | |
| JP6154213B2 (ja) | 路面情報取得装置 | |
| JP6492295B2 (ja) | 速度取締システム及び速度取締方法 | |
| JP7261588B2 (ja) | 信号機認識方法及び信号機認識装置 | |
| CN115214667B (zh) | 车辆控制装置、存储介质以及车辆控制方法 | |
| KR101227341B1 (ko) | 스트레오 카메라를 이용한 법규 위반 차량 단속 시스템 및 방법 | |
| JP2004355293A (ja) | 信号制御装置および方法 | |
| JP2002288786A (ja) | 広域渋滞判定方法、広域渋滞判定システム及び判定装置 | |
| CN112634653B (zh) | 图像处理设备 | |
| JP2016095663A (ja) | 滞留台数計測装置、信号制御システム、滞留台数計測方法、および滞留台数計測プログラム | |
| JP6941677B2 (ja) | 画像認識装置 | |
| JP2010018223A (ja) | 車両用走行路面検出装置 | |
| JP3875889B2 (ja) | 画像式速度検知システム及び画像式速度検知方法 | |
| JP6439571B2 (ja) | 交通情報収集装置、交通情報収集方法、および交通情報収集プログラム | |
| KR20180097197A (ko) | 어안 렌즈 카메라를 이용한 차량 속력 측정 시스템 및 방법 | |
| JP2008199166A (ja) | 温度ドリフト補正装置及びその方法 |
Legal Events
| Date | Code | Title | Description |
|---|---|---|---|
| 121 | Ep: the epo has been informed by wipo that ep was designated in this application |
Ref document number: 15821382 Country of ref document: EP Kind code of ref document: A1 |
|
| NENP | Non-entry into the national phase |
Ref country code: DE |
|
| 122 | Ep: pct application non-entry in european phase |
Ref document number: 15821382 Country of ref document: EP Kind code of ref document: A1 |