WO2015045703A1 - 内視鏡システム及びプロセッサ装置並びに作動方法並びに距離測定装置 - Google Patents
内視鏡システム及びプロセッサ装置並びに作動方法並びに距離測定装置 Download PDFInfo
- Publication number
- WO2015045703A1 WO2015045703A1 PCT/JP2014/072186 JP2014072186W WO2015045703A1 WO 2015045703 A1 WO2015045703 A1 WO 2015045703A1 JP 2014072186 W JP2014072186 W JP 2014072186W WO 2015045703 A1 WO2015045703 A1 WO 2015045703A1
- Authority
- WO
- WIPO (PCT)
- Prior art keywords
- specimen
- observation distance
- image
- image signal
- observation
- Prior art date
Links
Images


Classifications
-
- A—HUMAN NECESSITIES
- A61—MEDICAL OR VETERINARY SCIENCE; HYGIENE
- A61B—DIAGNOSIS; SURGERY; IDENTIFICATION
- A61B1/00—Instruments for performing medical examinations of the interior of cavities or tubes of the body by visual or photographical inspection, e.g. endoscopes; Illuminating arrangements therefor
- A61B1/04—Instruments for performing medical examinations of the interior of cavities or tubes of the body by visual or photographical inspection, e.g. endoscopes; Illuminating arrangements therefor combined with photographic or television appliances
- A61B1/043—Instruments for performing medical examinations of the interior of cavities or tubes of the body by visual or photographical inspection, e.g. endoscopes; Illuminating arrangements therefor combined with photographic or television appliances for fluorescence imaging
-
- A—HUMAN NECESSITIES
- A61—MEDICAL OR VETERINARY SCIENCE; HYGIENE
- A61B—DIAGNOSIS; SURGERY; IDENTIFICATION
- A61B1/00—Instruments for performing medical examinations of the interior of cavities or tubes of the body by visual or photographical inspection, e.g. endoscopes; Illuminating arrangements therefor
- A61B1/00002—Operational features of endoscopes
- A61B1/00004—Operational features of endoscopes characterised by electronic signal processing
- A61B1/00009—Operational features of endoscopes characterised by electronic signal processing of image signals during a use of endoscope
- A61B1/000094—Operational features of endoscopes characterised by electronic signal processing of image signals during a use of endoscope extracting biological structures
-
- A—HUMAN NECESSITIES
- A61—MEDICAL OR VETERINARY SCIENCE; HYGIENE
- A61B—DIAGNOSIS; SURGERY; IDENTIFICATION
- A61B1/00—Instruments for performing medical examinations of the interior of cavities or tubes of the body by visual or photographical inspection, e.g. endoscopes; Illuminating arrangements therefor
- A61B1/06—Instruments for performing medical examinations of the interior of cavities or tubes of the body by visual or photographical inspection, e.g. endoscopes; Illuminating arrangements therefor with illuminating arrangements
- A61B1/0638—Instruments for performing medical examinations of the interior of cavities or tubes of the body by visual or photographical inspection, e.g. endoscopes; Illuminating arrangements therefor with illuminating arrangements providing two or more wavelengths
-
- A—HUMAN NECESSITIES
- A61—MEDICAL OR VETERINARY SCIENCE; HYGIENE
- A61B—DIAGNOSIS; SURGERY; IDENTIFICATION
- A61B1/00—Instruments for performing medical examinations of the interior of cavities or tubes of the body by visual or photographical inspection, e.g. endoscopes; Illuminating arrangements therefor
- A61B1/06—Instruments for performing medical examinations of the interior of cavities or tubes of the body by visual or photographical inspection, e.g. endoscopes; Illuminating arrangements therefor with illuminating arrangements
- A61B1/0661—Endoscope light sources
- A61B1/0684—Endoscope light sources using light emitting diodes [LED]
-
- A—HUMAN NECESSITIES
- A61—MEDICAL OR VETERINARY SCIENCE; HYGIENE
- A61B—DIAGNOSIS; SURGERY; IDENTIFICATION
- A61B1/00—Instruments for performing medical examinations of the interior of cavities or tubes of the body by visual or photographical inspection, e.g. endoscopes; Illuminating arrangements therefor
- A61B1/313—Instruments for performing medical examinations of the interior of cavities or tubes of the body by visual or photographical inspection, e.g. endoscopes; Illuminating arrangements therefor for introducing through surgical openings, e.g. laparoscopes
- A61B1/3137—Instruments for performing medical examinations of the interior of cavities or tubes of the body by visual or photographical inspection, e.g. endoscopes; Illuminating arrangements therefor for introducing through surgical openings, e.g. laparoscopes for examination of the interior of blood vessels
-
- A—HUMAN NECESSITIES
- A61—MEDICAL OR VETERINARY SCIENCE; HYGIENE
- A61B—DIAGNOSIS; SURGERY; IDENTIFICATION
- A61B5/00—Measuring for diagnostic purposes; Identification of persons
- A61B5/145—Measuring characteristics of blood in vivo, e.g. gas concentration, pH value; Measuring characteristics of body fluids or tissues, e.g. interstitial fluid, cerebral tissue
- A61B5/1455—Measuring characteristics of blood in vivo, e.g. gas concentration, pH value; Measuring characteristics of body fluids or tissues, e.g. interstitial fluid, cerebral tissue using optical sensors, e.g. spectral photometrical oximeters
- A61B5/1459—Measuring characteristics of blood in vivo, e.g. gas concentration, pH value; Measuring characteristics of body fluids or tissues, e.g. interstitial fluid, cerebral tissue using optical sensors, e.g. spectral photometrical oximeters invasive, e.g. introduced into the body by a catheter
-
- A—HUMAN NECESSITIES
- A61—MEDICAL OR VETERINARY SCIENCE; HYGIENE
- A61B—DIAGNOSIS; SURGERY; IDENTIFICATION
- A61B1/00—Instruments for performing medical examinations of the interior of cavities or tubes of the body by visual or photographical inspection, e.g. endoscopes; Illuminating arrangements therefor
- A61B1/06—Instruments for performing medical examinations of the interior of cavities or tubes of the body by visual or photographical inspection, e.g. endoscopes; Illuminating arrangements therefor with illuminating arrangements
- A61B1/0653—Instruments for performing medical examinations of the interior of cavities or tubes of the body by visual or photographical inspection, e.g. endoscopes; Illuminating arrangements therefor with illuminating arrangements with wavelength conversion
-
- A—HUMAN NECESSITIES
- A61—MEDICAL OR VETERINARY SCIENCE; HYGIENE
- A61B—DIAGNOSIS; SURGERY; IDENTIFICATION
- A61B5/00—Measuring for diagnostic purposes; Identification of persons
- A61B5/145—Measuring characteristics of blood in vivo, e.g. gas concentration, pH value; Measuring characteristics of body fluids or tissues, e.g. interstitial fluid, cerebral tissue
- A61B5/14546—Measuring characteristics of blood in vivo, e.g. gas concentration, pH value; Measuring characteristics of body fluids or tissues, e.g. interstitial fluid, cerebral tissue for measuring analytes not otherwise provided for, e.g. ions, cytochromes
-
- A—HUMAN NECESSITIES
- A61—MEDICAL OR VETERINARY SCIENCE; HYGIENE
- A61B—DIAGNOSIS; SURGERY; IDENTIFICATION
- A61B5/00—Measuring for diagnostic purposes; Identification of persons
- A61B5/145—Measuring characteristics of blood in vivo, e.g. gas concentration, pH value; Measuring characteristics of body fluids or tissues, e.g. interstitial fluid, cerebral tissue
- A61B5/1455—Measuring characteristics of blood in vivo, e.g. gas concentration, pH value; Measuring characteristics of body fluids or tissues, e.g. interstitial fluid, cerebral tissue using optical sensors, e.g. spectral photometrical oximeters
- A61B5/14551—Measuring characteristics of blood in vivo, e.g. gas concentration, pH value; Measuring characteristics of body fluids or tissues, e.g. interstitial fluid, cerebral tissue using optical sensors, e.g. spectral photometrical oximeters for measuring blood gases
- A61B5/14556—Measuring characteristics of blood in vivo, e.g. gas concentration, pH value; Measuring characteristics of body fluids or tissues, e.g. interstitial fluid, cerebral tissue using optical sensors, e.g. spectral photometrical oximeters for measuring blood gases by fluorescence
Definitions
- the present invention relates to an endoscope system, a processor device, an operation method, and a distance measuring device for observing the inside of a specimen.
- An endoscope system includes, for example, a light source device that generates light for irradiating a sample, an endoscope that images the sample, and a processor device that processes an image signal obtained by imaging the sample. .
- observation distance the distance between the specimen and the distal end of the endoscope (hereinafter referred to as observation distance) for various reasons.
- observation distance the distance between the specimen and the distal end of the endoscope.
- an interferometer is provided in the endoscope and the observation distance is measured by the interferometer in order to prevent the specimen from being damaged by the contact of the tip. .
- Patent Document 1 when an interferometer for measuring the observation distance is provided, there is a problem that the cost increases.
- the endoscope system of Patent Document 1 although the insertion portion of the endoscope is difficult to increase in diameter, a space for arranging a member that forms an interferometer is required. Since the internal space of each part is pressed, the degree of freedom in design is reduced. For example, when an interferometer for measuring the observation distance is provided, it is difficult to reduce the size and the space as compared to the case without the interferometer.
- An object of the present invention is to provide an endoscope system, a processor device, an operating method, and a distance measuring device capable of measuring an observation distance without adding an interferometer or the like.
- the endoscope system of the present invention includes a light source device, an endoscope, and an observation distance measuring unit.
- the light source device irradiates the specimen with signal light having a wavelength band absorbed by hemoglobin contained in the specimen.
- the endoscope has an image sensor that receives a reflected light of a signal light to capture an image of a specimen and output an image signal.
- the observation distance measuring unit measures the observation distance based on the image signal.
- the observation distance measuring unit includes a first measurement mode for measuring the observation distance when there is no non-hemoglobin substance that changes the reflection amount of signal light from the specimen, and a non-hemoglobin substance is present.
- the second measurement mode for measuring the observation distance can be switched, and the observation distance is preferably calculated in either the first measurement mode or the second measurement mode.
- the observation distance measurement unit includes a frequency component information extraction unit that extracts frequency component information from the image signal, and an observation distance calculation unit that calculates the observation distance based on the frequency component information of the image signal.
- the frequency component information is, for example, the amplitude of a specific frequency component.
- the observation distance calculation unit calculates, for example, the difference between the amplitudes extracted for two image signals having different wavelength bands (colors such as R, G, and B). Based on this, the observation distance is calculated.
- the specific frequency component is information regarding the frequency component corresponding to the surface blood vessel of the specimen.
- the observation distance calculation unit for example, includes a first distance table that associates frequency component information when there is no non-hemoglobin substance with an observation distance, and a second distance table that associates frequency component information when there is a non-hemoglobin substance. Have. Then, the observation distance is calculated using the first distance table in the first measurement mode and using the second distance table in the second measurement mode.
- the observation distance calculation unit may calculate the observation distance using a function that associates the frequency component information with the observation distance.
- the first distance calculation function for the first measurement mode and the second distance calculation function for the second measurement mode are provided as functions that associate the frequency component information with the observation distance.
- a non-hemoglobin substance input unit for inputting non-hemoglobin substance may be provided.
- the non-hemoglobin substance input part is, for example, a forceps channel.
- the non-hemoglobin substance is a coloring agent for coloring the specimen and / or a cleaning agent for washing the inside of the specimen.
- the colorant includes, for example, at least one of indigo carmine, toluidine blue, methylene blue, compound iodoglycerin, crystal violet, fluorestin, acridine orange, indocyanine green, and acetic acid.
- the non-hemoglobin substance may be a residue remaining in the specimen and / or a secretion secreted by the specimen.
- the observation distance is the distance between the tip of the endoscope and the specimen.
- the observation distance is an enlargement ratio of the image by the zoom lens. It is a distance based on.
- the observation distance calculation unit divides the image signal into a plurality of areas and calculates the observation distance for each area.
- the light source device irradiates the specimen with the first signal light and the second signal light having different wavelength bands as the signal light
- the image sensor reflects the reflected light of the first signal light and the second signal light.
- the specimen is imaged by receiving reflected light of the light, and the first image signal and the second image signal are output. Based on the signal ratio of the first image signal and the second image signal output from the same pixel.
- An oxygen saturation calculation unit that calculates the oxygen saturation of the sample for each pixel, a correction unit that corrects the oxygen saturation based on the observation distance, and an oxygen saturation of the sample based on the oxygen saturation corrected by the correction unit It is preferable to further include an image generation unit that generates an oxygen saturation image representing the degree.
- the processor device of the present invention includes a light source device that irradiates a sample with signal light having a wavelength band that is absorbed by hemoglobin contained in the sample, and receives the reflected light of the signal light to capture the sample and output an image signal.
- a light source device that irradiates a sample with signal light having a wavelength band that is absorbed by hemoglobin contained in the sample, and receives the reflected light of the signal light to capture the sample and output an image signal.
- an endoscope system processor having an image sensor that includes an observation distance measuring unit. The observation distance measuring unit measures the observation distance of the specimen by the endoscope based on the image signal.
- the operating method of the present invention includes a light source device that irradiates a specimen with signal light having a wavelength band that is absorbed by hemoglobin contained in the specimen, and captures the specimen by receiving reflected light of the signal light and outputs an image signal.
- An endoscope having an image sensor, and an observation distance measuring step of measuring an observation distance of a specimen by the endoscope based on an image signal.
- the distance measuring device of the present invention includes a light source device, an image sensor, and an observation distance measuring unit.
- the light source device irradiates the specimen with signal light having a wavelength band absorbed by hemoglobin contained in the specimen.
- the image sensor receives the reflected light of the signal light, images the sample, and outputs an image signal.
- the observation distance measuring unit measures the observation distance of the specimen based on the image signal.
- the endoscope system, the processor device, the operating method, and the distance measuring device of the present invention measure the observation distance based on the image signal output from the image sensor, the observation distance is measured without adding an interferometer or the like. Can do. For this reason, it is low-cost and the freedom degree of design does not fall.
- the endoscope system 10 includes an endoscope 12, a light source device 14, a processor device 16, a monitor 18, and a console 20.
- the endoscope 12 is optically connected to the light source device 14 and electrically connected to the processor device 16.
- the endoscope 12 includes an insertion portion 21 to be inserted into a specimen, an operation portion 22 provided at a proximal end portion of the insertion portion 21, a bending portion 23 and a distal end portion 24 provided on the distal end side of the insertion portion 21. have.
- the angle knob 22a of the operation unit 22 By operating the angle knob 22a of the operation unit 22, the bending unit 23 performs a bending operation. With this bending operation, the distal end portion 24 is directed in a desired direction.
- a forceps channel 21 a for inserting a treatment tool such as forceps is provided inside the insertion portion 21.
- the entrance of the forceps channel 21 a is provided in the operation portion 22, and the exit is provided in the distal end portion 24.
- a treatment tool illustrated for introducing the colorant or the like into the forceps channel 21a. No
- a colorant or the like is introduced into the specimen from the distal end portion 24.
- the forceps channel 21a constitutes an input portion for supplying a colorant or the like.
- the operation unit 22 is provided with a mode switch SW (mode switch) 22b and a zoom operation unit 22c in addition to the angle knob 22a.
- the mode switching SW 22b is used for switching operation between two types of modes, a normal observation mode and a special observation mode.
- the normal observation mode is a mode in which a normal light image in which the inside of the specimen is converted into a full color image is displayed on the monitor 18.
- the special observation mode is a mode in which an oxygen saturation image obtained by imaging the oxygen saturation of blood hemoglobin in the specimen is displayed on the monitor 18.
- the zoom operation unit 22c is used for a zoom operation for driving the zoom lens 47 (see FIG. 2) in the endoscope 12 to enlarge the specimen.
- the processor device 16 is electrically connected to the monitor 18 and the console 20.
- the monitor 18 displays images such as normal light images and oxygen saturation images, and information related to these images (hereinafter referred to as image information and the like).
- the console 20 functions as a UI (user interface) that receives input operations such as function settings.
- a recording unit (not shown) for recording image information or the like may be connected to the processor device 16.
- the light source device 14 includes a first blue laser light source (473LD (laser diode)) 34 that emits a first blue laser beam having a center wavelength of 473 nm and a second blue laser beam that emits a second blue laser beam having a center wavelength of 445 nm.
- Two blue laser light sources (445LD) 36 are provided as light emission sources. Light emission of each of the light sources 34 and 36 made of these semiconductor light emitting elements is individually controlled by the light source control unit 40. For this reason, the light quantity ratio between the emitted light from the first blue laser light source 34 and the emitted light from the second blue laser light source 36 is freely changeable.
- the light source control unit 40 turns on the second blue laser light source 36 and emits the second blue laser light.
- the first blue laser light source 34 and the second blue laser light source 36 are alternately turned on at intervals of one frame, and the first blue laser light and the second blue laser light are alternately turned on. Make it emit light.
- the half width of the first and second blue laser beams is preferably about ⁇ 10 nm.
- the first blue laser light source 34 and the second blue laser light source 36 can use broad area type InGaN laser diodes, and can also use InGaNAs laser diodes or GaNAs laser diodes.
- the light source may be configured to use a light emitter such as a light emitting diode.
- the first and second blue laser beams emitted from the light sources 34 and 36 are transmitted to a light guide (LG) 41 via optical members (all not shown) such as a condenser lens, an optical fiber, and a multiplexer.
- the light guide 41 is built in a universal cord that connects the light source device 14 and the endoscope 12.
- the light guide 41 propagates the first and second blue laser beams from the light sources 34 and 36 to the distal end portion 24 of the endoscope 12.
- a multimode fiber can be used as the light guide 41.
- a thin fiber cable having a core diameter of 105 ⁇ m, a cladding diameter of 125 ⁇ m, and a diameter of ⁇ 0.3 to 0.5 mm including a protective layer serving as an outer shell can be used.
- the distal end portion 24 of the endoscope 12 has an illumination optical system 24a and an imaging optical system 24b.
- the illumination optical system 24a is provided with a phosphor 44 and an illumination lens 45.
- the first and second blue laser beams are incident on the phosphor 44 from the light guide 41.
- the phosphor 44 emits fluorescence when irradiated with the first or second blue laser light. Further, a part of the first or second blue laser light passes through the phosphor 44 as it is. The light emitted from the phosphor 44 is irradiated into the specimen through the illumination lens 45.
- the second blue laser light is incident on the phosphor 44, white light having the spectrum shown in FIG. 3 (second white light) is irradiated into the specimen.
- the second white light is composed of second blue laser light and green to red second fluorescence excited and emitted from the phosphor 44 by the second blue laser light. Therefore, the wavelength range of the second white light extends to the entire visible light range.
- the first blue laser light and the second blue laser light are alternately incident on the phosphor 44, whereby the first white light and the second white light having the spectrum shown in FIG. Is irradiated into the specimen.
- the first white light is composed of first blue laser light and green to red first fluorescence that is excited and emitted from the phosphor 44 by the first blue laser light. Therefore, the first white light has a wavelength range covering the entire visible light range.
- the second white light is the same as the second white light irradiated in the normal observation mode.
- the first fluorescence and the second fluorescence have substantially the same waveform (spectrum shape), and the ratio of the intensity of the first fluorescence (I1 ( ⁇ )) to the intensity of the second fluorescence (I2 ( ⁇ )) (hereinafter referred to as a frame).
- the intensity ratio) is the same at any wavelength ⁇ .
- I2 ( ⁇ 1) / I1 ( ⁇ 1) I2 ( ⁇ 2) / I1 ( ⁇ 2). Since the interframe intensity ratio I2 ( ⁇ ) / I1 ( ⁇ ) affects the calculation accuracy of the oxygen saturation, the light source controller 40 is highly accurate so as to maintain a preset reference interframe intensity ratio. Is controlled.
- the phosphor 44 absorbs a part of the first and second blue laser beams and excites and emits green to red light (for example, YAG phosphor or BAM (BaMgAl 10 O 17 )). It is preferable to use a material comprising a phosphor such as.
- a material comprising a phosphor such as
- high intensity first white light and second white light can be obtained with high luminous efficiency.
- the intensity of each white light can be easily adjusted, and changes in color temperature and chromaticity can be kept small.
- the imaging optical system 24b of the endoscope 12 includes an imaging lens 46, a zoom lens 47, and an image sensor 48 (see FIG. 2). Reflected light from the specimen enters the image sensor 48 via the imaging lens 46 and the zoom lens 47. As a result, a reflected image of the specimen is formed on the image sensor 48.
- the zoom lens 47 moves between the tele end and the wide end by operating the zoom operation unit 22c. When the zoom lens 47 moves to the wide end side, the reflected image of the specimen is reduced. On the other hand, as the zoom lens 47 moves to the tele end side, the reflected image of the specimen is enlarged. Note that when not magnifying observation (non-magnifying observation), the zoom lens 47 is disposed at the wide end. When performing magnified observation, the zoom lens 47 is moved from the wide end to the tele end side by operating the zoom operation unit 22c.
- the image sensor 48 is a color image sensor, and receives a reflected light reflected from the specimen to capture a reflected image of the specimen and output an image signal.
- the image sensor 48 is, for example, a CCD (Charge-Coupled Device) image sensor or a CMOS (Complementary Metal-Oxide Semiconductor) image sensor.
- the image sensor 48 has RGB pixels having an RGB color filter provided on the imaging surface, and outputs R, G, and B image signals by performing photoelectric conversion on the RGB pixels. To do.
- the B color filter has a spectral transmittance of 380 to 560 nm
- the G color filter has a spectral transmittance of 450 to 630 nm
- the R color filter has a spectral transmittance of 580 to 760 nm. It has transmittance. Therefore, when the second white light is irradiated into the specimen in the normal observation mode, the second blue laser light and a part of the green component of the second fluorescence are incident on the B pixel, and the second light is incident on the G pixel. A part of the green component of the fluorescence is incident, and the red component of the second fluorescence is incident on the R pixel. However, since the emission intensity of the second blue laser light is much higher than that of the second fluorescence, most of the B image signal output from the B pixel is occupied by the reflected light component of the second blue laser light.
- the first white light when the first white light is irradiated into the specimen in the special observation mode, the first blue laser light and a part of the green component of the first fluorescence are incident on the B pixel, and the first is applied to the G pixel. A part of the green component of the fluorescence is incident, and the red component of the first fluorescence is incident on the R pixel.
- the emission intensity of the first blue laser light is much higher than that of the first fluorescence, most of the B image signal is occupied by the reflected light component of the first blue laser light. It should be noted that the light incident components at the RGB pixels when the second white light is irradiated into the specimen in the special observation mode are the same as in the normal observation mode.
- the image sensor 48 may be a so-called complementary color image sensor having C (cyan), M (magenta), Y (yellow), and G (green) complementary color filters on the imaging surface.
- a complementary color image sensor is used as the image sensor 48, any of the endoscope 12, the light source device 14, and the processor device 16 is used as a color conversion unit that performs color conversion from four CMYG image signals to three RGB image signals. You should set it up. In this way, even when a complementary color image sensor is used, it is possible to obtain RGB three-color image signals by color conversion from the four-color CMYG image signals.
- the imaging control unit 49 performs imaging control of the image sensor 48.
- a period of one frame of the image sensor 48 includes an accumulation period for photoelectrically converting reflected light from the specimen and accumulating charges, and a readout period for reading the accumulated charges and outputting an image signal thereafter. It consists of.
- the image sensor 48 images the inside of the specimen illuminated with the second white light every frame period.
- RGB image signals are output from the image sensor 48 for each frame.
- the imaging control unit 49 causes the image sensor 48 to accumulate charges and output an image signal in the special observation mode in the same manner as in the normal observation mode.
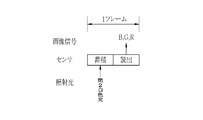
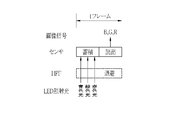
- the special observation mode the first white light and the second white light are alternately irradiated into the specimen in synchronization with the imaging frame of the image sensor 48. Therefore, as shown in FIG.
- the inside of the specimen illuminated with the first white light is imaged in the first frame, and the inside of the specimen illuminated with the second white light is imaged in the next second frame.
- the image sensor 48 outputs image signals of each color of RGB in both the first frame and the second frame.
- the spectrum of the white light on which the image sensor 48 depends depends on the first white light in the first frame for distinction below.
- the RGB image signals obtained by imaging the illuminated specimen are called R1 image signal, G1 image signal, and B1 image signal, respectively, and obtained by imaging the specimen illuminated by the second white light in the second frame.
- the RGB image signals are called R2 image signal, G2 image signal, and B2 image signal.
- the oxygen saturation is calculated using the signal ratio B1 / G2 between the B1 image signal and the G2 image signal and the signal ratio R2 / G2 between the R2 image signal and the G2 image signal.
- the signal ratio essential for calculating the oxygen saturation is the signal ratio B1 / G2 between the B1 image signal and the G2 image signal.
- the component (the first blue laser light transmitted through the phosphor 44) that becomes the B1 image signal in the first white light is the first signal light
- the G2 image signal in the second white light is the second signal light.
- the image signal of each color output from the image sensor 48 is transmitted to a CDS (correlated double sampling) / AGC (automatic gain control) circuit 50 (see FIG. 2).
- the CDS / AGC circuit 50 performs correlated double sampling (CDS) and automatic gain control (AGC) on the analog image signal output from the image sensor 48.
- CDS correlated double sampling
- AGC automatic gain control
- the image signal that has passed through the CDS / AGC circuit 50 is converted into a digital image signal by the A / D converter 52.
- the digitized image signal is input to the processor device 16.
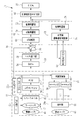
- the processor device 16 includes a receiving unit 54, an image processing switching unit 60, a normal observation image processing unit 62, an observation distance measuring unit 63, a special observation image processing unit 64, and an image display signal generating unit 66. ing.
- the receiving unit 54 receives an image signal input from the endoscope 12.
- the reception unit 54 includes a DSP (Digital Signal Processor) 56 and a noise removal unit 58, and the DSP 56 performs digital signal processing such as color correction processing on the received image signal.
- the noise removal unit 58 performs noise removal processing by, for example, a moving average method or a median filter method on the image signal that has been subjected to color correction processing or the like by the DSP 56.
- the image signal from which the noise has been removed is input to the image processing switching unit 60.
- the image processing switching unit 60 inputs an image signal to the normal observation image processing unit 62 when the mode switching SW 22b is set to the normal observation mode.
- the image processing switching unit 60 inputs an image signal to the observation distance measuring unit 63 and the special observation image processing unit 64.
- the normal observation image processing unit 62 includes a color conversion unit 68, a color enhancement unit 70, and a structure enhancement unit 72.
- the color conversion unit 68 generates RGB image data in which the input RGB image signals for one frame are assigned to R pixels, G pixels, and B pixels, respectively.
- the RGB image data is further subjected to color conversion processing such as 3 ⁇ 3 matrix processing, gradation conversion processing, and three-dimensional LUT processing.
- the color enhancement unit 70 performs various color enhancement processes on the RGB image data that has been subjected to the color conversion process.
- the structure enhancement unit 72 performs structure enhancement processing such as spatial frequency enhancement on the RGB image data that has been subjected to color enhancement processing.
- the RGB image data subjected to the structure enhancement process by the structure enhancement unit 72 is input to the image display signal generation unit 66 as a normal observation image.
- the observation distance measurement unit 63 measures the distance (observation distance) between the sample and the tip 24 based on the image signal.
- the observation distance calculated by the observation distance measurement unit 63 is input to the special observation image processing unit 64 (oxygen saturation generation unit 76).
- the zoom lens 47 is driven for enlarged observation, the distance between the distal end portion 24 and the specimen is not changed, but the specimen is magnified and observed in the same manner as when the distal end portion 24 is brought closer to the specimen.
- magnified observation with the zoom lens 47 driven has substantially the same effect as bringing the distal end portion 24 closer to the specimen.
- the observation distance measured by the observation distance measurement unit 63 includes a substantial observation distance based on the zoom magnification at the time of magnification observation where the zoom lens 47 is driven.
- the special observation image processing unit 64 includes an oxygen saturation image generation unit 76 and a structure enhancement unit 78.
- the oxygen saturation image generation unit 76 calculates the oxygen saturation and generates an oxygen saturation image representing the calculated oxygen saturation.
- the oxygen saturation image generation unit 76 calculates the oxygen saturation corrected according to the observation distance. For this reason, the oxygen saturation calculated by the oxygen saturation image generation unit 76 has a high accuracy value even when the observation distance changes.
- the structure enhancement unit 78 performs structure enhancement processing such as spatial frequency enhancement processing on the oxygen saturation image input from the oxygen saturation image generation unit 76.
- structure enhancement processing such as spatial frequency enhancement processing on the oxygen saturation image input from the oxygen saturation image generation unit 76.
- the oxygen saturation image that has undergone the structure enhancement processing by the structure enhancement unit 72 is input to the image display signal generation unit 66.
- the display image signal generation unit 66 converts the normal observation image or the oxygen saturation image into a display format signal (display image signal) and inputs it to the monitor 18. As a result, the normal observation image or the oxygen saturation image is displayed on the monitor 18.
- the observation distance measurement unit 63 includes a frequency information extraction unit 81, a difference calculation unit 82, and an observation distance calculation unit 83.
- the frequency information extraction unit 81 acquires the B1 image signal, the G2 image signal, and the R2 layer signal used for calculating the oxygen saturation, and extracts the frequency component information. Specifically, each acquired image signal is Fourier transformed to calculate its amplitudes P (B1), P (G2), and P (R2), and each of these amplitudes P (B1), P (G2), The amplitude of the specific frequency component is extracted from P (R2).
- the specific frequency component is, for example, a frequency component corresponding to a superficial blood vessel, a gland duct structure, or the like that is a main observation target when observing a close-up view with a short observation distance by bringing the tip 24 close to the specimen. is there.
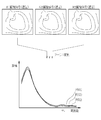
- the B1 image signal (distant view), the G2 image signal (distant view), and the R2 image signal (distant view) obtained in the case of observation at a distant view with a long observation distance are fine details such as superficial blood vessels. A naive image is not seen. Therefore, the amplitude of the difference ⁇ BG specific frequency omega V corresponding to surface blood vessels or the like, Gr, there is little difference in DerutaRB.
- the amplitude by Fourier transformation along an arbitrary direction is shown, but the Fourier transformation performed by the frequency component information extraction unit 84 is two-dimensional Fourier transformation.
- the frequency component information extraction unit 81 extracts an amplitude value of a specific frequency omega V.
- Each amplitude difference ⁇ BG the difference calculation unit 85 calculates, Gr, DerutaRB, each amplitude P in this particular frequency omega V (B1), which is the difference between the peak value of P (G2), P (R2 ).
- the B1 image signal (near view) obtained by bringing the distal end portion 24 close to the specimen (or by magnifying observation with the zoom lens 47) a fine image such as a superficial blood vessel is present. appear.
- the image appearing in the G2 image signal (near view) is more blurred than the B1 image signal (near view).
- the R2 image signal (near view) is more blurred than the image appearing on the G2 image signal (near view).
- the difference in the degree of blurring of the image that appears in the image signal of each color is because the depth of light entering the specimen, absorption by the specimen (particularly, absorption of hemoglobin), scattering, and the like differ for each wavelength band.
- the amplitude P (B1), P (G2 ), P (R2) in particular the frequency Omega V corresponding to surface blood vessels etc. If the viewing distance is short (in the case of near view), so that a significant difference is produced Thus, differences also appear in the differences ⁇ BG, ⁇ GR, ⁇ RB between the amplitudes. For this reason, the differences ⁇ BG, ⁇ GR, ⁇ RB between the amplitudes represent the balance of image blur between the colors.
- the specific frequency Omega V corresponding to surface blood vessels etc. are shifted to a lower frequency side than the frequency omega V at distant view .
- the amplitudes P (B1), P (G2), and P (R2) at the time of magnified observation are generally shifted to the low frequency side compared to a long-distance view. correspondence between the specific frequency omega V at a specific frequency omega V and magnifying observation, each amplitude P (B1), P (G2 ), can easily be detected from the overall waveform of P (R2).
- the observation distance calculation unit 83 uses this fact to calculate the observation distance based on the differences ⁇ BG, ⁇ GR, ⁇ RB between the amplitudes.
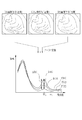
- indigo carmine may be sprayed as a colorant (dye solution) in a specimen.
- Indigo carmine is an amber (dark blue) colorant having an absorption spectrum shown in FIG.
- indigo carmine When indigo carmine is dispersed in the specimen, it accumulates in the gland duct structure (pit pattern), so that the gland duct structure is colored amber and emphasized.
- the embossed pattern of the duct structure makes it easy to observe the unevenness of the lesion.
- the indigo carmine accumulated almost gland duct structure alone, it collapses the balance of the amplitude of the image signal of each color in a specific frequency Omega V corresponding thereto.
- the amplitude of the specific frequency Omega V in B1 image signal is increased, since the amplitude of the specific frequency Omega V decreases in G2 image signals and R2 image signals, each of the amplitude of the difference ⁇ BG accordingly, Gr, ⁇ RB also changes from a specific value when indigo carmine is not sprayed.
- Indigo carmine is used in the above-described contrast method, but in addition to indigo carmine, toluidine blue and methylene blue are used in a staining method for emphasizing and highlighting a specific tissue.
- compound iodoglycerin (Lugol's solution) and crystal violet are used in a reaction method in which highlight observation is performed by reaction with a specific tissue, and fluorestin or acridine orange is used in a fluorescence method in which a specific tissue is highlighted and observed.
- indocyanine green for example, is used in an intravascular pigment administration method in which tissue is emphasized by administration into blood vessels.
- the observation distance measurement unit 63 has a switchable measurement mode for measuring two observation distances of the first measurement mode and the second measurement mode, and the observation distance corresponds to each measurement mode.
- the calculation unit 83 includes a normal distance table 83a and a coloring distance table 83b.
- the first measurement mode is a mode in which the observation distance is calculated in the case where the sample is observed with only the light absorption characteristic of hemoglobin, that is, in the normal observation environment, without the coloring agent or the like being put into the sample.
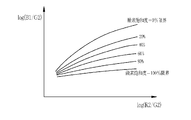
- the normal distance table 83a is a table used in the first measurement mode. As shown in FIG. 12, the normal distance difference ⁇ BG, ⁇ GR, ⁇ RB and a table for associating observation distances according to the balance thereof. It is.
- the observation distance calculation unit 83 refers to the normal distance table 83a during normal observation, and calculates observation distances corresponding to the amplitude differences ⁇ BG, ⁇ GR, ⁇ RB input from the difference calculation unit 82.
- the coloring distance table 83b is a table used in the second measurement mode. As shown in FIG. 13, the differences ⁇ BG, ⁇ GR, ⁇ RB between the amplitudes at the time of coloring are associated with observation distances according to the balance. It is a table.
- the observation distance calculation unit 83 refers to the coloring distance table 83b and corresponds to the amplitude differences ⁇ BG, ⁇ GR, ⁇ RB input from the difference calculation unit 82. The observation distance is calculated.
- the corresponding amplitude differences ⁇ BG, ⁇ GR, ⁇ RB differ depending on the presence or absence of the colorant. Conversely, even if the amplitude differences ⁇ BG, ⁇ GR, ⁇ RB have the same value (balance), the corresponding observation distance varies depending on the presence or absence of the colorant.
- the oxygen saturation image generation unit 76 includes a signal ratio calculation unit 84, a correlation storage unit 85, an oxygen saturation calculation unit 86, a correction unit 87, and an image generation unit 88. ing.
- the signal ratio calculation unit 84 receives the B1 image signal, the G2 image signal, and the R2 image signal among the image signals for two frames input to the oxygen saturation image generation unit 76.
- the signal ratio calculation unit 84 calculates the signal ratio B1 / G2 between the B1 image signal and the G2 image signal and the signal ratio R2 / G2 between the G2 image signal and the R2 image signal for each pixel.
- the correlation storage unit 85 stores the correlation between the signal ratio B1 / G2 and the signal ratio R2 / G2 and the oxygen saturation. This correlation is stored in a two-dimensional table in which isolines of oxygen saturation are defined on the two-dimensional space shown in FIG. The positions and shapes of the isolines for the signal ratio B1 / G2 and the signal ratio R2 / G2 are obtained in advance by physical simulation of light scattering, and the interval between the isolines is the blood volume (signal ratio R2 / G2). It changes according to.
- the correlation between the signal ratio B1 / G2 and the signal ratio R2 / G2 and the oxygen saturation is stored on a log scale.
- the above correlation is closely related to the light absorption characteristics and light scattering characteristics of oxyhemoglobin (graph 90) and reduced hemoglobin (graph 91).
- information on oxygen saturation is easy to handle at a wavelength where the difference in absorption coefficient between oxygenated hemoglobin and reduced hemoglobin is large, such as the center wavelength of 473 nm of the first blue laser beam.
- the B1 image signal including a signal corresponding to 473 nm light is highly dependent not only on the oxygen saturation but also on the blood volume.
- a signal ratio B1 / G2 obtained from an R2 image signal corresponding to light that changes mainly depending on blood volume, and a G2 image signal serving as a reference signal for the B1 image signal and the R2 image signal, and By using R2 / G2, the oxygen saturation can be accurately calculated without depending on the blood volume.
- the oxygen saturation calculation unit 86 refers to the correlation stored in the correlation storage unit 85, and calculates the oxygen saturation corresponding to the signal ratio B1 / G2 and the signal ratio R2 / G2 calculated by the signal ratio calculation unit 84. Calculate for each pixel. For example, when the signal ratio B1 / G2 and the signal ratio R2 / G2 in the specific pixel are B1 * / G2 * and R2 * / G2 * , respectively, referring to the correlation as shown in FIG. 17, the signal ratio B1 * The oxygen saturation corresponding to / G2 * and the signal ratio R2 * / G2 * is “60%”. Therefore, the oxygen saturation calculation unit 86 calculates the oxygen saturation of this pixel as “60%”. As described above, the oxygen saturation calculation unit 86 calculates the oxygen saturation of the specimen for each pixel based on the signal ratio of the image signals output from the same pixel.
- the signal ratio B1 / G2 and the signal ratio R2 / G2 are hardly increased or extremely decreased.
- the values of the signal ratio B1 / G2 and the signal ratio R2 / G2 hardly exceed the lower limit line 93 with an oxygen saturation of 0%, or conversely fall below the upper limit line 94 with an oxygen saturation of 100%.
- the oxygen saturation calculation unit 83 sets the oxygen saturation to 0%.
- the oxygen saturation is set to 100. %.
- the correction unit 87 receives the observation distance measured (calculated) by the observation distance measurement unit 63 and corrects the oxygen saturation error calculated by the oxygen saturation calculation unit 86 according to the input observation distance.
- the correction unit 87 includes a normal error table 87a and a coloring error table 87b corresponding to the first and second measurement modes of the observation distance measuring unit 63, and the error tables 87a and 87b. Used to correct oxygen saturation error.
- the normal error table 87a associates the observation distance when the colorant or the like is not put into the specimen with the error of the oxygen saturation calculated based on this observation distance.
- the correction unit 87 calculates an error in oxygen saturation corresponding to the amplitude differences ⁇ BG, ⁇ GR, ⁇ RB acquired from the difference calculation unit 82 by referring to the normal error table 87a.
- the oxygen saturation data calculated by the oxygen saturation calculation unit 86 is subjected to correction processing that eliminates errors. For example, in a pixel where the error is + 10%, the error is subtracted ( ⁇ 10%) from the corresponding oxygen saturation value.
- the most likely oxygen saturation level can be determined by the maximum likelihood method or the like. The error is estimated and oxygen saturation correction processing is performed.
- the zoom magnification is increased or the tip 24 is used as the specimen so that the first white light or the second white light cannot be regarded as being uniformly irradiated on the specimen.
- the close proximity can cause errors in oxygen saturation. Since the calculation of the oxygen saturation is based on the premise that the first white light and the second white light are uniformly irradiated, the non-uniformity of the first white light and the second white light becomes conspicuous. Accordingly, the balance of the B1 image signal, the G2 image signal, and the R2 image signal is lost.
- the calculated oxygen saturation has an error (hereinafter referred to as artifact) due to non-uniformity of the first white light and the second white light that occurs when the observation distance is too short.
- the normal correction process performed by the correction unit 87 using the normal error table 87a is a correction process for correcting this artifact.
- the coloring error table 87b As shown in FIG. 19, in the coloring error table 87b, an observation distance when a colorant or the like is put into a specimen is associated with an error in oxygen saturation calculated based on the observation distance. It is data.
- the normal error table 87a and the coloring error table 87b store the oxygen saturation error for the same observation distance, but the corresponding oxygen saturation error varies depending on the presence or absence of the colorant.
- the correction process performed by the correction unit 87 using the coloring error table 87b is a correction process for correcting an error in oxygen saturation due to the presence of the colorant in the specimen.
- an artifact that appears in accordance with the observation distance when no colorant is present in the specimen appears in the same manner even when the colorant is present in the specimen if the same observation distance condition is satisfied.
- the correction process performed by the correction unit 87 using the coloring error table 87b such artifacts are also corrected simultaneously. Note that the correction processing method performed by the correction unit 87 is the same as that when the normal error table 87a is used, even when the coloring error table 87b is used, except that the table used is different.
- the image generation unit 88 uses the oxygen saturation (hereinafter referred to as corrected oxygen saturation) whose error has been corrected by the correction unit 87 and the B2 image signal, the G2 image signal, and the R2 image signal to image oxygen saturation.
- corrected oxygen saturation whose error has been corrected by the correction unit 87 and the B2 image signal, the G2 image signal, and the R2 image signal to image oxygen saturation.
- a normalized oxygen saturation image is generated.
- the image generation unit 88 applies a gain corresponding to the corrected oxygen saturation for each pixel to the input original B2 image signal, G2 image signal, and R2 image signal.
- RGB image data is generated using the B2 image signal, the G2 image signal, and the R2 image signal.
- the image generation unit 88 multiplies all of the B2 image signal, the G2 image signal, and the R2 image signal by the same gain “1” in the pixel having the corrected oxygen saturation of 60% or more.
- the B2 image signal is multiplied by a gain less than “1”, and the G2 image signal and the R2 image signal are gained by “1” or more. Multiply.
- the RGB image data generated using the B2 image signal, the G2 image signal, and the R2 image signal after the gain processing is an oxygen saturation image.
- the high oxygen region (region where the oxygen saturation is 60 to 100%) is expressed in the same color as the normal observation image.
- a low oxygen region where the oxygen saturation is below a specific value (region where the oxygen saturation is 0 to 60%) is represented by a color (pseudo color) different from that of the normal observation image.
- the image generation unit 84 multiplies the gain for pseudo-coloring only the low oxygen region, but the gain corresponding to the oxygen saturation is applied even in the high oxygen region, and the entire oxygen saturation image is obtained.
- a pseudo color may be used.
- the low oxygen region and the high oxygen region are separated by oxygen saturation 60%, this boundary is also arbitrary.
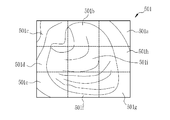
- the endoscope system 10 stores a normal distance table 83a and a coloring distance table 83b stored in the observation distance calculator 83 in advance, and a normal error table 87a and a coloring error table stored in the correction section 87 in advance.
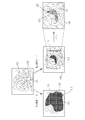
- 87b is created by measuring the phantom (simulated body imitating the specimen) 89 shown in FIG. 20 by the endoscope system 10, for example.
- the phantom 89 includes, for example, a gelatin sample containing blood whose oxygen saturation is controlled to a specific value (hereinafter referred to as blood gelatin) 89a and a gelatin sample without blood (hereinafter referred to as gelatin without blood) 89b. These are formed by laminating at the same specific spatial frequency as the surface blood vessels. When there is no abnormality such as a lesion, the oxygen saturation of venous blood is approximately 60 to 80%, so the oxygen saturation of blood-containing gelatin 89a is controlled to 70%, for example.
- the normal distance table 83a and the normal error table 87a are created in the following procedure. First, the phantom 89 is observed while changing the zoom magnification and the distance from the tip 24, and the oxygen saturation is calculated. Further, the frequency component information extraction unit 81 and the difference calculation unit 82 perform Fourier transform on the B1 image signal, the G2 image signal, and the R2 image signal obtained by observing the phantom 89 to extract the spatial frequency amplitude of the phantom 89. Then, differences ⁇ BG, ⁇ GR, ⁇ RB between these amplitudes are calculated.
- the differences ⁇ BG, ⁇ GR, ⁇ RB between the amplitudes are almost constant values and the oxygen saturation level The error is almost zero (oxygen saturation 70%).
- the difference ⁇ BG, the amplitude difference ⁇ BG depending on the zoom magnification, the distance between the distal end portion 24 and the phantom 89, or a combination thereof.
- ⁇ GR and ⁇ RB may be larger (or smaller) than a specific value. In this case, the calculated oxygen saturation is also larger than the oxygen saturation 70% of the blood-containing gelatin 89a, or conversely, a small value, resulting in an error.
- measurement data 96 that associates the difference ⁇ BG, ⁇ GR, ⁇ RB between the amplitudes, the observation distance, and the oxygen saturation error is obtained.
- the table storing the observation distance portions corresponding to the amplitude differences ⁇ BG, ⁇ GR, ⁇ RB is the normal distance table 83a, and the oxygen saturation error portion corresponding to the observation distance is shown.
- the stored table is a normal time error table 87a.
- the method for creating the coloring distance table 83b and the coloring error table 87b is the same as the method for creating the normal distance table 83a and the normal error table 87a, and is performed using the phantom 89.
- the colorant is sprayed (or injected) on the surface of the phantom 89 in the same manner as in the specimen, and the observation distance is changed. Then, the difference ⁇ BG, ⁇ GR, ⁇ RB of each amplitude, the observation distance, and the error of the oxygen saturation are measured.
- a table storing the observation distance portions corresponding to the amplitude differences ⁇ BG, ⁇ GR, ⁇ RB is a coloring distance table 83b, and the oxygen saturation corresponding to the observation distance
- a table storing the degree error portion is a coloring error table 87b.
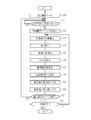
- the flow of observation by the endoscope system 10 of the present embodiment will be described along the flowchart of FIG.
- screening is performed from the farthest view state (S10).
- a normal observation image is displayed on the monitor 18.
- the mode switching SW 22b is operated to switch to the special observation mode. (S12).
- a diagnosis is made as to whether or not the likely lesion site is in a hypoxic state.
- the first and second white lights are alternately irradiated into the specimen in synchronization with the imaging frame of the image sensor 48. Therefore, the image sensor 48 detects the R1 image signal in the frame irradiated with the first white light. , G1 image signal, and B1 image signal are output, and R2 image signal, G2 image signal, and B2 image signal are output in the frame irradiated with the second white light.
- the observation distance measuring unit 63 first measures the observation distance using the image signals for these two frames. Specifically, the B1 image signal, the G2 image signal, and the R2 image signal are subjected to Fourier transform in the frequency component information extraction unit 81, and for example, the amplitude (frequency component information) of a specific frequency component corresponding to the surface blood vessel is extracted. (S13). Next, the differences ⁇ BG, ⁇ GR, ⁇ RB of the amplitudes of the specific frequency components extracted from the respective image signals are calculated by the difference calculation unit 82 (S14).
- the observation distance calculation unit 83 calculates the observation distance based on the amplitude differences ⁇ BG, ⁇ GR, ⁇ RB (S15). This calculation of the observation distance is performed when the doctor makes a setting indicating that the colorant is introduced by the processor device 16, the measurement mode of the observation distance measurement unit 63 is set to the second measurement mode, and the observation distance calculation unit 83 is set. Then, a coloring distance table 83b is used. In other cases, the measurement mode of the observation distance measurement unit 63 is set to the first measurement mode, and the observation distance calculation unit 83 uses the normal distance table 83a. Therefore, an accurate observation distance is calculated regardless of whether or not a colorant is present in the specimen.
- the oxygen saturation image generation unit 76 calculates the oxygen saturation and generates an oxygen saturation image (S16 to S19). Specifically, the signal ratio calculation unit 84 calculates the signal ratio B1 / G2 and the signal ratio R2 / G2 for each pixel (S16). Then, the oxygen saturation calculating unit 86 calculates the oxygen saturation for each pixel based on the signal ratio B1 / G2 and the signal ratio R2 / G2 (S17).
- the correction unit 87 obtains an error of the oxygen saturation corresponding to the observation distance calculated by the observation distance calculation unit 83, and corrects the calculated error to the oxygen saturation calculated by the oxygen saturation calculation unit 83.
- the corrected oxygen saturation is calculated (S18).
- This correction processing method is linked to the measurement mode of the observation distance measurement unit 63.
- an error table 87b for coloring is used.
- the normal error table 87a is used. Therefore, accurate correction processing is performed regardless of whether or not a colorant is present in the specimen.
- the image generation unit 88 When the correction oxygen saturation is calculated by the correction unit 87, the image generation unit 88 generates an oxygen saturation image in which a gain corresponding to the correction oxygen saturation is applied to the B2 image signal, the G2 image signal, and the R2 image signal ( S19) and displayed on the monitor 18 (S20). Based on the oxygen saturation image displayed on the monitor 18, the doctor confirms whether the lesion possibility site is in a hypoxic state.
- the lesion possibility site is a hypoxic region 102 in the distant oxygen saturation image 101 as shown in FIG. Is confirmed, and the doctor brings the tip 24 close to (or zooms in) the hypoxic region 102 and magnifies the hypoxic region 102.
- the artifact 104 appears in the calculated oxygen saturation as shown in the oxygen saturation image 103.
- the correct area is displayed in a pseudo color indicating a hypoxic condition.
- an artifact of high oxygen saturation is superimposed on the original low oxygen region 102, it may be difficult to observe even the low oxygen region 102 that has been observed in a distant view.
- the oxygen saturation calculated by the oxygen saturation calculation unit 86 on the assumption that the first white light and the second white light are uniform is not used for generating the oxygen saturation image as it is. Rather, the correction unit 87 performs correction processing corresponding to the observation distance on the oxygen saturation calculated by the oxygen saturation calculation unit 86, and is used to generate an oxygen saturation image. For this reason, for example, as in the oxygen saturation image 105, the low oxygen region 102 observed in a distant view is enlarged and displayed without error. For this reason, the endoscope system 10 can display accurate oxygen saturation information.
- a normal observation image in which a specific tissue 111 or the like is colored 110 is displayed on the monitor 18.
- the special observation mode is switched while the observation distance is maintained.
- the specific tissue 111 is colored as in the oxygen saturation image 112.
- the balance of the image signals of the respective colors is lost, so that an erroneous (or inaccurate) portion is displayed as a hypoxic region 113 in a pseudo color.
- the observation distance is not calculated and the oxygen saturation is not corrected according to the observation distance.
- the observation distance is calculated in the second measurement mode for coloring, and the second measurement mode is used.
- the oxygen saturation is corrected based on the obtained accurate observation distance. For this reason, for example, even if the specific tissue 111 is colored like the oxygen saturation image 116, the same correct low oxygen region 102 as the oxygen saturation image 101 is displayed. Even when the distal end portion 24 is brought close to the specimen (or zoomed) to shorten the observation distance and enlarge the hypoxic region 102, the observation distance is calculated in the second measurement mode for coloring.
- the oxygen saturation is corrected based on the accurate observation distance obtained in the second measurement mode, even if the specific tissue 111 is colored as in the oxygen saturation image 118, the oxygen saturation is not corrected. Like the image 105, the artifact 104 does not appear, and the periphery of the hypoxic region 102 can be correctly enlarged and observed.
- the endoscope system 10 measures the observation distance based on the image signal obtained from the image sensor 48. For this reason, it is not necessary to add an interferometer or the like for measuring the observation distance. For this reason, it can be produced at low cost and the degree of freedom in design does not decrease.
- a measurement mode for the observation distance a first measurement mode for calculating the observation distance when no colorant is present in the specimen, and a second measurement mode for measuring the observation distance when the colorant is present in the specimen.
- the observation distance is measured in the second measurement mode appropriate when the colorant is introduced. For this reason, the endoscope system 10 accurately colors the observation distance even if the specific tissue is colored by the colorant being added and the balance of the image signals of the respective colors is lost compared to the normal time when the colorant is not charged. Can be calculated.
- the endoscope system 10 corrects the oxygen saturation based on the highly accurate observation distance, and generates and displays the oxygen saturation image using the corrected oxygen saturation. Even if the balance of the image signals of the respective colors is lost with respect to the normal time when no colorant is added due to the presence of the colored tissue, an accurate oxygen saturation image can be generated and displayed.
- the normal distance table 83a and the coloring distance table 83b for calculating the observation distance store the amplitude differences ⁇ BG, ⁇ GR, ⁇ RB and the observation distances corresponding to these, but not necessarily It is not necessary to use all of the amplitude differences ⁇ BG, ⁇ GR, and ⁇ RB, and by using any one or more of these, an accurate observation distance can be calculated in the same manner as in the first embodiment. For example, only the amplitude difference ⁇ BG (the balance of the degree of blur between the B1 image signal and the G2 image signal) and the corresponding observation distance may be used.
- B1 image signals, G2 image signals, R2 image signal of the amplitude of the difference ⁇ BG specific frequency Omega V components, Gr, distance table 83a that associates the viewing distance DerutaRB, is used to 83b , B1 image signals, G2 image signals, R2 image signal of the amplitude of the difference ⁇ BG specific frequency Omega V components, Gr, instead of DerutaRB, may be used amplitude ratio of the specific frequency Omega V components.
- the frequency of the surface blood vessels and the specific frequency Omega V, or a any specific frequency the frequency of the tissue is arbitrary.
- the low oxygen region 102 is confirmed in the distant view, the low oxygen region 102 is enlarged and observed, but even when the low oxygen region 102 is not detected in the distant view oxygen saturation image, You may do magnified observation. In this case, the hypoxic region may be observed only after magnified observation. However, the endoscope system 10 calculates an accurate observation distance, and corrects the oxygen saturation according to the calculated accurate observation distance. Therefore, even when a low oxygen region is observed for the first time after magnified observation, accurate oxygen saturation can be calculated and displayed.
- the observation distance is calculated using the normal distance table 83a or the coloring distance table 83b.
- a function that associates frequency component information with the observation distance instead of the data in the table format. May be used.
- a first distance calculation function for the first measurement mode corresponding to the normal time distance table 83a and a second distance calculation function for the second measurement mode corresponding to the coloring time distance table 83b instead of the distance tables 83a and 83b, an observation distance may be calculated in advance and calculated.
- These functions can be created from the normal distance table 83a and the coloring distance table 83b, respectively.
- the same applies to the normal error table 87a and the coloring error table 87b used to correct the oxygen saturation, and corresponding functions may be stored instead of these tables.
- the frequency component extraction unit 81 extracts the amplitude of the specific frequency component from the B1 image signal, the G2 image signal, and the R2 image signal as the frequency component information.
- the amplitude of a frequency band having a specific width may be extracted and the total value may be used as frequency component information.
- the phase may be taken into account, or only the phase information may be used. That is, the frequency component information extracted from the B1 image signal, the G2 image signal, and the R2 image signal by the frequency component extraction unit 81 is arbitrary as long as it is information regarding a specific frequency component that can be associated with the observation distance.
- the frequency component extraction unit 81 extracts frequency component information (amplitude of a specific frequency component) by performing Fourier transform on the B1 image signal, the G2 image signal, and the R2 image signal.
- frequency component information may be extracted from the B1 image signal, the G2 image signal, and the R2 image signal using an image filter (two-dimensional filter) that extracts a specific frequency component.
- the frequency component information may be extracted by any method other than the method using Fourier transform or image filter.
- the frequency component information extracted by the frequency component extraction unit 81 and the arbitraryness of the frequency component information extraction method are the same in other embodiments and modifications described later.
- the observation distance is measured in the second measurement mode when the colorant is introduced into the specimen.
- tissue colored by the kind of coloring agent and its color differ.
- the distance table 83b for coloring and the error table 87b for coloring are illustrated one, it is the combination for every kind of colorant (when using two or more colorants together) It is preferable to provide a plurality of coloring distance tables and coloring error tables. In this way, no matter what kind of colorant is used, the observation distance can be accurately calculated by the endoscope system 10 and the oxygen saturation can be accurately calculated and displayed.
- the colorant is introduced into the specimen.
- the balance of the image signals of the respective colors is lost compared to the normal time, and the observation distance and the oxygen saturation are reduced. It may not be asked correctly.
- a cleaning liquid (cleaning agent) for cleaning the inside of a specimen is usually colored in order to prevent accidental ingestion and the like. For this reason, if the cleaning liquid remains in the specimen, the balance of the image signals of the respective colors is lost as in the case where the colorant is added, and the observation distance and the oxygen saturation cannot be obtained correctly. For this reason, it is preferable to provide a distance table and an error table corresponding to the remaining of the cleaning liquid and the like. When remaining of the cleaning liquid or the like is confirmed, an accurate observation distance and oxygen saturation can be calculated by setting the measurement mode using the distance table and the error table.
- the case where the balance of the image signals of the respective colors is lost due to the introduction of a non-hemoglobin substance such as a colorant that does not naturally exist in the specimen, and the observation distance and the oxygen saturation are not correctly obtained is taken as an example.
- the balance of the image signals of the respective colors is lost due to a non-hemoglobin substance that can exist naturally in the specimen, and the observation distance and oxygen saturation cannot be obtained correctly.
- residues such as stool, stool juice, or other colored secretions
- the normal specimen is observed mainly with the contrast of the image signals of the respective colors according to the light absorption amount (or reflection amount) of hemoglobin contained in the blood.
- the colorant, the cleaning liquid, the residue, etc. are all substances that break the balance of the contrast of the image signals of the respective colors according to the amount of light absorption (reflection amount) of hemoglobin.
- non-hemoglobin substances such substances other than hemoglobin that destroy the contrast balance of the image signals of the respective colors.
- the observation distance is measured in the special observation mode, and the oxygen saturation is corrected based on the calculated observation distance.
- the observation distance is also obtained in the normal observation mode in which the oxygen saturation is not calculated.
- the observation distance may be measured by the measurement unit 63. If the observation distance calculated in the normal observation mode is displayed on the monitor 18 together with the normal image, a safe operation can be assisted so as not to damage the specimen at the tip 24.
- the observation distance in the normal observation mode can be measured in the same manner as in the above embodiment, but the observation distance in the normal observation mode is measured for each of the R, G, and B colors that the image sensor 48 outputs in one frame.
- the observation distance can be calculated using the image signal. That is, an accurate observation distance can be measured with only an image signal obtained in only one frame.
- the B1 image signal, the G2 image signal, and the R2 image signal used for calculating the oxygen saturation are used for measurement of the observation distance in the special observation mode.
- B1 obtained in the first frame is used.
- the observation distance may be measured using the image signal, the G1 image signal, and the R1 image signal, and the observation distance may be measured using the B2 image signal, the G2 image signal, and the R2 image signal obtained in the second frame. You can go. In this way, even in the special observation mode, as in the measurement of the observation distance in the normal observation mode, the accurate observation distance can be measured with only an image signal obtained in only one frame.
- the oxygen saturation is calculated based on the signal ratio B1 / G2 and the signal ratio R2 / G2, and correction processing is performed on the calculated oxygen saturation data.
- the calculation of the oxygen saturation is performed.
- the image signal used for the correction may be corrected according to the observation distance, and the oxygen saturation may be calculated using the corrected image signal.
- the phosphor 44 is provided at the distal end portion 24 of the endoscope 12.
- the phosphor 44 may be provided inside the light source device 14.
- the phosphor 44 is provided between the first blue laser light source (473LD) 34 and the second blue laser light source (445LD) 36 and the light guide 41.
- the first blue laser light source 34 or the second blue laser light source 36 is irradiated with the first blue laser light or the second blue laser light toward the phosphor 44.
- 1st white light or 2nd white light is emitted.
- the first or second white light is irradiated into the specimen through the light guide 41.
- the rest is the same as the endoscope system 10.
- first and second blue laser beams are incident on the same phosphor 44, but the first blue laser beam and the second blue laser beam are incident on separate first phosphor and second phosphor, respectively. May be.
- the light source device 14 of the endoscope system 300 includes an LED (Light Emitting Diode) light source unit 301 instead of the first and second blue laser light sources 34 and 36 and the light source control unit 40.
- An LED light source control unit 304 is provided.
- the phosphor 44 is not provided in the illumination optical system 24 a of the endoscope system 300. Other than that, it is the same as the endoscope system 10 of the first embodiment.
- the LED light source unit 301 includes an R-LED 301a, a G-LED 301b, and a B-LED 301c as light sources that emit light limited to a specific wavelength band.
- the R-LED 301a emits red band light in the red region of 600 to 720 nm (hereinafter simply referred to as red light)
- the G-LED 301b emits green band light in the green region of 480 to 620 nm ( Hereinafter, it simply emits green light).
- the B-LED 301c emits blue band light in the blue region of 400 to 500 nm (hereinafter simply referred to as blue light).
- the LED light source unit 301 has a high-pass filter (HPF) 302 that is inserted into and extracted from the optical path of blue light emitted from the B-LED 301c.
- the high pass filter 302 cuts blue light having a wavelength band of 450 nm or less and transmits light having a wavelength band longer than 450 nm.
- the cut-off wavelength (450 nm) of the high-pass filter 302 is a wavelength at which the absorption coefficients of oxyhemoglobin and reduced hemoglobin are substantially equal (see FIG. 16), and the absorption coefficients of oxyhemoglobin and reduced hemoglobin are reversed at this wavelength.
- the correlation stored in the correlation storage unit 85 is a case where the extinction coefficient of oxyhemoglobin is larger than the extinction coefficient of reduced hemoglobin. Therefore, a signal based on a wavelength band equal to or less than the cutoff wavelength is The signal ratio B1 / G2 is lower than the original value measured at 473 nm, causing inaccurate oxygen saturation to be calculated. For this reason, the high-pass filter 302 prevents the specimen from being irradiated with light in a wavelength band equal to or less than the cutoff wavelength when acquiring the B1 image signal for calculating the oxygen saturation.
- the high pass filter 302 is inserted in front of the B-LED 301c in the special observation mode, and is retracted to the retreat position in the normal observation mode.
- the high-pass filter 302 is inserted / removed by the HPF insertion / removal unit 303 under the control of the LED light source control unit 304.
- the LED light source control unit 304 controls turning on / off of each LED 301 a to 301 c of the LED light source unit 301 and insertion / extraction of the high-pass filter 302. Specifically, as shown in FIG. 27, in the normal observation mode, the LED light source control unit 304 turns on all the LEDs 301a to 301c, and the high-pass filter 302 retracts from the optical path of the B-LED 301c.
- the LED light source control unit 304 inserts the high-pass filter 302 on the optical path of the B-LED 301c.
- the B-LED 301c is turned on and the R-LED 301a and the G-LED 301b are turned off, thereby irradiating the sample with blue light with a wavelength band of 450 nm or less cut.
- the R-LED 301a, the G-LED 301b, and the B-LED 301c are all turned on, and the blue light from which the wavelength band of 450 nm or less is cut out of the blue light emitted from the B-LED 301c and the R-LED 301a emits.
- the image sensor 48 outputs a B1 image signal in the first frame, and outputs an R2 image signal, a G2 image signal, and a B2 image signal in the second frame, respectively. Therefore, the subsequent processing can be performed in the same manner as the endoscope system 10 of the first embodiment.
- the specimen is imaged with the high-pass filter 302 inserted in both the first frame and the second frame in the special observation mode.
- the high-pass filter 302 is inserted only in the first frame and the second frame is inserted.
- the high-pass filter 302 may be retracted.
- the first frame in the special observation mode only the B-LED 301c is turned on and only the blue light is irradiated on the specimen.
- the R-LED 301a and the G-LED 301b are also turned on in the first frame, and the R1 image signal
- the G1 image signal may be output to the image sensor 48.
- the light source device 14 of the endoscope system 400 includes a broadband light source 401, a rotation filter 402, and a rotation instead of the first and second blue laser beams 34 and 36 and the light source control unit 40.
- a filter control unit 403 is provided.
- the image sensor 405 of the endoscope system 400 is a monochrome image sensor that is not provided with a color filter. The rest is the same as the endoscope system of the first to third embodiments.
- the broadband light source 401 includes, for example, a xenon lamp, a white LED, and the like, and emits white light whose wavelength band ranges from blue to red.
- the rotary filter 402 includes a normal observation mode filter 410 and a special observation mode filter 411 (see FIG. 30), and the white light emitted from the broadband light source 401 is normally on the optical path on which the light guide 41 is incident. It is movable in the radial direction between a first position for the normal observation mode where the observation mode filter 410 is disposed and a second position for the special observation mode where the special observation mode filter 411 is disposed. The mutual movement of the rotary filter 402 to the first position and the second position is controlled by the rotary filter control unit 403 according to the selected observation mode.
- the rotation filter 402 rotates according to the imaging frame of the image sensor 405 in a state where the rotation filter 402 is disposed at the first position or the second position.
- the rotation speed of the rotation filter 402 is controlled by the rotation filter control unit 403 according to the selected observation mode.
- the normal observation mode filter 410 is provided on the inner periphery of the rotary filter 402.
- the normal observation mode filter 410 includes an R filter 410a that transmits red light, a G filter 410b that transmits green light, and a B filter 410c that transmits blue light. Therefore, when the rotary filter 402 is arranged at the first position for the normal light observation mode, white light from the broadband light source 401 is selected from the R filter 410a, the G filter 410b, and the B filter 410c according to the rotation of the rotary filter 402. Is incident on.
- the specimen is sequentially irradiated with red light, green light, and blue light in accordance with the transmitted filter, and the image sensor 405 receives these reflected lights to capture the specimen, thereby obtaining an R image.
- a signal, a G image signal, and a B image signal are sequentially output.
- the special observation mode filter 411 is provided on the outer peripheral portion of the rotary filter 402.
- the special observation mode filter 411 includes an R filter 411a that transmits red light, a G filter 411b that transmits green light, a B filter 411c that transmits blue light, and a narrow band that transmits 473 ⁇ 10 nm narrow band light. And a filter 511d. Therefore, when the rotary filter 402 is arranged at the second position for the normal light observation mode, white light from the broadband light source 401 is changed into an R filter 411a, a G filter 411b, a B filter 411c, and a narrow band according to the rotation of the rotary filter 402. The light enters one of the filters 411d.
- the sample is sequentially irradiated with red light, green light, blue light, and narrowband light (473 nm) in accordance with the transmitted filter, and the image sensor 405 receives these reflected lights, respectively. , And sequentially output an R image signal, a G image signal, a B image signal, and a narrowband image signal.
- the R image signal and the G image signal obtained in the special observation mode correspond to the R1 (or R2) image signal and the G1 (or G2) image signal of the first embodiment, respectively.
- the B image signal obtained in the special observation mode corresponds to the B2 image signal of the first embodiment, and the narrowband image signal corresponds to the B1 image signal. Therefore, the subsequent processing can be performed in the same manner as in the endoscope systems of the first to third embodiments.
- the measurement of the observation distance and the correction of the error of the oxygen saturation corresponding to the measured observation distance are performed on the entire image signal.
- the measurement of the observation distance and the correction of the error of the oxygen saturation according to the measured observation distance are performed by dividing the B1 image signal, the G2 image signal, and the R2 image signal into a plurality of regions, respectively. Is preferred.
- the B1 image signal 501 is divided into a total of nine divided regions 501a to 501i of 3 ⁇ 3 vertically and horizontally.
- each difference in amplitude DerutaBG, Gr, the calculation of DerutaRB is carried out each difference in amplitude DerutaBG, Gr, the calculation of DerutaRB.
- ⁇ BG, ⁇ GR, and ⁇ RB obtained in the divided regions 501a to 501i, it is preferable to correct the oxygen saturation error and the image signal for each of the divided regions 501a to 501i. The same applies to the G2 image signal and the R2 image signal.
- the B1 image signal, the G2 image signal, and the R2 image signal are divided into a plurality of divided regions 501a to 501i, and measurement of the observation distance and correction of the oxygen saturation error are performed in each of the divided regions 501a to 501i, The accuracy of measurement and correction is improved.
- the specimen 505 for example, a lumen wall
- the entire image signal 510 collectively extracts the amplitude of the specific frequency Omega V components, the difference in amplitude DerutaBG, Gr, calculating the DerutaRB, near the center of the divided regions 510i divided regions 510a ⁇
- the amplitude differences ⁇ BG, ⁇ GR, ⁇ RB are different from 510h.
- the difference becomes more prominent as the zoom magnification is higher or the tip 24 is closer to the specimen 505. Therefore, when the observation distance is measured and the oxygen saturation error is corrected in the same manner in all the divided areas 510a to 501i, the central divided area 510i, the peripheral divided areas 510a to 510h, or both of these areas are used. An error occurs.
- the oxygen saturation error correction or the image signal correction is performed for each of the divided areas 510a to 510i, accurate correction can be performed in each area.
- the difference in observation distance between the divided regions 520a to 520i in the obtained image signal 520 is further increased. growing. For example, in the three divided areas 520e to 520g in the lower stage of the image signal 520, the distance between the tip 24 and the specimen 505 is the shortest in d3, but in the three divided areas 520d, 520i, and 520h in the middle stage, d4 is longer than d3. Further, in the upper three divided regions 520a to 520c, d5 is the longest (d3 ⁇ d4 ⁇ d5).
- the amplitude differences ⁇ BG, ⁇ GR, and ⁇ RB are collectively calculated for the entire image signal 520 (all divided regions 520a to 520i). Saturation error correction tends to be inaccurate. However, if correction is performed in each of the divided regions 520a to 520i, the oxygen saturation error correction and the image signal correction can be performed more accurately than when the entire image signal 520 is corrected collectively.
- the image signal is divided into nine 3 ⁇ 3 divided regions, and the oxygen saturation error correction and the image signal correction are performed in each divided region. Is optional. However, the finer the division, the better the correction accuracy, but the correction process takes time. For this reason, in order to achieve both the speed of the correction process and the correction accuracy, it is preferable to divide the image signal into a total of about 9 areas of 3 ⁇ 3 as described above.
- the oxygen saturation is calculated based on the signal ratio B1 / G2 and the signal ratio R2 / G2, but the oxygen saturation is calculated based only on the signal ratio B1 / G2. May be.
- the correlation storage unit 82 may store the correlation between the signal ratio B1 / G2 and the oxygen saturation.
- an oxygen saturation image obtained by imaging oxygen saturation is generated and displayed.
- a blood volume image obtained by imaging blood volume is generated and displayed. May be. Since the blood volume has a correlation with the signal ratio R2 / G2, a blood volume image in which the blood volume is imaged can be created by assigning a different color according to the signal ratio R2 / G2.
- oxygen saturation is calculated, but instead of or in addition to this, “blood volume (signal ratio R2 / G2) ⁇ oxygen saturation (%)”
- Other biological function information such as a calculated oxygenated hemoglobin index or a reduced hemoglobin index calculated from “blood volume ⁇ (1 ⁇ oxygen saturation) (%)” may be calculated.
Abstract
着色剤や残渣等が検体内に存在する場合でも正確に観察距離を測定する内視鏡システム及びプロセッサ装置並びに作動方法並びに距離測定装置を提供する。内視鏡システム10は、光源装置14と、内視鏡12と、観察距離測定部63と、を備える。光源装置14は、検体に含まれるヘモグロビンに吸収される波長帯域を有する信号光を検体に照射する。内視鏡12は、信号光の反射光で検体を撮像して画像信号を出力するイメージセンサ48を有する。観察距離測定部63は、画像信号に基づいて観察距離を測定する。
Description
本発明は、検体内を観察するための内視鏡システム及びプロセッサ装置並びに作動方法並びに距離測定装置に関する。
医療分野においては、内視鏡システムを用いる診断が一般的になっている。内視鏡システムは、例えば、検体に照射するための光を発生する光源装置と、検体を撮像する内視鏡と、検体を撮像して得た画像信号の処理等をするプロセッサ装置とを備える。
内視鏡システムを用いて検体を観察する場合、様々な理由から、検体と内視鏡の先端部との距離(以下、観察距離という)を知りたいという要望がある。例えば、特許文献1に記載の内視鏡システムは、先端部の接触によって検体を傷つけてしまうことを防ぐために、内視鏡内に干渉計を設け、この干渉計により観察距離を計測している。
特許文献1のように、観察距離を測定するための干渉計を設ける場合、コストが増大してしまうという問題がある。また、特許文献1の内視鏡システムでは、内視鏡の挿入部が太径化し難い構成になっているものの、干渉計を形成する部材を配置するスペースが必要になり、内視鏡システムの各部の内部空間を圧迫するので、設計の自由度が下がる。例えば、観察距離を測定するための干渉計を設ける場合、この干渉計がない場合と比較して、小型化や省スペース化が難しい。
本発明は、干渉計等を追加せずに観察距離を測定することができる内視鏡システム及びプロセッサ装置並びに作動方法並びに距離測定装置を提供することを目的とする。
本発明の内視鏡システムは、光源装置と、内視鏡と、観察距離測定部と、を備える。光源装置は、検体に含まれるヘモグロビンに吸収される波長帯域を有する信号光を検体に照射する。内視鏡は、信号光の反射光を受光することにより検体を撮像して画像信号を出力するイメージセンサを有する。観察距離測定部は、画像信号に基づいて観察距離を測定する。
観察距離測定部は、検体に含まれるヘモグロビンの他に、検体による信号光の反射量を変化させる非ヘモグロビン物質が存在しない場合に観察距離を測定する第1測定モードと、非ヘモグロビン物質が存在する場合に観察距離を測定する第2測定モードとが切り替え可能であり、第1測定モードと第2測定モードのいずれかで観察距離を算出することが好ましい。
観察距離測定部は、画像信号から周波数成分情報を抽出する周波数成分情報抽出部と、画像信号の周波数成分情報に基づいて観察距離を算出する観察距離算出部と、を備える。
周波数成分情報とは、例えば、特定の周波数成分の振幅である。周波数成分情報として特定周波数成分の振幅を用いる場合、観察距離算出部は、例えば、対応する波長帯域(R,G,B等の色)が異なる二つの画像信号についてそれぞれ抽出された振幅の差に基づいて観察距離を算出する。なお、特定の周波数成分とは、検体の表層血管に対応する周波数成分に関する情報である。
観察距離算出部は、例えば、非ヘモグロビン物質が存在しない場合の周波数成分情報を観察距離に対応付ける第1距離テーブルと、非ヘモグロビン物質が存在する場合の周波数成分情報に対応付ける第2距離テーブルと、を有する。そして、第1測定モードでは第1距離テーブルを用い、第2測定モードでは第2距離テーブルを用いて観察距離を算出する。
また、観察距離算出部は、周波数成分情報を観察距離に対応付ける関数を用いて観察距離を算出しても良い。この場合、周波数成分情報を観察距離に対応付ける関数として、第1測定モード用の第1距離算出関数と、第2測定モード用の第2距離算出関数とを備える。
非ヘモグロビン物質を投入する非ヘモグロビン物質投入部を備えていても良い。非ヘモグロビン物質投入部は例えば鉗子チャネルである。
非ヘモグロビン物質とは、検体を着色する着色剤、及び/または、検体内を洗浄するための洗浄剤である。着色剤は、例えば、インジゴカルミン、トルイジンブルー、メチレンブルー、複方ヨードグリセリン、クリスタルバイオレット、フルオレスチン、アクリジンオレンジ、インドシアニングリーン、及び、酢酸の少なくともいずれかを含む。或いは、非ヘモグロビン物質は、検体内に残存する残渣、及び/または、検体が分泌する分泌物の場合もある。
観察距離とは、内視鏡の先端部と検体との距離である。また、内視鏡に第1信号光と第2信号光の各反射光によってイメージセンサに結像される像を拡大するためのズームレンズを備える場合、観察距離は、ズームレンズによる像の拡大率に基づいた距離である。
観察距離算出部は、画像信号を複数の領域に分割し、領域毎に観察距離を算出することが好ましい。
本発明の内視鏡システムは、光源装置が信号光として互いに異なる波長帯域を有する第1信号光と第2信号光を検体に照射し、イメージセンサが第1信号光の反射光と第2信号光の反射光とを受光することにより検体を撮像して第1画像信号と第2画像信号を出力し、同一の画素から出力される第1画像信号と第2画像信号の信号比に基づいて検体の酸素飽和度を画素毎に算出する酸素飽和度算出部と、観察距離に基づいて、酸素飽和度を補正する補正部と、補正部によって補正された酸素飽和度に基づいて検体の酸素飽和度を表す酸素飽和度画像を生成する画像生成部と、をさらに備えることが好ましい。
本発明のプロセッサ装置は、検体に含まれるヘモグロビンに吸収される波長帯域を有する信号光を検体に照射する光源装置と、信号光の反射光を受光することにより検体を撮像して画像信号を出力するイメージセンサを有する内視鏡と、を有する内視鏡システムのプロセッサ装置であり、観察距離測定部を備える。観察距離測定部は、画像信号に基づいて内視鏡による検体の観察距離を測定する。
本発明の作動方法は、検体に含まれるヘモグロビンに吸収される波長帯域を有する信号光を検体に照射する光源装置と、信号光の反射光を受光することにより検体を撮像して画像信号を出力するイメージセンサを有する内視鏡と、を有する内視鏡システムの作動方法であり、画像信号に基づいて内視鏡による検体の観察距離を測定する観察距離測定ステップを備える。
本発明の距離測定装置は、光源装置と、イメージセンサと、観察距離測定部と、を備える。光源装置は、検体に含まれるヘモグロビンに吸収される波長帯域を有する信号光を検体に照射する。イメージセンサは、信号光の反射光を受光することにより検体を撮像して画像信号を出力する。観察距離測定部は、画像信号に基づいて検体の観察距離を測定する。
本発明の内視鏡システム及びプロセッサ装置並びに作動方法並びに距離測定装置は、イメージセンサが出力する画像信号に基づいて観察距離を測定するので、干渉計等を追加せずに観察距離を測定することができる。このため、低コストであり、かつ、設計の自由度も低下しない。
[第1実施形態]
図1に示すように、第1実施形態の内視鏡システム10は、内視鏡12と、光源装置14と、プロセッサ装置16、モニタ18と、コンソール20とを有する。内視鏡12は、光源装置14と光学的に接続されるとともに、プロセッサ装置16と電気的に接続される。内視鏡12は、検体内に挿入される挿入部21と、挿入部21の基端部分に設けられた操作部22と、挿入部21の先端側に設けられた湾曲部23及び先端部24を有している。操作部22のアングルノブ22aを操作することにより、湾曲部23は湾曲動作する。この湾曲動作にともなって、先端部24が所望の方向に向けられる。
図1に示すように、第1実施形態の内視鏡システム10は、内視鏡12と、光源装置14と、プロセッサ装置16、モニタ18と、コンソール20とを有する。内視鏡12は、光源装置14と光学的に接続されるとともに、プロセッサ装置16と電気的に接続される。内視鏡12は、検体内に挿入される挿入部21と、挿入部21の基端部分に設けられた操作部22と、挿入部21の先端側に設けられた湾曲部23及び先端部24を有している。操作部22のアングルノブ22aを操作することにより、湾曲部23は湾曲動作する。この湾曲動作にともなって、先端部24が所望の方向に向けられる。
挿入部21の内部には鉗子等の処置具を挿通するための鉗子チャネル21aが設けられている。鉗子チャネル21aの入口は操作部22に設けられ、出口は先端部24に設けられる。挿入部21を検体内に挿入した状態で、特定の組織を着色するための着色剤等を検体内に投入する場合には、この鉗子チャネル21aに着色剤等を投入するための処置具(図示しない)が挿通され、先端部24から着色剤等が検体内に投入される。この場合の鉗子チャネル21aは、着色剤等を投入するための投入部を構成する。
操作部22には、アングルノブ22aの他、モード切替SW(モード切替スイッチ)22bと、ズーム操作部22cが設けられている。モード切替SW22bは、通常観察モードと、特殊観察モードの2種類のモード間の切り替え操作に用いられる。通常観察モードは、検体内をフルカラー画像化した通常光画像をモニタ18に表示するモードである。特殊観察モードは、検体内の血中ヘモグロビンの酸素飽和度を画像化した酸素飽和度画像をモニタ18に表示するモードである。ズーム操作部22cは、内視鏡12内のズームレンズ47(図2参照)を駆動させ、検体を拡大するズーム操作に用いられる。
プロセッサ装置16は、モニタ18及びコンソール20と電気的に接続される。モニタ18は、通常光画像や酸素飽和度画像等の画像、及びこれらの画像に関する情報(以下、画像情報等という)を表示する。コンソール20は、機能設定等の入力操作を受け付けるUI(ユーザインタフェース)として機能する。なお、プロセッサ装置16には、画像情報等を記録する記録部(図示省略)を接続しても良い。
図2に示すように、光源装置14は、中心波長473nmの第1青色レーザ光を発する第1青色レーザ光源(473LD(レーザダイオード))34と、中心波長445nmの第2青色レーザ光を発する第2青色レーザ光源(445LD)36とを発光源として備えている。これらの半導体発光素子からなる各光源34,36の発光は、光源制御部40により個別に制御される。このため、第1青色レーザ光源34の出射光と、第2青色レーザ光源36の出射光の光量比は変更自在になっている。
光源制御部40は、通常観察モードの場合には、第2青色レーザ光源36を点灯させ、第2青色レーザ光を発光させる。これに対して、特殊観察モードの場合には、1フレーム間隔で、第1青色レーザ光源34と第2青色レーザ光源36を交互に点灯させ、第1青色レーザ光と第2青色レーザ光を交互に発光させる。なお、第1,第2青色レーザ光の半値幅は±10nm程度にすることが好ましい。また、第1青色レーザ光源34と第2青色レーザ光源36は、ブロードエリア型のInGaN系レーザダイオードが利用でき、また、InGaNAs系レーザダイオードやGaNAs系レーザダイオードを用いることもできる。また、上記光源として、発光ダイオード等の発光体を用いた構成としても良い。
各光源34,36から出射される第1,第2青色レーザ光は、集光レンズ、光ファイバ、合波器等の光学部材(いずれも図示せず)を介してライトガイド(LG)41に入射する。ライトガイド41は、光源装置14と内視鏡12を接続するユニバーサルコードに内蔵されている。ライトガイド41は、各光源34,36からの第1,第2青色レーザ光を、内視鏡12の先端部24まで伝搬する。なお、ライトガイド41としては、マルチモードファイバを使用することができる。一例として、コア径105μm、クラッド径125μm、外皮となる保護層を含めた径がφ0.3~0.5mmの細径なファイバケーブルを使用することができる。
内視鏡12の先端部24は、照明光学系24aと撮像光学系24bを有している。照明光学系24aには、蛍光体44と、照明レンズ45が設けられている。蛍光体44には、ライトガイド41から第1,第2青色レーザ光が入射する。蛍光体44は、第1または第2青色レーザ光が照射されることで蛍光を発する。また、一部の第1または第2青色レーザ光は、そのまま蛍光体44を透過する。蛍光体44を出射した光は、照明レンズ45を介して検体内に照射される。
通常観察モードにおいては、第2青色レーザ光が蛍光体44に入射するため、図3に示すスペクトルの白色光(第2白色光)が検体内に照射される。この第2白色光は、第2青色レーザ光と、この第2青色レーザ光により蛍光体44から励起発光する緑色~赤色の第2蛍光とから構成される。したがって、第2白色光は、波長範囲が可視光全域に及んでいる。
一方、特殊観察モードにおいては、第1青色レーザ光と第2青色レーザ光とが蛍光体44に交互に入射することにより、図4に示すスペクトルの第1白色光と第2白色光とが交互に検体内に照射される。第1白色光は、第1青色レーザ光と、この第1青色レーザ光により蛍光体44から励起発光する緑色~赤色の第1蛍光とから構成される。したがって、第1白色光は、波長範囲が可視光全域に及んでいる。第2白色光は、通常観察モード時に照射される第2白色光と同様である。
第1蛍光と第2蛍光は、波形(スペクトルの形状)がほぼ同じであり、第1蛍光の強度(I1(λ))と第2蛍光の強度(I2(λ))の比(以下、フレーム間強度比という)は、何れの波長λにおいても同じである。例えば、I2(λ1)/I1(λ1)=I2(λ2)/I1(λ2)である。このフレーム間強度比I2(λ)/I1(λ)は、酸素飽和度の算出精度に影響を与えるため、光源制御部40により、予め設定された基準フレーム間強度比を維持するように高精度に制御されている。
なお、蛍光体44は、第1及び第2青色レーザ光の一部を吸収して、緑色~赤色に励起発光する複数種類の蛍光体(例えばYAG系蛍光体、あるいはBAM(BaMgAl10O17)等の蛍光体)を含んで構成されるものを使用することが好ましい。また、本実施形態のように、半導体発光素子を蛍光体44の励起光源として用いれば、高い発光効率で高強度の第1白色光及び第2白色光が得られる。また、各白色光の強度を容易に調整できる上に、色温度、色度の変化を小さく抑えることができる。
内視鏡12の撮像光学系24bは、撮像レンズ46、ズームレンズ47、イメージセンサ48を有している(図2参照)。検体からの反射光は、撮像レンズ46及びズームレンズ47を介してイメージセンサ48に入射する。これにより、イメージセンサ48に検体の反射像が結像される。ズームレンズ47は、ズーム操作部22cを操作することでテレ端とワイド端との間を移動する。ズームレンズ47がワイド端側に移動すると検体の反射像が縮小する。一方、ズームレンズ47がテレ端側に移動することで、検体の反射像が拡大する。なお、拡大観察をしない場合(非拡大観察時)には、ズームレンズ47はワイド端に配置されている。そして、拡大観察を行う場合には、ズーム操作部22cの操作によってズームレンズ47はワイド端からテレ端側に移動される。
イメージセンサ48は、カラーの撮像素子であり、検体から反射した反射光を受光することにより検体の反射像を撮像して画像信号を出力する。イメージセンサ48は、例えばCCD(Charge Coupled Device)イメージセンサやCMOS(Complementary Metal-Oxide Semiconductor)イメージセンサである。また、イメージセンサ48は、撮像面にRGBカラーフィルタが設けられたRGB画素を有しており、RGBの各色の画素で光電変換をすることによってR,G,Bの三色の画像信号を出力する。
図5に示すように、Bカラーフィルタは380~560nmの分光透過率を有しており、Gカラーフィルタは450~630nmの分光透過率を有しており、Rカラーフィルタは580~760nmの分光透過率を有している。したがって、通常観察モード時に第2白色光が検体内に照射された場合には、B画素には第2青色レーザ光と第2蛍光の緑色成分の一部が入射し、G画素には第2蛍光の緑色成分の一部が入射し、R画素には第2蛍光の赤色成分が入射する。但し、第2青色レーザ光は第2蛍光よりも発光強度が極めて大きいのでB画素から出力するB画像信号の大部分は第2青色レーザ光の反射光成分で占められている。
一方、特殊観察モード時に第1白色光が検体内に照射された場合には、B画素には第1青色レーザ光と第1蛍光の緑色成分の一部が入射し、G画素には第1蛍光の緑色成分の一部が入射し、R画素には第1蛍光の赤色成分が入射する。但し、第1青色レーザ光は第1蛍光よりも発光強度が極めて大きいので、B画像信号の大部分は第1青色レーザ光の反射光成分で占められている。なお、特殊観察モード時に第2白色光が検体内に照射されたときのRGB各画素での光入射成分は、通常観察モードの場合と同様である。
なお、イメージセンサ48としては、撮像面にC(シアン),M(マゼンタ),Y(イエロー)及びG(グリーン)の補色フィルタを備えた、いわゆる補色イメージセンサを用いても良い。イメージセンサ48として補色イメージセンサを用いる場合は、CMYGの四色の画像信号からRGBの三色の画像信号に色変換する色変換部を、内視鏡12、光源装置14またはプロセッサ装置16のいずれかに設けておけば良い。こうすれば補色イメージセンサを用いる場合でも、CMYGの4色の画像信号から色変換によってRGB3色の画像信号を得ることができる。
撮像制御部49はイメージセンサ48の撮像制御を行う。図6に示すように、イメージセンサ48の1フレームの期間は、検体からの反射光を光電変換して電荷を蓄積する蓄積期間と、その後に蓄積した電荷を読み出して画像信号を出力する読出期間とからなる。通常観察モード時には、1フレームの期間毎に、第2白色光で照明された検体内をイメージセンサ48で撮像する。これにより、1フレーム毎にイメージセンサ48からRGBの各画像信号が出力される。
撮像制御部49は、特殊観察モード時も、通常観察モード時と同様にしてイメージセンサ48に電荷の蓄積と画像信号の出力を行わせる。但し、特殊観察モード下ではイメージセンサ48の撮像のフレームに同期して第1白色光と第2白色光が交互に検体内に照射されるので、図7に示すように、イメージセンサ48は、1フレーム目に第1白色光によって照明された検体内を撮像し、次の2フレーム目では第2白色光によって照明された検体内を撮像する。イメージセンサ48は、1フレーム目,2フレーム目ともRGBの各色の画像信号を出力するが、依拠する白色光のスペクトルが異なるので、以下では区別のために、1フレーム目に第1白色光によって照明された検体を撮像して得られるRGB各色の画像信号をそれぞれR1画像信号,G1画像信号,B1画像信号といい、2フレーム目に第2白色光によって照明された検体を撮像して得られるRGB各色の画像信号をR2画像信号,G2画像信号,B2画像信号という。
なお、酸素飽和度の算出には、B1画像信号とG2画像信号の信号比B1/G2と、R2画像信号とG2画像信号の信号比R2/G2が用いられる。これらのうち、酸素飽和度の算出に必須な信号比は、B1画像信号とG2画像信号の信号比B1/G2である。このため、本実施形態では、第1白色光中のB1画像信号になる成分(蛍光体44を透過した第1青色レーザ光)が第1信号光であり、第2白色光中のG2画像信号になる成分(第2蛍光の緑色帯域成分)が第2信号光である。
イメージセンサ48から出力される各色の画像信号は、CDS(correlated double sampling)/AGC(automatic gain control)回路50に送信される(図2参照)。CDS/AGC回路50は、イメージセンサ48から出力されるアナログの画像信号に相関二重サンプリング(CDS)や自動利得制御(AGC)を行う。CDS/AGC回路50を経た画像信号は、A/D変換器52によってデジタル画像信号に変換される。こうしてデジタル化された画像信号はプロセッサ装置16に入力される。
プロセッサ装置16は、受信部54と、画像処理切替部60と、通常観察画像処理部62と、観察距離測定部63と、特殊観察用画像処理部64と、画像表示信号生成部66とを備えている。受信部54は、内視鏡12から入力される画像信号を受信する。受信部54はDSP(Digital Signal Processor)56とノイズ除去部58を備えており、DSP56は、受信した画像信号に対して色補正処理等のデジタル信号処理を行う。ノイズ除去部58は、DSP56で色補正処理等が施された画像信号に対して、例えば移動平均法やメディアンフィルタ法等によるノイズ除去処理を施す。ノイズが除去された画像信号は、画像処理切替部60に入力される。
画像処理切替部60は、モード切替SW22bが通常観察モードにセットされている場合には、画像信号を通常観察画像処理部62に入力する。一方、モード切替SW22bが特殊観察モードに設定されている場合、画像処理切替部60は、画像信号を観察距離測定部63と特殊観察用画像処理部64に入力する。
通常観察画像処理部62は、色変換部68と、色彩強調部70と、構造強調部72とを有する。色変換部68は、入力された1フレーム分のRGBの各画像信号を、それぞれR画素、G画素、B画素に割り当てたRGB画像データを生成する。そして、RGB画像データに対して、さらに3×3のマトリックス処理、階調変換処理、3次元LUT処理等の色変換処理を施す。
色彩強調部70は、色変換処理済みのRGB画像データに対して、各種色彩強調処理を施す。構造強調部72は、色彩強調処理済みのRGB画像データに対して、空間周波数強調等の構造強調処理を施す。構造強調部72で構造強調処理が施されたRGB画像データは、通常観察画像として画像表示信号生成部66に入力される。
観察距離測定部63は、画像信号に基づいて検体と先端部24との距離(観察距離)を測定する。観察距離測定部63が算出した観察距離は、特殊観察画像処理部64(酸素飽和度生成部76)に入力される。なお、ズームレンズ47を駆動して拡大観察を行う場合は、先端部24と検体との距離は自体は変わらないが、先端部24を検体に近づけた場合と同様に検体が拡大して観察される。このため、ズームレンズ47を駆動した拡大観察は、先端部24を検体に近づけるのと実質的に同じ作用がある。このため、観察距離測定部63が測定する観察距離には、ズームレンズ47を駆動した拡大観察時のズーム倍率に基づく実質的な観察距離を含む。
特殊観察画像処理部64は、酸素飽和度画像生成部76と、構造強調部78とを有する。酸素飽和度画像生成部76は、酸素飽和度を算出するとともに、算出した酸素飽和度を表す酸素飽和度画像を生成する。また、酸素飽和度画像生成部76は、観察距離に応じて補正した酸素飽和度を算出する。このため、酸素飽和度画像生成部76が算出する酸素飽和度は、観察距離が変化した場合でも正確性が高い値になっている。
構造強調部78は、酸素飽和度画像生成部76から入力される酸素飽和度画像に対して、空間周波数強調処理等の構造強調処理を施す。構造強調部72で構造強調処理が施された酸素飽和度画像は、画像表示信号生成部66に入力される。
表示用画像信号生成部66は、通常観察画像または酸素飽和度画像を表示用形式の信号(表示用画像信号)に変換し、モニタ18に入力する。これにより、モニタ18には通常観察画像または酸素飽和度画像が表示される。
図8に示すように、観察距離測定部63は、周波数情報抽出部81と差分算出部82と観察距離算出部83とを備える。
周波数情報抽出部81は、酸素飽和度の算出に用いられるB1画像信号、G2画像信号、及びR2画層信号を取得して、周波数成分情報を抽出する。具体的には、取得した各画像信号をフーリエ変換し、その振幅P(B1),P(G2),及びP(R2)を算出し、これらの各振幅P(B1),P(G2),P(R2)から特定周波数成分の振幅を抽出する。特定周波数成分とは、例えば、先端部24を検体に接近させることにより、観察距離が短い近景での観察をする場合に主な観察対象になる表層血管や腺管構造等に対応する周波数成分である。
差分算出部82は、周波数成分情報抽出部81が抽出した振幅P(B1),P(G2),P(R2)の特定周波成分の差を算出する。すなわち、B1画像信号とG2画像信号の特定周波数成分の振幅の差ΔBG(=P(B1)-P(G2))、G2画像信号とR2画像信号の特定周波数成分の振幅の差ΔGR(=P(G2)-P(R2))、R2画像信号とB1画像信号の特定周波数成分の振幅の差ΔRB(=P(R2)-P(B1))をそれぞれ特定周波数成分について算出する。
例えば、図9に示すように、観察距離が長い遠景での観察の場合に得られるB1画像信号(遠景),G2画像信号(遠景),及びR2画像信号(遠景)では、表層血管等の細かな像は見られない。このため、表層血管等に対応する特定周波数ωVの振幅の差ΔBG,ΔGR,ΔRBにはほとんど違いはない。なお、図9では、便宜上、任意方向に沿ったフーリエ変換による振幅を表しているが、周波数成分情報抽出部84が行うフーリエ変換は2次元フーリエ変換である。また周波数成分情報抽出部81は、特定周波数ωVの振幅値を抽出する。差分算出部85が算出する各振幅の差ΔBG,ΔGR,ΔRBは、この特定周波数ωVにおける各振幅P(B1),P(G2),P(R2)のピーク値の差である。
一方、図10に示すように、先端部24を検体に近づけることにより(あるいはズームレンズ47によって拡大観察をすることにより)得られるB1画像信号(近景)には、表層血管等の細かな像が表れる。但し、G2画像信号(近景)に表れる像は、B1画像信号(近景)よりもぼやけている。また、R2画像信号(近景)では、G2画像信号(近景)に表れる像よりもさらにぼやけている。このような各色の画像信号に表れる像のぼけ具合の違いは、検体内への光の深達度や検体による吸収(特にヘモグロビンの吸光)及び散乱等が、波長帯域毎に異なるためである。このため、各振幅P(B1),P(G2),P(R2)は、観察距離が近い場合(近景の場合)の表層血管等に対応する特定周波数ΩVにおいて、顕著な差が生じるようになり、各振幅の差ΔBG,ΔGR,ΔRBにも違いが出てくる。このため、各振幅の差ΔBG,ΔGR,ΔRBは、各色間の像のぼけ具合のバランスを表している。
なお、観察距離が短くなると、表層血管等も太く(大きく)見えるようになるので、表層血管等に対応する特定周波数ΩVは、遠景時の周波数ωVよりも低周波数側にシフトしている。拡大観察時の各振幅P(B1),P(G2),P(R2)は、観察距離が長い遠景のものに比べて全体的に概ね低周波数側にシフトしたものなので、観察距離が短い場合の特定周波数ωVと拡大観察時の特定周波数ΩVとの対応関係は、各振幅P(B1),P(G2),P(R2)の全体的な波形から容易に検出することができる。
観察距離が一定の場合には、波長に応じた像のぼけ具合もほぼ一定なので、上記各振幅の差ΔBG,ΔGR,ΔRBも、ズーム倍率や先端部24と検体との距離に応じた特定値になる。観察距離算出部83は、この事実を利用して、各振幅の差ΔBG,ΔGR,ΔRBに基づいて観察距離を算出する。
但し、特定の組織を観察しやすくするために検体内に着色剤を投入(散布や投与)した場合には、これらの着色剤の存在によって特定周波数ΩVの振幅のバランスが崩れ、各振幅の差ΔBG,ΔGR,ΔRBのバランスも崩れる。
内視鏡による検査では着色剤(色素液)として例えばインジゴカルミンが検体内に散布される場合がある。インジゴカルミンは、図11に示す吸収スペクトルを有する紺色(濃青色)の着色剤である。インジゴカルミンを検体内に散布すると腺管構造(ピットパターン)に溜まるので、腺管構造が紺色に着色されて強調される。そして、この強調された腺管構造のパターン(分布や密度)によって病変の凹凸が観察しやすくなる。一方、インジゴカルミンはほぼ腺管構造にだけ溜まるので、これに対応する特定周波数ΩVにおいて各色の画像信号の振幅のバランスが崩れる。具体的には、B1画像信号では特定周波数ΩVの振幅が大きくなり、G2画像信号及びR2画像信号では特定周波数ΩVの振幅が小さくなるので、これに応じて各振幅の差ΔBG,ΔGR,ΔRBも、インジゴカルミンを散布しない場合の特定値から変化する。
なお、インジゴカルミンは上記のいわゆるコントラスト法に用いられるが、インジゴカルミンの他にも、特定の組織を染色して強調する染色法ではトルイジンブルーやメチレンブルーが用いられる。また、特定の組織との反応によって強調観察をする反応法では、複方ヨードグリセリン(ルゴール液)やクリスタルバイオレットが用いられ、蛍光で特定組織を強調観察する蛍光法では、フルオレスチンやアクリジンオレンジが用いられる。また、血管内に投与して組織の強調を行う血管内色素投与法では例えばインドシアニングリーンが用いられる。この他、酢酸の散布により、検体の表層組織を白色化させる強調法もある。こうした各種着色剤等を検体に投入(散布、あるいは投与)した場合、上記インジゴカルミンを散布した場合と同様に、各色の画像信号のバランス(特に特定周波数ΩVの振幅のバランス)が、これらを投入しない場合と比較して変動する。もちろん、変動の仕方は投入した着色剤等によって異なる。
こうしたことから、観察距離測定部63は、第1測定モードと第2測定モードの2つの観察距離を測定するための測定モードを切り替え自在に有しており、各測定モードに対応して観察距離算出部83は、通常用距離テーブル83aと着色時用距離テーブル83bを有している。
第1測定モードは、着色剤等が検体に投入されておらず、ほぼヘモグロビンの吸光特性だけで検体を観察する場合、すなわち、通常の観察環境の場合に観察距離を算出するモードである。通常時用距離テーブル83aはこの第1測定モードで使用されるテーブルであり、図12に示すように、通常時の各振幅の差ΔBG,ΔGR,ΔRBとそのバランスに応じた観察距離を対応付けるテーブルである。観察距離算出部83は、通常の観察時には、通常時用距離テーブル83aを参照し、差分算出部82から入力される各振幅の差ΔBG,ΔGR,ΔRBに対応する観察距離を算出する。
第2測定モードは、ヘモグロビン以外に、各色の画像信号のバランスを変化させるような支配的な吸光特性を有する着色剤等の物質(非ヘモグロビン物質)が検体内に存在し、各色の画像信号及びその特定周波数の振幅のバランスが、投入された着色剤等の吸光特性によって変動している場合(以下、着色時という)に観察距離を算出するモードである。着色時用距離テーブル83bは、この第2測定モードで使用されるテーブルであり、図13に示すように、着色時の各振幅の差ΔBG,ΔGR,ΔRBとそのバランスに応じた観察距離を対応付けるテーブルである。観察距離算出部83は、検体が着色剤等によって着色された場合には、着色時用距離テーブル83bを参照し、差分算出部82から入力される各振幅の差ΔBG,ΔGR,ΔRBに対応する観察距離を算出する。
なお、通常時用距離テーブル83aと着色時用距離テーブル83bを比較すると、例えば、観察距離が同じ場合でも、着色剤の有無によって、対応する各振幅の差ΔBG,ΔGR,ΔRBは異なる。逆に、各振幅の差ΔBG,ΔGR,ΔRBの値(バランス)が同じ値でも、着色剤の有無によって、対応する観察距離は異なる。
図14に示すように、酸素飽和度画像生成部76は、信号比算出部84と、相関関係記憶部85と、酸素飽和度算出部86と、補正部87、画像生成部88と、を備えている。
信号比算出部84には、酸素飽和度画像生成部76に入力される2フレーム分の画像信号のうち、B1画像信号、G2画像信号、及びR2画像信号が入力される。信号比算出部84は、B1画像信号とG2画像信号の信号比B1/G2と、G2画像信号とR2画像信号の信号比R2/G2とを、画素毎に算出する。
相関関係記憶部85は、信号比B1/G2及び信号比R2/G2と、酸素飽和度の相関関係を記憶している。この相関関係は、図15に示す二次元空間上に酸素飽和度の等値線を定義した2次元テーブルで記憶されている。信号比B1/G2及び信号比R2/G2に対する等値線の位置及び形状は、光散乱の物理的なシミュレーションによって予め得られ、各等値線の間隔は、血液量(信号比R2/G2)に応じて変化する。なお、信号比B1/G2及び信号比R2/G2と、酸素飽和度との相関関係はlogスケールで記憶されている。
なお、上記相関関係は、図16に示すように、酸化ヘモグロビン(グラフ90)や還元ヘモグロビン(グラフ91)の吸光特性や光散乱特性と密接に関連し合っている。例えば、第1青色レーザ光の中心波長473nmのように、酸化ヘモグロビンと還元ヘモグロビンの吸光係数の差が大きい波長では、酸素飽和度の情報を取り扱いやすい。しかしながら、473nmの光に対応する信号を含むB1画像信号は、酸素飽和度だけでなく、血液量にも依存度が高い。そこで、B1画像信号に加え、主として血液量に依存して変化する光に対応するR2画像信号と、B1画像信号とR2画像信号のリファレンス信号となるG2画像信号から得られる信号比B1/G2及びR2/G2を用いることで血液量に依存することなく、酸素飽和度を正確に算出することができる。
酸素飽和度算出部86は、相関関係記憶部85に記憶された相関関係を参照し、信号比算出部84で算出された信号比B1/G2及び信号比R2/G2に対応する酸素飽和度を画素毎に算出する。例えば、特定画素における信号比B1/G2及び信号比R2/G2がそれぞれB1*/G2*及びR2*/G2*である場合、図17に示すように、相関関係を参照すると、信号比B1*/G2*及び信号比R2*/G2*に対応する酸素飽和度は「60%」である。したがって、酸素飽和度算出部86は、この画素の酸素飽和度を「60%」と算出する。このように、酸素飽和度算出部86は、同一の画素から出力される画像信号の信号比に基づいて検体の酸素飽和度を画素毎に算出する。
なお、信号比B1/G2及び信号比R2/G2が極めて大きくなったり、極めて小さくなったりすることはほとんどない。すなわち、信号比B1/G2や信号比R2/G2の値が、酸素飽和度0%の下限ライン93を上回ったり、反対に酸素飽和度100%の上限ライン94を下回ったりすることはほとんどない。但し、算出する酸素飽和度が下限ライン93を下回ってしまった場合には酸素飽和度算出部83は酸素飽和度を0%とし、上限ライン94を上回ってしまった場合には酸素飽和度を100%とする。また、信号比B1/G2及び信号比R2/G2に対応する点が下限ライン93と上限ライン94の間から外れた場合には、その画素における酸素飽和度の信頼度が低いことが分かるように表示をしても良いし、酸素飽和度を算出しないようにしても良い。
補正部87は、観察距離測定部63で測定(算出)された観察距離が入力され、入力された観察距離に応じて酸素飽和度算出部86で算出された酸素飽和度の誤差を補正する。補正部87は、観察距離測定部63の第1,第2測定モードに対応して、通常時用誤差テーブル87aと着色時用誤差テーブル87bとを有し、これらの各誤差テーブル87a,87bを用いて酸素飽和度の誤差を補正する。
図18に示すように、通常時用誤差テーブル87aは、着色剤等が検体に投入されていない場合の観察距離と、この観察距離のもとで算出される酸素飽和度の誤差とが対応付けられたデータである。補正部87は、まず、通常時用誤差テーブル87aを参照することにより、差分算出部82から取得する各振幅の差ΔBG,ΔGR,ΔRBに対応する酸素飽和度の誤差を算出する。そして、酸素飽和度算出部86が算出した酸素飽和度のデータに、誤差を除く補正処理を施す。例えば、誤差が+10%になる画素では、対応する酸素飽和度の値から、誤差を減算(-10%)する。なお、通常時用誤差テーブル87aに記憶された各振幅の差ΔBG,ΔGR,ΔRBと酸素飽和度の誤差との対応関係にばらつきがある場合、さらに最尤法等によって最も尤もらしい酸素飽和度の誤差を推定して酸素飽和度の補正処理を行う。
着色剤等が検体に投入されていない通常時には、例えば、第1白色光や第2白色光が検体に均一に照射されているとみなせないほど、ズーム倍率を上げる、又は先端部24を検体に極めて近接させることによって、酸素飽和度に誤差が生じることがある。酸素飽和度の算出は、第1白色光や第2白色光が均一に照射されていることを前提としているので、第1白色光や第2白色光の不均一性が目立つようになると、これに応じてB1画像信号,G2画像信号,及びR2画像信号のバランスが崩れる。その結果、算出する酸素飽和度には、観察距離が近すぎる場合に発生する第1白色光や第2白色光の不均一性による誤差(以下、アーチファクトという)が生じる。補正部87が通常時用誤差テーブル87aを用いて行う通常時の補正処理は、このアーチファクトを補正するための補正処理である。
図19に示すように、着色時誤差テーブル87bは、着色剤等が検体に投入された場合の観察距離と、この観察距離のもとで算出される酸素飽和度の誤差とが対応付けられたデータである。通常時誤差テーブル87aと着色時誤差テーブル87bには、同じ観察距離に対して酸素飽和度の誤差が記憶されているが、着色剤の有無によって、対応する酸素飽和度の誤差は異なる。
検体を着色した場合には投入した着色剤に応じて特定の組織が通常とは異なる色で観察されるので、着色された組織の部分で、酸素飽和度を算出するための信号比B1/G2及び信号比R2/G2の値が通常時とは異なる値になってしまう。そのため、酸素飽和度が正しく算出されない。すなわち、酸素飽和度には着色剤を投入したことによる誤差が含まれている。補正部87が着色時用誤差テーブル87bを用いて行う補正処理は、このように検体内に着色剤が存在することによる酸素飽和度の誤差を補正するための補正処理である。また、検体内に着色剤が存在しない場合に観察距離に応じて表れるアーチファクトは、同様の観察距離の条件を満たせば検体内に着色剤が存在する場合でも同様に表れる。補正部87が着色時用誤差テーブル87bを用いて行う補正処理によれば、こうしたアーチファクトも同時に補正される。なお、補正部87による補正処理の方法は、着色時誤差テーブル87bを用いる場合も、用いるテーブルが異なるだけで、通常時用誤差テーブル87aを用いる場合と同様である。
画像生成部88は、補正部87で誤差が補正された酸素飽和度(以下、補正酸素飽和度という)と、B2画像信号、G2画像信号、及びR2画像信号を用いて、酸素飽和度を画像化した酸素飽和度画像を生成する。具体的には、画像生成部88は、入力される元のB2画像信号,G2画像信号,及びR2画像信号に対して、補正酸素飽和度に応じたゲインを画素毎に施し、ゲインを施したB2画像信号,G2画像信号,及びR2画像信号を用いてRGB画像データを生成する。例えば、画像生成部88は、補正酸素飽和度が60%以上の画素ではB2画像信号,G2画像信号,及びR2画像信号のいずれにも同じゲイン「1」を乗じる。これに対して、補正酸素飽和度が60%未満の画素では、B2画像信号に対して「1」未満のゲインを乗じ、G2画像信号及びR2画像信号に対しては「1」以上のゲインを乗じる。このゲイン処理後のB2画像信号,G2画像信号,及びR2画像信号を用いて生成されたRGB画像データが酸素飽和度画像である。
画像生成部88が生成した酸素飽和度画像では、高酸素の領域(酸素飽和度が60~100%の領域)では、通常観察画像と同様の色で表される。一方、酸素飽和度が特定値を下回る低酸素の領域(酸素飽和度が0~60%の領域)は、通常観察画像とは異なる色(疑似カラー)で表される。
なお、本実施形態では、画像生成部84は、低酸素の領域のみ疑似カラー化するゲインを乗じているが、高酸素領域でも酸素飽和度に応じたゲインを施し、酸素飽和度画像の全体を疑似カラー化しても良い。また、低酸素領域と高酸素領域を酸素飽和度60%で分けているがこの境界も任意である。
内視鏡システム10が、観察距離算出部83に予め記憶する通常時用距離テーブル83a及び着色時用距離テーブル83bと、補正部87に予め記憶する通常時用誤差テーブル87a及び着色時用誤差テーブル87bは、例えば図20に示すファントム(検体を模した模擬体)89を、内視鏡システム10によって測定することにより作成される。ファントム89は、例えば、酸素飽和度が特定値に制御された血液が入ったゼラチン(以下、血液入りゼラチンという)89aと、血液が入っていないゼラチン(以下、血液無しゼラチンという)89bとを検体の表層血管とほぼ同じ特定空間周波数で積層して形成される。病変等の異常がない場合、静脈血の酸素飽和度は概ね60~80%なので、血液入りゼラチン89aの酸素飽和度は、例えば70%に制御される。
通常時用距離テーブル83aと通常時用誤差テーブル87aの作成は以下の手順で行われる。まず、ファントム89をズーム倍率や先端部24との距離を変えながら観察し、酸素飽和度を算出する。また、周波数成分情報抽出部81及び差分算出部82によって、ファントム89を観察して得られるB1画像信号,G2画像信号,及びR2画像信号をフーリエ変換して、ファントム89の空間周波数の振幅を抽出し、これらの各振幅の差ΔBG,ΔGR,ΔRBを算出する。
例えば、ズームせず、先端部24を十分にファントム89から離した所定の観察距離で観察をした場合には、各振幅の差ΔBG,ΔGR,ΔRBはほぼ一定値であり、かつ、酸素飽和度の誤差もほぼ零(酸素飽和度70%)である。一方、ズームしたり、先端部24をファントム89に近づけたりして観察距離を短くすると、ズーム倍率、または先端部24とファントム89の距離、あるいはこれらの組み合わせ方によっては、各振幅の差ΔBG,ΔGR,ΔRBが特定値よりも大きく(あるいは小さく)なる場合がある。この場合、算出される酸素飽和度も血液入りゼラチン89aの酸素飽和度70%よりも大きく、あるいは逆に小さい値になって、誤差が生じる。
観察距離を変えながらこうした測定を繰り返し行うことにより、図21に示すように、各振幅の差ΔBG,ΔGR,ΔRBと、観察距離と、酸素飽和度の誤差とを対応付ける測定データ96が得られる。この測定データ96のうち、各振幅の差ΔBG,ΔGR,ΔRBと対応する観察距離の部分を記憶したテーブルが通常時用距離テーブル83aであり、観察距離と対応する酸素飽和度の誤差の部分を記憶したテーブルが通常時用誤差テーブル87aである。
着色時用距離テーブル83bと着色時用誤差テーブル87bの作成方法も、上記通常時用距離テーブル83aと通常時用誤差テーブル87aの作成方法と同様であり、ファントム89を用いて行われる。但し、着色時用距離テーブル83bと着色時用誤差テーブル87bの作成時には、検体内に投入するのと同様にファントム89の表面に着色剤を散布し(あるいは注入し)、観察距離を変化させながら、各振幅の差ΔBG,ΔGR,ΔRBと、観察距離と、酸素飽和度の誤差を測定する。着色剤を散布して得られる測定データのうち、各振幅の差ΔBG,ΔGR,ΔRBと対応する観察距離の部分を記憶したテーブルが着色時用距離テーブル83bであり、観察距離と対応する酸素飽和度の誤差の部分を記憶したテーブルが着色時用誤差テーブル87bである。
次に、本実施形態の内視鏡システム10による観察の流れを図22のフローチャートに沿って説明する。まず、通常観察モードにおいて、最も遠景の状態からスクリーニングを行う(S10)。通常観察モードでは、通常観察画像がモニタ18に表示される。このスクリーニング時に、ブラウニッシュエリアや発赤等の病変の可能性がある部位(以下、病変可能性部位という)を発見した場合(S11)には、モード切替SW22bを操作して、特殊観察モードに切り替える(S12)。そして、この特殊観察モードにおいて、病変可能性部位が低酸素状態になっているか否かの診断を行う。
特殊観察モードでは、第1及び第2白色光がイメージセンサ48の撮像フレームに同期して交互に検体内に照射されるので、第1白色光が照射されたフレームではイメージセンサ48はR1画像信号,G1画像信号,及びB1画像信号を出力し、第2白色光が照射されたフレームではR2画像信号,G2画像信号,及びB2画像信号を出力する。
そして、これらの2フレーム分の画像信号を用いて、まず観察距離測定部63が観察距離の測定を行われる。具体的には、周波数成分情報抽出部81においてB1画像信号、G2画像信号、及びR2画像信号はフーリエ変換され、例えば表層血管に対応する特定周波数成分の振幅(周波数成分情報)がそれぞれ抽出される(S13)。次いで、差分算出部82で各画像信号から抽出された特定周波数成分の振幅の差ΔBG,ΔGR,ΔRBが算出される(S14)。
そして、観察距離算出部83において、この振幅の差ΔBG,ΔGR,ΔRBに基づいて観察距離が算出される(S15)。この観察距離の算出は、医師がプロセッサ装置16によって着色剤を投入することを示す設定をした場合には、観察距離測定部63の測定モードは第2測定モードに設定され、観察距離算出部83では着色時用距離テーブル83bが用いられる。それ以外の場合には、観察距離測定部63の測定モードは第1測定モードに設定され、観察距離算出部83では通常時用距離テーブル83aが用いられる。このため、検体内に着色剤が存在するか否かに関わらず、正確な観察距離が算出される。
一方、酸素飽和度画像生成部76では、酸素飽和度が算出され、酸素飽和度画像が生成される(S16~S19)。具体的には、信号比算出部84によって信号比B1/G2及び信号比R2/G2が画素毎に算出される(S16)。そして、酸素飽和度算出部86において、これらの信号比B1/G2及び信号比R2/G2に基づいて、画素毎に酸素飽和度が算出される(S17)。
その後、補正部87は、観察距離算出部83が算出した観察距離に対応する酸素飽和度の誤差を求め、酸素飽和度算出部83が算出した酸素飽和度に、求めた誤差を除去する補正処理をし、補正酸素飽和度を算出する(S18)。この補正処理の方法は、観察距離測定部63の測定モードに連動しており、観察距離測定部63が着色時用の第2測定モードで動作した場合には、着色時用誤差テーブル87bを用いて行われ、観察距離測定部63が通常時用の第1測定モードで動作した場合には、通常時用誤差テーブル87aが用いられる。このため、検体内に着色剤が存在するか否かに関わらず、正確な補正処理が行われる。
補正部87で補正酸素飽和度が算出されると、画像生成部88でB2画像信号、G2画像信号、R2画像信号に補正酸素飽和度に応じたゲインを施した酸素飽和度画像が生成され(S19)、モニタ18に表示される(S20)。ドクターはモニタ18に表示された酸素飽和度画像に基づいて、病変可能性部位が低酸素状態になっているかどうかを確認する。
例えば、検体内に着色剤を投入せず、かつ、遠景で観察をした場合、図23に示すように、遠景の酸素飽和度画像101で病変可能性部位が低酸素領域102になっていることが確認され、医師は先端部24を低酸素領域102に近づけ(あるいはズームし)、この低酸素領域102を拡大観察したとする。この場合、補正部87による酸素飽和度の補正処理を行わないと、酸素飽和度画像103のように、算出した酸素飽和度にアーチファクト104が表れるので、検体を拡大したことによって誤った(あるいは不正確な)領域が低酸素状態を示す擬似カラーで表示されてしまう。また、本来の低酸素領域102に高酸素飽和度のアーチファクトが重畳されると、遠景での観察時に観察されていた低酸素領域102すら観察し難くなってしまう場合もある。
しかし、内視鏡システム10では、第1白色光や第2白色光が均一であることを前提に酸素飽和度算出部86が算出した酸素飽和度をそのまま酸素飽和度画像の生成に用いるのではなく、酸素飽和度算出部86が算出した酸素飽和度に対して補正部87が観察距離に応じた補正処理を行なってから酸素飽和度画像の生成に用いている。このため、例えば酸素飽和度画像105のように、遠景で観察されていた低酸素領域102が誤差なくそのまま拡大表示される。このため、内視鏡システム10では、正確な酸素飽和度の情報を表示することができる。
また、例えば、着色剤を検体内に投入して酸素飽和度画像101と同じ位置を観察する場合、図24に示すように、通常観察モードでは、特定の組織等111が着色された通常観察画像110がモニタ18に表示される。その後、観察距離を保ったまま、特殊観察モードに切り替えたとする。この時、着色剤が検体内に存在しない場合用の第1測定モードで観察距離を算出し、酸素飽和度を算出及び補正すると、酸素飽和度画像112のように、特定の組織111が着色されたことによって、各色の画像信号のバランスが崩れるので、誤った(あるいは不正確な)部分が低酸素領域113として疑似カラーで表示されてしまう。これは、観察距離を算出せず、観察距離に応じた酸素飽和度の補正を行わない場合も同様である。
しかし、内視鏡システム10では、プロセッサ装置16で着色剤を検体内に投入することを示す設定をすれば、着色時用の第2測定モードで観察距離が算出され、この第2測定モードで求められた正確な観察距離に基づいて酸素飽和度の補正が行われる。このため、例えば、酸素飽和度画像116のように、特定の組織111が着色されていても、酸素飽和度画像101と同じ正しい低酸素領域102が表示される。また、先端部24を検体に近づけて(あるいはズームをして)、観察距離を短くし、低酸素領域102を拡大した場合でも、着色時用の第2測定モードで観察距離が算出され、この第2測定モードで求められた正確な観察距離に基づいて酸素飽和度の補正が行われているので、酸素飽和度画像118のように、特定の組織111が着色されていても、酸素飽和度画像105と同様にアーチファクト104が表れることはなく、低酸素領域102の周辺を正しく拡大観察することができる。
なお、こうした酸素飽和度(酸素飽和度画像)の表示は、通常観察モードに切り替えられるまで継続して行われる(S21)。また、診断を終了する場合には、内視鏡12の挿入部21を検体内から抜き出す(S22)。
以上のように、内視鏡システム10は、イメージセンサ48から得られる画像信号に基づいて観察距離の測定を行う。このため、観察距離を測定するための干渉計等を追加する必要がない。このため、低コストに生産可能であり、かつ、設計の自由度も低下しない。
また、観察距離の測定モードとして、検体内に着色剤が存在しない場合に観察距離を算出する第1測定モードと、検体内に着色剤が存在する場合に観察距離を測定する第2測定モードとを有しており、着色剤を検体内に投入する場合には、着色剤を投入した場合に適切な第2測定モードで観察距離の測定を行う。このため、内視鏡システム10は、着色剤の投入により特定の組織が着色され、着色剤を投入しない通常時に対して各色の画像信号のバランスが崩れてしまったとしても、正確に観察距離を算出することができる。
さらに、内視鏡システム10は、この正確性の高い観察距離に基づいて酸素飽和度を補正し、この補正された酸素飽和度を用いて酸素飽和度画像を生成及び表示するので、着色剤で着色された組織の存在により、着色剤を投入しない通常時に対して各色の画像信号のバランスが崩れてしまったとしても、正確な酸素飽和度画像を生成及び表示することができる。
なお、観察距離を算出するための通常時用距離テーブル83a及び着色時用距離テーブル83bに、各振幅の差ΔBG,ΔGR,ΔRBと、これらに対応する観察距離を記憶しているが、必ずしも各振幅の差ΔBG,ΔGR,ΔRBを全て用いる必要はなく、これらのうちのいずれか一つ以上を用いることで上記第1実施形態と同様にして正確な観察距離を算出することができる。例えば振幅の差ΔBG(B1画像信号とG2画像信号のぼけ具合のバランス)と、対応する観察距離だけを用いても良い。
なお、上記実施形態では、B1画像信号,G2画像信号,R2画像信号の特定周波数ΩV成分の振幅の差ΔBG,ΔGR,ΔRBと観察距離を対応付けた距離テーブル83a,83bを用いているが、B1画像信号,G2画像信号,R2画像信号の特定周波数ΩV成分の振幅の差ΔBG,ΔGR,ΔRBの代わりに、特定周波数ΩV成分の振幅の比を用いても良い。また、上記実施形態では、表層血管の周波数を特定周波数ΩVとしているが、どのような組織の周波数を特定周波数とするかは任意である。
なお、上記実施形態では、遠景で低酸素領域102が確認された後、その低酸素領域102の拡大観察をしているが、遠景の酸素飽和度画像において低酸素領域102を検出しない場合でも、拡大観察をしてもよい。この場合、拡大観察をしてはじめて低酸素領域が観察されることがあるが、内視鏡システム10は正確な観察距離を算出し、算出した正確な観察距離に応じて酸素飽和度の補正を行っているので、拡大観察をしてはじめて低酸素領域が観察される場合でも、正確な酸素飽和度の算出及び表示をすることができる。
なお、上記実施形態では、通常時用距離テーブル83aまたは着色時用距離テーブル83bを用いて観察距離を算出しているが、こうしたテーブル形式のデータの代わりに、周波数成分情報を観察距離に対応付ける関数を用いても良い。例えば、通常時用距離テーブル83aに対応する第1測定モード用の第1距離算出関数と、着色時用距離テーブル83bに対応する第2測定モード用の第2距離算出関数とを、これらの各距離テーブル83a,83bの代わりに予め用意し、演算により観察距離を算出しても良い。これらの関数は、通常時用距離テーブル83aや着色時用距離テーブル83bからそれぞれ作成することができる。酸素飽和度の補正に用いる通常時用誤差テーブル87aや着色時用誤差テーブル87bについても同様であり、これらのテーブルの代わりに対応する関数を記憶しておいても良い。
なお、上記実施形態では、周波数成分抽出部81は、周波数成分情報としてB1画像信号,G2画像信号,及びR2画像信号から特定周波成分の振幅を抽出しているが、例えば、特定周波数の振幅を抽出する代わりに、特定の幅を持った周波数帯域の振幅を抽出し、その合計値を周波数成分情報として用いても良い。また、振幅だけでなく、位相を加味しても良いし、位相の情報だけを用いても良い。すなわち、周波数成分抽出部81がB1画像信号,G2画像信号,及びR2画像信号から抽出する周波数成分情報は、観察距離と対応付けることができる特定の周波数成分に関する情報であれば任意である。
また、上記実施形態では、周波数成分抽出部81は、B1画像信号,G2画像信号,及びR2画像信号をフーリエ変換することにより、周波数成分情報(特定の周波数成分の振幅)を抽出しているが、フーリエ変換をする代わりに、特定の周波数成分を抽出する画像フィルタ(2次元フィルタ)を用いてB1画像信号,G2画像信号,及びR2画像信号から周波数成分情報を抽出しても良い。もちろん、周波数成分情報を抽出することができれば、フーリエ変換や画像フィルタによる方法以外の任意の方法で周波数成分情報を抽出しても良い。こうした周波数成分抽出部81が抽出する周波数成分情報や、周波数成分情報の抽出方法の任意性は、後述する他の実施形態や変形例についても同様である。
なお、上記実施形態では、検体内に着色剤を投入する場合に第2測定モードで観察距離を測定しているが、内視鏡システム10で検体を観察する場合に用いる着色剤は複数種類ある。また、着色剤の種類によって着色される組織やその色が異なる。このため、上記第1実施形態では、着色時用距離テーブル83b及び着色時用誤差テーブル87bを1つ例示しているが、着色剤の種類ごとに(着色剤を複数併用する場合にはその組み合わせごとに)複数の着色時用距離テーブル及び着色時用誤差テーブルを設けておくことが好ましい。こうすれば、どの種類の着色剤を用いても、内視鏡システム10で正確に観察距離を算出し、正確な酸素飽和度の算出及び表示をすることができる。
なお、上記実施形態では、着色剤を検体内に投入しているが、着色剤を投入する場合以外でも、通常時と比較して各色の画像信号のバランスが崩れ、観察距離や酸素飽和度が正しく求められない場合がある。例えば、検体内を洗浄するための洗浄液(洗浄剤)は、誤飲等を防止するために、通常は着色されている。このため、洗浄液が検体内に残存していると、着色剤を投入した場合のように、各色の画像信号のバランスが崩れ、観察距離や酸素飽和度が正しく求められない。このため、洗浄液等の残存に対応した距離テーブルや誤差テーブルを設けておくことが好ましい。洗浄液等の残存が確認された場合には、この距離テーブル及び誤差テーブルを用いる測定モードに設定することで、正確な観察距離及び酸素飽和度を算出することができる。
また、上記実施形態では、検体内に自然には存在しない着色剤等の非ヘモグロビン物質の投入によって各色の画像信号のバランスが崩れ、観察距離や酸素飽和度が正しく求められないケースを例にしているが、検体内に自然に存在し得る非ヘモグロビン物質によって各色の画像信号のバランスが崩れ、観察距離や酸素飽和度が正しく求められないケースもある。例えば、洗浄液で除去しきれなかった残渣等(便や便汁、その他有色の分泌物等)が検体内にあると、各色の画像信号のバランスが崩れ、観察距離や酸素飽和度が正しく求められない。このため、検体内に自然に存在し得る残渣等に対応した距離テーブルや誤差テーブルを設けておくことが好ましい。残渣等の存在が確認された場合には、この距離テーブル及び誤差テーブルを用いる測定モードに設定することで、正確な観察距離及び酸素飽和度を算出することができる。
なお、通常時の検体は、主として血中に含まれるヘモグロビンの吸光量(あるいは反射量)に応じた各色の画像信号のコントラストで観察される。これに対し、上記着色剤、洗浄液、残渣等はいずれもヘモグロビンの吸光量(反射量)に応じた各色の画像信号のコントラストのバランスを崩す物質である。本明細書では、これらのような各色の画像信号のコントラストのバランスを崩すヘモグロビン以外の物質を非ヘモグロビン物質と総称する。
なお、上記実施形態では、特殊観察モード時に観察距離を測定し、算出した観察距離に基づいて酸素飽和度の補正をしているが、酸素飽和度の算出を行わない通常観察モード時にも観察距離測定部63によって観察距離を測定しても良い。通常観察モード時に算出した観察距離を、通常画像とともにモニタ18に表示すれば、先端部24で検体を傷つけること等がないように、安全な操作をアシストすることができる。
通常観察モード時の観察距離の測定は、上記実施形態と同様に行うことができるが、通常観察モード時の観察距離の測定は、イメージセンサ48が1フレームに出力するR,G,B各色の画像信号を用いて観察距離を算出することができる。すなわち、わずか1フレームで得られる画像信号だけで正確な観察距離の測定が可能である。
なお、上記実施形態では、特殊観察モード時における観察距離の測定に、酸素飽和度の算出に用いるB1画像信号、G2画像信号、及びR2画像信号を用いているが、1フレーム目に得られるB1画像信号、G1画像信号、及びR1画像信号を用いて観察距離の測定を行っても良く、2フレーム目に得られるB2画像信号、G2画像信号、及びR2画像信号を用いて観察距離の測定を行っても良い。こうすれば、特殊観察モード時でも、通常観察モード時の観察距離の測定と同様に、わずか1フレームで得られる画像信号だけで正確な観察距離の測定をすることができる。
なお、上記実施形態では、信号比B1/G2及び信号比R2/G2に基づいて酸素飽和度を算出し、算出された酸素飽和度のデータに補正処理を施しているが、酸素飽和度の算出に用いる画像信号を観察距離に応じて補正し、補正した画像信号を用いて酸素飽和度を算出しても良い。
なお、内視鏡システム10では、内視鏡12の先端部24に蛍光体44を設けたが、これに代えて、光源装置14の内部に蛍光体44を設けても良い。この場合には、第1青色レーザ光源(473LD)34及び第2青色レーザ光源(445LD)36と、ライトガイド41との間に蛍光体44を設ける。そして、第1青色レーザ光源34または第2青色レーザ光源36に、第1青色レーザ光または第2青色レーザ光を蛍光体44に向けて照射させる。これにより、第1白色光または第2白色光が発せられる。この第1または第2白色光は、ライトガイド41を介して、検体内に照射される。それ以外については、内視鏡システム10と同様である。
また、第1及び第2青色レーザ光を同一の蛍光体44に入射させているが、第1青色レーザ光と第2青色レーザ光をそれぞれ別々の第1蛍光体、第2蛍光体に入射させても良い。
[第2実施形態]
図25に示すように、内視鏡システム300の光源装置14には、第1及び第2青色レーザ光源34,36と光源制御部40の代わりに、LED(Light Emitting Diode)光源ユニット301と、LED光源制御部304が設けられている。また、内視鏡システム300の照明光学系24aには蛍光体44が設けられていない。それ以外については、第1実施形態の内視鏡システム10と同様である。
図25に示すように、内視鏡システム300の光源装置14には、第1及び第2青色レーザ光源34,36と光源制御部40の代わりに、LED(Light Emitting Diode)光源ユニット301と、LED光源制御部304が設けられている。また、内視鏡システム300の照明光学系24aには蛍光体44が設けられていない。それ以外については、第1実施形態の内視鏡システム10と同様である。
LED光源ユニット301は、特定の波長帯域に制限された光を発光する光源として、R-LED301a,G-LED301b,B-LED301cを有する。図26に示すように、R-LED301aは、600~720nmの赤色領域の赤色帯域光(以下、単に赤色光という)を発光し、G-LED301bは、480~620nmの緑色領域の緑色帯域光(以下、単に緑色光)を発光する。また、B-LED301cは、400~500nmの青色領域の青色帯域光(以下、単に青色光という)を発光する。
また、LED光源ユニット301は、B-LED301cが発する青色光の光路上に挿抜されるハイパスフィルタ(HPF)302を有する。ハイパスフィルタ302は、450nm以下の波長帯域の青色光をカットし、450nmより長波長帯域の光を透過する。
ハイパスフィルタ302のカットオフ波長(450nm)は、酸化ヘモグロビンと還元ヘモグロビンの吸光係数がほぼ等しい波長であり(図16参照)、この波長を境に酸化ヘモグロビンと還元ヘモグロビンの吸光係数が逆転する。本実施形態の場合、相関関係記憶部85に記憶された相関関係は、酸化ヘモグロビンの吸光係数が還元ヘモグロビンの吸光係数よりも大きい場合のものなので、カットオフ波長以下の波長帯域に基づくシグナルは、信号比B1/G2が473nmで測定する本来の値よりも低下し、不正確な酸素飽和度が算出される原因になる。このため、ハイパスフィルタ302は、酸素飽和度を算出するためのB1画像信号を取得する時に、カットオフ波長以下の波長帯域の光が検体に照射されないようにする。
したがって、ハイパスフィルタ302は、特殊観察モード時にB-LED301cの前に挿入され、通常観察モード時には退避位置に退避される。ハイパスフィルタ302の挿抜は、LED光源制御部304の制御の下、HPF挿抜部303によって行われる。
LED光源制御部304は、LED光源ユニット301の各LED301a~301cの点灯/消灯、及びハイパスフィルタ302の挿抜を制御する。具体的には、図27に示すように、通常観察モードの場合、LED光源制御部304は、各LED301a~301cを全て点灯させ、ハイパスフィルタ302はB-LED301cの光路上から退避させる。
一方、図28に示すように、特殊観察モードの場合、LED光源制御部304は、ハイパスフィルタ302をB-LED301cの光路上に挿入する。そして、1フレーム目は、B-LED301cを点灯させ、R-LED301a及びG-LED301bを消灯させることにより、450nm以下の波長帯域がカットされた青色光を検体内に照射させる。そして、2フレーム目は、R-LED301a、G-LED301b、B-LED301cを全て点灯させ、B-LED301cが発する青色光のうち450nm以下の波長帯域がカットされた青色光と、R-LED301aが発する赤色光と、G-LED301bが発する緑色光からなる白色光を検体内に照射させる。これにより、イメージセンサ48は、1フレーム目には、B1画像信号を出力し、2フレーム目にはR2画像信号,G2画像信号,及びB2画像信号をそれぞれ出力する。したがって、その後の処理は第1実施形態の内視鏡システム10と同様に行うことができる。
なお、本実施形態では、特殊観察モード時の1フレーム目、2フレーム目ともハイパスフィルタ302を挿入したまま検体を撮像しているが、1フレーム目だけハイパスフィルタ302を挿入し、2フレーム目にはハイパスフィルタ302を退避させても良い。また、特殊観察モード時の1フレーム目では、B-LED301cだけを点灯させ、青色光だけを検体に照射しているが、1フレーム目でもR-LED301a及びG-LED301bを点灯させ、R1画像信号及びG1画像信号をイメージセンサ48に出力させても良い。
[第3実施形態]
図29に示すように、内視鏡システム400の光源装置14には、第1及び第2青色レーザ光34,36と光源制御部40の代わりに、広帯域光源401と、回転フィルタ402と、回転フィルタ制御部403とが設けられている。また、内視鏡システム400のイメージセンサ405は、カラーフィルタが設けられていないモノクロの撮像素子である。それ以外については、第1~第3実施形態の内視鏡システムと同じである。
図29に示すように、内視鏡システム400の光源装置14には、第1及び第2青色レーザ光34,36と光源制御部40の代わりに、広帯域光源401と、回転フィルタ402と、回転フィルタ制御部403とが設けられている。また、内視鏡システム400のイメージセンサ405は、カラーフィルタが設けられていないモノクロの撮像素子である。それ以外については、第1~第3実施形態の内視鏡システムと同じである。
広帯域光源401は、例えばキセノンランプ、白色LED等からなり、波長帯域が青色から赤色に及ぶ白色光を発する。回転フィルタ402は、通常観察モード用フィルタ410と特殊観察モード用フィルタ411とを備えており(図30参照)、広帯域光源401から発せられる白色光がライトガイド41に入射される光路上に、通常観察モード用フィルタ410を配置する通常観察モード用の第1位置と、特殊観察モード用フィルタ411を配置する特殊観察モード用の第2位置との間で径方向に移動可能である。この第1位置と第2位置への回転フィルタ402の相互移動は、選択された観察モードに応じて回転フィルタ制御部403によって制御される。また、回転フィルタ402は、第1位置または第2位置に配置された状態で、イメージセンサ405の撮像フレームに応じて回転する。回転フィルタ402の回転速度は、選択された観察モードに応じて回転フィルタ制御部403によって制御される。
図30に示すように、通常観察モード用フィルタ410は、回転フィルタ402の内周部に設けられている。通常観察モード用フィルタ410は、赤色光を透過するRフィルタ410aと、緑色光を透過するGフィルタ410bと、青色光を透過するBフィルタ410cと有する。したがって、回転フィルタ402を通常光観察モード用の第1位置に配置すると、広帯域光源401からの白色光は、回転フィルタ402の回転に応じてRフィルタ410a、Gフィルタ410b、Bフィルタ410cのいずれかに入射する。このため、検体には、透過したフィルタに応じて、赤色光、緑色光、青色光が順次照射され、イメージセンサ405は、これらの反射光を受光することによりそれぞれ検体を撮像して、R画像信号、G画像信号、B画像信号を順次出力する。
また、特殊観察モード用フィルタ411は、回転フィルタ402の外周部に設けられている。特殊観察モード用フィルタ411は、赤色光を透過するRフィルタ411aと、緑色光を透過するGフィルタ411bと、青色光を透過するBフィルタ411cと、473±10nmの狭帯域光を透過する狭帯域フィルタ511dとを有する。したがって、回転フィルタ402を通常光観察モード用の第2位置に配置すると、広帯域光源401からの白色光は、回転フィルタ402の回転に応じてRフィルタ411a、Gフィルタ411b、Bフィルタ411c、狭帯域フィルタ411dのいずれかに入射する。このため、検体には、透過したフィルタに応じて、赤色光、緑色光、青色光,狭帯域光(473nm)が順次照射され、イメージセンサ405は、これらの反射光を受光することによりそれぞれ検体を撮像して、R画像信号、G画像信号、B画像信号、及び狭帯域画像信号を順次出力する。
特殊観察モードで得られるR画像信号とG画像信号は、第1実施形態のR1(またはR2)画像信号とG1(またはG2)画像信号にそれぞれ対応する。また、特殊観察モードで得られるB画像信号は、第1実施形態のB2画像信号に対応し、狭帯域画像信号はB1画像信号に対応する。したがって、その後の処理は第1~第3実施形態の内視鏡システムと同様に行うことができる。
なお、第1~第3実施形態(特に第1,第2実施形態)では、観察距離の測定及び測定した観察距離に応じた酸素飽和度の誤差の補正を画像信号全体に対して行なっているが、観察距離の測定及び測定した観察距離に応じた酸素飽和度の誤差の補正は、B1画像信号、G2画像信号、及びR2画像信号をそれぞれ複数の領域に分割し、各分割領域で行うことが好ましい。例えば、図31に示すように、B1画像信号501を縦横に3×3の合計9個の分割領域501a~501iに分割する。次いで、各分割領域501a~501iで、特定周波数ΩV成分を抽出して、それぞれ振幅の差ΔBG,ΔGR,ΔRBの算出を行う。そして、各分割領域501a~501iで求めた振幅の差ΔBG,ΔGR,ΔRBに基づいて、分割領域501a~501i毎に酸素飽和度の誤差の補正や画像信号の補正を行うことが好ましい。G2画像信号、R2画像信号についても同様である。
このように、B1画像信号,G2画像信号,R2画像信号を複数の分割領域501a~501iに分け、各分割領域501a~501iで、観察距離の測定及び酸素飽和度の誤差の補正を行うと、測定及び補正の精度が向上する。例えば、図32に示すように、先端部24で検体505(例えば管腔壁)を正面に捉えて観察をする場合、画像信号510を9個に分割した各分割エリアのうち、中央の分割領域510iに写し出された検体505と、先端部24の距離(観察距離)をd1とすると、その他の分割領域510a~510hでは、各分割領域501a~510hに対応する被写体505の各部分と先端部24との距離はd2(d2>d1)であり中央の分割領域510iよりも観察距離が長い。
このため、画像信号510の全体を一括でフーリエ変換して特定周波数ΩV成分の振幅を抽出し、振幅の差ΔBG,ΔGR,ΔRBを算出すると、中央の分割領域510iと周辺の分割領域510a~510hとで振幅の差ΔBG,ΔGR,ΔRBが異なる値になる。また、ズーム倍率が高いほど、あるいは先端部24が検体505に近いほど、この違いは顕著になる。したがって、全ての分割領域510a~501iで同じように観察距離の測定及び酸素飽和度の誤差の補正を行うと、中央の分割領域510iまたは周辺の分割領域510a~510h、あるいはこれらの両方の領域で誤差が生じる。一方、分割領域510a~510i毎に酸素飽和度の誤差の補正や画像信号の補正を行えば、各領域で正確な補正をすることができる。
また、図33に示すように、先端部24が検体505に平行に近い状態で検体505を観察する場合、得られる画像信号520内の各分割領域520a~520i間での観察距離の差がさらに大きくなる。例えば、画像信号520の下段の3つの分割領域520e~520gでは、先端部24と検体505の距離はd3で最も短いが、中段の3つの分割領域520d,520i,520hではd3よりも長いd4となり、さらに上段の3つの分割領域520a~520cでは、最も長いd5となる(d3<d4<d5)。このように画像信号520内での観察距離に差が大きい場合に、画像信号520の全体(全分割領域520a~520i)に対して一括して振幅の差ΔBG,ΔGR,ΔRBを算出すると、酸素飽和度の誤差の補正は不正確になりやすい。しかし、各分割領域520a~520iで補正を行えば、画像信号520の全体に対して一括した補正を行う場合よりも正確に酸素飽和度の誤差の補正や画像信号の補正を行うことができる。
なお、図31~図33では、画像信号を3×3の9個の分割領域に分け、各分割領域で酸素飽和度の誤差の補正や画像信号の補正を行なっているが、領域の分割数は任意である。但し、分割が細かいほど補正精度が向上するが、補正処理に時間を要する。このため、補正処理の速度と補正精度を両立させるためには、上記のように3×3の全9個程度の領域に画像信号を分割することが好ましい。
なお、第1~第3実施形態では、信号比B1/G2と信号比R2/G2に基づいて酸素飽和度を算出しているが、信号比B1/G2のみに基づいて酸素飽和度を算出しても良い。この場合には、相関関係記憶部82には信号比B1/G2と酸素飽和度の相関関係を記憶しておけば良い。
なお、第1~第3実施形態では、酸素飽和度を画像化した酸素飽和度画像を生成及び表示しているが、これに加えて、血液量を画像化した血液量画像を生成及び表示しても良い。血液量は信号比R2/G2と相関があるので、信号比R2/G2に応じて異なる色を割り当てることで、血液量を画像化した血液量画像を作成することができる。
なお、第1~第3実施形態では酸素飽和度を算出しているが、これに代えて、あるいはこれに加えて、「血液量(信号比R2/G2)×酸素飽和度(%)」から算出される酸化ヘモグロビンインデックスや、「血液量×(1-酸素飽和度)(%)」から算出される還元ヘモグロビンインデックス等、他の生体機能情報を算出しても良い。
10,300,400 内視鏡システム
63 観察距離測定部
76 酸素飽和度画像生成部
81 周波数情報抽出部
82 差分算出部
83 観察距離算出部
87 補正部
63 観察距離測定部
76 酸素飽和度画像生成部
81 周波数情報抽出部
82 差分算出部
83 観察距離算出部
87 補正部
Claims (19)
- 検体に含まれるヘモグロビンに吸収される波長帯域を有する信号光を前記検体に照射する光源装置と、
前記信号光の反射光を受光することにより前記検体を撮像して画像信号を出力するイメージセンサを有する内視鏡と、
前記画像信号に基づいて観察距離を測定する観察距離測定部と、
を備える内視鏡システム。 - 前記観察距離測定部は、前記画像信号に基づいて観察距離を測定する手段であり、前記検体に含まれるヘモグロビンの他に、前記検体による前記信号光の反射量を変化させる非ヘモグロビン物質が存在しない場合に前記観察距離を測定する第1測定モードと、前記非ヘモグロビン物質が存在する場合に前記観察距離を測定する第2測定モードとが切り替え可能であり、前記第1測定モードと前記第2測定モードのいずれかで前記観察距離を算出する請求項1に記載の内視鏡システム。
- 前記観察距離測定部は、前記画像信号から周波数成分情報を抽出する周波数成分情報抽出部と、前記画像信号の前記周波数成分情報に基づいて前記観察距離を算出する観察距離算出部と、を備える請求項2に記載の内視鏡システム。
- 前記周波数成分情報は、特定の周波数成分の振幅である請求項3に記載の内視鏡システム。
- 前記観察距離算出部は、対応する波長帯域が異なる二つの前記画像信号についてそれぞれ抽出された前記振幅の差に基づいて前記観察距離を算出する請求項4に記載の内視鏡システム。
- 前記特定の周波数成分は、前記検体の表層血管に対応する周波数成分に関する情報である請求項4または5に記載の内視鏡システム。
- 前記観察距離算出部は、前記非ヘモグロビン物質が存在しない場合の前記周波数成分情報を前記観察距離に対応付ける第1距離テーブルと、前記非ヘモグロビン物質が存在する場合の前記周波数成分情報を前記観察距離に対応付ける第2距離テーブルと、を有し、前記第1測定モードでは前記第1距離テーブルを用い、前記第2測定モードでは前記第2距離テーブルを用いて前記観察距離を算出する請求項3~6のいずれか1項に記載の内視鏡システム。
- 前記観察距離算出部は、前記周波数成分情報を前記観察距離に対応付ける関数を用いて前記観察距離を算出し、前記関数として、前記第1測定モード用の第1距離算出関数と、前記第2測定モード用の第2距離算出関数とを備える請求項3~6のいずれか1項に記載の内視鏡システム。
- 前記非ヘモグロビン物質を投入する非ヘモグロビン物質投入部を備える請求項2~8のいずれか1項に記載の内視鏡システム。
- 前記非ヘモグロビン物質は、前記検体を着色する着色剤、及び/または、前記検体内を洗浄するための洗浄剤である請求項2~9のいずれか1項に記載の内視鏡システム。
- 前記着色剤は、インジゴカルミン、トルイジンブルー、メチレンブルー、複方ヨードグリセリン、クリスタルバイオレット、フルオレスチン、アクリジンオレンジ、インドシアニングリーン、及び、酢酸の少なくともいずれかを含む請求項10に記載の内視鏡システム。
- 前記非ヘモグロビン物質は、前記検体内に残存する残渣、及び/または、前記検体が分泌する分泌物である請求項2~9のいずれか1項に記載の内視鏡システム。
- 前記観察距離は、前記内視鏡の先端部と前記検体との距離である請求項1~12のいずれか1項に記載の内視鏡システム。
- 前記内視鏡は、前記信号光の前記反射光によって前記イメージセンサに結像される像を拡大するためのズームレンズを備え、
前記観察距離は、前記ズームレンズによる前記像の拡大率に基づいた距離である請求項1~13のいずれか1項に記載の内視鏡システム。 - 前記観察距離算出部は、前記画像信号を複数の領域に分割し、前記領域毎に前記観察距離を算出する請求項1~14のいずれか1項に記載の内視鏡システム。
- 前記光源装置は、前記信号光として互いに異なる波長帯域を有する第1信号光と第2信号光を前記検体に照射し、
前記イメージセンサは、前記第1信号光の反射光と前記第2信号光の反射光とを受光することにより前記検体を撮像して第1画像信号と第2画像信号とを出力し、
同一の画素から出力される前記第1画像信号と前記第2画像信号の信号比に基づいて前記検体の酸素飽和度を前記画素毎に算出する酸素飽和度算出部と、
前記観察距離に基づいて、前記酸素飽和度を補正する補正部と、
前記補正部によって補正された前記酸素飽和度に基づいて前記検体の酸素飽和度を表す酸素飽和度画像を生成する画像生成部と、
をさらに備える請求項1~15のいずれか1項に記載の内視鏡システム。 - 検体に含まれるヘモグロビンに吸収される波長帯域を有する信号光を前記検体に照射する光源装置と、前記信号光の反射光を受光することにより前記検体を撮像して画像信号を出力するイメージセンサを有する内視鏡と、を有する内視鏡システムのプロセッサ装置において、
前記画像信号に基づいて観察距離を測定する観察距離測定部を備えるプロセッサ装置。 - 検体に含まれるヘモグロビンに吸収される波長帯域を有する信号光を前記検体に照射する光源装置と、前記信号光の反射光を受光することにより前記検体を撮像して画像信号を出力するイメージセンサを有する内視鏡と、を有する内視鏡システムの作動方法であり、
前記画像信号に基づいて観察距離を測定する観察距離測定ステップを備える内視鏡システムの作動方法。 - 検体に含まれるヘモグロビンに吸収される波長帯域を有する信号光を前記検体に照射する光源装置と、
前記信号光の反射光を受光することにより前記検体を撮像して画像信号を出力するイメージセンサと、
前記画像信号に基づいて観察距離を測定する観察距離測定部と、
を備える距離測定装置。
Priority Applications (2)
| Application Number | Priority Date | Filing Date | Title |
|---|---|---|---|
| EP14848180.7A EP3050486B1 (en) | 2013-09-27 | 2014-08-25 | Endoscope system, processor device and distance measurement device |
| US15/063,776 US10463240B2 (en) | 2013-09-27 | 2016-03-08 | Endoscope system, processor device, operation method, and distance measurement device |
Applications Claiming Priority (2)
| Application Number | Priority Date | Filing Date | Title |
|---|---|---|---|
| JP2013202544A JP6109695B2 (ja) | 2013-09-27 | 2013-09-27 | 内視鏡システム及びプロセッサ装置並びに作動方法並びに距離測定装置 |
| JP2013-202544 | 2013-09-27 |
Related Child Applications (1)
| Application Number | Title | Priority Date | Filing Date |
|---|---|---|---|
| US15/063,776 Continuation US10463240B2 (en) | 2013-09-27 | 2016-03-08 | Endoscope system, processor device, operation method, and distance measurement device |
Publications (1)
| Publication Number | Publication Date |
|---|---|
| WO2015045703A1 true WO2015045703A1 (ja) | 2015-04-02 |
Family
ID=52742855
Family Applications (1)
| Application Number | Title | Priority Date | Filing Date |
|---|---|---|---|
| PCT/JP2014/072186 WO2015045703A1 (ja) | 2013-09-27 | 2014-08-25 | 内視鏡システム及びプロセッサ装置並びに作動方法並びに距離測定装置 |
Country Status (4)
| Country | Link |
|---|---|
| US (1) | US10463240B2 (ja) |
| EP (1) | EP3050486B1 (ja) |
| JP (1) | JP6109695B2 (ja) |
| WO (1) | WO2015045703A1 (ja) |
Cited By (1)
| Publication number | Priority date | Publication date | Assignee | Title |
|---|---|---|---|---|
| EP3395227A4 (en) * | 2015-12-22 | 2019-01-09 | Fujifilm Corporation | ENDOSCOPY SYSTEM AND OPERATING PROCEDURES FOR THE ENDOSCOPE SYSTEM |
Families Citing this family (10)
| Publication number | Priority date | Publication date | Assignee | Title |
|---|---|---|---|---|
| WO2016185733A1 (ja) * | 2015-05-21 | 2016-11-24 | オリンパス株式会社 | 画像処理装置、画像処理方法、及び画像処理プログラム |
| JP6892087B2 (ja) * | 2015-06-12 | 2021-06-18 | ソニー・オリンパスメディカルソリューションズ株式会社 | 医療用画像取得システムおよび医療用撮像装置 |
| JP6448509B2 (ja) * | 2015-10-30 | 2019-01-09 | 富士フイルム株式会社 | 内視鏡システム、プロセッサ装置、及び、内視鏡システムの作動方法 |
| JP6437943B2 (ja) * | 2016-03-07 | 2018-12-12 | 富士フイルム株式会社 | 内視鏡システム、プロセッサ装置、及び、内視鏡システムの作動方法 |
| WO2018051558A1 (ja) * | 2016-09-16 | 2018-03-22 | オリンパス株式会社 | 内視鏡用光源装置 |
| JP6538634B2 (ja) * | 2016-09-30 | 2019-07-03 | 富士フイルム株式会社 | プロセッサ装置及び内視鏡システム並びにプロセッサ装置の作動方法 |
| JP6731110B2 (ja) * | 2017-03-06 | 2020-07-29 | 富士フイルム株式会社 | 内視鏡システム及びその作動方法 |
| WO2019016912A1 (ja) * | 2017-07-20 | 2019-01-24 | オリンパス株式会社 | 診断支援装置、診断支援方法及びプログラム |
| WO2019172231A1 (ja) * | 2018-03-06 | 2019-09-12 | 富士フイルム株式会社 | 医療画像処理システム及び内視鏡システム |
| WO2023119795A1 (ja) * | 2021-12-22 | 2023-06-29 | 富士フイルム株式会社 | 内視鏡システム及びその作動方法 |
Citations (6)
| Publication number | Priority date | Publication date | Assignee | Title |
|---|---|---|---|---|
| JPH09294708A (ja) | 1996-04-30 | 1997-11-18 | Fuji Photo Film Co Ltd | 距離測定可能な内視鏡 |
| JP2003036436A (ja) * | 2001-04-27 | 2003-02-07 | Fuji Photo Film Co Ltd | 規格化画像生成方法および装置 |
| JP2006061683A (ja) * | 2004-07-30 | 2006-03-09 | Olympus Corp | 内視鏡装置 |
| WO2010143692A1 (ja) * | 2009-06-10 | 2010-12-16 | オリンパスメディカルシステムズ株式会社 | カプセル型内視鏡装置 |
| JP2012239816A (ja) * | 2011-05-24 | 2012-12-10 | Fujifilm Corp | 内視鏡システム及び内視鏡診断支援方法 |
| JP2013146484A (ja) * | 2012-01-23 | 2013-08-01 | Fujifilm Corp | 電子内視鏡システム、画像処理装置、画像処理方法及び画像処理プログラム |
Family Cites Families (6)
| Publication number | Priority date | Publication date | Assignee | Title |
|---|---|---|---|---|
| JPH0961132A (ja) * | 1995-08-28 | 1997-03-07 | Olympus Optical Co Ltd | 3次元形状計測装置 |
| US7123756B2 (en) | 2001-04-27 | 2006-10-17 | Fuji Photo Film Co., Ltd. | Method and apparatus for standardized fluorescence image generation |
| JP5190944B2 (ja) * | 2008-06-26 | 2013-04-24 | 富士フイルム株式会社 | 内視鏡装置および内視鏡装置の作動方法 |
| JP5393554B2 (ja) * | 2010-03-23 | 2014-01-22 | 富士フイルム株式会社 | 電子内視鏡システム |
| JP5657375B2 (ja) * | 2010-12-24 | 2015-01-21 | オリンパス株式会社 | 内視鏡装置及びプログラム |
| JP6150555B2 (ja) * | 2013-02-26 | 2017-06-21 | オリンパス株式会社 | 内視鏡装置、内視鏡装置の作動方法及び画像処理プログラム |
-
2013
- 2013-09-27 JP JP2013202544A patent/JP6109695B2/ja active Active
-
2014
- 2014-08-25 EP EP14848180.7A patent/EP3050486B1/en active Active
- 2014-08-25 WO PCT/JP2014/072186 patent/WO2015045703A1/ja active Application Filing
-
2016
- 2016-03-08 US US15/063,776 patent/US10463240B2/en active Active
Patent Citations (6)
| Publication number | Priority date | Publication date | Assignee | Title |
|---|---|---|---|---|
| JPH09294708A (ja) | 1996-04-30 | 1997-11-18 | Fuji Photo Film Co Ltd | 距離測定可能な内視鏡 |
| JP2003036436A (ja) * | 2001-04-27 | 2003-02-07 | Fuji Photo Film Co Ltd | 規格化画像生成方法および装置 |
| JP2006061683A (ja) * | 2004-07-30 | 2006-03-09 | Olympus Corp | 内視鏡装置 |
| WO2010143692A1 (ja) * | 2009-06-10 | 2010-12-16 | オリンパスメディカルシステムズ株式会社 | カプセル型内視鏡装置 |
| JP2012239816A (ja) * | 2011-05-24 | 2012-12-10 | Fujifilm Corp | 内視鏡システム及び内視鏡診断支援方法 |
| JP2013146484A (ja) * | 2012-01-23 | 2013-08-01 | Fujifilm Corp | 電子内視鏡システム、画像処理装置、画像処理方法及び画像処理プログラム |
Non-Patent Citations (1)
| Title |
|---|
| See also references of EP3050486A4 |
Cited By (2)
| Publication number | Priority date | Publication date | Assignee | Title |
|---|---|---|---|---|
| EP3395227A4 (en) * | 2015-12-22 | 2019-01-09 | Fujifilm Corporation | ENDOSCOPY SYSTEM AND OPERATING PROCEDURES FOR THE ENDOSCOPE SYSTEM |
| US11399751B2 (en) | 2015-12-22 | 2022-08-02 | Fujifilm Corporation | Endoscope system and method of operating endoscope system |
Also Published As
| Publication number | Publication date |
|---|---|
| EP3050486B1 (en) | 2018-07-18 |
| EP3050486A4 (en) | 2016-09-07 |
| JP6109695B2 (ja) | 2017-04-05 |
| US20160183774A1 (en) | 2016-06-30 |
| JP2015066127A (ja) | 2015-04-13 |
| US10463240B2 (en) | 2019-11-05 |
| EP3050486A1 (en) | 2016-08-03 |
Similar Documents
| Publication | Publication Date | Title |
|---|---|---|
| JP6109695B2 (ja) | 内視鏡システム及びプロセッサ装置並びに作動方法並びに距離測定装置 | |
| JP6039639B2 (ja) | 内視鏡システム、内視鏡システム用プロセッサ装置、内視鏡システムの作動方法、及び内視鏡システム用プロセッサ装置の作動方法 | |
| JP5992936B2 (ja) | 内視鏡システム、内視鏡システム用プロセッサ装置、内視鏡システムの作動方法、内視鏡システム用プロセッサ装置の作動方法 | |
| JP6010571B2 (ja) | 内視鏡システム、内視鏡システム用プロセッサ装置、内視鏡システムの作動方法、内視鏡システム用プロセッサ装置の作動方法 | |
| JP6140056B2 (ja) | 内視鏡システム、内視鏡システムのプロセッサ装置、内視鏡システムの作動方法、プロセッサ装置の作動方法 | |
| JP5887367B2 (ja) | プロセッサ装置、内視鏡システム、及び内視鏡システムの作動方法 | |
| US9907493B2 (en) | Endoscope system processor device, endoscope system, operation method for endoscope system processor device, and operation method for endoscope system | |
| JP6030035B2 (ja) | 蛍光観察装置、内視鏡システム及びプロセッサ装置並びに作動方法 | |
| JP6866531B2 (ja) | 医療画像処理システム及び内視鏡システム | |
| JP2012130429A (ja) | 内視鏡装置 | |
| JP6085648B2 (ja) | 内視鏡用光源装置及び内視鏡システム | |
| WO2015025672A1 (ja) | 内視鏡システム及びプロセッサ装置並びに作動方法並びにテーブル作成方法 | |
| JP6099518B2 (ja) | 内視鏡システム及び作動方法 | |
| JP6099529B2 (ja) | 内視鏡システム、プロセッサ装置及び光源装置並びに作動方法 | |
| JP6389299B2 (ja) | 内視鏡システム、内視鏡システムのプロセッサ装置、内視鏡システムの作動方法、プロセッサ装置の作動方法 | |
| JP5990141B2 (ja) | 内視鏡システム及びプロセッサ装置並びに作動方法 | |
| JP2016007353A (ja) | 内視鏡システム及びその作動方法 |
Legal Events
| Date | Code | Title | Description |
|---|---|---|---|
| 121 | Ep: the epo has been informed by wipo that ep was designated in this application |
Ref document number: 14848180 Country of ref document: EP Kind code of ref document: A1 |
|
| REEP | Request for entry into the european phase |
Ref document number: 2014848180 Country of ref document: EP |
|
| WWE | Wipo information: entry into national phase |
Ref document number: 2014848180 Country of ref document: EP |
|
| NENP | Non-entry into the national phase |
Ref country code: DE |