WO2014156371A1 - 血液状態解析装置、血液状態解析システム、血液状態解析方法及びプログラム - Google Patents
血液状態解析装置、血液状態解析システム、血液状態解析方法及びプログラム Download PDFInfo
- Publication number
- WO2014156371A1 WO2014156371A1 PCT/JP2014/053707 JP2014053707W WO2014156371A1 WO 2014156371 A1 WO2014156371 A1 WO 2014156371A1 JP 2014053707 W JP2014053707 W JP 2014053707W WO 2014156371 A1 WO2014156371 A1 WO 2014156371A1
- Authority
- WO
- WIPO (PCT)
- Prior art keywords
- blood
- unit
- state analysis
- evaluation
- classification
- Prior art date
Links
Images


Classifications
-
- G—PHYSICS
- G01—MEASURING; TESTING
- G01N—INVESTIGATING OR ANALYSING MATERIALS BY DETERMINING THEIR CHEMICAL OR PHYSICAL PROPERTIES
- G01N33/00—Investigating or analysing materials by specific methods not covered by groups G01N1/00 - G01N31/00
- G01N33/48—Biological material, e.g. blood, urine; Haemocytometers
- G01N33/483—Physical analysis of biological material
- G01N33/487—Physical analysis of biological material of liquid biological material
- G01N33/49—Blood
- G01N33/4905—Determining clotting time of blood
-
- G—PHYSICS
- G01—MEASURING; TESTING
- G01N—INVESTIGATING OR ANALYSING MATERIALS BY DETERMINING THEIR CHEMICAL OR PHYSICAL PROPERTIES
- G01N27/00—Investigating or analysing materials by the use of electric, electrochemical, or magnetic means
- G01N27/02—Investigating or analysing materials by the use of electric, electrochemical, or magnetic means by investigating impedance
- G01N27/026—Dielectric impedance spectroscopy
-
- G—PHYSICS
- G01—MEASURING; TESTING
- G01N—INVESTIGATING OR ANALYSING MATERIALS BY DETERMINING THEIR CHEMICAL OR PHYSICAL PROPERTIES
- G01N33/00—Investigating or analysing materials by specific methods not covered by groups G01N1/00 - G01N31/00
- G01N33/48—Biological material, e.g. blood, urine; Haemocytometers
- G01N33/483—Physical analysis of biological material
- G01N33/487—Physical analysis of biological material of liquid biological material
- G01N33/48707—Physical analysis of biological material of liquid biological material by electrical means
Definitions
- the present technology relates to a blood state analysis device, a blood state analysis system, a blood state analysis method, and a program. More specifically, the present invention relates to a technique for analyzing the state from the electrical characteristics of blood.
- Anti-platelet agglutinating drugs or anticoagulants are prophylactically administered to patients and healthy individuals who are at risk for thrombosis.
- Patients having a risk of thrombosis include, for example, patients with diabetes, arteriosclerosis, cancer, heart disease and respiratory disease, perioperative patients, patients taking immunosuppressants, and the like.
- healthy people having a risk of blood clot include pregnant women and elderly people.
- Acetylsalicylic acid or the like is used as an antiplatelet agglutinating agent, and warfarin or heparin, an activated blood coagulation factor X (Factor Xa) inhibitor, a thrombin direct inhibitor, or the like is used as an anticoagulant.
- Factor Xa activated blood coagulation factor X
- Prophylactic administration of antiplatelet aggregating drugs or anticoagulants against thrombosis has the side effect of increasing the risk of bleeding when the dosage is excessive. In order to obtain a sufficient preventive effect while preventing this side effect, it is important to administer medication in which the blood coagulation ability of the subject is evaluated in a timely manner, and the drug and dosage are appropriately selected and set.
- Blood coagulation ability tests for medication management include methods such as International Standardized Prothrombin Time (Prothrombin Time-International Normalized Ratio: PT-INR) and Activated Partial Thromboplastin Time (APTT).
- PT-INR Prothrombin Time-International Normalized Ratio
- APTT Activated Partial Thromboplastin Time
- PRP Platelet Rich Plasma
- Patent Documents 1 and 2 In recent years, techniques for acquiring information related to the blood coagulation system from the dielectric constant of blood have also been proposed (see Patent Documents 1 and 2). For example, in the blood coagulation system analyzers described in Patent Documents 1 and 2, blood to be analyzed is held in a container equipped with an electrode for applying a voltage to blood, and an alternating current is applied to the electrode. The complex dielectric constant is measured. In these apparatuses, the complex permittivity spectrum obtained by the measurement is analyzed according to a predetermined algorithm to evaluate the increase or decrease in blood coagulation ability such as blood coagulation time.
- the main object of the present disclosure is to provide a blood state analysis device, a blood state analysis system, a blood state analysis method, and a program that can analyze a blood state easily and accurately.
- the present inventor uses blood electrical property data measured by the electrical property measuring device such as the above-described dielectric core gromometer, thereby causing thrombosis risk and the like.
- the present inventors have found that it is possible to easily and accurately analyze the state of blood in the blood.
- the blood state analysis apparatus includes an extraction unit that extracts one or more features for two or more frequency bands from the temporal change data of blood electrical characteristics, and features extracted by the extraction unit.
- An evaluation unit that evaluates the state of the blood based on the data, and a classification unit that classifies the blood based on the evaluation result of the evaluation unit.
- the evaluation unit may digitize the extracted features for each frequency band.
- the classification unit can classify the blood based on numerical values representing the characteristics. Further, the classification unit may classify the blood by comparing the numerical value with a preset threshold value.
- the characteristic is, for example, characteristic time associated with a change in the state of the blood.
- the classification unit may classify the blood according to the number of change points of the frequency gradient and / or the direction in which the frequency gradient changes. Furthermore, the classification unit can classify the blood by comparing the characteristics of each frequency band imagewise.
- This blood state analysis apparatus may have a measurement unit that measures electrical characteristics over time at a specific frequency or frequency band for blood to be analyzed. In that case, a data processing unit for removing noise from the temporal change data of the electrical characteristics of the blood measured by the measurement unit may be provided.
- the blood condition analysis system is measured by an electrical property measurement device including a measurement unit that measures electrical characteristics over time at a specific frequency or frequency band for blood to be analyzed, and the electrical property measurement device.
- An extraction unit that extracts features for two or more frequency bands from the temporal change data of the electrical characteristics of the blood, an evaluation unit that evaluates the blood based on the features extracted by the extraction unit, and an evaluation result of the evaluation unit
- a blood state analyzing apparatus including at least a classification unit for classifying the blood based on the blood pressure.
- the measurement result obtained by the electrical characteristic measurement device, the feature extracted by the extraction unit of the blood state analysis device, the evaluation result obtained by the evaluation unit, and the classification result obtained by the classification unit are further included.
- It has a server provided with the information storage part which memorizes one sort of information, and the server may be connected with the electrical property measuring device and / or the blood state analysis device via a network.
- an extraction step of extracting features for two or more frequency bands from time-dependent data of electrical characteristics of blood, and evaluating the blood based on the features extracted by the extraction unit An evaluation process, and a classification process for classifying the blood based on the evaluation result of the evaluation unit.
- the program according to the present disclosure includes an extraction function for extracting characteristics of two or more frequency bands from blood time-dependent electrical property data, an evaluation function for evaluating the blood based on the extracted characteristics, and an evaluation result.
- the computer realizes a classification function for classifying the blood based on the computer.
- the state of the blood can be analyzed with a simple method with high accuracy.
- the effects described here are not necessarily limited, and may be any of the effects described in the present disclosure.
- a and B are diagrams showing frequency gradient change points in a typical coagulation state, with the horizontal axis representing frequency and the vertical axis representing time. It is a figure which shows the example of a method classified using the value in a specific frequency. It is a flowchart figure which shows the method of analyzing the state of the blood using the blood state analyzer 1 shown in FIG. It is a flowchart figure which shows an operation example. It is a block diagram showing an example of composition of a blood state analysis device of a modification of a 1st embodiment of this indication.
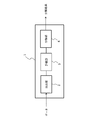
- FIG. 1 is a block diagram illustrating a configuration example of a blood state analysis apparatus according to the present embodiment.
- the blood state analysis apparatus 1 of this embodiment includes at least an extraction unit 2, an evaluation unit 3, and a classification unit 4.
- the extraction unit 2 extracts features for two or more frequency bands from the temporal change data of the electrical characteristics of the blood to be analyzed.
- electrical characteristics include, for example, impedance, conductance, admittance, capacitance, dielectric constant, electrical conductivity, phase angle, and quantities obtained by converting these into electrical quantities.
- feature includes not only a characteristic value calculated from the temporal change data of electrical characteristics but also an image characteristic extracted from the display image of the temporal change data.
- the blood state analysis apparatus 1 of this embodiment can evaluate and classify blood using one of the electrical characteristics described above, it can also use two or more electrical characteristics.
- the features extracted by the extraction unit 2 are not limited to one type, and two or more types of features may be extracted.
- Features extracted by the extraction unit 2 include a characteristic time associated with a blood state change, a change amount of an electrical characteristic value, a change point of a frequency gradient, and the like.
- characteristic times associated with changes in blood state include blood coagulation start time, blood coagulation end time, erythrocyte sedimentation start time, erythrocyte sedimentation end time, red blood cell formation start time, and red blood cell replenishment time. For example, there is a time for ending Qian formation.
- the evaluation unit 3 evaluates the blood state based on the features extracted by the extraction unit 2.
- examples of the state of blood to be evaluated include a blood coagulation state, an aggregation state of components in the blood, a red blood cell sedimentation state, a recurring state, a blood clot degeneration state, and the like.
- the blood state evaluation method is not particularly limited, and can be appropriately selected according to the characteristics extracted by the extraction unit 2. For example, when evaluating the coagulation state of blood, a method of quantifying the extracted features for each frequency band can be applied. If the extracted feature is an image, for example, the evaluation unit 3 compares the reference data and the extracted data imagewise.
- the classification unit 4 classifies blood based on the evaluation result of the evaluation unit 3. 2 and 3 are diagrams showing examples of classification. At this time, the blood classification method is not particularly limited. For example, a method of classification by comparing the numerical value obtained by the evaluation unit 3 with a preset threshold value can be applied.
- the classification unit 4 may classify blood by comparing the characteristics of each frequency band imagewise, such as comparing spectral patterns.
- FIG. 4 is a flowchart showing a method of analyzing the blood state using the blood state analyzer 1 shown in FIG. 1 in the order of the steps
- FIG. 5 is a flowchart showing an operation example.
- Step S1 Feature extraction process>
- the extraction unit 2 extracts features for two or more frequency bands from the temporal change data A (f, t) of blood electrical characteristics (step S1).
- the frequency band for extracting the features can be appropriately selected according to the state of the blood to be evaluated, but is preferably selected from the range of 100 Hz to 100 MHz where the influence of the protein is relatively small. It is more preferable to select from the range.
- the electrical property is dielectric constant and the risk of venous thromboembolism (VTE) is predicted for the blood to be analyzed
- the features may be extracted at around 10 MHz, around 1 MHz, and around 2.5 kHz.
- VTE venous thromboembolism
- an increase in the dielectric constant (the real part of the complex dielectric constant) associated with blood coagulation is observed in a high frequency band around 10 MHz (3 MHz to 30 MHz).
- the intermediate frequency band around 1 MHz (100 kHz or more and less than 3 MHz)
- a peak showing blood sedimentation is observed at around 2.5 kHz.
- blood with negative thrombosis has the following two characteristic patterns.
- the first pattern is a case where an increase in the dielectric constant (the real part of the complex dielectric constant) is seen in the low frequency band as opposed to positive blood.
- the second pattern in the intermediate frequency band, apart from the increase in the dielectric constant (real part of the complex dielectric constant) due to the formation of red blood cells, the dielectric constant (the real part of the complex dielectric constant) associated with blood coagulation. ) Increase and subsequent decrease is observed.
- the 2nd pattern characterized by this intermediate frequency band is a characteristic change like the blood of a healthy person. Table 1 below shows frequency bands in which characteristic changes are observed in the blood state and the dielectric constant (the real part of the complex dielectric constant).
- Step S2 Blood condition evaluation step> Next, based on the features extracted by the extraction unit 2, the evaluation unit 3 evaluates the blood state (step S2).
- the state of blood can be evaluated, for example, by digitizing the temporal change data of electrical characteristics.
- the method of digitizing the electrical property temporal change data is not particularly limited.
- the electrical property temporal change data is normalized by a specific time, and the change amount ⁇ A (f, There is a method for obtaining t).
- a (f, t a) in Equation 1 below, for any frequency f, is a variation of the electrical characteristic at the reference time t a.
- the change amount ⁇ A (f, t) calculated by the above mathematical formula 1 can be evaluated by differentiating the change amount by frequency or time, for example, and obtaining the local extreme value, the differential amplitude and the angle.
- This determination value p 1 is the electrical characteristic change amount ⁇ A (f 1 , t 1 ) at the first frequency f 1 and the first time t 1, the electrical frequency at the second frequency f 2 and the first time t 1 .
- the change amount ⁇ A (f 2 , t 1 ) of the characteristic, the change amount ⁇ A (f 3 , t 1 ) of the electrical characteristic at the third frequency f 3 and the first time t 1 is calculated.
- temporal change data of the electrical characteristics may be fitted using the following Equation 4 and Equation 5 without normalizing at a specific time.
- Step S3 Classification process>
- the classification unit 4 classifies the blood based on the evaluation result in the evaluation unit 3.
- the classification method may be suitably selected according to the evaluation method in the evaluation unit 3, for example, when calculating the decision value p 1, p 2 in the evaluation unit 3, the determination value p 1, p By comparing 2 with a preset threshold value, blood can be easily classified according to its state.
- the evaluation result is image data such as a spectral shape
- it can be classified by comparing the characteristic parameter of the blood to be analyzed with the characteristic parameter of the reference data by an image recognition technique.
- Such a computer program may be stored in a recording medium such as a magnetic disk, an optical disk, a magneto-optical disk, or a flash memory, and can be distributed via a network.
- blood is evaluated and classified using features extracted from temporal change data of electrical characteristics.
- the blood condition can be analyzed well. This technique is useful not only in research fields but also in pathological examinations.
- FIG. 6 is a block diagram illustrating a configuration example of the blood state analysis apparatus according to the present embodiment.
- the same components as those of the blood state analyzer 1 shown in FIG. 1 are denoted by the same reference numerals, and detailed description thereof is omitted.
- the blood state analysis apparatus 10 of the present modification includes a measurement unit 5 and a data processing unit 6 in addition to the extraction unit 2, the evaluation unit 3, and the classification unit 4 described above.
- the blood state analyzing apparatus 10 may be provided with a display unit (not shown) and a storage unit (not shown).
- the measurement unit 5 measures the electrical characteristics over time at a specific frequency or frequency band for the blood to be analyzed. Examples of the electrical characteristics measured by the measurement unit 5 include impedance, conductance, admittance, capacitance, dielectric constant, conductivity, phase angle, and the amount obtained by converting these quantities of electricity.
- the blood state analysis apparatus 10 of the present modification can be evaluated / classified by one of these electrical characteristics, but two or more electrical characteristics can also be used.
- the configuration of the measurement unit 5 is not particularly limited, and can be set as appropriate according to the electrical characteristics to be measured.
- an impedance analyzer or a network analyzer can be used as the measurement unit 5 when an AC voltage is applied between the electrode pair provided in the sample container to measure the impedance or dielectric constant of blood.
- the measurement unit 5 may measure only the frequency or frequency band used in the extraction unit 2, the evaluation unit 3, and the classification unit 4, but obtained by measuring electrical characteristics in a wide band by changing the frequency.
- a frequency or frequency band used for evaluation can also be extracted from the spectrum.
- the data processing unit 6 removes noise from the temporal change data of the electrical characteristics of the blood measured by the measurement unit 5.
- the method for removing noise in the data processing unit 6 is not particularly limited, and various noise removing methods can be applied. For example, it is possible to evaluate the reliability of a signal having an electrical characteristic measured by fitting or the like and select a noise removal method according to the result. At that time, a plurality of noise removal methods can be combined and processed.
- the storage unit stores the temporal change data of the electrical characteristics of blood measured by the measurement unit 5, the data from which noise has been removed by the data processing unit 6, the evaluation result by the evaluation unit 3, the classification result by the classification unit 4, and the like. It is memorized and is composed of a hard disk or the like.
- the display unit displays temporal change data of the electrical characteristics of blood measured by the measurement unit 5, data from which noise has been removed by the data processing unit 6, evaluation results by the evaluation unit 3, classification results by the classification unit 4, and the like. What is necessary is just to display and these can be browsed.
- FIG. 7 is a flowchart showing a method of analyzing the blood state using the blood state analyzing apparatus 10 shown in FIG.
- Step S11 Electrical characteristic measurement process>
- the measurement unit 5 measures the electrical characteristics of the blood to be analyzed over time at a specific frequency or frequency band.
- the measurement conditions of the electrical characteristics are not particularly limited, and can be set as appropriate according to the type of electrical characteristics and the like as long as the blood to be evaluated is not altered.
- the measurement may be performed only for the frequency or frequency band used in the extraction process, the evaluation process, and the classification process, but it is also possible to measure electrical characteristics in a wide band including all of the used frequency and frequency band.
- the extraction unit 2 or the evaluation unit 3 may extract the frequency or frequency band used for the evaluation from the obtained spectrum.
- Step S12 Noise removal step>
- the data processing unit 6 removes noise from the data signal measured by the measurement unit 5 by various noise removal methods. At that time, for example, the reliability of the signal of the electrical characteristic measured by fitting or the like may be evaluated, and the noise removal method may be selected according to the result. At that time, a plurality of noise removal methods can be combined and processed.
- Steps S13 to S15 The feature extraction process in step S13, the blood condition evaluation process in step S14, and the classification process in step S15 are the same as steps S1 to S3 in the blood condition analyzer of the first embodiment described above.
- the blood condition analyzer of this modification also uses the characteristics extracted from the temporal change data of the electrical characteristics to evaluate and classify the blood.
- the blood condition can be analyzed well.
- the accuracy of evaluation and classification is improved.
- FIG. 8 is a diagram showing a schematic configuration of the blood state analysis system of the present embodiment.
- the blood state analysis system 11 of this embodiment includes the blood state analysis device 1 of the first embodiment described above and an electrical characteristic measurement device 12. Further, the blood state analysis system 10 of the present embodiment may be connected to a server 13 or a display device 14 as necessary.
- the electrical property measuring device 12 measures the electrical properties of blood over time at a specific frequency or frequency band by applying a voltage between a pair of electrodes provided in a sample container filled with blood to be analyzed. Department.
- the configuration of the electrical property measuring device 12 is not particularly limited, and can be appropriately set according to the electrical property to be measured. For example, when an AC voltage is applied between the electrode pairs to measure blood impedance or dielectric constant, an impedance analyzer or network analyzer can be used.
- the server 13 is connected to the blood state analysis device 1 and the display device 14 via the network 15, and is provided with an information storage unit and the like. And the server 13 manages the various data uploaded from the blood state analyzer 1, and outputs it to the display apparatus 14 or the blood state analyzer 1 according to a request
- the display device 14 displays the data of the electrical characteristics measured by the electrical property measurement device 12 and the results evaluated and classified by the blood state analysis device 1.
- the display device 14 may be provided with an information input unit for selecting and inputting data to be displayed by the user. In this case, information input by the user is transmitted to the server 13 and the blood state analyzer 1 via the network 15.
- blood is evaluated and classified using the characteristics extracted from the temporal change data of the electrical characteristics. Therefore, the blood state can be accurately and easily determined by a simple method. Can be analyzed.
- the present disclosure can take the following configurations.
- An extraction unit that extracts one or more features for two or more frequency bands from the temporal change data of electrical characteristics of blood;
- An evaluation unit that evaluates the state of the blood based on the features extracted by the extraction unit;
- a classification unit for classifying the blood based on the evaluation result of the evaluation unit;
- a blood condition analysis apparatus comprising at least (2) The blood state analysis apparatus according to (1), wherein the evaluation unit digitizes the extracted features for each frequency band.
- the blood state analysis device according to any one of (1) to (7), wherein the classification unit classifies the blood by comparing the characteristics of each frequency band imagewise.
- the blood state analysis apparatus according to any one of (1) to (8), wherein the extraction unit extracts one or two or more features in two or more frequency bands within a range of 100 Hz to 100 MHz.
- the blood state analyzing apparatus according to any one of (1) to (9), further comprising a measuring unit that measures electrical characteristics over time at a specific frequency or frequency band for blood to be analyzed.
- the blood state analysis apparatus according to (10), further including a data processing unit that removes noise from the temporal change data of the electrical characteristics of the blood measured by the measurement unit.
- An electrical property measuring device including a measurement unit that measures electrical properties over time at a specific frequency or frequency band for blood to be analyzed; An extraction unit for extracting features for two or more frequency bands from the temporal change data of the electrical properties of the blood measured by the electrical property measuring apparatus, and an evaluation for evaluating the blood based on the features extracted by the extraction unit
- a blood state analysis device comprising at least a classification unit that classifies the blood based on the evaluation result of the evaluation unit;
- a blood state analysis system is stored among the measurement result in the electrical characteristic measurement device, the feature extracted by the extraction unit of the blood state analysis device, the evaluation result in the evaluation unit, and the classification result in the classification unit.
- a blood state analysis method comprising: (15) An extraction function for extracting features for two or more frequency bands from the temporal change data of the electrical characteristics of blood; An evaluation function for evaluating the blood based on the extracted features; A classification function for classifying the blood based on the evaluation result; A program to make a computer realize.
- FIG. 9 are diagrams showing the evaluation / classification methods of Examples 1 to 6.
- Example 1 With the method shown in FIG. 9, the time-dependent data of electrical characteristics was fitted with time and frequency to evaluate and classify the blood state. The results are shown in Table 2 below.
- this method was able to classify blood of thrombotic patients with good results of 83% sensitivity and 80% specificity.
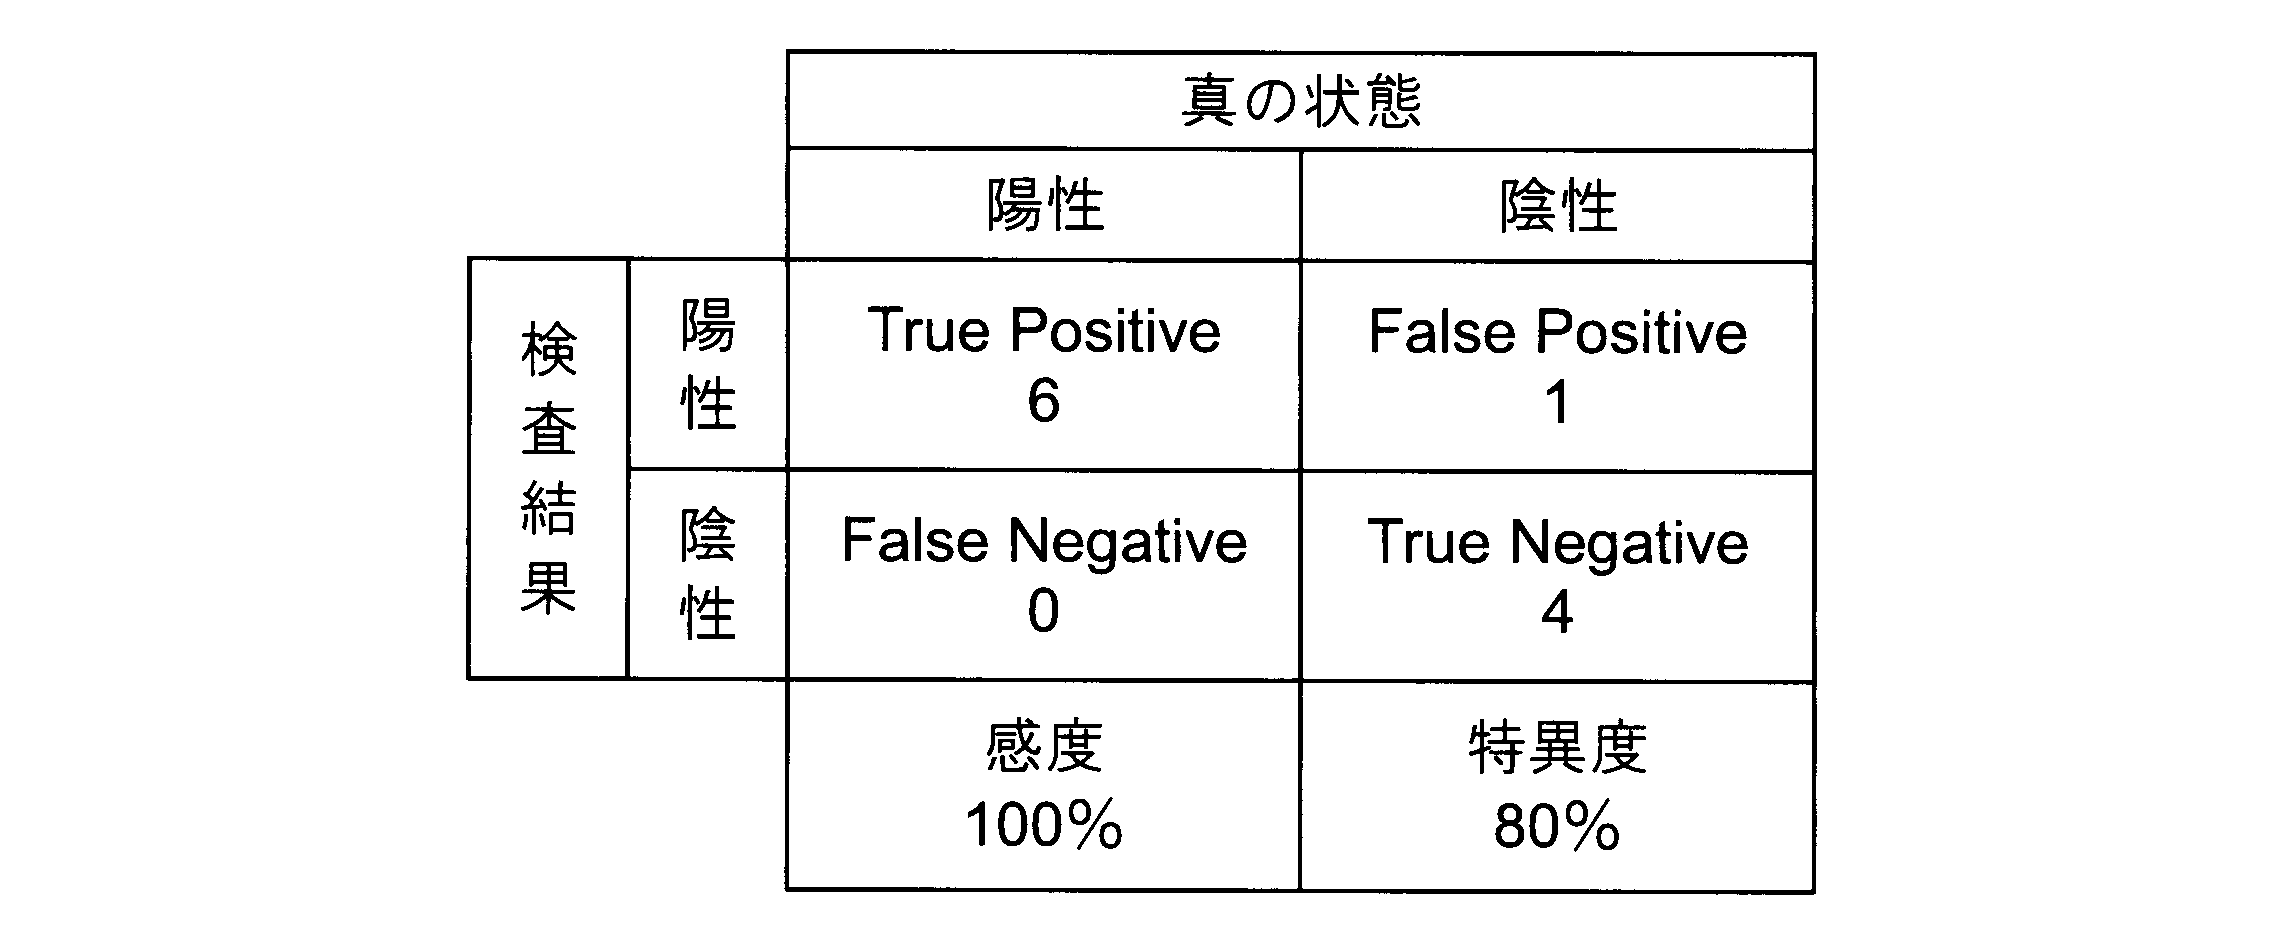
- sensitivity and specificity are indicators used in clinical tests.
- “Sensitivity” is a value defined as “probability to correctly determine what should be determined as positive”
- specificity is “probability to correctly determine negative as negative”.
- both values are high, and a technique with high values of both “sensitivity” and “specificity” can be said to be an excellent inspection technique.
- these values have a relationship that the sensitivity decreases when priority is given to the sensitivity, and the sensitivity decreases when priority is given to the specificity. Is set.
- Example 2 The complex dielectric aging data of the spectrum of blood shown in FIG. 10, after normalization with a particular time, in a manner of using the determination value p 1 represented by the above equation 2, to evaluate the state of the blood, and classified.
- f 1 was 2.5 kHz
- f 2 was 1 MHz
- f 3 was 10 MHz
- the coagulation time t 1 was obtained at 10 MHz.
- the resulting decision value p 1 and classified by a predetermined threshold value, as shown in FIG. 11, it was evaluated.
- the results are shown in Table 3 below.
- this method was able to classify blood of thrombotic patients with good results of sensitivity 100% and specificity 80%.
- Example 3 Evaluation / classification was performed by the method shown in FIG. 12 using the complex dielectric constant for the electrical characteristics. Specifically, after time-dependent change data of the complex dielectric spectrum of blood was normalized with a specific time, the number of frequency gradient change points was classified and evaluated according to a predetermined threshold as shown in FIG. The results are shown in Table 4 below.
- this method was able to classify blood of thrombotic patients with good results of sensitivity 67% and specificity 80%.
- Example 4 Evaluation / classification was performed by a method using frequency fitting shown in FIG. 14 using a complex dielectric constant for electrical characteristics. Specifically, after time-dependent change data of the complex dielectric spectrum of blood was normalized at a specific time, a change amount ⁇ was calculated at each frequency, and evaluated and classified by frequency fitting shown in FIG. The results are shown in Table 5 below.
- this method was able to classify blood of thrombotic patients with good results of 67% sensitivity and 100% specificity.
- Example 5 Evaluation / classification was performed by a method using a complex dielectric constant for electrical characteristics and using a coagulation time shown in FIG. Specifically, instead of fitting with the frequency of Example 4 described above, the coagulation time was extracted at 10 MHz, and based on the value, classification was performed with a predetermined threshold as shown in FIG. The results are shown in Table 6 below.
- this method was able to classify blood of thrombotic patients with good results of sensitivity 100% and specificity 80%.
- Evaluation / classification was performed by the method shown in FIG. 17 using the complex dielectric constant for the electrical characteristics. Specifically, the time-dependent data of the complex dielectric spectrum of blood was normalized at a specific time, and then fitting was performed at the frequency and time. Then, four frequencies were selected from the obtained data, and the blood state was evaluated and classified by a machine learning pattern recognition neural network. The results are shown in Table 7 below.
Abstract
Description
前記評価部は、抽出された特徴を周波数帯域毎に数値化してもよい。
また、前記分類部は、前記特徴を表す数値により前記血液を分類することができる。
更に、前記分類部は、前記数値と予め設定された閾値とを比較することにより前記血液を分類してもよい。
例えば、前記数値は、任意の周波数fxにおける基準時間taから任意の時間tyまでの間の電気特性値Aの変化量δA(=A(fx,ty)/A(fx,ta))である。
前記特徴は、例えば、前記血液の状態変化に伴う特徴的時間である。
また、前記分類部は、周波数勾配の変化点の数及び/又は前記周波数勾配が変化する向きにより、前記血液を分類することができる。
更に、前記分類部は、各周波数帯域の特徴を画像的に比較することにより、前記血液を分類することもできる。
この血液状態解析装置は、解析対象の血液について、特定の周波数又は周波数帯域で、電気特性を経時的に測定する測定部を有していてもよい。
その場合、前記測定部で測定された前記血液の電気特性の経時変化データからノイズを除去するデータ処理部を設けられていてもよい。
この血液状態解析システムでは、更に、前記電気特性測定装置での測定結果、並びに前記血液状態解析装置の抽出部で抽出された特徴、評価部での評価結果及び分類部での分類結果のうち少なくとも1種の情報を記憶する情報記憶部を備えるサーバを有し、前記サーバは、ネットワークを介して、前記電気特性測定装置及び/又は前記血液状態解析装置と接続されていてもよい。
1.第1の実施の形態
(電気特性の経時変化から血液を分類する血液状態解析装置の例)
2.第1の実施の形態の変形例
(測定部及びデータ処理部を備える血液状態解析装置の例)
3.第3の実施の形態
(血液状態解析システムの例)
先ず、本開示の第1の実施形態に係る血液状態解析装置について説明する。図1は本実施形態の血液状態解析装置の構成例を示すブロック図である。図1に示すように、本実施形態の血液状態解析装置1は、少なくとも抽出部2と、評価部3と、分類部4とを備えている。
抽出部2は、解析対象の血液の電気特性の経時変化データから、2以上の周波数帯域について特徴を抽出する。ここでいう「電気特性」は、例えばインピーダンス、コンダクタンス、アドミッタンス、キャパシタンス、誘電率、導電率、位相角及びこれらを電気量変換することにより得られる量が挙げられる。また、「特徴」は、電気特性の経時変化データから算出される特徴的な値だけでなく、経時変化データの表示画像から抽出される画像的特徴も含む。
評価部3は、抽出部2で抽出された特徴に基づいて、血液の状態を評価する。ここで、評価対象とする血液の状態としては、血液の凝固状態、血液中の成分の凝集状態、赤血球の沈降や連銭の状態、血餅縮退状態などが挙げられる。
分類部4は、評価部3の評価結果に基づいて血液を分類する。図2及び図3は分類例を示す図である。その際、血液の分類方法は特に限定されるものではないが、例えば、評価部3で求めた数値を予め設定された閾値と比較することにより分類する方法を適用することができる。
次に、前述した血液状態解析装置1の動作、即ち、血液状態解析装置1を用いて血液の状態を評価し、分類する方法について説明する。図4は図1に示す血液状態解析装置1を用いて血液の状態を解析する方法を、その工程順に示すフローチャート図であり、図5は動作例を示すフローチャート図である。
本実施形態の血液状態解析装置1では、先ず、抽出部2において、血液の電気特性の経時変化データA(f,t)から、2以上の周波数帯域について特徴を抽出する(ステップS1)。その際、特徴を抽出する周波数帯域は、評価する血液の状態に応じて適宜選択することができるが、蛋白質の影響が比較的少ない100Hz~100MHzの範囲から選択することが好ましく、1kHz~10MHzの範囲から選択することがより好ましい。

次に、抽出部2で抽出された特徴に基づいて、評価部3において、血液の状態を評価する(ステップS2)。血液の状態は、例えば、電気特性の経時変化データを数値化して評価することができる。


次に、評価部3での評価結果に基づいて、分類部4で血液を分類する。その際、分類方法は、評価部3での評価方法に応じて適宜選択することができるが、例えば、評価部3で判定値p1,p2を算出した場合は、判定値p1,p2と予め設定された閾値とを比較することにより、血液をその状態に応じて容易に分類することができる。
次に、本開示の第1の実施形態の変形例に係る血液状態解析装置について説明する。図6は本実施形態の血液状態解析装置の構成例を示すブロック図である。なお、図6においては、図1に示す血液状態解析装置1の構成要素と同じものには同じ符号を付し、その詳細な説明は省略する。
測定部5は、解析対象の血液について、特定の周波数又は周波数帯域で、電気特性を経時的に測定する。測定部5で測定される電気特性は、例えばインピーダンス、コンダクタンス、アドミッタンス、キャパシタンス、誘電率、導電率、位相角及びこれらを電気量変換することにより得られる量が挙げられる。なお、本変形例の血液状態解析装置10は、これらの電気的特性のうち1種で評価・分類可能であるが、2種以上の電気特性を利用することもできる。
データ処理部6は、測定部5で測定された血液の電気特性の経時変化データからノイズを除去する。データ処理部6において、ノイズを除去する方法は、特に限定されるものではなく、種々のノイズ除去方法を適用することができる。例えば、フィッティングなどにより測定された電気特性の信号の信頼性を評価し、その結果に応じてノイズ除去方法を選択することもできる。その際、複数のノイズ除去方法を組み合わせて処理することもできる。
記憶部は、測定部5で測定された血液の電気特性の経時変化データや、データ処理部6でノイズが除去されたデータ、評価部3での評価結果、分類部4での分類結果などを記憶するものであり、ハードディスクなどで構成されている。
表示部は、測定部5で測定された血液の電気特性の経時変化データや、データ処理部6でノイズが除去されたデータ、評価部3での評価結果、分類部4での分類結果などを表示するものであり、これらが閲覧可能なものであればよい。
次に、前述した血液状態解析装置10の動作、即ち、血液状態解析装置10を用いて血液の状態を評価し、分類する方法について説明する。図7は図6に示す血液状態解析装置10を用いて血液の状態を解析する方法を、その工程順に示すフローチャート図である。
本変形例の血液状態解析装置10では、先ず、測定部5において、解析対象の血液について、特定の周波数又は周波数帯域で、電気特性を経時的に測定する。その際、電気特性の測定条件は、特に限定されるものではなく、評価対象の血液を変質させない範囲で、電気特性の種類などに応じて適宜設定することができる。
次に、データ処理部6において、各種ノイズ除去方法により、測定部5で測定されたデータ信号から、ノイズを除去する。その際、例えば、フィッティングなどにより測定された電気特性の信号の信頼性を評価し、その結果に応じてノイズ除去方法を選択してもよい。その際、複数のノイズ除去方法を組み合わせて処理することもできる。
ステップS13の特徴抽出工程、ステップS14の血液状態評価工程及びステップS15の分類工程は、前述した第1の実施形態の血液状態解析装置におけるステップS1~S3と同様である。
次に、本開示の第2の実施形態に係る血液状態解析システムについて説明する。図8は本実施形態の血液状態解析システムの概略構成を示す図である。図8に示すように、本実施形態の血液状態解析システム11は、前述した第1の実施形態の血液状態解析装置1と、電気特性測定装置12を備えている。また、本実施形態の血液状態解析システム10には、必要に応じて、サーバ13や表示装置14などが接続されていてもよい。
電気特性測定装置12は、解析対象の血液が充填されるサンプル容器に設けられた電極対間に電圧を印加して、特定の周波数又は周波数帯域で、血液の電気特性を経時的に測定する測定部を備えている。電気特性測定装置12の構成は、特に限定されるものではなく、測定する電気的特性に応じて、適宜設定することができる。例えば、電極対間に交流電圧を印加し、血液のインピーダンスや誘電率を測定する場合は、インピーダンスアナライザーやネットワークアナライザーを使用することもできる。
サーバ13は、ネットワーク15を介して血液状態解析装置1や表示装置14と接続されており、情報記憶部などが設けられている。そして、サーバ13は、血液状態解析装置1からアップロードされた各種データを管理し、要求に応じて表示装置14や血液状態解析装置1に出力する。
表示装置14は、電気特性測定装置12で測定された電気特性のデータや血液状態解析装置1で評価・分類された結果などを表示する。なお、表示装置14には、ユーザが表示するデータを選択し入力するための情報入力部が設けられていてもよい。この場合、ユーザにより入力された情報は、ネットワーク15を介してサーバ13や血液状態解析装置1に送信される。
(1)
血液の電気特性の経時変化データから、2以上の周波数帯域について1又は2以上の特徴を抽出する抽出部と、
前記抽出部で抽出された特徴に基づいて前記血液の状態を評価する評価部と、
前記評価部の評価結果に基づいて前記血液を分類する分類部と、
を少なくとも備える血液状態解析装置。
(2)
前記評価部は、抽出された特徴を周波数帯域毎に数値化する(1)に記載の血液状態解析装置。
(3)
前記分類部は、前記特徴を表す数値により前記血液を分類する(1)又は(2)に記載の血液状態解析装置。
(4)
前記分類部は、前記数値と予め設定された閾値とを比較することにより前記血液を分類する(3)に記載の血液状態解析装置。
(5)
前記数値は、任意の周波数fxにおける基準時間taから任意の時間tyまでの間の電気特性値Aの変化量δA(=A(fx,ty)/A(fx,ta))である(3)又は(4)に記載の血液状態解析装置。
(6)
前記特徴は、前記血液の状態変化に伴う特徴的時間である(1)~(5)のいずれかに記載の血液状態解析装置。
(7)
前記分類部は、周波数勾配の変化点の数及び/又は前記周波数勾配が変化する向きにより、前記血液を分類する(1)~(6)のいずれかに記載の血液状態解析装置。
(8)
前記分類部は、各周波数帯域の特徴を画像的に比較することにより、前記血液を分類する(1)~(7)のいずれかに記載の血液状態解析装置。
(9)
前記抽出部は、100Hz~100MHzの範囲内における2以上の周波数帯域で1又は2以上の特徴を抽出する(1)~(8)のいずれかに記載の血液状態解析装置。
(10)
更に、解析対象の血液について、特定の周波数又は周波数帯域で、電気特性を経時的に測定する測定部を有する(1)~(9)のいずれかに記載の血液状態解析装置。
(11)
前記測定部で測定された前記血液の電気特性の経時変化データからノイズを除去するデータ処理部を有する(10)に記載の血液状態解析装置。
(12)
解析対象の血液について、特定の周波数又は周波数帯域で、電気特性を経時的に測定する測定部を備える電気特性測定装置と、
前記電気特性測定装置で測定された前記血液の電気特性の経時変化データから、2以上の周波数帯域について特徴を抽出する抽出部、前記抽出部で抽出された特徴に基づいて前記血液を評価する評価部、前記評価部の評価結果に基づいて前記血液を分類する分類部を少なくとも備える血液状態解析装置と、
を有する血液状態解析システム。
(13)
更に、前記電気特性測定装置での測定結果、並びに前記血液状態解析装置の抽出部で抽出された特徴、評価部での評価結果及び分類部での分類結果のうち少なくとも1種の情報を記憶する情報記憶部を備えるサーバを有し、
前記サーバは、ネットワークを介して、前記電気特性測定装置及び/又は前記血液状態解析装置と接続されている(12)に記載の血液状態解析システム。
(14)
血液の電気特性の経時変化データから、2以上の周波数帯域について特徴を抽出する抽出工程と、
前記抽出部で抽出された特徴に基づいて前記血液を評価する評価工程と、
前記評価部の評価結果に基づいて前記血液を分類する分類工程と、
を有する血液状態解析方法。
(15)
血液の電気特性の経時変化データから、2以上の周波数帯域について特徴を抽出する抽出機能と、
抽出された特徴に基づいて前記血液を評価する評価機能と、
評価結果に基づいて前記血液を分類する分類機能と、
をコンピュータに実現させるためのプログラム。
図9に示す方法で、電気特性の経時変化データを、時間及び周波数でフィッティングを行って、血液の状態を評価し、分類した。その結果を、下記表2に示す。

図10に示す血液の複素誘電スペクトルの経時変化データを、特定時間で正規化した後、上記数式2で表される判定値p1を使用する方法で、血液の状態を評価し、分類した。その際、f1は2.5kHz、f2は1MHz、f3は10MHzとし、10MHzで凝固時間t1を求めた。得られた判定値p1を、図11に示すように所定の閾値で分類し、評価した。その結果を下記表3に示す。

電気特性に複素誘電率を用いて、図12に示す方法で、評価・分類を行った。具体的には、血液の複素誘電スペクトルの経時変化データを、特定時間で正規化した後、周波数勾配の変化点の数を、図13に示すように所定の閾値で分類し、評価した。その結果を下記表4に示す。

電気特性に複素誘電率を用いて、図14に示す周波数フィッティングを用いる方法で、評価・分類を行った。具体的には、血液の複素誘電スペクトルの経時変化データを、特定時間で正規化した後、各周波数で変化量Δεを算出し、図15に示す周波数フィッティングにより評価して、分類した。その結果を、下記表5に示す。

電気特性に複素誘電率を用いて、図14に示す凝固時間を用いる方法で、評価・分類を行った。具体的には、前述した実施例4の周波数によりフィッティングに代えて、10MHzで凝固時間を抽出し、その値に基づいて、図16に示すように所定の閾値で分類し、評価した。その結果を下記表6に示す。
電気特性に複素誘電率を用いて、図17に示す方法で、評価・分類を行った。具体的には、血液の複素誘電スペクトルの経時変化データを、特定時間で正規化した後、周波数及び時間でフィッティングを行った。そして、得られたデータから、4周波数を選択して、機械学習のパターン認識ニューラルネットワークにより、血液の状態を評価し、分類した。その結果を、下記表7に示す。

Claims (14)
- 血液の電気特性の経時変化データから、2以上の周波数帯域について1又は2以上の特徴を抽出する抽出部と、
前記抽出部で抽出された特徴に基づいて前記血液の状態を評価する評価部と、
前記評価部の評価結果に基づいて前記血液を分類する分類部と、
を少なくとも備える血液状態解析装置。 - 前記評価部は、抽出された特徴を周波数帯域毎に数値化する請求項1に記載の血液状態解析装置。
- 前記分類部は、前記特徴を表す数値により前記血液を分類する請求項2に記載の血液状態解析装置。
- 前記分類部は、前記数値と予め設定された閾値とを比較することにより前記血液を分類する請求項3に記載の血液状態解析装置。
- 前記数値は、任意の周波数fxにおける基準時間taから任意の時間tyまでの間の電気特性値Aの変化量δA(=A(fx,ty)/A(fx,ta))である請求項3に記載の血液状態解析装置。
- 前記特徴は、前記血液の状態変化に伴う特徴的時間である請求項1に記載の血液状態解析装置。
- 前記分類部は、周波数勾配の変化点の数及び/又は前記周波数勾配が変化する向きにより、前記血液を分類する請求項1に記載の血液状態解析装置。
- 前記分類部は、各周波数帯域の特徴を画像的に比較することにより、前記血液を分類する請求項1に記載の血液状態解析装置。
- 更に、解析対象の血液について、特定の周波数又は周波数帯域で、電気特性を経時的に測定する測定部を有する請求項1に記載の血液状態解析装置。
- 前記測定部で測定された前記血液の電気特性の経時変化データからノイズを除去するデータ処理部を有する請求項9に記載の血液状態解析装置。
- 解析対象の血液について、特定の周波数又は周波数帯域で、電気特性を経時的に測定する測定部を備える電気特性測定装置と、
前記電気特性測定装置で測定された前記血液の電気特性の経時変化データから、2以上の周波数帯域について特徴を抽出する抽出部、前記抽出部で抽出された特徴に基づいて前記血液を評価する評価部、前記評価部の評価結果に基づいて前記血液を分類する分類部を少なくとも備える血液状態解析装置と、
を有する血液状態解析システム。 - 更に、前記電気特性測定装置での測定結果、並びに前記血液状態解析装置の抽出部で抽出された特徴、評価部での評価結果及び分類部での分類結果のうち少なくとも1種の情報を記憶する情報記憶部を備えるサーバを有し、
前記サーバは、ネットワークを介して、前記電気特性測定装置及び/又は前記血液状態解析装置と接続されている請求項11に記載の血液状態解析システム。 - 血液の電気特性の経時変化データから、2以上の周波数帯域について特徴を抽出する抽出工程と、
前記抽出部で抽出された特徴に基づいて前記血液を評価する評価工程と、
前記評価部の評価結果に基づいて前記血液を分類する分類工程と、
を有する血液状態解析方法。 - 血液の電気特性の経時変化データから、2以上の周波数帯域について特徴抽出する抽出機能と、
抽出された特徴に基づいて前記血液を評価する評価機能と、
評価結果に基づいて前記血液を分類する分類機能と、
をコンピュータに実現させるためのプログラム。
Priority Applications (4)
| Application Number | Priority Date | Filing Date | Title |
|---|---|---|---|
| EP14773960.1A EP2980571A4 (en) | 2013-03-29 | 2014-02-18 | BLOOD STATUS ANALYSIS DEVICE, BLOOD STATUS ANALYSIS SYSTEM, BLOOD CONDITION ANALYSIS METHOD, AND PROGRAM |
| US14/777,906 US10948478B2 (en) | 2013-03-29 | 2014-02-18 | Blood state analysis device, blood state analysis system, blood state analysis method, and program |
| JP2015508170A JP6512093B2 (ja) | 2013-03-29 | 2014-02-18 | 血液状態解析装置、血液状態解析システム、血液状態解析方法及びプログラム |
| CN201480017561.0A CN105102968B (zh) | 2013-03-29 | 2014-02-18 | 血液状态分析装置、血液状态分析系统、血液状态分析方法、以及程序 |
Applications Claiming Priority (4)
| Application Number | Priority Date | Filing Date | Title |
|---|---|---|---|
| JP2013073831 | 2013-03-29 | ||
| JP2013-073831 | 2013-03-29 | ||
| JP2013263565 | 2013-12-20 | ||
| JP2013-263565 | 2013-12-20 |
Publications (1)
| Publication Number | Publication Date |
|---|---|
| WO2014156371A1 true WO2014156371A1 (ja) | 2014-10-02 |
Family
ID=51623372
Family Applications (1)
| Application Number | Title | Priority Date | Filing Date |
|---|---|---|---|
| PCT/JP2014/053707 WO2014156371A1 (ja) | 2013-03-29 | 2014-02-18 | 血液状態解析装置、血液状態解析システム、血液状態解析方法及びプログラム |
Country Status (5)
| Country | Link |
|---|---|
| US (1) | US10948478B2 (ja) |
| EP (1) | EP2980571A4 (ja) |
| JP (2) | JP6512093B2 (ja) |
| CN (1) | CN105102968B (ja) |
| WO (1) | WO2014156371A1 (ja) |
Cited By (3)
| Publication number | Priority date | Publication date | Assignee | Title |
|---|---|---|---|---|
| JPWO2017130528A1 (ja) * | 2016-01-29 | 2018-11-15 | ソニー株式会社 | 血液凝固系解析装置、血液凝固系解析システム、血液凝固系解析方法及び血液凝固系解析装置用パラメーターの決定方法 |
| WO2020032008A1 (ja) * | 2018-08-07 | 2020-02-13 | チトセ バイオ エボリューション ピーティーイー リミテッド | 測定装置 |
| CN112466459A (zh) * | 2020-06-01 | 2021-03-09 | 四川大学华西医院 | 静脉血栓栓塞症主动预测、预警及全周期智能化管理系统 |
Families Citing this family (5)
| Publication number | Priority date | Publication date | Assignee | Title |
|---|---|---|---|---|
| CN104937400B (zh) | 2013-01-28 | 2018-07-03 | 索尼公司 | 用于生物样品的阻抗测量装置和用于生物样品的阻抗测量系统 |
| WO2014141845A1 (ja) | 2013-03-13 | 2014-09-18 | ソニー株式会社 | 血液状態解析装置、血液状態解析システム、および血液状態解析プログラム |
| WO2014141844A1 (ja) | 2013-03-15 | 2014-09-18 | ソニー株式会社 | 血液状態解析装置、血液状態解析システム、血液状態解析方法、および該方法をコンピューターに実現させるための血液状態解析プログラム |
| WO2014156371A1 (ja) | 2013-03-29 | 2014-10-02 | ソニー株式会社 | 血液状態解析装置、血液状態解析システム、血液状態解析方法及びプログラム |
| CN105102969A (zh) | 2013-03-29 | 2015-11-25 | 索尼公司 | 血液状态评估装置、血液状态评估系统、血液状态评估方法以及程序 |
Citations (2)
| Publication number | Priority date | Publication date | Assignee | Title |
|---|---|---|---|---|
| WO2010079845A1 (ja) * | 2009-01-08 | 2010-07-15 | ソニー株式会社 | 血液凝固系解析装置、血液凝固系解析方法及びプログラム |
| JP2012194087A (ja) | 2011-03-17 | 2012-10-11 | Sony Corp | 血液凝固系解析方法および血液凝固系解析装置 |
Family Cites Families (16)
| Publication number | Priority date | Publication date | Assignee | Title |
|---|---|---|---|---|
| JPS62153761A (ja) * | 1985-12-27 | 1987-07-08 | Sumitomo Bakelite Co Ltd | 血液凝固時間の測定方法 |
| JPS63133062A (ja) * | 1986-11-25 | 1988-06-04 | Toyota Central Res & Dev Lab Inc | ヘマトクリツト測定装置 |
| EP1329716A1 (en) * | 2002-01-16 | 2003-07-23 | Roche Diagnostics GmbH | Method for screening biological samples for presence of the metabolic syndrome |
| JP4893526B2 (ja) | 2007-08-10 | 2012-03-07 | ソニー株式会社 | 細胞の物性値測定方法及び物性測定装置 |
| JP5098817B2 (ja) | 2008-05-29 | 2012-12-12 | ソニー株式会社 | 物性測定装置及び物性測定方法 |
| EP2545851A3 (en) * | 2009-06-08 | 2013-05-08 | S.E.A. Medical Systems, Inc. | Systems and methods for the identification of compounds in medical fluids using admittance spectroscopy |
| PL2395353T3 (pl) * | 2010-06-09 | 2019-02-28 | Apex Biotechnology Corp. | Urządzenie i sposób pomiaru czasu protrombinowego i hematokrytu poprzez analizę zmiany reaktancji w próbce |
| CN102818822B (zh) * | 2011-06-09 | 2015-08-12 | 五鼎生物技术股份有限公司 | 利用分析样本中电抗变化以测量凝血酶原时间及血球容积比(hct%)的诊断装置及方法 |
| JPWO2014112227A1 (ja) | 2013-01-18 | 2017-01-19 | ソニー株式会社 | 電気的特性測定装置 |
| CN104937400B (zh) | 2013-01-28 | 2018-07-03 | 索尼公司 | 用于生物样品的阻抗测量装置和用于生物样品的阻抗测量系统 |
| WO2014122873A1 (ja) | 2013-02-08 | 2014-08-14 | ソニー株式会社 | 微小粒子分析装置及び微小粒子分析システム |
| WO2014141845A1 (ja) | 2013-03-13 | 2014-09-18 | ソニー株式会社 | 血液状態解析装置、血液状態解析システム、および血液状態解析プログラム |
| WO2014141844A1 (ja) | 2013-03-15 | 2014-09-18 | ソニー株式会社 | 血液状態解析装置、血液状態解析システム、血液状態解析方法、および該方法をコンピューターに実現させるための血液状態解析プログラム |
| EP2980558B1 (en) | 2013-03-26 | 2019-11-06 | Sony Corporation | Measurement device and measurement method |
| CN105102969A (zh) * | 2013-03-29 | 2015-11-25 | 索尼公司 | 血液状态评估装置、血液状态评估系统、血液状态评估方法以及程序 |
| WO2014156371A1 (ja) | 2013-03-29 | 2014-10-02 | ソニー株式会社 | 血液状態解析装置、血液状態解析システム、血液状態解析方法及びプログラム |
-
2014
- 2014-02-18 WO PCT/JP2014/053707 patent/WO2014156371A1/ja active Application Filing
- 2014-02-18 JP JP2015508170A patent/JP6512093B2/ja active Active
- 2014-02-18 CN CN201480017561.0A patent/CN105102968B/zh not_active Expired - Fee Related
- 2014-02-18 EP EP14773960.1A patent/EP2980571A4/en not_active Ceased
- 2014-02-18 US US14/777,906 patent/US10948478B2/en active Active
-
2019
- 2019-04-10 JP JP2019074663A patent/JP6791297B2/ja active Active
Patent Citations (3)
| Publication number | Priority date | Publication date | Assignee | Title |
|---|---|---|---|---|
| WO2010079845A1 (ja) * | 2009-01-08 | 2010-07-15 | ソニー株式会社 | 血液凝固系解析装置、血液凝固系解析方法及びプログラム |
| JP2010181400A (ja) | 2009-01-08 | 2010-08-19 | Sony Corp | 血液凝固系解析装置、血液凝固系解析方法及びプログラム |
| JP2012194087A (ja) | 2011-03-17 | 2012-10-11 | Sony Corp | 血液凝固系解析方法および血液凝固系解析装置 |
Non-Patent Citations (5)
| Title |
|---|
| A.IRIMAJIRI ET AL.: "Dielectric monitoring of rouleaux formation in human whole blood: a feasibility study", BIOCHIMICA ET BIOPHYSICA ACTA, vol. 1290, no. 3, 1 January 1996 (1996-01-01), pages 207 - 209, XP055281069, DOI: 10.1016/0304-4165(96)00048-7 * |
| AKIHIKO IRIMAJIRI ET AL.: "Zenketsu no Yuden Kyodo kara Mita Sekkekkyu Gyoshu (Rensen Keisei", JOURNAL OF BIOSCIENCE AND BIOENGINEERING, vol. 78, no. 5, 1 January 2000 (2000-01-01), pages 162 - 165, XP008151323 * |
| ISAO UCHIMURA ET AL.: "Yuden Bunkoho ni yoru Ketsueki Gyoko Sokutei to Tonyobyo eno Oyo", THE 1ST INTERNATIONAL SYMPOSIUM OF BIORHEOLOGY, THE 33RD ANNUAL MEETING OF THE JAPANESE SOCIETY OF BIORHEOLOGY PROGRAM-SHU, 28 May 2010 (2010-05-28), pages 99, XP008180895 * |
| See also references of EP2980571A4 * |
| YOSHITO HAYASHI: "Jomyaku Kessensho no Risk Hyoka ni Muketa Yuden Bunkoho ni yoru Approach", DAI 32 KAI JAPANESE SOCIETY OF BIORHEOLOGY NENKAI PROGRAM SHOROKUSHU, 18 May 2009 (2009-05-18), pages 75, XP008180894 * |
Cited By (5)
| Publication number | Priority date | Publication date | Assignee | Title |
|---|---|---|---|---|
| JPWO2017130528A1 (ja) * | 2016-01-29 | 2018-11-15 | ソニー株式会社 | 血液凝固系解析装置、血液凝固系解析システム、血液凝固系解析方法及び血液凝固系解析装置用パラメーターの決定方法 |
| WO2020032008A1 (ja) * | 2018-08-07 | 2020-02-13 | チトセ バイオ エボリューション ピーティーイー リミテッド | 測定装置 |
| JPWO2020032008A1 (ja) * | 2018-08-07 | 2020-02-13 | ||
| CN112466459A (zh) * | 2020-06-01 | 2021-03-09 | 四川大学华西医院 | 静脉血栓栓塞症主动预测、预警及全周期智能化管理系统 |
| CN112466459B (zh) * | 2020-06-01 | 2023-05-23 | 四川大学华西医院 | 静脉血栓栓塞症主动预测、预警及全周期智能化管理系统 |
Also Published As
| Publication number | Publication date |
|---|---|
| US10948478B2 (en) | 2021-03-16 |
| JP6512093B2 (ja) | 2019-05-15 |
| CN105102968A (zh) | 2015-11-25 |
| JP6791297B2 (ja) | 2020-11-25 |
| JP2019148594A (ja) | 2019-09-05 |
| JPWO2014156371A1 (ja) | 2017-02-16 |
| CN105102968B (zh) | 2018-11-30 |
| US20160299124A1 (en) | 2016-10-13 |
| EP2980571A1 (en) | 2016-02-03 |
| EP2980571A4 (en) | 2016-10-26 |
Similar Documents
| Publication | Publication Date | Title |
|---|---|---|
| JP6791297B2 (ja) | 血栓症リスク評価装置、血栓症リスク評価方法及びプログラム | |
| JP6883228B2 (ja) | 血液状態評価装置、血液状態評価システム、血液状態評価方法及びプログラム | |
| US20190212320A1 (en) | Blood coagulation system analyzer, blood coagulation system analysis method and program | |
| JP5768422B2 (ja) | 血液凝固系解析方法および血液凝固系解析装置 | |
| JP7103336B2 (ja) | 血液状態解析装置、血液状態解析システム、血液状態解析方法、および該方法をコンピューターに実現させるための血液状態解析プログラム | |
| JP2019032340A (ja) | 血液状態解析装置、血液状態解析システム、および血液状態解析プログラム | |
| Cheng et al. | Establishment of thromboelastography reference intervals by indirect method and relevant factor analyses | |
| WO2021154890A1 (en) | Apparatus, systems and methods for in vitro screening of complex biological fluids | |
| WO2017169261A1 (ja) | 血液凝固系解析システム、血液凝固系解析方法及び血液凝固系解析用プログラム | |
| Platton et al. | Dilute Russell's Viper Venom Time‐potential use for the detection of apixaban and rivaroxaban predicted from interference in lupus anticoagulant testing | |
| JPH0465969B2 (ja) |
Legal Events
| Date | Code | Title | Description |
|---|---|---|---|
| WWE | Wipo information: entry into national phase |
Ref document number: 201480017561.0 Country of ref document: CN |
|
| 121 | Ep: the epo has been informed by wipo that ep was designated in this application |
Ref document number: 14773960 Country of ref document: EP Kind code of ref document: A1 |
|
| ENP | Entry into the national phase |
Ref document number: 2015508170 Country of ref document: JP Kind code of ref document: A |
|
| WWE | Wipo information: entry into national phase |
Ref document number: 2014773960 Country of ref document: EP |
|
| WWE | Wipo information: entry into national phase |
Ref document number: 14777906 Country of ref document: US |
|
| NENP | Non-entry into the national phase |
Ref country code: DE |