WO2014136949A1 - 渋滞予兆検知方法、プログラムおよび渋滞予兆検知装置 - Google Patents
渋滞予兆検知方法、プログラムおよび渋滞予兆検知装置 Download PDFInfo
- Publication number
- WO2014136949A1 WO2014136949A1 PCT/JP2014/056012 JP2014056012W WO2014136949A1 WO 2014136949 A1 WO2014136949 A1 WO 2014136949A1 JP 2014056012 W JP2014056012 W JP 2014056012W WO 2014136949 A1 WO2014136949 A1 WO 2014136949A1
- Authority
- WO
- WIPO (PCT)
- Prior art keywords
- traffic jam
- sign detection
- acceleration
- jam sign
- angle
- Prior art date
- Legal status (The legal status is an assumption and is not a legal conclusion. Google has not performed a legal analysis and makes no representation as to the accuracy of the status listed.)
- Ceased
Links
Images







Classifications
-
- G—PHYSICS
- G08—SIGNALLING
- G08G—TRAFFIC CONTROL SYSTEMS
- G08G1/00—Traffic control systems for road vehicles
- G08G1/01—Detecting movement of traffic to be counted or controlled
- G08G1/0104—Measuring and analyzing of parameters relative to traffic conditions
- G08G1/0125—Traffic data processing
- G08G1/0133—Traffic data processing for classifying traffic situation
-
- G—PHYSICS
- G08—SIGNALLING
- G08G—TRAFFIC CONTROL SYSTEMS
- G08G1/00—Traffic control systems for road vehicles
- G08G1/01—Detecting movement of traffic to be counted or controlled
- G08G1/0104—Measuring and analyzing of parameters relative to traffic conditions
- G08G1/0108—Measuring and analyzing of parameters relative to traffic conditions based on the source of data
- G08G1/0112—Measuring and analyzing of parameters relative to traffic conditions based on the source of data from the vehicle, e.g. floating car data [FCD]
-
- B—PERFORMING OPERATIONS; TRANSPORTING
- B60—VEHICLES IN GENERAL
- B60W—CONJOINT CONTROL OF VEHICLE SUB-UNITS OF DIFFERENT TYPE OR DIFFERENT FUNCTION; CONTROL SYSTEMS SPECIALLY ADAPTED FOR HYBRID VEHICLES; ROAD VEHICLE DRIVE CONTROL SYSTEMS FOR PURPOSES NOT RELATED TO THE CONTROL OF A PARTICULAR SUB-UNIT
- B60W40/00—Estimation or calculation of non-directly measurable driving parameters for road vehicle drive control systems not related to the control of a particular sub unit, e.g. by using mathematical models
- B60W40/02—Estimation or calculation of non-directly measurable driving parameters for road vehicle drive control systems not related to the control of a particular sub unit, e.g. by using mathematical models related to ambient conditions
- B60W40/04—Traffic conditions
-
- G—PHYSICS
- G08—SIGNALLING
- G08G—TRAFFIC CONTROL SYSTEMS
- G08G1/00—Traffic control systems for road vehicles
-
- G—PHYSICS
- G08—SIGNALLING
- G08G—TRAFFIC CONTROL SYSTEMS
- G08G1/00—Traffic control systems for road vehicles
- G08G1/01—Detecting movement of traffic to be counted or controlled
-
- G—PHYSICS
- G08—SIGNALLING
- G08G—TRAFFIC CONTROL SYSTEMS
- G08G1/00—Traffic control systems for road vehicles
- G08G1/123—Traffic control systems for road vehicles indicating the position of vehicles, e.g. scheduled vehicles; Managing passenger vehicles circulating according to a fixed timetable, e.g. buses, trains, trams
- G08G1/127—Traffic control systems for road vehicles indicating the position of vehicles, e.g. scheduled vehicles; Managing passenger vehicles circulating according to a fixed timetable, e.g. buses, trains, trams to a central station ; Indicators in a central station
- G08G1/13—Traffic control systems for road vehicles indicating the position of vehicles, e.g. scheduled vehicles; Managing passenger vehicles circulating according to a fixed timetable, e.g. buses, trains, trams to a central station ; Indicators in a central station the indicator being in the form of a map
Definitions
- the present invention relates to a traffic jam sign detection method, a program, and a traffic jam sign detection device.
- vehicle acceleration is obtained based on the vehicle speed detected by the vehicle speed sensor, frequency analysis is performed on the acceleration to calculate a power spectrum, and single regression analysis is performed on the power spectrum to obtain a single regression line.
- a traffic jam prediction method is known in which traffic jam prediction is performed based on the slope maximum value of the single regression line (see, for example, Patent Document 1).
- the aspect which concerns on this invention was made
- a traffic jam sign detection method includes an electronic device including an acceleration information acquisition unit that acquires information on acceleration in each of the first to third axes forming an orthogonal coordinate system in a three-dimensional space.
- An input data calculation step for calculating the autocorrelation of the input data
- a frequency analysis step for calculating a power spectrum by performing a Fourier transform on the autocorrelation, and converting the power spectrum into angle information.
- the traffic jam sign detection step may detect the traffic jam sign according to a change in the angle information according to time.
- a traffic jam sign detection method includes an acceleration information acquisition unit that acquires acceleration information in each axial direction of the first to third axes that form an orthogonal coordinate system of a three-dimensional space with a server device. And a traffic jam sign detection method executed by a traffic jam sign detection system comprising current position information acquisition means for acquiring current position information, and acquired by the acceleration information acquisition means in the electronic device An input data calculating step of calculating an acceleration vector in the three-dimensional space using the acceleration information and calculating a norm of a difference between the vectors at two different timings as input data; and in the electronic device, the input data A frequency analysis step for calculating a power spectrum by calculating an autocorrelation of the power and performing Fourier transform on the autocorrelation.
- a program constitutes an electronic device including acceleration information acquisition means for acquiring information on acceleration in each of the first to third axes forming an orthogonal coordinate system in a three-dimensional space.
- Input data for calculating a vector of acceleration in the three-dimensional space using the acceleration information acquired by the acceleration information acquisition means, and calculating a norm of a difference between the vectors at two different timings as input data
- a calculation means for calculating an autocorrelation of the input data calculated by the input data calculation means, and calculating a power spectrum by performing a Fourier transform on the autocorrelation, and a frequency analysis means.
- Angle information acquisition means for converting the power spectrum into angle information; and
- a traffic jam warning detection means for detecting congestion sign in accordance with the angle information obtained by, to function as a.
- the angle information acquisition unit calculates a single regression line in a low frequency region below a predetermined frequency of the power spectrum, and the inclination of the single regression line is calculated as the angle of the angle. It may be converted into information.
- the traffic jam sign detection unit may detect a traffic jam sign according to a change in the angle information according to time.
- a traffic jam sign detection device includes an acceleration information acquisition unit that acquires information on acceleration in each of the first to third axes forming an orthogonal coordinate system in a three-dimensional space; and the acceleration An input data calculating means for calculating an acceleration vector in the three-dimensional space using the acceleration information acquired by the information acquiring means, and calculating a norm of a difference between the vectors at two different timings as input data; A frequency analysis unit that calculates an autocorrelation of the input data calculated by the input data calculation unit and calculates a power spectrum by performing a Fourier transform on the autocorrelation; and the power spectrum calculated by the frequency analysis unit Angle information acquisition means for converting into angle information; and information on the angle acquired by the angle information acquisition means. And a traffic jam warning detection means for detecting congestion sign according to.
- the angle information acquisition unit calculates a single regression line in a low frequency region below a predetermined frequency of the power spectrum, and calculates the slope of the single regression line.
- the angle information may be converted.
- the traffic jam sign detection means may detect a traffic jam sign according to a change in the angle information according to time.
- the traffic jam sign (that is, the possibility of the occurrence of traffic jams) compared to the case of using acceleration information only in a single axial direction or an axial direction in a plane. ), It is possible to improve resistance to noise in detecting traffic jam signs and improve detection accuracy. Furthermore, by using the norm of the difference vector of accelerations at two different timings as input data for frequency analysis, it is possible to perform appropriate frequency analysis on the acceleration generated in the electronic device regardless of the position and orientation of the electronic device. And convenience can be improved.
- the influence of the power spectrum of the low frequency rather than the high frequency has a greater influence on the prediction of the traffic jam.
- the detection accuracy of a traffic jam sign can be improved by converting the power spectrum in the low frequency region into information of an angle corresponding to the slope of the single regression line by the least square method or the like.
- the energy consumption rate of a moving body that moves with an electronic device can be predicted with high accuracy. For example, it is possible to determine whether or not the total power of acceleration and deceleration in a predetermined time range exceeds a predetermined threshold based on information on a duration during which the value of the angle is maintained. If it exceeds, it can be determined that traffic congestion is likely to occur and energy efficiency is reduced. Furthermore, the information on the detected traffic jam sign can be used as an index according to the energy consumption rate of the moving body that moves together with the electronic device. For example, in a vehicle or the like, a change in energy consumption rate (for example, fuel consumption, power consumption, etc.) can be presented based on acceleration information without directly calculating fuel consumption, power consumption, or the like.
- the moving states of a plurality of moving bodies that move with the electronic device are taken into consideration within an appropriate position range.
- by providing information on traffic jam signs in this position range to each electronic device it is possible to efficiently suppress or eliminate the traffic in conjunction with a plurality of moving bodies that move with the electronic device.
- the acceleration of a three-dimensional space showing a sharper change with respect to a traffic jam sign that is, the possibility of traffic jam occurrence).
- the traffic jam sign (that is, the possibility of traffic jam occurrence) is compared with the case of using the acceleration information only in the single axial direction or the axial direction in the plane.
- an acceleration vector in a three-dimensional space that shows a clearer change it is possible to improve resistance to noise in detecting traffic jam signs and improve detection accuracy.
- the norm of the difference vector of accelerations at two different timings as input data for frequency analysis, it is possible to perform appropriate frequency analysis on the acceleration generated in the electronic device regardless of the position and orientation of the electronic device. And convenience can be improved.
- the influence of the power spectrum of the low frequency is larger than the high frequency on the prediction of the traffic jam. For this reason, the detection accuracy of a traffic jam sign can be improved by converting the power spectrum in the low frequency region into information of an angle corresponding to the slope of the single regression line by the least square method or the like. Furthermore, it is possible to accurately predict the energy consumption rate of a moving object that moves with the electronic device. For example, as the angle increases in the negative direction, the delay in the dynamic time response of acceleration and deceleration changes to an increasing tendency, and the variation in speed increases, thereby giving priority to the energy efficiency of a moving object such as a vehicle. It is difficult to limit the amount of traffic, and traffic congestion is likely to occur, and energy efficiency is reduced.
- the energy consumption rate of a moving body that moves with an electronic device can be predicted with high accuracy. For example, it is possible to determine whether or not the total power of acceleration and deceleration in a predetermined time range exceeds a predetermined threshold based on information on a duration during which the value of the angle is maintained. If it exceeds, it can be determined that traffic congestion is likely to occur and energy efficiency is reduced. Furthermore, the information on the detected traffic jam sign can be used as an index according to the energy consumption rate of the moving body that moves together with the electronic device. For example, in a vehicle or the like, a change in energy consumption rate (for example, fuel consumption, power consumption, etc.) can be presented based on acceleration information without directly calculating fuel consumption, power consumption, or the like.
- the traffic jam sign (that is, the possibility of occurrence of traffic jams) compared to the case of using acceleration information only in a single axial direction or an axial direction in a plane. ), It is possible to improve resistance to noise in detecting traffic jam signs and improve detection accuracy. Furthermore, by using the norm of the difference vector of accelerations at two different timings as input data for frequency analysis, it is possible to perform appropriate frequency analysis on the acceleration generated in the electronic device regardless of the position and orientation of the electronic device. And convenience can be improved.
- the influence of the power spectrum of the low frequency rather than the high frequency has a greater influence on the prediction of the traffic jam.
- the detection accuracy of a traffic jam sign can be improved by converting the power spectrum in the low frequency region into information of an angle corresponding to the slope of the single regression line by the least square method or the like.
- the energy consumption rate of a moving body that moves with an electronic device can be predicted with high accuracy. For example, it is possible to determine whether or not the total power of acceleration and deceleration in a predetermined time range exceeds a predetermined threshold based on information on a duration during which the value of the angle is maintained. If it exceeds, it can be determined that traffic congestion is likely to occur and energy efficiency is reduced. Furthermore, the information on the detected traffic jam sign can be used as an index according to the energy consumption rate of the moving body that moves together with the electronic device. For example, in a vehicle or the like, a change in energy consumption rate (for example, fuel consumption, power consumption, etc.) can be presented based on acceleration information without directly calculating fuel consumption, power consumption, or the like.
- the traffic jam sign detection device 10 is, for example, a portable terminal carried by an occupant of a mobile body such as a vehicle, an information device detachably mounted on a mobile body such as a vehicle, or a mobile body such as a vehicle in advance. Electronic devices such as on-board navigation devices.
- the traffic jam sign detection device 10 is capable of bidirectional communication with an external device, for example, by wireless communication via a wireless communication network system including a base station.
- the wireless communication network system includes, for example, a base station for wireless communication and a public communication network such as the Internet that connects the base station and an external device in a wired manner.
- a base station for wireless communication information transmitted from an external device by wired communication is received by the base station, and transferred from the base station to the traffic jam sign detection device 10 by wireless communication.
- Information transmitted from the traffic jam sign detection device 10 by wireless communication is received by the base station and transferred from the base station to an external device by wired communication.
- the traffic jam sign detection device 10 includes a device communication device 11, a positioning signal receiver 12, a current position acquisition unit 13, a three-dimensional acceleration sensor 14, an input device 15, a display device 16, a device control unit 17, It has.
- the device communication apparatus 11 can communicate with an external apparatus via various wireless communication network systems such as a client server type, and transmits and receives various signals.
- various wireless communication network systems such as a client server type
- the communication between the traffic jam sign detection device 10 and the external device is not limited to the communication mode described above, and other communication such as communication via a communication satellite may be employed.
- the positioning signal receiver 12 is used in, for example, a positioning system (for example, Global Positioning System: GPS or Global Navigation Satellite System: GNSS) for measuring the position of the traffic jam sign detection device 10 using an artificial satellite. Receive positioning signals.
- the current position acquisition unit 13 detects the current position of the traffic jam sign detection device 10 using the positioning signal received by the positioning signal receiver 12.
- the three-dimensional acceleration sensor 14 is a three-axis acceleration sensor having a so-called three-axis number of detection axes, and the acceleration generated in the traffic jam sign detection device 10 in a predetermined sampling cycle forms an orthogonal coordinate system in a three-dimensional space. Detected as acceleration in the axial direction of the axis, the Y axis, and the Z axis.
- the input device 15 includes, for example, a switch, a touch panel, a keyboard, a voice input device, and the like, and outputs signals according to various input operations by the operator.
- the display device 16 is, for example, various displays such as a liquid crystal display device, and displays various information output from the device control unit 17.
- the device control unit 17 controls various operations of the traffic jam sign detection device 10.
- the device control unit 17 includes an input data calculation unit 21, a frequency analysis unit 22, a single regression line calculation unit 23, a determination data calculation unit 24, and a traffic jam prediction unit 25.
- the buffer size of a buffer (not shown) that can store acceleration information in the X-axis, Y-axis, and Z-axis directions detected by the three-dimensional acceleration sensor 14, that is, the number of samples of acceleration information is For example, an appropriate setting screen displayed on the display device 16 can be appropriately set by the operator.
- the frequency analysis unit 22 performs frequency analysis on the input data calculated by the input data calculation unit 21 and calculates a power spectrum (acceleration spectrum) corresponding to the frequency. For example, the frequency analysis unit 22 calculates the autocorrelation of the input data by using the number of input / output points of the input data with respect to the frequency analysis and the autocorrelation delay number. Then, an acceleration spectrum is calculated by performing a fast Fourier transform on the autocorrelation.
- the number of input / output points of input data for frequency analysis, the number of autocorrelation delays, and the selection of whether or not to subtract the average value from the autocorrelation input value are, for example, an appropriate setting screen displayed on the display device 16 It can be set by the operator.
- the frequency analysis unit 22 calculates the acceleration spectrum for a predetermined period by performing autocorrelation calculation and fast Fourier transform on the input / output points of the input data calculated by the input data calculation unit 21 at the sampling period ⁇ T. .
- the single regression line calculation unit 23 calculates a single regression line in a predetermined frequency range of the acceleration spectrum calculated by the frequency analysis unit 22, and converts the inclination of the single regression line into information on an angle (spectrum angle). For example, in chaos theory, the influence of a power spectrum at a low frequency is larger than a high frequency on the prediction of a traffic jam. For this reason, as shown in FIG. 3, the single regression line calculation unit 23 performs the minimum two for the acceleration spectrum in the low frequency region (for example, the frequency region above the lower limit frequency fa and below the predetermined frequency fb) of the predetermined frequency fb or less.
- a single regression line L is calculated by multiplication or the like. Then, the calculated inclination of the single regression line L is converted into information of an angle (spectral angle) ⁇ .
- the delay in the dynamic time response of acceleration and deceleration changes to increase, and the speed variation increases. To do.
- the vehicle's energy efficiency such as fuel efficiency or power consumption
- the absolute value of the spectral angle ⁇ when the absolute value of the spectral angle ⁇ is small, it corresponds to the case where the shock wave (vibration, fluctuation) received by the vehicle moving together with the traffic jam sign detection device 10 from the preceding vehicle is small, the reaction delay with respect to the preceding vehicle is small, and the inter-vehicle distance This is equivalent to a case where the vehicle group is difficult to be formed due to a long period of time, that is, there is little possibility of traffic congestion.
- the absolute value of the spectrum angle ⁇ when the absolute value of the spectrum angle ⁇ is large, it corresponds to the case where the shock wave (vibration, fluctuation) received from the preceding vehicle by the vehicle moving together with the traffic jam sign detection device 10 is large, and the reaction delay with respect to the preceding vehicle is large.
- the shock wave (vibration, fluctuation) referred to here means that this operation (back and forth movement) is propagated to the rear vehicle as a kind of vibration by repeating the acceleration and deceleration operations.
- the determination data calculation unit 24 uses the angle information calculated by the single regression line calculation unit 23 to indicate information indicating a change in angle according to time (for example, information on a duration in which an angle value is maintained, an angle Information on the convergence time required for the absolute value of the value to converge to zero is calculated as determination data to be input to the traffic jam prediction unit 25. For example, as shown in Equation (2) below, the determination data calculation unit 24 determines the determination interval N (N is a natural number) and the angle threshold ⁇ T, and the angle ⁇ j calculated by the single regression line calculation unit 23 in the determination interval N. The determination data S N is calculated based on (j is a natural number equal to or less than N).
- the determination section N and the angle threshold ⁇ T can be set by the operator on an appropriate setting screen displayed on the display device 16, for example.
- the determination section N is, for example, a score of angle information corresponding to a period that can be appropriately set by the operator, that is, a score of angle information calculated by the single regression line calculation unit 23 during this period.
- the determination data calculation unit 24 determines the determination data S N of the determination section N corresponding to a predetermined period based on the angle ⁇ j (1 ⁇ j ⁇ N) calculated by the single regression line calculation unit 23 in the sampling period ⁇ T. Is calculated.
- the angle threshold value ⁇ T can be set to an arbitrary value by the operator, and is, for example, “ ⁇ 45 degrees” that is generally known as (1 / f) fluctuation characteristics.
- Determination data S N of the equation (2) shows the total power of the acceleration and deceleration of a predetermined time period corresponding to the determined interval N, the comparison with a predetermined threshold corresponding to a predetermined angle threshold theta T. For example, when this total power exceeds a predetermined threshold, traffic congestion is likely to occur, and the vehicle energy efficiency (fuel consumption, electricity consumption, etc.) decreases. For example, in the case of shifting from a stationary state of the vehicle to constant speed running with appropriate acceleration, such as a change in acceleration and spectral angle and an average behavior during the period from time ta to time tb shown in FIG. Is small.
- the absolute value of the spectrum angle temporarily increases due to, for example, the detection error of the three-dimensional acceleration sensor 14, it immediately converges toward zero, so the total power of acceleration and deceleration becomes a small value.
- the vehicle suddenly decelerates or decelerates immediately after acceleration as in the case of acceleration and spectral angle variation and average behavior during the period from time tb to time tc shown in FIG. .
- the absolute value of the spectrum angle becomes a large value, and the time required for convergence toward zero becomes long. Therefore, the total power for acceleration and deceleration becomes a large value.
- the traffic jam prediction unit 25 detects a traffic jam sign indicating a possibility that a traffic jam (traffic jam) will occur in the future or that a traffic jam has already occurred in accordance with the judgment data calculated by the judgment data calculation unit 24. To do.
- the degree of traffic jam sign indicating the magnitude of the traffic jam sign increases when the possibility of a traffic jam is high in the forward direction of travel of the vehicle moving together with the traffic jam sign detection device 10, and decreases when the possibility of a traffic jam is low.
- the traffic jam prediction unit 25 determines whether or not the determination data SN calculated by the determination data calculation unit 24 exceeds an appropriate threshold (that is, a threshold value of acceleration change intensity).
- an appropriate threshold value for the determination data SN can be set by the operator on, for example, an appropriate setting screen displayed on the display device 16.
- the traffic jam sign detection device 10 that realizes the traffic jam sign detection method according to the present embodiment has the above-described configuration. Next, the operation of the traffic jam sign detection device 10, that is, the traffic jam sign detection method will be described.
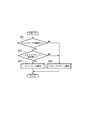
- step S01 shown in FIG. 5 it is determined whether or not the three-dimensional acceleration sensor 14 detects accelerations in the X-axis, Y-axis, and Z-axis directions. If the determination result is “NO”, the determination process of step S01 is repeatedly executed. On the other hand, if this determination is “YES”, the flow proceeds to step S 02.
- step S02 input data calculation step
- the acceleration vector A in the three-dimensional space is calculated using the accelerations in the X-axis, Y-axis, and Z-axis directions detected by the three-dimensional acceleration sensor 14. To do.
- the norm u of the difference (acceleration vector difference) ⁇ A between the acceleration vectors A at two different timings with a time interval of the sampling period ⁇ T is calculated as input data.
- step S03 frequency analysis step
- step S03 the autocorrelation of the input data is calculated using the number of input / output points that can be appropriately set by the operator and the number of delays that can be appropriately set by the operator.
- a power spectrum acceleration spectrum
- step S04 angle information acquisition step
- step S05 the absolute value of the spectral angle theta determines whether exceeds the appropriate settable threshold angle theta T by the operator.
- step S 06 determines whether this determination is “YES” or “1” indicating permission to execute the alarm is set in the flag value of the alarm flag, and the flow proceeds to step S 08 described later.
- this determination is “NO”
- the flow proceeds to step S 07, and in this step S 07, “0” indicating that the warning is not permitted is set in the flag value of the warning flag, and the flow proceeds to step S 08. .
- step S08 the determination data S N shown in the above equation (2) is calculated as information indicating the change in the spectrum angle ⁇ according to time using the information on the spectrum angle ⁇ .
- step S09 congestion sign detection step
- a threshold value of acceleration change To determine whether the spectral angle ⁇ is slow to converge toward zero. If this determination is “NO”, the flow proceeds to step S 10, and in this step S 10, a predetermined normal screen (for example, a first interface screen P shown in FIG. 9A described later and shown in FIG. 10A) is displayed on the display device 16.
- step S11 it is determined whether or not the flag value of the alarm flag is “1”. If this determination is “NO”, the flow proceeds to step S 10 described above. On the other hand, if this determination is “YES”, the flow proceeds to step S12.
- step S12 a predetermined alarm screen (for example, a first interface screen P shown in FIG. 9C and a second interface screen Q shown in FIG. 10C described later) is displayed on the display device 16, and a speaker (not shown). A predetermined alarm sound is output from, and the process proceeds to the end.
- the alarm screen when displaying a predetermined alarm screen on the display device 16 and when outputting a predetermined alarm sound from a speaker (not shown), the alarm screen is displayed at a very short time interval such as ms units.
- an appropriate suppression time may be provided. Note that the appropriate suppression time can be appropriately set by the operator on, for example, an appropriate setting screen displayed on the display device 16. Depending on the suppression time, display of a continuous alarm screen and output of an alarm sound can be prohibited.
- the traffic jam sign detection device 10 and the traffic jam sign detection method of the present embodiment only a single axial direction (for example, the front-rear direction of the traveling direction of a moving body such as a vehicle) or an axial direction in a plane is only used.
- the use of the acceleration vector A in a three-dimensional space that shows a clearer change with respect to a traffic jam sign improves the noise tolerance of the traffic jam sign detection and improves the detection accuracy. be able to.
- the norm u of the difference ⁇ A between the acceleration vectors A at two different timings as input data for frequency analysis, the acceleration generated in the traffic jam sign detection device 10 can be detected regardless of the position and posture of the traffic jam sign detection device 10. Appropriate frequency analysis can be performed, and convenience can be improved.
- the information on the change in the spectral angle according to the time can be used to improve the detection accuracy of a traffic jam sign and the movement of the vehicle or the like
- the energy consumption rate of the body can be accurately predicted.
- the information on the detected traffic jam sign can be used as an index according to the energy consumption rate (for example, the fuel consumption or electric cost of the vehicle) of a moving body such as a vehicle that moves with the traffic jam sign detection device 10.
- a change in energy consumption rate for example, fuel consumption, power consumption, etc.
- the traffic jam sign detection is performed by at least one traffic jam sign detection device 10 and the server device 31 that can communicate with the traffic jam sign detection device 10.
- System 30 may be configured.
- the server device 31 of this modification includes a server communication device 32, a server control unit 33, a map data storage unit 34, and a range traffic jam prediction unit 35.
- the server communication device 32 can bidirectionally communicate with the device communication device 11 of the traffic jam sign detection device 10 by, for example, wireless communication through a wireless communication network system or road-to-vehicle communication through a roadside communication device. Send and receive various information.
- the server control unit 33 outputs various information received from the traffic jam sign detection device 10 by the server communication device 32 to the range traffic jam prediction unit 35.
- the traffic jam sign detection device 10 uses, for example, a single regression line calculation unit as information based on the X-axis, Y-axis, and Z-axis accelerations detected by the three-dimensional acceleration sensor 14. 23, the angle information calculated by the determination data calculation unit 24, the determination data calculated by the determination data calculation unit 24, the traffic congestion predictor information calculated by the traffic jam prediction unit 25, and the current position acquired by the current position acquisition unit 13. Information can be transmitted to the server device 31.
- the map data storage unit 34 stores map data.
- the map data includes, for example, road coordinate data indicating position coordinates on a road required for map matching processing based on information on the current position of the traffic jam sign detection device 10, and a road map required for calculating a guidance route.
- Data for example, node, link, link cost, road shape, road type, etc.
- the node is a coordinate point composed of the latitude and longitude of a predetermined point on the road such as an intersection and a branch point.
- a link is a line that connects nodes, and is a road section that connects points.
- the link cost is information indicating the distance of the road section corresponding to the link or the time required for the movement of the road section.
- the range traffic jam prediction unit 35 for example, in an appropriate position range based on the current position information received from at least one traffic jam sign detection device 10, for example, the absolute value of the angle received from the traffic jam sign detection device 10, A traffic jam sign within this position range is detected based on the number and ratio of the traffic jam sign detection devices 10 whose determination data or traffic jam sign degree is equal to or greater than a predetermined value. Then, information on the traffic jam sign in this position range is transmitted to the traffic jam sign detection apparatus 10 in this position range via the server communication device 32.
- the traffic jam sign detection system 30 that implements the traffic jam sign detection method according to this modification has the above-described configuration. Next, the operation of the traffic jam sign detection system 30, particularly the operation of the traffic jam sign detection device 10 will be described.
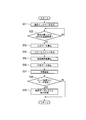
- step S21 shown in FIG. 7 the traffic jam sign detection device 10 is connected to a communication network such as a wireless communication network system, and properly connected to the server device 31 through this communication network without communication failure. Determine whether it is possible. If the determination result is “NO”, the process of step S21 is repeated. On the other hand, if this determination is “YES”, the flow proceeds to step S22.
- a communication network such as a wireless communication network system
- step S22 it is determined whether or not an instruction to execute a stand-alone operation independent of an external device such as the server device 31 is generated by an instruction from the operator.
- the determination result is “YES”, that is, when there is no instruction for executing the stand-alone operation
- the process proceeds to step S23, and in this step S23, a network operation described later is performed and the process proceeds to the end.
- this determination is “NO”, the flow proceeds to step S 24, where the processing from step S 01 to step S 12 in the above-described embodiment is executed as a stand-alone operation.
- step S31 shown in FIG. 8 the traffic jam sign detection device 10 is connected to a communication network such as a wireless communication network system, and properly connected to the server device 31 through this communication network without any communication failure.
- a predetermined communication indicator display indicating that it is possible is displayed on the display device 16.
- step S32 whether or not the acceleration in the X-axis, Y-axis, and Z-axis directions is detected by the three-dimensional acceleration sensor 14 and the current position information is acquired by the current position acquisition unit 13 is determined. Determine. If the determination result is “NO”, the determination process of step S32 is repeatedly executed. On the other hand, if the determination is “YES”, the flow proceeds to step S33.
- step S33 input data calculation step
- the acceleration vector A in the three-dimensional space is calculated using the accelerations in the X-axis, Y-axis, and Z-axis directions detected by the three-dimensional acceleration sensor 14. To do. Then, the norm u of the difference (acceleration vector difference) ⁇ A between the acceleration vectors A at two different timings with a time interval of the sampling period ⁇ T is calculated as input data.
- step S34 frequency analysis step
- the autocorrelation of the input data is calculated using the number of input / output points that can be appropriately set by the operator and the number of delays that can be appropriately set by the operator.
- a power spectrum is calculated by performing a fast Fourier transform on the autocorrelation.
- step S35 angle information acquisition step
- step S35 angle information acquisition step
- step S36 the determination data S N shown in the above equation (2) is calculated as information indicating the change in the spectrum angle ⁇ according to time using the information on the spectrum angle ⁇ .
- step S ⁇ b> 37 electronic device information transmission step
- the information of the determination data SN is transmitted to the server device 31 via the device communication apparatus 11.
- step S ⁇ b> 38 it is determined whether information on a traffic jam sign within an appropriate position range detected by the server device 31 has been received from the server device 31. If this determination is “NO”, the flow proceeds to return. On the other hand, if this determination is “YES”, the flow proceeds to step S 39, and in this step S 39, a display screen corresponding to the traffic jam sign information in the appropriate position range received from the server device 31 is displayed on the display device 16. And proceed to return.
- the traffic jam sign detection device 10 has a plurality of interface screens (for example, the first interface screen P shown in FIGS. 9A to 9D and FIGS. 10A to 9D) that can be appropriately selected by the operator.
- the traffic jam sign detected by the traffic jam prediction unit 25 or the calculated traffic jam sign degree can be displayed on the display device 16 in a plurality of stages (for example, three stages).
- the first interface screen P shown in FIG. 9A and the second interface screen Q shown in FIG. 10A have no change in acceleration or less than a predetermined level, such as when the vehicle is stopped or at a constant speed. Displayed when the absolute value of the spectral angle is zero or less than a predetermined value near zero.
- the first interface screen P shown in FIG. 9A includes, for example, a figure Pa1 such as an ellipsoid of a predetermined color (for example, bright green) indicating stability and a wave figure Pb1 having a small wave height.
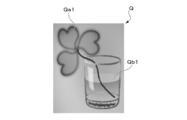
- the second interface screen Q shown in FIG. 10A includes, for example, a graphic Qa1 such as a clover of a predetermined color (for example, bright green) indicating stability and a small wave height wave graphic Qb1.
- the first interface screen P shown in FIG. 9B and the second interface screen Q shown in FIG. 10B are during normal driving, such as when the vehicle is slowly accelerating or decelerating, or when the engine brake is operating, etc. Even if the absolute value of the spectral angle temporarily increases due to vibration or the like, it is displayed when it immediately converges toward zero.
- the first interface screen P shown in FIG. 9B includes, for example, a figure Pa2 such as an ellipsoid of a predetermined color (for example, dark green) indicating a normal state and a wave figure Pb2 having a slightly large wave height.
- the second interface screen Q shown in FIG. 10B includes, for example, a graphic Qa2 such as a clover of a predetermined color (for example, dark green) indicating a normal state and a wave graphic Qb2 having a slightly large wave height.
- the first interface screen P shown in FIG. 9C and the second interface screen Q shown in FIG. 10C have predetermined acceleration changes such as when the vehicle suddenly starts, sudden braking, frequent acceleration and deceleration, etc. Displayed when the absolute value of the spectrum angle becomes a large value due to being larger than the change, and the time required to converge toward zero becomes longer.
- the first interface screen P shown in FIG. 9C includes, for example, a figure Pa3 such as an ellipsoid of a predetermined color (for example, blue) indicating instability and a wave figure Pb3 having a large wave height.
- the second interface screen Q shown in FIG. 10C includes, for example, a graphic Qa3 such as a clover of a predetermined color (eg, blue) indicating instability and a graphic Qb3 of a wave with a large wave height.
- predetermined communication indicator displays Pc and Qc are displayed.
- the traffic jam sign detection device 10 and the server device 31 of the traffic jam sign detection system 30 may be realized by dedicated hardware, or may be a traffic jam sign.
- a program for realizing the functions of the detection device 10 and the server device 31 is recorded on a computer-readable recording medium, and the program recorded on the recording medium is read into a computer system and executed, thereby executing a traffic jam sign detection device. 10 and server device 31 may be operated.
- the computer system referred to here includes an OS and hardware such as peripheral devices.
- the computer system also includes a WWW system provided with a homepage providing environment (or display environment).
- the computer-readable recording medium means a portable medium such as a flexible disk, a magneto-optical disk, a ROM, and a CD-ROM, and a storage device such as a hard disk built in the computer system.
- the computer-readable recording medium is a volatile memory (RAM) inside a computer system that becomes a server or a client when a program is transmitted via a network such as the Internet or a communication line such as a telephone line.
- RAM volatile memory
- the program may be transmitted from a computer system storing the program in a storage device or the like to another computer system via a transmission medium or by a transmission wave in the transmission medium.
- the transmission medium for transmitting the program refers to a medium having a function of transmitting information, such as a network (communication network) such as the Internet or a communication line (communication line) such as a telephone line.
- the program may be for realizing a part of the functions described above. Furthermore, what can implement
- the server device 31 is configured as one device. However, a plurality of devices may be connected by a communication line or the like.
- Traffic sign detection device 12 Positioning signal receiver 13 Current position acquisition unit (current position information acquisition unit) 14 Three-dimensional acceleration sensor (acceleration information acquisition unit) 15 Input device 16 Display device 17 Device control unit 21 Input data calculation unit (input) (Data calculation means) 22 Frequency analysis section (frequency analysis means) 23 Single regression line calculation section (angle information acquisition means) 24 Judgment data calculation section (congestion sign detection means) 25 Congestion prediction section (congestion sign detection means) 30 Congestion sign detection System 31 Server device 35 Range traffic jam prediction section
Landscapes
- Physics & Mathematics (AREA)
- General Physics & Mathematics (AREA)
- Engineering & Computer Science (AREA)
- Chemical & Material Sciences (AREA)
- Analytical Chemistry (AREA)
- Radar, Positioning & Navigation (AREA)
- Remote Sensing (AREA)
- Mathematical Physics (AREA)
- Transportation (AREA)
- Mechanical Engineering (AREA)
- Automation & Control Theory (AREA)
- Traffic Control Systems (AREA)
- Navigation (AREA)
Abstract
Description
本願は、2013年3月8日に出願された日本国特願2013-046969号に基づき優先権を主張し、その内容をここに援用する。
(1)本発明の一態様に係る渋滞予兆検知方法は、3次元空間の直交座標系を成す第1から第3軸の各軸方向の加速度の情報を取得する加速度情報取得手段を備える電子機器が実行する渋滞予兆検知方法であって、前記加速度情報取得手段によって取得された前記加速度の情報を用いて前記3次元空間における加速度のベクターを算出し、2つの異なるタイミングの前記ベクターの差分のノルムを入力データとして算出する入力データ算出ステップと、前記入力データの自己相関を算出し、前記自己相関にフーリエ変換を行なうことによってパワースペクトルを算出する周波数分析ステップと、前記パワースペクトルを角度の情報に変換する角度情報取得ステップと、前記角度の情報に応じて渋滞予兆を検知する渋滞予兆検知ステップと、を含む。
さらに、2つの異なるタイミングの加速度のベクターの差分のノルムを周波数分析の入力データとして用いることによって、電子機器の位置や姿勢にかかわらずに、電子機器に生じる加速度に対する適正な周波数分析を行なうことができ、利便性を向上させることができる。
例えば、角度がマイナス方向に増大するほど、加速および減速の動的時間応答の遅れが増大傾向に変化し、速度のばらつきが増大することによって、車両などの移動体のエネルギー効率を優先させる運転領域を限定することが困難となり、渋滞が発生し易くなるとともにエネルギー効率が低下する。
例えば、角度の値が維持される持続時間の情報などに基づいて、所定時間範囲での加速および減速の総パワーが所定閾値を超えるか否かを判定することができ、この総パワーが所定閾値を超えた場合には、渋滞が発生し易くなるとともにエネルギー効率が低下すると判定することができる。
さらに、検知した渋滞予兆の情報を、電子機器とともに移動する移動体のエネルギー消費率に応じた指標として用いることができる。例えば、車両などにおいては、燃費や電費などを直接的に算出する必要無しに、加速度の情報に基づいてエネルギー消費率(例えば、燃費や電費など)の変化を提示することができる。
また、単一の軸方向や平面内の軸方向のみの加速度の情報を用いる場合に比べて、渋滞予兆(つまり渋滞発生の可能性)に対してより鮮明な変化を示す3次元空間の加速度のベクターを用いることによって、渋滞予兆検知のノイズに対する耐性を向上させ、検知精度を向上させることができる。
さらに、2つの異なるタイミングの加速度のベクターの差分のノルムを周波数分析の入力データとして用いることによって、電子機器の位置や姿勢にかかわらずに、電子機器に生じる加速度に対する適正な周波数分析を行なうことができ、利便性を向上させることができる。
さらに、2つの異なるタイミングの加速度のベクターの差分のノルムを周波数分析の入力データとして用いることによって、電子機器の位置や姿勢にかかわらずに、電子機器に生じる加速度に対する適正な周波数分析を行なうことができ、利便性を向上させることができる。
例えば、角度がマイナス方向に増大するほど、加速および減速の動的時間応答の遅れが増大傾向に変化し、速度のばらつきが増大することによって、車両などの移動体のエネルギー効率を優先させる運転領域を限定することが困難となり、渋滞が発生し易くなるとともにエネルギー効率が低下する。
例えば、角度の値が維持される持続時間の情報などに基づいて、所定時間範囲での加速および減速の総パワーが所定閾値を超えるか否かを判定することができ、この総パワーが所定閾値を超えた場合には、渋滞が発生し易くなるとともにエネルギー効率が低下すると判定することができる。
さらに、検知した渋滞予兆の情報を、電子機器とともに移動する移動体のエネルギー消費率に応じた指標として用いることができる。例えば、車両などにおいては、燃費や電費などを直接的に算出する必要無しに、加速度の情報に基づいてエネルギー消費率(例えば、燃費や電費など)の変化を提示することができる。
さらに、2つの異なるタイミングの加速度のベクターの差分のノルムを周波数分析の入力データとして用いることによって、電子機器の位置や姿勢にかかわらずに、電子機器に生じる加速度に対する適正な周波数分析を行なうことができ、利便性を向上させることができる。
例えば、角度がマイナス方向に増大するほど、加速および減速の動的時間応答の遅れが増大傾向に変化し、速度のばらつきが増大することによって、車両などの移動体のエネルギー効率を優先させる運転領域を限定することが困難となり、渋滞が発生し易くなるとともにエネルギー効率が低下する。
例えば、角度の値が維持される持続時間の情報などに基づいて、所定時間範囲での加速および減速の総パワーが所定閾値を超えるか否かを判定することができ、この総パワーが所定閾値を超えた場合には、渋滞が発生し易くなるとともにエネルギー効率が低下すると判定することができる。
さらに、検知した渋滞予兆の情報を、電子機器とともに移動する移動体のエネルギー消費率に応じた指標として用いることができる。例えば、車両などにおいては、燃費や電費などを直接的に算出する必要無しに、加速度の情報に基づいてエネルギー消費率(例えば、燃費や電費など)の変化を提示することができる。
本実施形態による渋滞予兆検知装置10は、例えば、車両などの移動体の乗員が携帯する携帯端末、または車両などの移動体に着脱可能に搭載された情報機器、または予め車両などの移動体に搭載されたナビゲーション装置などの電子機器、などである。
渋滞予兆検知装置10は、例えば、基地局などを備える無線通信ネットワークシステムを介した無線通信などによって、外部装置に対して双方向通信可能とされている。
また、渋滞予兆検知装置10から無線通信によって発信された情報は基地局によって受信され、この基地局から有線通信によって外部装置へ転送される。
現在位置取得部13は、測位信号受信器12によって受信された測位信号を用いて渋滞予兆検知装置10の現在位置を検出する。
表示装置16は、例えば、液晶表示装置などの各種のディスプレイであり、機器制御部17から出力される各種の情報を表示する。
機器制御部17は、入力データ算出部21と、周波数分析部22と、単回帰直線算出部23と、判定データ算出部24と、渋滞予測部25と、を備えている。
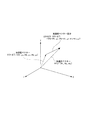
図2に示すように、入力データ算出部21は、例えば、適宜の時刻tの加速度ベクターA(t)=(axt,ayt,azt)と、この時刻tよりもサンプリング周期ΔTだけ以前の時刻t-ΔTの加速度ベクターA(t-ΔT)=(axt-ΔT,ayt-ΔT,azt-ΔT)とによって、加速度ベクター差分ΔA=A(t)-A(t-ΔT)を算出する。そして、下記数式(1)に示すように、加速度ベクター差分ΔAのノルムutを算出する。
なお、3次元加速度センサ14によって検出されたX軸、Y軸、およびZ軸の各軸方向の加速度の情報を格納可能なバッファ(図示略)のバッファサイズ、つまり加速度の情報のサンプル数は、例えば表示装置16に表示される適宜の設定画面などにおいて操作者によって適宜に設定可能とされている。

例えば、周波数分析部22は、周波数分析に対する入力データの入出力点数および自己相関の遅れ数を用いて、入力データの自己相関を算出する。そして、自己相関に高速フーリエ変換を行なうことによって加速度スペクトルを算出する。なお、周波数分析に対する入力データの入出力点数および自己相関の遅れ数と、自己相関の入力値から平均値を引くか否かの選択とは、例えば表示装置16に表示される適宜の設定画面などにおいて操作者によって設定可能とされている。
例えば、周波数分析部22は、サンプリング周期ΔTにて入力データ算出部21によって算出される入力データの入出力点数において自己相関の算出および高速フーリエ変換を行なうことによって、所定期間の加速度スペクトルを算出する。
例えば、カオス理論では渋滞の予測に対して高周波数よりも低周波数のパワースペクトルの影響が大きい。このため、図3に示すように、単回帰直線算出部23は、所定周波数fb以下の低周波領域(例えば、下限周波数fa以上かつ所定周波数fb以下の周波数領域)の加速度スペクトルに対して最小二乗法などによって単回帰直線Lを算出する。そして、算出した単回帰直線Lの傾きを角度(スペクトル角度)θの情報に変換する。
例えば、スペクトル角度θの絶対値が小さい場合は、渋滞予兆検知装置10とともに移動する車両が先行車両から受ける衝撃波(振動、ゆらぎ)が小さい場合に相当し、先行車両に対する反応遅れが小さく、車間距離が長くなって車群が形成され難い、すなわち渋滞に至る可能性が小さい場合に相当する。
逆に、スペクトル角度θの絶対値が大きい場合は、渋滞予兆検知装置10とともに移動する車両が先行車両から受ける衝撃波(振動、ゆらぎ)が大きい場合に相当し、先行車両に対する反応遅れが大きく、車群が密になりやすく、すなわち渋滞に至る可能性が大きい場合に相当する。なお、ここで言う衝撃波(振動、ゆらぎ)とは、車両が加速および減速の動作を繰り返すことにより、この動作(前後の動き)を後方の車両に一種の振動として伝播させることを意味する。
判定データ算出部24は、例えば下記数式(2)に示すように、判定区間N(Nは自然数)および角度閾値θTと、判定区間Nで単回帰直線算出部23によって算出された角度θj(jはN以下の自然数)とによって、判定データSNを算出する。なお、判定区間Nおよび角度閾値θTは、例えば表示装置16に表示される適宜の設定画面などにおいて操作者によって設定可能とされている。そして、判定区間Nは、例えば操作者によって適宜に設定可能な期間に対応する角度の情報の点数、つまり、この期間に単回帰直線算出部23によって算出された角度の情報の点数である。
例えば、判定データ算出部24は、サンプリング周期ΔTにて単回帰直線算出部23によって算出される角度θj(1≦j≦N)に基づき、所定期間に相当する判定区間Nの判定データSNを算出する。なお、角度閾値θTは、操作者によって任意の値を設定可能であるが、例えば、一般的に(1/f)ゆらぎ特性として知られている「-45度」などである。

例えば図4に示す時刻taから時刻tbの期間における加速度およびスペクトル角度の変動および平均的挙動のように、車両の停止状態から適度な加速によって定速走行に移行する場合などにおいては、加速度の変動が小さい。そして、一時的にスペクトル角度の絶対値が増大したとしても、直ぐにゼロに向かい収束するので、加速および減速の総パワーは小さな値となる。
また、例えば図4に示す時刻taから時刻tbの期間における加速度およびスペクトル角度の変動および平均的挙動のように、車両の定速走行もしくはエンジンブレーキなどによって緩やかに減速する場合などにおいては、加速度の変動が小さい。そして、スペクトル角度の絶対値は小さな値を維持するので、加速および減速の総パワーは小さな値となる。この場合、たとえ振動などによって一時的にスペクトル角度の絶対値が増大したとしても、直ぐにゼロに向かい収束するので、加速および減速の総パワーは小さな値となる。また、例えば3次元加速度センサ14の検出誤差などに起因して一時的にスペクトル角度の絶対値が増大したとしても、直ぐにゼロに向かい収束するので、加速および減速の総パワーは小さな値となる。
一方、例えば図4に示す時刻tbから時刻tcの期間における加速度およびスペクトル角度の変動および平均的挙動のように、車両の急減速、または加速後に直ぐに減速する場合などにおいては、加速度の変動が大きい。そして、スペクトル角度の絶対値は大きな値となり、ゼロに向かい収束するのに要する時間が長くなるので、加速および減速の総パワーは大きな値となる。
渋滞予測部25は、例えば、判定データ算出部24によって算出された判定データSNが、適宜の閾値(つまり、加速度変化の強さの閾値)を超えるか否かを判定する。そして、判定データSNが閾値を超えた場合には、車両のエネルギー効率(燃費または電費など)低下する傾向、渋滞が発生し易い状況であると判定する。なお、判定データSNに対する適宜の閾値は、例えば表示装置16に表示される適宜の設定画面などにおいて操作者によって設定可能とされている。
また、渋滞予測部25は、判定データSNおよび閾値と、対応する渋滞予兆度の値との対応関係を予め作成してテーブルとして記憶しておき、判定データSNおよび閾値に対する渋滞予兆度をそのテーブルを参照して求めることもできる。
この判定結果が「NO」の場合には、ステップS01の判定処理を繰り返し実行する。
一方、この判定結果が「YES」の場合には、ステップS02に進む。
次に、ステップS02(入力データ算出ステップ)においては、3次元加速度センサ14によって検出されたX軸、Y軸、およびZ軸の各軸方向の加速度を用いて3次元空間における加速度ベクターAを算出する。そして、サンプリング周期ΔTの時間間隔をおいた2つの異なるタイミングの加速度ベクターAの差分(加速度ベクター差分)ΔAのノルムuを入力データとして算出する。
そして、自己相関に高速フーリエ変換を行なうことによってパワースペクトル(加速度スペクトル)を算出する。
次に、ステップS04(角度情報取得ステップ)においては、加速度スペクトルの所定周波数範囲での単回帰直線を算出し、この単回帰直線の傾きを角度(スペクトル角度)θの情報に変換する。
次に、ステップS05においては、スペクトル角度θの絶対値が、操作者によって適宜に設定可能な角度閾値θTを超えたか否かを判定する。
この判定結果が「YES」の場合には、ステップS06に進み、このステップS06においては、警報フラグのフラグ値に警報の実行許可を示す「1」を設定して、後述するステップS08に進む。
一方、この判定結果が「NO」の場合には、ステップS07に進み、このステップS07においては、警報フラグのフラグ値に警報の実行不許可を示す「0」を設定して、ステップS08に進む。
次に、ステップS09(渋滞予兆検知ステップ)においては、判定データSNが、操作者によって適宜に設定可能な閾値(つまり、加速度変化の強さの閾値)を超えたか否かを判定することなどによって、スペクトル角度θがゼロに向かい収束するのが遅いか否かを判定する。
この判定結果が「NO」の場合には、ステップS10に進み、このステップS10においては、表示装置16に所定の通常画面(例えば、後述する図9Aに示す第1インタフェース画面Pおよび図10Aに示す第2インタフェース画面Qなど)を表示し、エンドに進む。
一方、この判定結果が「YES」の場合には、ステップS11に進む。
そして、ステップS11においては、警報フラグのフラグ値が「1」であるか否かを判定する。
この判定結果が「NO」の場合には、上述したステップS10に進む。
一方、この判定結果が「YES」の場合には、ステップS12に進む。
そして、ステップS12においては、表示装置16に所定の警報画面(例えば、後述する図9Cに示す第1インタフェース画面Pおよび図10Cに示す第2インタフェース画面Qなど)を表示し、スピーカー(図示略)から所定の警報音を出力し、エンドに進む。
さらに、2つの異なるタイミングの加速度ベクターAの差分ΔAのノルムuを周波数分析の入力データとして用いることによって、渋滞予兆検知装置10の位置や姿勢にかかわらずに、渋滞予兆検知装置10に生じる加速度に対する適正な周波数分析を行なうことができ、利便性を向上させることができる。
さらに、検知した渋滞予兆の情報を、渋滞予兆検知装置10とともに移動する車両などの移動体のエネルギー消費率(例えば、車両の燃費または電費など)に応じた指標として用いることができる。例えば、車両などにおいては、燃費や電費などを直接的に算出する必要無しに、加速度の情報に基づいてエネルギー消費率(例えば、燃費や電費など)の変化を提示することができる。
この変形例のサーバ装置31は、サーバ通信装置32と、サーバ制御部33と、地図データ記憶部34と、範囲渋滞予測部35と、を備えている。
なお、この変形例において渋滞予兆検知装置10は、3次元加速度センサ14によって検出されたX軸、Y軸、およびZ軸の各軸方向の加速度に基づいた情報として、例えば、単回帰直線算出部23によって算出された角度の情報、判定データ算出部24によって算出された判定データ、または渋滞予測部25によって算出された渋滞予兆度の情報などと、現在位置取得部13によって取得された現在位置の情報とを、サーバ装置31に送信可能である。
地図データは、例えば、渋滞予兆検知装置10の現在位置の情報に基づくマップマッチングの処理に必要とされる道路上の位置座標を示す道路座標データと、誘導経路の算出に必要とされる道路地図データ(例えば、ノード、リンク、リンクコスト、道路形状および道路種別など)と、を備えている。ノードは、交差点および分岐点などの道路上の所定の地点の緯度および経度からなる座標点である。リンクは、各ノード間を結ぶ線であり、地点間を接続する道路区間である。リンクコストは、リンクに対応する道路区間の距離または道路区間の移動に要する時間を示す情報である。
この判定結果が「NO」の場合には、ステップS21の処理を繰り返し実行する。
一方、この判定結果が「YES」の場合には、ステップS22に進む。
この判定結果が「YES」の場合、つまりスタンドアローン動作の実行指示が無い場合には、ステップS23に進み、このステップS23においては、後述するネットワーク動作を実行し、エンドに進む。
一方、この判定結果が「NO」の場合には、ステップS24に進み、このステップS24においては、スタンドアローン動作として、上述した実施形態でのステップS01からステップS12の処理を実行する。
先ず、図8に示すステップS31においては、渋滞予兆検知装置10が、無線通信ネットワークシステムなどの通信ネットワークに接続され、この通信ネットワークを介して、通信不良など無しに、サーバ装置31に適正に接続可能であることを示す所定の通信インジケータ表示を、表示装置16に表示する。
この判定結果が「NO」の場合には、ステップS32の判定処理を繰り返し実行する。
一方、この判定結果が「YES」の場合には、ステップS33に進む。
次に、ステップS33(入力データ算出ステップ)においては、3次元加速度センサ14によって検出されたX軸、Y軸、およびZ軸の各軸方向の加速度を用いて3次元空間における加速度ベクターAを算出する。そして、サンプリング周期ΔTの時間間隔をおいた2つの異なるタイミングの加速度ベクターAの差分(加速度ベクター差分)ΔAのノルムuを入力データとして算出する。
そして、自己相関に高速フーリエ変換を行なうことによってパワースペクトル(加速度スペクトル)を算出する。
次に、ステップS35(角度情報取得ステップ)においては、加速度スペクトルの所定周波数範囲での単回帰直線を算出し、この単回帰直線の傾きを角度(スペクトル角度)θの情報に変換する。
次に、ステップS36においては、スペクトル角度θの情報を用いて、時間に応じたスペクトル角度θの変化を示す情報として、上記数式(2)に示す判定データSNを算出する。
次に、ステップS38においては、サーバ装置31によって検知された適宜の位置範囲内の渋滞予兆の情報を、サーバ装置31から受信したか否かを判定する。
この判定結果が「NO」の場合には、リターンに進む。
一方、この判定結果が「YES」の場合には、ステップS39に進み、このステップS39においては、サーバ装置31から受信した適宜の位置範囲内の渋滞予兆の情報に応じた表示画面を表示装置16に表示し、リターンに進む。
図9Bに示す第1インタフェース画面Pは、例えば、通常状態を示す所定色(例えば、暗い緑色など)の楕円体などの図形Pa2およびやや大きな波高の波の図形Pb2を備えている。また、図10Bに示す第2インタフェース画面Qは、例えば、通常状態を示す所定色(例えば、暗い緑色など)のクローバーなどの図形Qa2およびやや大きな波高の波の図形Qb2を備えている。
また、上記プログラムは、前述した機能の一部を実現するためのものであってもよい。
さらに、前述した機能をコンピュータシステムに既に記録されているプログラムとの組み合わせで実現できるもの、いわゆる差分ファイル(差分プログラム)であってもよい。
Claims (10)
- 3次元空間の直交座標系を成す第1から第3軸の各軸方向の加速度の情報を取得する加速度情報取得手段を備える電子機器が実行する渋滞予兆検知方法であって、
前記加速度情報取得手段によって取得された前記加速度の情報を用いて前記3次元空間における加速度のベクターを算出し、2つの異なるタイミングの前記ベクターの差分のノルムを入力データとして算出する入力データ算出ステップと、
前記入力データの自己相関を算出し、前記自己相関にフーリエ変換を行なうことによってパワースペクトルを算出する周波数分析ステップと、
前記パワースペクトルを角度の情報に変換する角度情報取得ステップと、
前記角度の情報に応じて渋滞予兆を検知する渋滞予兆検知ステップと、を含む、ことを特徴とする渋滞予兆検知方法。 - 前記角度情報取得ステップにおいて、
前記パワースペクトルの所定周波数以下の低周波領域での単回帰直線を算出し、前記単回帰直線の傾きを前記角度の情報に変換する、ことを特徴とする請求項1に記載の渋滞予兆検知方法。 - 前記渋滞予兆検知ステップにおいて、
時間に応じた前記角度の情報の変化に応じて渋滞予兆を検知する、ことを特徴とする請求項1に記載の渋滞予兆検知方法。 - サーバ装置と、3次元空間の直交座標系を成す第1から第3軸の各軸方向の加速度の情報を取得する加速度情報取得手段および現在位置の情報を取得する現在位置情報取得手段を備える電子機器と、を備える渋滞予兆検知システムが実行する渋滞予兆検知方法であって、
前記電子機器において、前記加速度情報取得手段によって取得された前記加速度の情報を用いて前記3次元空間における加速度のベクターを算出し、2つの異なるタイミングの前記ベクターの差分のノルムを入力データとして算出する入力データ算出ステップと、
前記電子機器において、前記入力データの自己相関を算出し、前記自己相関にフーリエ変換を行なうことによってパワースペクトルを算出する周波数分析ステップと、
前記電子機器において、前記パワースペクトルを角度の情報に変換する角度情報取得ステップと、
前記電子機器において、前記角度の情報と、前記現在位置情報取得手段によって取得された前記現在位置の情報とを、前記サーバ装置に送信する電子機器情報送信ステップと、
前記サーバ装置において、少なくとも1つ以上の前記電子機器から受信した前記現在位置の情報および前記角度の情報を用いて、適宜の位置範囲内における前記角度の絶対値が所定値以上の前記電子機器の数および割合によって、前記位置範囲内の渋滞予兆を検知する位置範囲渋滞予兆検知ステップと、
前記サーバ装置において、前記位置範囲内の渋滞予兆の情報を前記位置範囲内の前記電子機器に送信するサーバ情報送信ステップと、を含む、渋滞予兆検知方法。 - 3次元空間の直交座標系を成す第1から第3軸の各軸方向の加速度の情報を取得する加速度情報取得手段を備える電子機器を構成するコンピュータを、
前記加速度情報取得手段によって取得された前記加速度の情報を用いて前記3次元空間における加速度のベクターを算出し、2つの異なるタイミングの前記ベクターの差分のノルムを入力データとして算出する入力データ算出手段と、
前記入力データ算出手段によって算出された前記入力データの自己相関を算出し、前記自己相関にフーリエ変換を行なうことによってパワースペクトルを算出する周波数分析手段と、
前記周波数分析手段によって算出された前記パワースペクトルを角度の情報に変換する角度情報取得手段と、
前記角度情報取得手段によって取得された前記角度の情報に応じて渋滞予兆を検知する渋滞予兆検知手段と、として機能させるためのプログラム。 - 前記角度情報取得手段は、
前記パワースペクトルの所定周波数以下の低周波領域での単回帰直線を算出し、前記単回帰直線の傾きを前記角度の情報に変換する、ことを特徴とする請求項5に記載のプログラム。 - 前記渋滞予兆検知手段は、
時間に応じた前記角度の情報の変化に応じて渋滞予兆を検知する、ことを特徴とする請求項5に記載のプログラム。 - 3次元空間の直交座標系を成す第1から第3軸の各軸方向の加速度の情報を取得する加速度情報取得手段と、
前記加速度情報取得手段によって取得された前記加速度の情報を用いて前記3次元空間における加速度のベクターを算出し、2つの異なるタイミングの前記ベクターの差分のノルムを入力データとして算出する入力データ算出手段と、
前記入力データ算出手段によって算出された前記入力データの自己相関を算出し、前記自己相関にフーリエ変換を行なうことによってパワースペクトルを算出する周波数分析手段と、
前記周波数分析手段によって算出された前記パワースペクトルを角度の情報に変換する角度情報取得手段と、
前記角度情報取得手段によって取得された前記角度の情報に応じて渋滞予兆を検知する渋滞予兆検知手段と、を備える、ことを特徴とする渋滞予兆検知装置。 - 前記角度情報取得手段は、
前記パワースペクトルの所定周波数以下の低周波領域での単回帰直線を算出し、前記単回帰直線の傾きを前記角度の情報に変換する、ことを特徴とする請求項8に記載の渋滞予兆検知装置。 - 前記渋滞予兆検知手段は、
時間に応じた前記角度の情報の変化に応じて渋滞予兆を検知する、ことを特徴とする請求項8に記載の渋滞予兆検知装置。
Priority Applications (4)
| Application Number | Priority Date | Filing Date | Title |
|---|---|---|---|
| JP2015504418A JP5927336B2 (ja) | 2013-03-08 | 2014-03-07 | 渋滞予兆検知方法、プログラムおよび渋滞予兆検知装置 |
| US14/766,581 US9646492B2 (en) | 2013-03-08 | 2014-03-07 | Congestion sign detection method, program, and congestion sign detection device |
| CN201480005087.XA CN104937647B (zh) | 2013-03-08 | 2014-03-07 | 交通拥堵预兆检测方法及交通拥堵预兆检测装置 |
| BR112015019249A BR112015019249A2 (pt) | 2013-03-08 | 2014-03-07 | método de detecção de indicação de congestionamento, programa, e dispositivo de detecção de indicação de congestionamento |
Applications Claiming Priority (2)
| Application Number | Priority Date | Filing Date | Title |
|---|---|---|---|
| JP2013046969 | 2013-03-08 | ||
| JP2013-046969 | 2013-03-08 |
Publications (1)
| Publication Number | Publication Date |
|---|---|
| WO2014136949A1 true WO2014136949A1 (ja) | 2014-09-12 |
Family
ID=51491456
Family Applications (1)
| Application Number | Title | Priority Date | Filing Date |
|---|---|---|---|
| PCT/JP2014/056012 Ceased WO2014136949A1 (ja) | 2013-03-08 | 2014-03-07 | 渋滞予兆検知方法、プログラムおよび渋滞予兆検知装置 |
Country Status (5)
| Country | Link |
|---|---|
| US (1) | US9646492B2 (ja) |
| JP (1) | JP5927336B2 (ja) |
| CN (1) | CN104937647B (ja) |
| BR (1) | BR112015019249A2 (ja) |
| WO (1) | WO2014136949A1 (ja) |
Cited By (2)
| Publication number | Priority date | Publication date | Assignee | Title |
|---|---|---|---|---|
| WO2015178195A1 (ja) * | 2014-05-20 | 2015-11-26 | 本田技研工業株式会社 | 運転特性評価方法、プログラムおよび運転特性評価装置 |
| JP2016206886A (ja) * | 2015-04-21 | 2016-12-08 | 本田技研工業株式会社 | 運転支援方法、プログラム、および運転支援装置 |
Families Citing this family (6)
| Publication number | Priority date | Publication date | Assignee | Title |
|---|---|---|---|---|
| JP6166226B2 (ja) * | 2014-07-01 | 2017-07-19 | 本田技研工業株式会社 | 渋滞予兆検知方法、プログラムおよび渋滞予兆検知装置 |
| CN106612491A (zh) * | 2015-10-22 | 2017-05-03 | 中兴通讯股份有限公司 | 一种实现报警的方法、装置和系统 |
| US10163339B2 (en) * | 2016-12-13 | 2018-12-25 | Sap Se | Monitoring traffic congestion |
| JP2019200481A (ja) * | 2018-05-14 | 2019-11-21 | 株式会社デンソーテン | 端末装置および収集方法 |
| CN110995606B (zh) * | 2019-12-20 | 2022-02-22 | 迈普通信技术股份有限公司 | 一种拥塞分析方法及装置 |
| CN112598907B (zh) * | 2020-12-17 | 2021-12-07 | 东风商用车有限公司 | 拥堵预测方法、装置、设备及可读存储介质 |
Citations (4)
| Publication number | Priority date | Publication date | Assignee | Title |
|---|---|---|---|---|
| JP2002190090A (ja) * | 2000-10-13 | 2002-07-05 | Sumitomo Electric Ind Ltd | 交通流の異常検知装置及び方法(スペクトル) |
| JP2008040825A (ja) * | 2006-08-07 | 2008-02-21 | Xanavi Informatics Corp | 交通情報提供装置、交通情報提供システム、交通情報の送信方法、および交通情報の要求方法 |
| JP2009262862A (ja) * | 2008-04-28 | 2009-11-12 | Toyota Motor Corp | 走行制御装置及び走行制御方法 |
| JP2010286344A (ja) * | 2009-06-11 | 2010-12-24 | Kddi Corp | 携帯端末装置の移動状態を推定する方法及びシステム |
Family Cites Families (17)
| Publication number | Priority date | Publication date | Assignee | Title |
|---|---|---|---|---|
| US20050192727A1 (en) * | 1994-05-09 | 2005-09-01 | Automotive Technologies International Inc. | Sensor Assemblies |
| KR960001780A (ko) * | 1994-06-01 | 1996-01-25 | 제임스 디, 튜턴 | 차량 감시 시스템용 도플러 레이다 송수신기 |
| US6768944B2 (en) * | 2002-04-09 | 2004-07-27 | Intelligent Technologies International, Inc. | Method and system for controlling a vehicle |
| US7202776B2 (en) * | 1997-10-22 | 2007-04-10 | Intelligent Technologies International, Inc. | Method and system for detecting objects external to a vehicle |
| US7085637B2 (en) * | 1997-10-22 | 2006-08-01 | Intelligent Technologies International, Inc. | Method and system for controlling a vehicle |
| US6720920B2 (en) * | 1997-10-22 | 2004-04-13 | Intelligent Technologies International Inc. | Method and arrangement for communicating between vehicles |
| US9177476B2 (en) * | 1997-10-22 | 2015-11-03 | American Vehicular Sciences Llc | Method and system for guiding a person to a location |
| US7899616B2 (en) * | 1997-10-22 | 2011-03-01 | Intelligent Technologies International, Inc. | Method for obtaining information about objects outside of a vehicle |
| US8965677B2 (en) * | 1998-10-22 | 2015-02-24 | Intelligent Technologies International, Inc. | Intra-vehicle information conveyance system and method |
| US6434512B1 (en) * | 1998-04-02 | 2002-08-13 | Reliance Electric Technologies, Llc | Modular data collection and analysis system |
| US20030135304A1 (en) * | 2002-01-11 | 2003-07-17 | Brian Sroub | System and method for managing transportation assets |
| JP5459179B2 (ja) | 2010-05-14 | 2014-04-02 | カシオ計算機株式会社 | 移動状態判別装置、移動状態判別方法およびプログラム |
| WO2011153114A2 (en) * | 2010-05-31 | 2011-12-08 | Central Signal, Llc | Train detection |
| US8731809B2 (en) * | 2010-12-15 | 2014-05-20 | Honda Motor Co., Ltd. | Traffic congestion prediction method |
| US20120309321A1 (en) * | 2011-05-31 | 2012-12-06 | Broadcom Corporation | Synchronized calibration for wireless communication devices |
| JP5667944B2 (ja) * | 2011-08-11 | 2015-02-12 | 本田技研工業株式会社 | サーバ側渋滞解消走行支援方法 |
| US20140229568A1 (en) * | 2013-02-08 | 2014-08-14 | Giuseppe Raffa | Context-rich communication between a device and a vehicle |
-
2014
- 2014-03-07 JP JP2015504418A patent/JP5927336B2/ja not_active Expired - Fee Related
- 2014-03-07 BR BR112015019249A patent/BR112015019249A2/pt not_active IP Right Cessation
- 2014-03-07 US US14/766,581 patent/US9646492B2/en not_active Expired - Fee Related
- 2014-03-07 CN CN201480005087.XA patent/CN104937647B/zh not_active Expired - Fee Related
- 2014-03-07 WO PCT/JP2014/056012 patent/WO2014136949A1/ja not_active Ceased
Patent Citations (4)
| Publication number | Priority date | Publication date | Assignee | Title |
|---|---|---|---|---|
| JP2002190090A (ja) * | 2000-10-13 | 2002-07-05 | Sumitomo Electric Ind Ltd | 交通流の異常検知装置及び方法(スペクトル) |
| JP2008040825A (ja) * | 2006-08-07 | 2008-02-21 | Xanavi Informatics Corp | 交通情報提供装置、交通情報提供システム、交通情報の送信方法、および交通情報の要求方法 |
| JP2009262862A (ja) * | 2008-04-28 | 2009-11-12 | Toyota Motor Corp | 走行制御装置及び走行制御方法 |
| JP2010286344A (ja) * | 2009-06-11 | 2010-12-24 | Kddi Corp | 携帯端末装置の移動状態を推定する方法及びシステム |
Cited By (3)
| Publication number | Priority date | Publication date | Assignee | Title |
|---|---|---|---|---|
| WO2015178195A1 (ja) * | 2014-05-20 | 2015-11-26 | 本田技研工業株式会社 | 運転特性評価方法、プログラムおよび運転特性評価装置 |
| JP2016206886A (ja) * | 2015-04-21 | 2016-12-08 | 本田技研工業株式会社 | 運転支援方法、プログラム、および運転支援装置 |
| US9972203B2 (en) | 2015-04-21 | 2018-05-15 | Honda Motor Co., Ltd. | Driving assistance method, program, and driving assistance apparatus |
Also Published As
| Publication number | Publication date |
|---|---|
| JPWO2014136949A1 (ja) | 2017-02-16 |
| US20150379871A1 (en) | 2015-12-31 |
| US9646492B2 (en) | 2017-05-09 |
| CN104937647A (zh) | 2015-09-23 |
| JP5927336B2 (ja) | 2016-06-01 |
| CN104937647B (zh) | 2017-07-25 |
| BR112015019249A2 (pt) | 2017-07-18 |
Similar Documents
| Publication | Publication Date | Title |
|---|---|---|
| JP5927336B2 (ja) | 渋滞予兆検知方法、プログラムおよび渋滞予兆検知装置 | |
| JP6202538B2 (ja) | 運転支援方法、プログラム、および運転支援装置 | |
| JP6210654B2 (ja) | 運転特性評価方法、プログラムおよび運転特性評価装置 | |
| JP6202537B2 (ja) | 走行支援方法、プログラム、および走行支援装置 | |
| US9174550B2 (en) | Electric vehicle driving support system | |
| US9766082B2 (en) | Server device, congestion prediction information display system, congestion prediction information distribution method, congestion prediction information display method, and program | |
| US20150049877A1 (en) | Acoustic device, output sound management device, terminal device, and output sound control method | |
| JP6159453B1 (ja) | 推定装置、推定方法及び推定プログラム | |
| JP6659870B2 (ja) | 車車間通信装置 | |
| JP2018136781A (ja) | 渋滞緩和支援装置、サーバ装置、渋滞緩和支援システム、渋滞緩和支援方法、およびプログラム | |
| JP6361052B2 (ja) | 走行支援方法、プログラム、および走行支援装置 | |
| JP6166226B2 (ja) | 渋滞予兆検知方法、プログラムおよび渋滞予兆検知装置 | |
| JP5926393B2 (ja) | 表示制御装置、表示制御方法及びプログラム、並びにサーバ装置 | |
| JP6392937B2 (ja) | 推定装置、推定方法及び推定プログラム | |
| JP2016207018A (ja) | 走行支援方法、プログラム、および走行支援装置 | |
| JP2025096357A (ja) | 表示制御装置、表示制御方法及びプログラム | |
| WO2014049707A1 (ja) | 表示制御装置、表示制御方法及びプログラム、並びにサーバ装置 | |
| JP2018197756A (ja) | 推定装置、推定方法及び推定プログラム | |
| JP2018137917A (ja) | 電動車両走行支援装置、サーバ装置、電動車両走行支援システム、電動車両走行支援方法、およびプログラム | |
| JP2018163506A (ja) | データ送信処理プログラム、データ送信処理装置、及びデータ送信処理方法 | |
| JP2016138897A (ja) | 表示制御装置、表示制御方法及びプログラム | |
| Din | JOGGING TRACK ADVISOR |
Legal Events
| Date | Code | Title | Description |
|---|---|---|---|
| 121 | Ep: the epo has been informed by wipo that ep was designated in this application |
Ref document number: 14761124 Country of ref document: EP Kind code of ref document: A1 |
|
| ENP | Entry into the national phase |
Ref document number: 2015504418 Country of ref document: JP Kind code of ref document: A |
|
| WWE | Wipo information: entry into national phase |
Ref document number: 14766581 Country of ref document: US |
|
| REG | Reference to national code |
Ref country code: BR Ref legal event code: B01A Ref document number: 112015019249 Country of ref document: BR |
|
| WWE | Wipo information: entry into national phase |
Ref document number: IDP00201505442 Country of ref document: ID |
|
| NENP | Non-entry into the national phase |
Ref country code: DE |
|
| 122 | Ep: pct application non-entry in european phase |
Ref document number: 14761124 Country of ref document: EP Kind code of ref document: A1 |
|
| ENP | Entry into the national phase |
Ref document number: 112015019249 Country of ref document: BR Kind code of ref document: A2 Effective date: 20150811 |