WO2013145809A1 - 省エネルギー行動支援システム - Google Patents
省エネルギー行動支援システム Download PDFInfo
- Publication number
- WO2013145809A1 WO2013145809A1 PCT/JP2013/050513 JP2013050513W WO2013145809A1 WO 2013145809 A1 WO2013145809 A1 WO 2013145809A1 JP 2013050513 W JP2013050513 W JP 2013050513W WO 2013145809 A1 WO2013145809 A1 WO 2013145809A1
- Authority
- WO
- WIPO (PCT)
- Prior art keywords
- energy
- target
- user
- energy saving
- unit
- Prior art date
- Legal status (The legal status is an assumption and is not a legal conclusion. Google has not performed a legal analysis and makes no representation as to the accuracy of the status listed.)
- Ceased
Links
Images








Classifications
-
- G—PHYSICS
- G06—COMPUTING OR CALCULATING; COUNTING
- G06Q—INFORMATION AND COMMUNICATION TECHNOLOGY [ICT] SPECIALLY ADAPTED FOR ADMINISTRATIVE, COMMERCIAL, FINANCIAL, MANAGERIAL OR SUPERVISORY PURPOSES; SYSTEMS OR METHODS SPECIALLY ADAPTED FOR ADMINISTRATIVE, COMMERCIAL, FINANCIAL, MANAGERIAL OR SUPERVISORY PURPOSES, NOT OTHERWISE PROVIDED FOR
- G06Q50/00—Information and communication technology [ICT] specially adapted for implementation of business processes of specific business sectors, e.g. utilities or tourism
- G06Q50/06—Energy or water supply
Definitions
- the present invention relates to a system that monitors energy consumption such as electricity used in stores, buildings, offices, and homes and supports user energy saving behavior (hereinafter, energy saving behavior).
- the “environmental management device” described in Patent Document 1 generates environmental management information such as air conditioning adjustment based on an environmental state such as temperature, customer information, and electric power used by an electrical device.
- the “store management system” described in Patent Document 2 displays power consumption, and the store status such as the operating status and temperature of each device.
- the target usage is calculated from the usage of water, gas, power, etc., and the target usage and the actual usage are displayed.
- Patent Documents 1 to 3 only monitor and display the amount of energy used, such as electric power, and do not monitor what kind of energy saving action the user is performing. Therefore, there is a problem that it is impossible to grasp the relationship between the energy saving behavior of the user and the amount of energy used such as electric power, and the motivation of the energy saving behavior cannot be maintained.
- the present invention has been made in view of such circumstances, and maintains and continues motivation by monitoring the user's energy-saving behavior and presenting the relationship between the user's energy-saving behavior and the amount of energy used.
- information on energy-saving behavior that suppresses energy consumption, a reduction value related to energy that is suppressed when the energy-saving behavior is performed, and the user's energy-saving A storage unit that stores information on an execution result of an action, a target period for recording the execution result of the energy-saving action, a target value setting unit that sets a period target value in the target period, the target period, and the A target calculation unit that calculates at least one target value per day based on a period target value, an energy consumption measurement unit that measures the amount of energy consumption, and an action for causing the implementation result of the energy saving action to be input
- An implementation input unit calculates a reduction result value suppressed by the implementation result of the energy saving action using the reduction value, and compares the reduction result value with the target value
- achievement degree calculation unit for calculating a degree of achievement by Rukoto, energy saving action support system comprising a display unit that displays the level of achievement is provided.
- the present invention it is possible to support the maintenance and continuation of motivation by monitoring the user's energy saving behavior and presenting the relationship between the user's energy saving behavior and the amount of energy used.
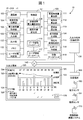
- FIG. 1 is a diagram showing a configuration of an energy saving action support system according to an embodiment of the present invention.
- the energy saving action support system 10 according to the present embodiment is a system that supports the energy saving action by monitoring the amount of energy used such as electricity used in a store, building, office, or home.
- the energy saving action support system 10 includes a data server 100, an input / output terminal 120 installed on a user side (for example, a store), an input / output terminal 130 for a leader installed in a support center, a network 140, and reception A terminal 150, a power sensor 160, an environment sensor 161, and a cooperation device / cooperation system 170 are provided.
- the data server 100 is installed in a data center or the like. As described above, by installing the data server 100 in the data center, user's personal information and privacy information such as data collected from the user can be centrally managed, so that security management such as information leakage prevention can be simplified.
- the input / output terminal 120 is installed in a store such as a supermarket, a convenience store, a drug store, or a restaurant chain.
- the input / output terminal 120 may be installed in a residence such as a detached house or a condominium. Thereby, this system may be used for home use.
- the users (hereinafter referred to as users) of the input / output terminal 120 are assumed to be store managers (store managers), area managers and employees of each floor. In the case of home use, a resident who lives in a residence is assumed.
- the user uses the energy saving action support system 10 by operating the input / output terminal 120 to implement an action program (hereinafter referred to as an energy saving action program) that reduces the amount of power used.
- the input / output terminal 120 is composed of one or a plurality of personal computers.
- the input / output terminal 120 includes an input unit (not shown) such as a keyboard and a mouse, a display unit such as a display, and a communication unit (not shown) that communicates with the data server 100.
- the input / output terminal 120 may be a portable terminal such as a PDA, PHS, mobile phone, smartphone, or tablet terminal.
- the instructor input / output terminal 130 is composed of one or a plurality of personal computers.
- the input / output terminal 130 includes an input unit (not shown) such as a keyboard and a mouse, a display unit (not shown) such as a display, and a communication unit (not shown) that communicates with the data server 100.
- the input / output terminal 130 may be a portable terminal such as a PDA, PHS, mobile phone, smartphone, or tablet terminal.
- the user of the input / output terminal 130 is assumed to be a support center instructor who supports the continuation of the energy saving action program.
- the instructor operates the input / output terminal 130 to support the user's implementation of the energy saving action program.
- the network 140 is, for example, a network that uses wired communication using a LAN (Local Area Network) cable or wireless communication using a wireless LAN.
- LAN Local Area Network
- other local networks such as a local PHS, and other wide area networks such as the Internet, VPN, mobile phone communication network, and PHS communication network can be used.
- the data server 100, the input / output terminals 120 and 130, and the receiving terminal 150 are connected via a network 140.
- the data server 100 communicates with the user input / output terminal 120 and the instructor input / output terminal 130 via the network 140.
- the receiving terminal 150 communicates with, for example, one or more power sensors 160, one or more environment sensors 161, and the cooperation device / system 170 via a unique wireless network.
- the receiving terminal 150 acquires information periodically (for example, every minute) from the power sensor 160, the environment sensor 161, and the cooperation device / cooperation system 170. Then, the receiving terminal 150 transmits the acquired information to the data server 100 via the network 140.
- the power sensor 160 is installed in a switchboard, a distribution board, a light device, or a power device, and measures the amount of power used.
- the environmental sensor 161 is installed indoors or outdoors in the store and measures temperature, humidity, and illuminance.
- Linked devices / linkage systems 170 include air conditioners (air conditioners), lighting fixtures, televisions, personal computers (PCs), microwave ovens, monitors and other lighting devices, elevators, escalators, large air conditioners and other power devices, It is composed of an information system such as a store management system (POS system) that manages sales and the number of customers.
- POS system store management system
- the data server 100 is configured by an information processing device such as a computer, for example, and includes a CPU (not shown: also referred to as a processor or a calculation unit), a memory 102, and a storage device (not shown) such as an HDD and a ROM. have.
- a CPU not shown: also referred to as a processor or a calculation unit
- a memory 102 such as a hard disk drive
- a storage device such as an HDD and a ROM.
- Each database which will be described later, is stored in this storage device.
- the data server 100 is described as a hardware configuration, but the function of the data server 100 can also be realized by a program code of software.
- the data server 100 includes a control unit 101, a memory 102, a communication unit 103, a weather information acquisition unit 104, a power usage acquisition unit 105, an action execution input unit 106, an output unit 107, and a target power consumption amount.
- a candidate generation unit 115, a report creation unit 116, a user information database 117, a data storage database 118, and a knowledge database 119 are provided.
- the control unit 101 is connected to each function in the data server 100 and controls the entire data server 100.
- the communication unit 103 communicates with the user input / output terminal 120, the instructor input / output terminal 130, and the reception terminal 150 via the network 140.
- the weather information acquisition unit 104 acquires weather information from a site on the Internet or an external organization (for example, the Japan Meteorological Agency).
- the power usage amount acquisition unit 105 communicates with the receiving terminal 150 to acquire information from the power sensor 160. In addition, the power usage amount acquisition unit 105 communicates with the receiving terminal 150 to acquire information from the environment sensor 161. In addition, the power usage amount acquisition unit 105 may acquire a past power usage amount from the outside at the first activation of the system and store the power usage amount in the power usage amount table 220.
- the action execution input unit 106 receives information (energy saving action) input on the screen displayed on the input / output terminal 120 on the user side, and records the information in the data storage database 118.
- the output unit 107 outputs the screen generated by the display screen generation unit 114 to the user input / output terminal 120 and the instructor input / output terminal 130.
- the target power consumption setting unit 108 sets the target power consumption (period target value) in the implementation period based on the target reduction rate and the previous year actual power consumption of the implementation period (target period) input from the user. (See FIG. 10).
- the period target calculation unit 109 calculates the target energy consumption per day, the target energy reduction per day, and the target cumulative reduction based on the target reduction rate, the implementation period, and the previous year actual power consumption. Is to be calculated.
- the user behavior determination unit 110 automatically determines whether or not an event has occurred based on the sensor data of the power sensor 160 and the environment sensor 161 and the data of the cooperation device / cooperation system 170. The user behavior determination unit 110 also determines the presence / absence of the user's energy saving behavior and the number of times of the energy saving behavior.
- the cumulative reduction amount calculation unit 111 adds the reduction amount per day from the start date of the implementation period to the target date, and calculates the cumulative reduction amount.
- the implementation rate calculation unit 112 calculates the implementation rate based on the target reduction amount per day and the total reduction amount obtained from the implementation record of the user's energy saving action. Details of the implementation rate will be described later.
- the achievement level calculation unit 113 calculates the achievement level based on the execution rate calculated by the execution rate calculation unit 112. Details of the achievement will be described later.
- the display screen generation unit 114 generates a screen for outputting to the user input / output terminal 120 and the instructor input / output terminal 130.
- the guidance sentence candidate generation unit 115 generates guidance sentence candidates to be presented to the input / output terminal 120 on the user side. Further, the report creation unit 116 outputs the guidance sentence candidates generated by the guidance sentence candidate generation unit 115 to the input / output terminal 130 on the instructor side.
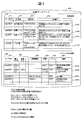
- FIG. 2 is a diagram showing an example 200 of the user information database 117 of FIG.
- the user information database 200 includes a user information table 210, a power usage amount table 220, an eco-behavior card table 230, and an event information table 240.
- “eco-behavior” is an eco-friendly action and means an action that can realize energy saving.
- the user information table 210 is a table for managing user specific information and the like.
- the user information table 210 includes a field 211 for storing a user ID for identifying a user, a field 212 for storing a user password used when the user performs user authentication when using the system, a name, an address, an e-mail address, and the like.
- the user with the user ID “user0001”, the store name “AAA”, and the address “BBB” has a target power consumption reduction rate of ⁇ 10% for this energy saving action program. Indicates that the program will be implemented for 12 months.
- the power consumption amount of the user in the previous year is 2,000,000 [kWh]. Since the target reduction rate is ⁇ 10%, a target reduction amount 200,000 [kWh] of the annual power consumption is set in the field 217 for storing the target reduction amount.
- the power usage table 220 is a table for storing the monthly power usage for each user.
- the power usage table 220 includes a field 221 that stores a user ID for identifying a user, a field 222 that stores a billing date of usage, a field 223 that stores a usage period, and a field 224 that stores the number of days used. , A field 225 for storing the usage amount, and a field 226 for storing the billing amount.
- the user with the user ID “user0001” indicates that the usage amount in the billing date April 2010 is 133,900 [kWh].
- the eco action card table 230 is a table for storing an action item (eco action card) of the energy saving action selected by the user at the start of the energy saving action program.
- the eco-behavior card table 230 includes a field 231 for storing a user ID for identifying a user, a field 232 for storing a category name that is a classification of the energy-saving action, and an eco-action card ID for identifying an energy-saving action (hereinafter referred to as a card ID).
- a field 233 for storing the energy saving action an eco action field 234 for storing the contents of the energy saving action, a reduction amount field 235 for storing the power consumption reduced by the implementation of the energy saving action, and a day in which the energy saving action can be recorded.
- a field 236 for storing the limited number of times. For the field 236, for example, if the card ID is SC eco-behavior, “not too packed in the showcase” has a reduction amount set as a guide for the day, so the limit count is set to “1”. Yes.
- the eco action card of the user with the user ID “user0001” is set.
- the card ID of the energy saving action “Reduce operation time for one hour before opening” for the category “air conditioner” is “AC-1”, and the power consumption reduced by this energy saving action is “41” kWh. Yes, it indicates that there is no particular limit on the number of energy saving actions.
- the event information table 240 is a table for storing phenomena and events related to increase / decrease in power usage, and events (hereinafter referred to as events) that are obstructive factors for energy saving behavior, selected by the user at the start of the energy saving behavior program. is there.
- the event information table 240 includes a field 241 for storing a user ID for identifying a user, a field 242 for storing a category name that is a classification of event information, a field 243 for storing an event ID for identifying event information, and event information. And a field 244 for storing the contents of.
- the event information of the user with the user ID “user0001” is set.
- the record 240A indicates that the event information “rain or cloudy” regarding the category “weather” is the event ID “ERC”.
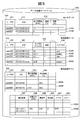
- FIG. 3 is a diagram illustrating an example 300 of the memory 102 of FIG.
- the memory 300 includes a CO 2 emission amount coefficient storage area 310 and a target value storage area 320.
- the CO 2 emission coefficient storage area 310 is an area for managing the CO 2 emission coefficient for each user.
- the CO 2 emission coefficient storage area 310 includes a field 311 for storing a user ID for identifying a user, a field 312 for storing a light heat type, and a field 313 for storing a CO 2 emission coefficient for each light heat type.
- These CO 2 emission factors are assumed to use numerical values provided by electric power companies, gas companies, water departments, etc. that supply electricity, gas, tap water, etc. to the user's store or residence.
- an emission coefficient can be set independently.
- the light-to-heat type of the user of the user ID "user0001" is CO 2 emissions factors in the case of "electrical” is set.
- the record 310A indicates that the “electricity” CO 2 emission coefficient is “0.339” kg ⁇ CO 2 / kWh.
- the CO 2 emission amount suitable for the user can be calculated according to the amount of energy used.
- the target value storage area 320 is an area for managing the actual value per day of the previous year, the reduction target value per day, the target consumption of energy per day, and the cumulative target value for each user.
- the target value storage area 320 includes a field 321 for storing a user ID for identifying a user, a field 322 for storing the target year and month, a field 323 for storing an actual value per day in the same month of the previous year, and a target year and month.
- a field 324 for storing the reduction target value per day and a field 325 for storing the cumulative target value calculated at a predetermined number of days interval are provided.
- the target value storage area 320 may further include an area for storing a target consumption amount of energy per day.
- the previous year actual value, the reduction target value, and the cumulative target value are set for the target year “April 2011” of the user with the user ID “user0001”.
- the actual value of the previous year is “4463” kWh / day
- the reduction target value is “446” kWh / day
- the first day of the month is “446”.
- the 10th day (cumulative target value 2) is “4460”
- the 20th day (cumulative target value 3) is “8920”
- the last day (cumulative target value 4) is “13380” kWh / day It is shown that.
- the cumulative target value 2 from the cumulative target value 1 is set to “early”
- the cumulative target value 3 from the day after the cumulative target value 2 is set to “mid”
- the cumulative target value 4 can be classified into three periods, “late”, and can be easily used as a reference when evaluating energy saving behavior, that is, a weight reduction pace.
- FIG. 4 is a diagram showing an example 400 of the knowledge database 119 of FIG.
- the knowledge database 400 includes a guidance knowledge table 410 and an event determination knowledge table 420.
- the instruction knowledge table 410 is a table used for presenting instruction sentence candidates for the user to the input / output terminal 130 on the instructor side.
- the instruction knowledge table 410 includes a field 411 that stores a user ID for identifying a user, a field 412 that stores information on a point of interest indicating a category of instruction text, and a field 413 that stores a conditional expression for generating an instruction sentence. And a field 414 for storing a guidance sentence to be presented when the conditional expression is matched.
- the cumulative reduction amount TDEE when the cumulative reduction amount TDEE is equal to or less than the cumulative target value OTEE at the end of the month (same as the cumulative target value 4) (TDEE and OTEE are calculated as negative values), When the amount of reduction is larger than the cumulative target value, it indicates that the candidate for the guidance sentence is set as “I cleared the target value. I will do my best in this condition.” In this way, by comparing the cumulative reduction amount with the cumulative target value to evaluate the progress of the power reduction amount and presenting the guidance sentence, it is possible to support the continuation of the energy saving action.
- the early weight loss pace is late.
- it indicates that there is a candidate for the guidance sentence that “the second half was gentle, but the first half is to achieve the goal”.
- the cumulative reduction amount TDEE when the cumulative reduction amount TDEE is larger than the cumulative target value OTEE and the late weight loss pace is larger than the early weight loss pace, that is, the target value cannot be achieved.
- the weight loss pace in late is greater than in early, the candidate for the guidance sentence is set, “I did not achieve my goal, but I did my best in the second half. I will continue to do my best at this pace.” Show.
- the instructor can give guidance to the user more widely. Therefore, the user can maintain motivation and improve the continuity awareness of the energy saving action.
- the cumulative reduction amount TDEE is larger than the cumulative target value OTEE, and the average value AVE (EAR) of the implementation rate EAR of the energy saving action is 1 or more, that is, the target value is achieved.
- the candidate for the guidance sentence “I could not achieve the target, but the energy-saving action is more than the target. Indicates that it is set.
- guidance sentence candidates are set not only according to the target value of the cumulative reduction amount but also according to the results of the energy saving action per day.
- the implementation rate indicating the implementation status of the energy saving action, it is possible to appropriately evaluate the energy saving action even when the amount of power cannot be reduced. Therefore, the user can maintain motivation and improve the continuity awareness of the energy saving action.
- the event determination knowledge table 420 is a table used for determining whether an event has occurred.
- the event determination knowledge table 420 includes a field 421 for storing a user ID for identifying a user, a field 422 for storing a conditional expression of sensor information such as the power sensor 160 and the environmental sensor 161, and information from the cooperation device / cooperation system 170.
- a remarks field 426 is a table used for determining whether an event has occurred.
- the event determination knowledge table 420 includes a field 421 for storing a user ID for identifying a user, a field 422 for storing a conditional expression of sensor information such as the power sensor 160 and the environmental sensor 161, and information from the cooperation device / cooperation system 170.
- the event ID “EAC-1” is output.
- the power usage amount DEEm per minute is set in advance from “7/1 (July 1st)” to “9 / E (September last day)”. This shows that event ID “EAC” is output when a state where the temperature is higher than the set constant C2 and the temperature is higher than 20 ° C. continues for 60 minutes.
- the event ID “ERC” is output.
- the event determination knowledge table 420 knowledge for determining event information according to sensor information of the power sensor 160 and the environment sensor 161, time information, and cooperation information of the cooperation device / cooperation system 170 is obtained. Can be constructed easily.
- FIG. 5 is a diagram showing an example 500 of the data storage database 118 of FIG.
- the data accumulation database 500 includes a sensor data accumulation table 510, an implementation record data accumulation table 520, and an implementation record summary table 530.
- the sensor data accumulation table 510 is a table for storing sensor values such as electric energy and temperature at set time intervals.
- the sensor data accumulation table 510 includes a field 511 for storing a user ID for identifying a user, a field 512 for storing date and time, and a field 513 for storing sensor values such as electric energy and temperature corresponding to the date and time of the field 512.
- the sensor data accumulation table 510 stores sensor data every minute, but can also be set every 30 minutes and every hour.
- the execution record data accumulation table 520 is a table for storing user execution records and event information.
- the execution record data accumulation table 520 stores a field 521 for storing a user ID for identifying a user, a field 522 for storing a date and time, a card ID and an event ID for identifying an eco-action performed at the date and time of the field 522, and the like.
- a field 524 for storing an input flag for determining whether the card ID or the event ID is input by the user (input flag “user”) or registered by the system (input flag “system”). Prepare.
- the implementation record summary table 530 is a table for storing various types of information (power consumption, implementation record, implementation rate, achievement level, event, comment, etc.) for each day.
- the implementation record summary table 530 includes a field 531 for storing a user ID for identifying a user, a field 532 for storing a date, a field 533 for storing a total value of the power consumption of the date in the field 532, and a date in the field 532.
- a field 538 for storing a field 539 for storing the implementation rate of the energy saving action, a field 540 for storing the achievement degree of the energy saving action of the day, a field 541 for storing the implementation record of the event, and a comment text input by the user Field 542 for storing.
- the power usage amount on that day is 4112 [kWh] on July 10, 2011, and the implementation record of the energy saving action is recorded.
- SC: 1 “AC: 1”, “AC-1: 2”, and “LC: 1”, indicating that the amount of power reduced by the implementation record is ⁇ 235 [kWh].
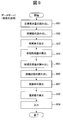
- FIG. 6 is a flowchart showing the operation when the data server 100 is used for the first time.
- step 601 the control unit 101 first activates the display screen generation unit 114 and the output unit 107. Then, the display screen generation unit 114 generates a screen for the first use, and the output unit 107 outputs the screen generated by the display screen generation unit 114 to the input / output terminal 120 on the user side. For example, the screen shown in FIG. 10 is displayed on the input / output terminal 120 on the user side. The screen of FIG. 10 will be described later.
- the user inputs store information, past power consumption information, and the like on the displayed screen.
- the control unit 101 stores the input unique information, the implementation period, and the target reduction rate in the user information table 210.
- control unit 101 may activate the power usage amount acquisition unit 105.
- the power usage amount acquisition unit 105 acquires information such as the past power usage amount from the outside and stores it in the power usage amount table 220.
- the control unit 101 activates the weather information acquisition unit 104.
- the weather information acquisition unit 104 acquires local weather information from weather data observation points such as a weather station, a weather station, and AMeDAS that are closest to each other based on the input address information.
- the weather information is acquired from the observation point.
- the prefectures are different, it is possible to use observation point information having similar weather conditions, and thus it is possible to acquire more accurate weather information.
- step 603 the control unit 101 activates the target power consumption setting unit 108 and the period target calculation unit 109.
- the target power consumption setting unit 108 acquires the previous year actual power consumption based on the implementation period input in step 601. Then, the target power consumption setting unit 108 calculates the target power consumption during the implementation period based on the input target reduction rate and the previous year actual power consumption. Specifically, the target power consumption setting unit 108 extracts, from the power usage table 220, the monthly power usage for a period corresponding to the number of months of the implementation period after the same month of the previous year at the first use. Next, the target power consumption setting unit 108 calculates a value obtained by adding the extracted power usages as the previous year actual power consumption. Further, the target power consumption setting unit 108 calculates a value obtained by multiplying the target power consumption setting unit 108 by the target reduction rate as the target power consumption. Thereafter, the target power consumption setting unit 108 displays the calculation result on the screen of FIG. 10 and stores the calculation result in the user information table 210.
- the period target calculation unit 109 calculates a target consumption amount of energy per day, a target reduction amount of energy per day, and a target cumulative reduction amount. Specifically, the period target calculation unit 109 extracts, from the power usage table 220, the monthly power usage for the period corresponding to the number of months of the implementation period after the same month of the previous year at the first use. The period target calculation unit 109 calculates the actual value per day in the previous year by dividing the amount of power used in each month in the previous year by the number of days in each month. The period target calculation unit 109 calculates a value obtained by multiplying the daily actual value of the previous year by the target reduction rate as the target energy reduction amount per day.
- the period target calculation unit 109 calculates the target cumulative reduction amount by adding the target reduction amount of energy per day by the number of days. Further, the period target calculation unit 109 calculates a target energy consumption per day based on the difference between the actual performance value per day in the previous year and the target energy reduction per day.
- the period target calculation unit 109 stores the calculation result in the target value storage area 320 of the memory 102.
- FIG. 10 is a diagram showing an example screen 1000 displayed on the input / output terminal 120 when the data server 100 is used for the first time. Below, it demonstrates corresponding to the step of FIG.
- the screen 1000 is a screen for inputting user information when the user participates in the energy saving action program.
- the screen 1000 includes a unique information input area 1010, a usage information input area 1020, and a target setting area 1030.
- step 601 the user inputs user-specific information such as a name, password, and address in the unique information input area 1010.
- the usage amount information input area 1020 is an area for the user himself / herself to input a past power usage amount.
- the user selects a target year from the year selection box 1021 and the month selection box 1022 with reference to information such as the billing date, usage amount, use period, and number of days described in the past bill. Information such as power consumption can be input.
- the input information is stored in the power usage amount table 220.
- the user inputs the past power usage amount in the usage amount information input area 1020 by himself / herself.
- the past power usage amount is automatically obtained from an energy-related company such as an electric power company. You may acquire the usage-amount.
- the user inputs the execution period of the energy saving action program and the target reduction rate in the target setting area 1030.
- the target power consumption amount setting unit 108 performs the previous year actual power consumption and the target power consumption based on the implementation period and the target reduction rate input in step 601 as step 603. Calculate the amount.
- the calculated previous year actual power consumption and target power consumption are displayed in the target setting area 1030.
- the target reduction rate is ⁇ 10%
- the previous year actual power consumption is 2,000,000 kWh
- the target power consumption is 1,800,000 kWh.
- FIG. 7 is a flowchart showing the operation of the data server 100 when the user action is determined.
- step 701 first, the control unit 101 activates the user behavior determination unit 110.
- the user behavior determination unit 110 reads sensor data from the sensor data accumulation table 510.
- step 702 the user behavior determination unit 110 acquires data from the cooperation device / cooperation system 170.
- step 703 the user behavior determination unit 110 uses the determination knowledge stored in the event determination knowledge table 420 based on the sensor data read in steps 701 and 702 and the data of the cooperation device / cooperation system 170. Event information. That is, in this step 703, it is automatically determined whether or not an event has occurred based on the sensor data and the data of the cooperation device / cooperation system 170.
- step 704 the user action determination unit 110 determines the presence / absence of the energy saving action and the number of energy saving actions as the implementation record of the eco action card based on the event information determined in step 703, sensor data, and the like. That is, in step 704, it is automatically determined whether or not there is an energy saving action even if the user himself / herself has not input the energy saving action as an execution record.
- step 705 the user behavior determination unit 110 stores the event information determined in steps 703 and 704 and the eco behavior card in the implementation record data storage table 520 of the data storage database 500.
- step 706 the user behavior determination unit 110 periodically determines whether or not to end (for example, every minute). If it is determined not to end, the user behavior determination unit 110 repeatedly executes from step 701.
- the number of customers (Cs) is extracted from the acquired customer information.
- a condition is set that the number of customers (Cs) is equal to or greater than a threshold value (C3). Therefore, in step 703, when the number of customers (Cs) is equal to or greater than the threshold (C3), event information of event ID “ECR” is determined.
- the user behavior determination unit 110 records the record 520D in the implementation record data accumulation table 520.
- step 420B of the event determination knowledge table 420 in FIG. 4 conditions regarding the power consumption and temperature are set.
- the power consumption DEEm per minute measured by the power sensor 160 connected to the air conditioner is larger than a preset threshold (C2) and measured by the environmental sensor.
- C2 a preset threshold
- event information of event ID “EAC” is determined in step 703.
- the user behavior determination unit 110 records the event information of the event ID “AC” in the implementation record data accumulation table 520.
- event information can be automatically registered.
- step 420A of the event determination knowledge table 420 in FIG. 4 conditions for power usage and time are set.
- the power consumption DEEm for one minute measured by the power sensor 160 connected to the air conditioner is smaller than a preset threshold value (C1) and the state continues for 60 minutes, that is, the air conditioner is used for one hour. If it is determined that it is not, event information of event ID “EAC-1” is determined in step 703. Further, in step 704, the user behavior determination unit 110 determines that the air conditioner has not been used for one hour, and determines that the energy saving behavior of the eco behavior card ID “AC-1” has been performed. In step 705, the user behavior determination unit 110 records the record 520B in the implementation record data accumulation table 520.
- FIG. 8 is a flowchart showing the operation of the data server 100 at the time of execution record input.
- step 801 the control unit 101 activates the action execution input unit 106, the display screen generation unit 114, and the output unit 107.
- the action execution input unit 106 receives information input by the user on the screen shown in FIG. Details of the screen of FIG. 11 will be described later.
- step 802 the action execution input unit 106 records the input information in the execution record summary table 530.
- step 803 the display screen generation unit 114 generates a display screen. Details of step 803 will be described later.
- step 804 the output unit 107 outputs the screen generated by the display screen generation unit 114 to the input / output terminal 120 on the user side.
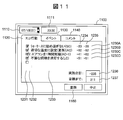
- FIG. 11 is a diagram illustrating an example 1100 of a screen displayed on the input / output terminal 120 when the user inputs a daily implementation record of the energy saving action.
- the screen 1100 includes a date selection box 1110 for selecting the target date, a time box 1111 for setting the time on the target date, and tabs 1120, 1130, and 1140 for selecting the type of execution record to be input.
- the eco action implementation input tab 1120 is selected.
- the display screen generation unit 114 generates an area for inputting the eco action execution record, and the output unit 107 displays the generated area. Output.
- the user inputs an implementation record of the energy saving action (hereinafter referred to as eco action) executed on each day.
- the area for inputting the eco action implementation record on the screen 1100 includes a column 1231 for selecting and inputting the executed eco action, a column 1232 for displaying the number of executions of the eco action, a column 1233 for displaying the contents of the eco action, A column 1234 for displaying the daily power consumption (hereinafter referred to as power reduction amount) that can be reduced by the implementation of the eco action, and the reduction amount of power usage for each eco action card according to the number of times the eco action is executed (hereinafter referred to as the power reduction amount)
- an area 1236 for displaying the total value of all the implementation reduction amounts hereinafter referred to as the implementation total value
- necessary for achieving the daily target reduction amount And an area 1237 for displaying the remaining reduction amount.
- the user can input an implementation record related to the eco action by clicking the check box in the column 1231.
- the execution record can be input by clicking the check box for the number of times.
- the control unit 101 reads the eco action card information stored in the execution record data accumulation table 520 of the data accumulation database 500 and displays it on the screen 1100.
- the eco action card ID “AC-1” 520B is registered in the record 520B of the execution record data accumulation table 520
- the eco action card “air conditioner shortened by 1 hour” 1230C is automatically input. Will be. This not only shortens the input time, but also prevents forgetting to input. Further, even if the execution record data automatically input is not correct, it can be corrected by re-inputting, so that the execution status can be recorded more accurately.
- control unit 101 calculates an execution reduction amount and an execution total value according to the input result.
- the calculation result is displayed in the column 1235 and the area 1236.
- the eco action “not over packed in the showcase” 1230A that can reduce the power consumption of 20 [kWh] by one action is implemented as one execution record.
- -20 [kWh] is displayed as the reduction amount of the power consumption of this eco action.
- the target reduction amount for one day is 446 [kWh]
- the total implementation value is “ ⁇ 235”, so “211” is displayed as the remaining reduction amount.
- the remaining reduction amount is displayed according to the implementation input of energy saving action, it becomes possible to grasp
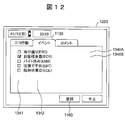
- FIG. 12 is a diagram showing another example 1200 of a screen displayed on the input / output terminal 120 when the user inputs a daily implementation record of the energy saving action.
- the event execution input tab 1130 is selected.
- the display screen generation unit 114 generates an area for inputting the event execution record, and the output unit 107 outputs the generated area. .
- the area for inputting the event execution record on the screen 1200 includes a column 1341 for inputting the event execution status and a column 1342 for displaying the event type.
- a column 1341 for inputting the event execution status includes a column 1341 for inputting the event execution status and a column 1342 for displaying the event type.
- the user can input an implementation record related to the event by clicking a check box in the column 1341.
- the control unit 101 reads the event information stored in the execution record data accumulation table 520 of the data accumulation database 500 and displays it on the screen 1200.
- the event ID “ECR” is registered in the record 520D of the execution record data accumulation table 520
- the event “many customers” 1340B is automatically input. This not only shortens the input time, but also prevents forgetting to input.
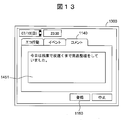
- FIG. 13 is a diagram showing still another example 1300 of a screen displayed on the input / output terminal 120 when the user inputs a daily execution record of the energy saving action.
- the comment input tab 1140 is selected.
- the display screen generation unit 114 generates an area for inputting a comment, and the output unit 107 outputs the generated area.
- the area for inputting a comment on the screen 1300 includes an area 1451 for inputting text.
- area 1451 the reason and excuse for not being able to perform the energy saving action, and the compliment for giving up that the energy saving action has been performed can be input.
- the screen 1300 it can be seen that “Today was overtime and the products were arranged late at night” was entered.
- the action execution input unit 106 records the input information in the execution record summary table 530 in step 802. For example, in the case of the screen 1000 in FIG. 11 to the screen 1300 in FIG. 13, the action execution input unit 106 stores the record 530 ⁇ / b> B in the execution record summary table 530.
- FIG. 9 is a flowchart showing the operation in step 803.
- step 901 first, the display screen generation unit 114 reads out a target value (a target consumption amount of power per day) OEE of the daily power consumption as a target day from the target value storage area 320.
- a target value a target consumption amount of power per day
- step 902 the display screen generation unit 114 reads the actual power usage amount REE for the target day from the implementation record summary table 530.
- step 903 the control unit 101 activates the cumulative reduction amount calculation unit 111.
- the cumulative reduction amount calculation unit 111 calculates the reduction amount DEE of the daily power usage amount that is the target day from the difference between the target value OEE and the actual value REE, using Equation 1 below.
- step 904 the cumulative reduction amount calculation unit 111 calculates the cumulative reduction amount TDEE by adding the reduction amount DEE from the start date BDT to the target date ODT using the following formula 2.
- step 905 the control unit 101 activates the execution rate calculation unit 112.
- the implementation rate calculation unit 112 reads the daily reduction target value (target reduction amount of power per day) OEA as the target day from the target value storage area 320.
- step 906 the execution rate calculation unit 112 reads the user's execution record on the target date from the execution record summary table 530.
- the implementation rate calculation unit 112 acquires the reduction amount corresponding to the eco action card of the implementation record from the eco action card table 230, and calculates the total reduction amount TEA per day.
- step 907 the execution rate calculation unit 112 calculates the execution rate EAR based on the reduction target value OEA and the total reduction amount TEA using the following Equation 3.
- step 908 the control unit 101 activates the achievement level calculation unit 113.
- the achievement level calculation unit 113 calculates the achievement level EAD using the following mathematical formula 4.
- step 909 the display screen generation unit 114 generates a display screen based on the target value OEE, the actual value REE, the cumulative reduction amount TDEE, and the achievement level EAD, and outputs the display screen to the output unit 107.
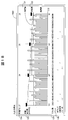
- FIG. 17, and FIG. 18 illustrate an example in which the screen generated by the display screen generation unit 114 is displayed on the input / output terminal 120.
- the lower part of FIG. 1 is an example in which the implementation period of the energy saving action program is 10 days.
- FIG. 17 is an example in which the implementation period of the energy saving action program is one month.
- FIG. 18 shows an example in which the implementation period of the energy saving action program is 3 months.
- the screen of the input / output terminal 120 has a graph display area.
- the horizontal axis shows the date
- the vertical axis shows the graph of the power consumption (power consumption 123) and the cumulative reduction amount TDEE (cumulative reduction amount 121) of the power reduction amount.
- the actual value REE of the power consumption is indicated by a bar graph
- the daily target value OEE is indicated by a line graph.
- the cumulative reduction amount TDEE is shown by a line graph, and the cumulative reduction amount TDEE takes a numerical value downward according to the value of the reduction amount, with the start date of the implementation period being “0”.
- black square marks in the graph indicate the cumulative target value of the power reduction amount.
- the accumulated target value in the target value storage area 320 is displayed.
- the achievement level 125 is displayed coaxially with the date of the graph so as to correspond to the target date.
- “ ⁇ ” is displayed when a reduction amount equal to or higher than the daily target value is achieved, and the energy saving action is performed although it is less than the daily target value (that is, the implementation record of the eco action card is “Yes” is displayed in the case of “Yes”, and “X” is displayed in the case where the energy saving action is not performed (that is, there is no record of the eco action card).
- the average temperature 124 is displayed coaxially with the date of the graph so as to correspond to the target date, and is indicated by a numerical value. Further, the event 126 is also displayed on the same axis as the date of the graph so as to correspond to the target date. For the event 126, a check mark “re” is displayed on the day when the event occurred.
- the user can compare and refer to the results of the daily action and the power reduction amount, and can appropriately grasp the daily implementation status. Moreover, since the daily implementation record can be referred to in a list, the daily implementation status can be easily grasped.
- the cumulative value of the power consumption is simply displayed.
- the cumulative value of the power consumption is displayed by displaying the graph using the cumulative reduction amount.
- the cumulative reduction amount can be displayed in a display area of 10% of the cumulative value of the power consumption amount. Therefore, since daily fluctuations in power consumption (variations in reduction) can be grasped in detail even in a small display area, the relationship between the energy saving action and the power reduction can be more easily understood.
- the display using the cumulative reduction amount enables efficient display. Further, even a display device having a small screen size such as a smartphone or a tablet terminal can display efficiently, including display on a single screen and scroll display.
- long-term energy-saving behavior such as a one-month graph display as shown in FIG. 17, a three-month graph display as shown in FIG. And the power reduction amount can be displayed. Therefore, it can be used effectively and efficiently for energy saving action programs for various periods such as three months, quarterly, seasonally, or one year.
- FIG. 14 is a flowchart showing the operation of the data server 100 when the instructor creates a monthly report.
- step 1501 the control unit 101 activates the display screen generation unit 114 and the output unit 107. Then, the display screen generation unit 114 generates a screen for the instructor illustrated in FIG. 15, and the output unit 107 outputs the screen generated by the display screen generation unit 114 to the input / output terminal 130 on the instructor side.
- the instructor inputs user information on the screen shown in FIG. Details of the screen of FIG. 15 will be described later.
- step 1502 the control unit 101 reads out the reduction target value, the cumulative target value, and the like from the target value storage area 320 using the information input on the screen in FIG.
- step 1503 the control unit 101 reads out the actual power usage amount per day of the previous year from the target value storage area 320.
- step 1504 the control unit 101 activates the weather information acquisition unit 104, and the weather information acquisition unit 104 acquires the weather information.
- step 1505 the control unit 101 reads out the execution record from the execution record summary table 530.
- step 1506 the control unit 101 activates the guidance sentence candidate generation unit 115.
- the teaching sentence candidate generation unit 115 refers to the teaching knowledge table 410 of the knowledge database 400 using the target value, actual value, weather information, and the like acquired in steps 1502 to 1505.
- generation part 115 acquires the candidate of the guidance sentence in which conditions matched from the guidance knowledge table 410.
- step 1507 the control unit 101 activates the report creation unit 116.
- the report creation unit 116 outputs the guidance sentence candidates acquired by the guidance sentence candidate generation unit 115 to the input / output terminal 130 on the instructor side.
- the display screen generation unit 114 generates the screen for the instructor shown in FIG. 16, and the output unit 107 outputs the screen generated by the display screen generation unit 114 to the input / output terminal 130 on the instructor side. . Details of the screen of FIG. 16 will be described later.
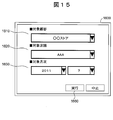
- FIG. 15 is a diagram showing an example 1600 of a screen displayed on the input / output terminal 130 when the instructor inputs user information.
- a screen 1600 is displayed on the input / output terminal 130 on the instructor side.
- the screen 1600 includes an area 1610 for selecting a target customer, an area 1620 for selecting a target user (in this case, a store name), and an area 1630 for selecting a monthly target when creating a guidance sentence. .
- FIG. 16 is a diagram showing an example 1700 of a screen displayed on the input / output terminal 130 when the instructor creates a candidate sentence.
- a screen 1700 is displayed on the input / output terminal 130 on the instructor side.
- Screen 1700 includes report creation area 1710 and instruction sentence candidate display area 1730.
- the report creation area 1710 includes an area 1720 in which a screen displayed on the input / output terminal 120 on the user side is displayed, and an area 1740 in which an instruction text after selection is displayed.
- the area 1720 displays a user-side screen shown in FIG.
- the candidate for the guidance sentence output in step 1507 is classified and displayed in the guidance sentence candidate display area 1730 for each point of interest (power consumption 1730A, weight loss pace 1730B, eco-behavior 1730C).
- the candidate of the teaching sentence is displayed for every point of interest, it is possible to easily create a guidance sentence composed of different points of interest, and to effectively support the continuation for the user. .
- the instruction sentence sentence is copied to the instruction sentence edit box 1741 in the area 1740.
- the instructor edits the instruction sentence in the instruction sentence edit box 1741 and presses the registration button 1761, a monthly report including the instruction sentence is transmitted to the user by e-mail.
- the data accumulation database 500 may include a table for storing a monthly report created by the instructor, and the monthly report may be stored in the data accumulation database 500.
- users who receive a monthly report from the instructor can view the monthly implementation record and check the instruction text based on their own energy-saving behavior, so they can maintain motivation for energy-saving behavior, and Motivation can be improved.
- the instruction text of the monthly report it is possible to confirm the instruction text “The first half was gentle, but the second half is achieving the goal”. In this way, since the instruction sentence including not only the result of the cumulative reduction amount but also the progress of the progress of the power reduction amount can be confirmed, the user can maintain the motivation of the energy saving action and can improve the continuity awareness.
- an appropriate instruction sentence is generated using the instruction knowledge table 410 according to the cumulative reduction amount and the implementation status of the energy saving action.
- Daily energy-saving actions are appropriately evaluated according to the progress of power savings and the implementation status of energy-saving actions, and the evaluation is presented as guidance text from the instructor, so users can maintain motivation for energy-saving actions. , Can improve continuity awareness.
- the execution rate calculation unit 112 calculates the execution rate based on the target reduction amount per day and the total reduction amount obtained from the execution record of the user's energy saving action. Further, the achievement level calculation unit 113 calculates the achievement level based on the execution rate calculated by the execution rate calculation unit 112, and the achievement level is displayed on the input / output terminal 120 on the user side.
- the conventional technology has a problem that it is impossible to grasp the fluctuation of the power consumption that appears as a result of the energy saving action from a bird's-eye view, and the motivation of the energy saving action cannot be maintained.
- the cumulative reduction amount calculation unit 111 calculates the cumulative reduction amount by adding the reduction amount per day from the start date of the implementation period to the target date, and the cumulative reduction amount and the achievement level are determined by the user side. Are displayed on the same axis in the input / output terminal 120.
- the user can comprehensively grasp the fluctuation of the power consumption in the form of the cumulative reduction amount, and can support the maintenance and continuation of motivation.
- the achievement level and the cumulative reduction amount are displayed coaxially on the user-side input / output terminal 120, the relationship between the user's energy saving behavior and the reduction amount can be easily grasped. Thereby, it becomes possible to support the maintenance and continuation of motivation more effectively.
- the action execution input unit 106 executes a process of inputting an event that becomes an obstruction factor of the energy saving action as event information, and the event information and the achievement level are coaxial on the input / output terminal 120 on the user side. Is displayed.
- the user behavior determination unit 110 automatically determines whether or not an event has occurred based on the sensor data and the data of the cooperation device / cooperation system 170. Furthermore, the user behavior determination unit 110 automatically determines the presence / absence of the energy saving behavior and the number of times of the energy saving behavior.
- the guidance sentence candidate generation unit 115 uses the guidance knowledge table 410 to change and output the guidance sentence according to the progress of the power reduction amount or the implementation status of the user's energy saving action.
- the daily energy saving action is appropriately evaluated and the evaluation is presented as a guidance sentence from the instructor, so that the user can maintain the motivation of the energy saving action and improve the continuity awareness.
- the energy saving action support system 10 mainly targets electric power energy, but is not limited to electric power, and can target various photothermal energy such as gas and water.
- various information such as the achievement level 125, the cumulative reduction amount 121, and the information about the event 126 are displayed on the screen of the input / output terminal 120 on the user side. What is necessary is just to grasp
- the achievement level is not limited to the above-described three-stage evaluation, and another evaluation method may be used. Further, not only the cumulative reduction amount 121 but also the reduction amount per day may be displayed.
- the eco action card table 230 is set with a power reduction amount as a reduction value related to energy that is suppressed when the energy saving action is performed.
- This reduction value is not limited to electric power, and may be the CO 2 emission reduction amount using, for example, the CO 2 emission amount coefficient storage area 310 of the memory 102.
- it is not limited to the amount of energy reduction, You may set to the thing relevant to maintenance of a user's motivation, such as the savings amount calculated by the amount of energy reduction.
- the present system is composed of three devices, that is, the data server 100, the user-side input / output terminal 120, and the instructor-side input / output terminal 130. It can also be configured as a single device. In that case, for example, the instruction sentence presented to the user may be automatically displayed in accordance with the conditions of the instruction knowledge table 410.
- the configuration of the above-described embodiment can be realized by hardware by designing a part or all of them with, for example, an integrated circuit.
- the present invention may be realized by a program code of software that realizes the functions of the embodiment.
- a storage medium in which the program code is recorded is provided to an information processing apparatus such as the data server 100, and a computer (or CPU or MPU) of the information processing apparatus reads the program code stored in the storage medium.
- the program code itself read from the storage medium realizes the functions of the above-described embodiments, and the program code itself and the storage medium storing the program code constitute the present invention.
- a storage medium for supplying such program code for example, a flexible disk, CD-ROM, DVD-ROM, hard disk, optical disk, magneto-optical disk, CD-R, magnetic tape, nonvolatile memory card, ROM Etc. are used.
- an OS operating system
- the computer processor or operation unit or the like performs part or all of the actual processing based on the instruction of the program code.
- the functions of the above-described embodiments may be realized by the processing.
- the program code is stored in a storage means such as a hard disk or a memory of an information processing apparatus or a storage medium such as a CD-RW or CD-R
- the computer (or CPU or MPU) of the apparatus may read and execute the program code stored in the storage means or the storage medium when used.
- control lines and information lines indicate what is considered necessary for explanation, and not all control lines and information lines on the product are necessarily shown. All the components may be connected to each other.
- DESCRIPTION OF SYMBOLS 100 Data server 101 Control part 102 Memory 103 Communication part 104 Weather information acquisition part 105 Power consumption acquisition part 106 Action implementation input part 107 Output part 108 Target power consumption setting part 109 Period target calculation part 110 User action determination part 111 Cumulative reduction Quantity calculation unit 112 Implementation rate calculation unit 113 Achievement degree calculation unit 114 Display screen generation unit 115 Guidance sentence candidate generation unit 116 Report creation unit 117 User information database 118 Data storage database 119 Knowledge database 120, 130 Input / output terminal 140 Network 150 Receiving terminal 160 Power sensor 161 Environmental sensor 170 Linked equipment / linkage system
Landscapes
- Business, Economics & Management (AREA)
- Health & Medical Sciences (AREA)
- Engineering & Computer Science (AREA)
- Economics (AREA)
- Public Health (AREA)
- Water Supply & Treatment (AREA)
- General Health & Medical Sciences (AREA)
- Human Resources & Organizations (AREA)
- Marketing (AREA)
- Primary Health Care (AREA)
- Strategic Management (AREA)
- Tourism & Hospitality (AREA)
- Physics & Mathematics (AREA)
- General Business, Economics & Management (AREA)
- General Physics & Mathematics (AREA)
- Theoretical Computer Science (AREA)
- Management, Administration, Business Operations System, And Electronic Commerce (AREA)
Abstract
本発明の省エネルギー行動支援システム10は、記憶部と、目標算出部109と、エネルギー消費測定部160と、行動実施入力部106と、達成度を算出する達成度算出部113と、表示部とを備える。達成度算出部113は、ユーザの省エネ行動の実施結果によって抑制された削減結果値を、記憶部に格納された削減値を用いて算出し、削減結果値と目標値とを比較することによって達成度を算出する。表示部は、算出された達成度を表示する。
Description
本発明は、店舗やビル、オフィスや家庭で利用する電気等のエネルギーの使用量をモニタリングし、ユーザの省エネルギー行動(以下、省エネ行動)を支援するシステムに関する。
近年、地球温暖化の進行、森林資源の減少、環境破壊の拡大に伴い、二酸化炭素(CO2)等の温室効果ガスの排出量の削減が急務となっている。企業でも、電力使用量(消費電力量)の削減や、ピーク電力、最大需要電力(デマンド)の削減が求められており、企業内での省エネルギー対策(省エネ対策)や、従業員の省エネ行動が強く求められている。
このような省エネルギー支援に関して、従来例として、電力等の使用量をモニタリングし、省エネルギーを支援する装置及びシステムがある。
例えば、特許文献1に記載の「環境管理装置」は、温度等の環境状態と、客情報と、電気機器の使用電力とに基づいて、空調調節等の環境管理情報を生成する。
また、例えば、特許文献2に記載の「店舗管理システム」は、消費電力を表示し、各機器の動作状況、温度等の店舗の状況を表示する。
さらに、例えば、特許文献3に記載の「厨房管理システム」では、水道やガス、電力等の使用量から目標使用量を算出し、目標使用量と実際の使用量を表示する。
しかしながら、上述の特許文献1乃至3の従来技術では、電力等のエネルギーの使用量をモニタリングして表示するのみであり、どのような省エネ行動をユーザが実施しているかをモニタリングしていない。したがって、ユーザの省エネ行動と電力等のエネルギーの使用量との関連性を把握することができず、省エネ行動のモチベーションの維持ができないという課題があった。
本発明は、このような実情に鑑みてなされたものであって、ユーザの省エネ行動をモニタリングし、ユーザの省エネ行動とエネルギーの使用量との関連性を提示することによって、モチベーションの維持や継続を支援するシステムを提供する。
上記課題を解決するために、本発明によれば、エネルギーの消費量を抑制する省エネ行動の情報と、前記省エネ行動を実施したときに抑制されるエネルギーに関連する削減値と、ユーザの前記省エネ行動の実施結果の情報とを格納する記憶部と、前記省エネ行動の前記実施結果を記録する対象期間と、該対象期間における期間目標値とを設定する目標値設定部と、前記対象期間と前記期間目標値に基づいて、少なくとも1つの一日当たりの目標値を算出する目標算出部と、前記エネルギーの消費量を測定するエネルギー消費測定部と、前記省エネ行動の前記実施結果を入力させるための行動実施入力部と、前記省エネ行動の前記実施結果によって抑制された削減結果値を、前記削減値を用いて算出し、前記削減結果値と前記目標値とを比較することによって達成度を算出する達成度算出部と、前記達成度を表示する表示部とを備える省エネルギー行動支援システムが提供される。
本発明によれば、ユーザの省エネ行動をモニタリングし、ユーザの省エネ行動とエネルギーの使用量との関連性を提示することによって、モチベーションの維持や継続を支援することが可能となる。
本発明に関連する更なる特徴は、本明細書の記述、添付図面から明らかになるものである。また、上記した以外の、課題、構成及び効果は、以下の実施形態の説明により明らかにされる。
以下、添付図面を参照して本発明の実施形態について説明する。なお、添付図面は本発明の原理に則った具体的な実施形態と実装例を示しているが、これらは本発明の理解のためのものであり、決して本発明を限定的に解釈するために用いられるものではない。
<省エネルギー行動支援システムの構成>
図1は、本発明の一実施形態に係る省エネルギー行動支援システムの構成を示した図である。本実施形態に係る省エネルギー行動支援システム10は、店舗やビル、オフィスや家庭で利用する電気等のエネルギーの使用量をモニタリングし、省エネルギー行動を支援するシステムである。
図1は、本発明の一実施形態に係る省エネルギー行動支援システムの構成を示した図である。本実施形態に係る省エネルギー行動支援システム10は、店舗やビル、オフィスや家庭で利用する電気等のエネルギーの使用量をモニタリングし、省エネルギー行動を支援するシステムである。
省エネルギー行動支援システム10は、データサーバ100と、ユーザ側(例えば、店舗)に設置される入出力端末120と、サポートセンタに設置される指導者用の入出力端末130と、ネットワーク140と、受信端末150と、電力センサ160と、環境センサ161と、連携機器・連携システム170とを備えている。
本実施形態では、データサーバ100は、データセンター等に設置される。このように、データサーバ100をデータセンターに設置することによって、ユーザの個人情報や、ユーザから収集されるデータなどのプライバシー情報を一元管理できるため、情報漏洩防止等のセキュリティ管理を簡易化できる。
入出力端末120は、スーパーやコンビニエンスストア、ドラッグストアや外食チェーンなどの店舗に設置される。また、入出力端末120は、戸建住宅やマンション等の住居に設置されてもよい。これにより、本システムを家庭向けとしても利用してもよい。
入出力端末120の利用者(以下、ユーザとする)は、店舗のマネージャ(店長)や各フロアのエリアマネージャ、従業員を想定している。家庭向けの場合は、住居に住む居住者を想定している。ユーザは、入出力端末120を操作することによって省エネルギー行動支援システム10を利用し、電力の使用量を削減する行動プログラム(以下、省エネ行動プログラムとする)を実施する。
また、入出力端末120は、1つまたは複数のパーソナルコンピュータで構成される。入出力端末120は、キーボードやマウスなどの入力部(図示せず)と、ディスプレイなどの表示部と、データサーバ100と通信する通信部(図示せず)とを有する。また、入出力端末120は、例えば、PDA、PHS、携帯電話、スマートフォン、タブレット端末などの可搬型端末にしてもよい。
また、指導者用の入出力端末130も同様に、1つまたは複数のパーソナルコンピュータで構成される。入出力端末130は、キーボードやマウスなどの入力部(図示せず)と、ディスプレイなどの表示部(図示せず)と、データサーバ100と通信する通信部(図示せず)とを有する。また、入出力端末130は、例えば、PDA、PHS、携帯電話、スマートフォン、タブレット端末などの可搬型端末にしてもよい。
また、入出力端末130の利用者は、省エネ行動プログラムの継続を支援するサポートセンタの指導者を想定している。指導者は、入出力端末130を操作して、ユーザの省エネ行動プログラムの実施を支援する。
ネットワーク140は、例えば、LAN(Local Area Network)ケーブルによる有線通信、又は無線LANによる無線通信を利用したネットワークである。また、ネットワーク140としては、構内PHSなど、他の構内ネットワークや、インターネット、VPN、携帯電話通信網、PHS通信網などの他の広域ネットワークを利用することもできる。
データサーバ100と、入出力端末120,130と、受信端末150とは、ネットワーク140を介して接続されている。データサーバ100は、ネットワーク140を介して、ユーザ側の入出力端末120及び指導者用の入出力端末130と通信を行う。
また、受信端末150は、例えば、独自の無線ネットワークを介して、1つまたは複数の電力センサ160、1つまたは複数の環境センサ161、及び、連携機器・連携システム170と通信する。また、受信端末150は、電力センサ160、環境センサ161、及び、連携機器・連携システム170から、定期的(例えば、1分毎)に情報を取得する。そして、受信端末150は、取得した情報を、ネットワーク140を介してデータサーバ100に送信する。
電力センサ160は、配電盤や分電盤、電灯機器や動力機器に設置され、電力使用量を計測する。また、環境センサ161は、店舗の室内や室外に設置され、温度や湿度、照度を計測する。
また、連携機器・連携システム170は、空調機(エアコン)や照明器具、テレビ、パーソナルコンピュータ(PC)、電子レンジ、モニタなどの電灯機器、エレベーターやエスカレータ、大型空調機などの動力機器、店舗の売上げや顧客数などを管理する店舗管理システム(POSシステム)などの情報システムで構成される。
<データサーバの構成>
データサーバ100は、例えばコンピュータなどの情報処理装置により構成されており、CPU(図示せず:プロセッサ又は演算部ともいう)と、メモリ102と、HDDやROMなどの記憶装置(図示せず)とを有している。この記憶装置には、後述する各データベースが格納されている。
データサーバ100は、例えばコンピュータなどの情報処理装置により構成されており、CPU(図示せず:プロセッサ又は演算部ともいう)と、メモリ102と、HDDやROMなどの記憶装置(図示せず)とを有している。この記憶装置には、後述する各データベースが格納されている。
なお、以下では、データサーバ100は、ハードウェア構成として記載されているが、このデータサーバ100の機能をソフトウェアのプログラムコードでも実現することができる。
データサーバ100は、制御部101と、メモリ102と、通信部103と、気象情報取得部104と、電力使用量取得部105と、行動実施入力部106と、出力部107と、目標消費電力量設定部108と、期間目標算出部109と、ユーザ行動判定部110と、累積削減量算出部111と、実施率算出部112と、達成度算出部113と、表示画面生成部114と、指導文候補生成部115と、レポート作成部116と、ユーザ情報データベース117と、データ蓄積データベース118と、知識データベース119とを備える。
制御部101は、データサーバ100内の各機能と接続されており、データサーバ100全体を制御するものである。通信部103は、ネットワーク140を介して、ユーザ側の入出力端末120と、指導者用の入出力端末130と、受信端末150と通信を行うものである。また、気象情報取得部104は、インターネット上のサイトや外部の機関(例えば、気象庁)などから気象情報を取得するものである。
また、電力使用量取得部105は、受信端末150と通信して、電力センサ160からの情報を取得するものである。また、電力使用量取得部105は、受信端末150と通信して、環境センサ161からの情報も取得する。また、電力使用量取得部105は、本システムの初回起動時に外部から過去の電力使用量を取得して、電力使用量テーブル220に電力使用量を格納するようにしてもよい。
行動実施入力部106は、ユーザ側の入出力端末120に表示された画面に入力された情報(省エネ行動)を受付け、その情報をデータ蓄積データベース118に記録するものである。
また、出力部107は、表示画面生成部114が生成した画面を、ユーザ側の入出力端末120と指導者用の入出力端末130とに出力するものである。
目標消費電力量設定部108は、ユーザから入力された目標削減率及び実施期間(対象期間)の前年実績消費電力量に基づいて、実施期間における目標消費電力量(期間目標値)を設定するものである(図10参照)。
また、期間目標算出部109は、目標削減率と実施期間と前年実績消費電力量とに基づいて、一日当たりのエネルギーの目標消費量と一日当たりのエネルギーの目標削減量と目標累積削減量とを算出するものである。
ユーザ行動判定部110は、電力センサ160及び環境センサ161のセンサデータと連携機器・連携システム170のデータとに基づいて、イベントがあったかどうかを自動的に判定するものである。また、ユーザ行動判定部110は、ユーザの省エネ行動の有無や省エネ行動の回数も判定する。
累積削減量算出部111は、実施期間の開始日から対象日までの一日当たりの削減量を加算していき、累積削減量を算出するものである。
実施率算出部112は、一日当たりの目標削減量と、ユーザの省エネ行動の実施記録から求めた合計削減量に基づいて、実施率を算出する。実施率の詳細については後述する。
達成度算出部113は、実施率算出部112によって算出された実施率に基づいて達成度を算出するものである。達成度の詳細については後述する。
表示画面生成部114は、ユーザ側の入出力端末120と指導者用の入出力端末130とに出力するための画面を生成するものである。
また、指導文候補生成部115は、ユーザ側の入出力端末120に提示する指導文の候補を生成するものである。さらに、レポート作成部116は、指導文候補生成部115が生成した指導文の候補を指導者側の入出力端末130に出力するものである。
<データベース及びメモリの構成>
以下では、図1に示されたユーザ情報データベース117と、データ蓄積データベースと、知識データベース119、メモリ102の詳細について説明する。なお、以下の説明では「テーブル」形式によって各データベース及びメモリについて説明するが、これら情報は必ずしもテーブルによるデータ構造で表現されていなくても良く、リストや配列など他のデータ構造で表現されていてもよい。
以下では、図1に示されたユーザ情報データベース117と、データ蓄積データベースと、知識データベース119、メモリ102の詳細について説明する。なお、以下の説明では「テーブル」形式によって各データベース及びメモリについて説明するが、これら情報は必ずしもテーブルによるデータ構造で表現されていなくても良く、リストや配列など他のデータ構造で表現されていてもよい。
図2は、図1のユーザ情報データベース117の一例200を示した図である。ユーザ情報データベース200は、ユーザ情報テーブル210と、電力使用量テーブル220と、エコ行動カードテーブル230と、イベント情報テーブル240とを備える。ここで、「エコ行動」とは、環境に優しい(eco-friendly)行動であり、省エネルギーを実現できる行動を意味する。
ユーザ情報テーブル210は、ユーザの固有情報等を管理するためのテーブルである。ユーザ情報テーブル210は、ユーザを識別するユーザIDを格納するフィールド211と、ユーザがシステム利用時にユーザ認証を実施するときに使用するユーザパスワードを格納するフィールド212と、名称や住所、電子メールアドレス等の固有情報を格納するフィールド213と、省エネ行動プログラムで目標とする電力使用量の削減率を格納するフィールド214と、省エネ行動プログラムの実施期間を格納するフィールド215と、実施期間と同期間での前年の電力使用量を格納するフィールド216と、省エネ行動プログラムにおける目標削減量を格納するフィールド217と、実施期間の開始日を格納するフィールド218とを備える。
例えば、ユーザ情報テーブル210のレコード210Aの例では、ユーザID「user0001」、店舗名「AAA」、住所「BBB」のユーザが、この省エネ行動プログラムに対して電力使用量の目標削減率-10%を設定し、そのプログラムを12ヶ月間実施することを示している。また、レコード210Aの例では、このユーザの前年の電力使用量が2,000,000[kWh]である。そして、目標削減率が-10%なので、目標削減量を格納するフィールド217には、年間の電力使用量の目標削減量200,000[kWh]が設定されている。
電力使用量テーブル220は、ユーザ毎の毎月の電力使用量を格納するためのテーブルである。電力使用量テーブル220は、ユーザを識別するユーザIDを格納するフィールド221と、使用量の請求年月を格納するフィールド222と、使用期間を格納するフィールド223と、使用日数を格納するフィールド224と、使用量を格納するフィールド225と、請求額を格納するフィールド226とを備える。
例えば、電力使用量テーブル220のレコード220Aの例では、ユーザID「user0001」のユーザは、請求年月2010年4月の使用量が133,900[kWh]であることを示している。
エコ行動カードテーブル230は、ユーザが省エネ行動プログラムの開始時に選択した省エネ行動の実施項目(エコ行動カード)を格納するためのテーブルである。
エコ行動カードテーブル230は、ユーザを識別するユーザIDを格納するフィールド231と、省エネ行動の分類であるカテゴリ名称を格納するフィールド232と、省エネ行動を識別するエコ行動カードID(以下、カードIDとする)を格納するフィールド233と、省エネ行動の内容を格納するエコ行動フィールド234と、省エネ行動の実施により削減される電力使用量を格納する削減量フィールド235と、省エネ行動を記録できる1日の制限回数を格納するフィールド236とを備える。フィールド236については、例えば、カードIDがSCのエコ行動の場合、「ショーケースに詰め込み過ぎない」は一日の目安として削減量が設定されているので、制限回数が「1」に設定されている。
例えば、エコ行動カードテーブル230のレコード230Cの例では、ユーザID「user0001」のユーザのエコ行動カードが設定されている。レコード230Cでは、カテゴリ「空調機」に関する省エネ行動「運転時間を開店前1時間短縮」のカードIDが「AC-1」であり、この省エネ行動によって削減される電力使用量が「41」kWhであり、この省エネ行動の制限回数が特にないことを示している。
イベント情報テーブル240は、ユーザが省エネ行動プログラムの開始時に選択した、電力使用量の増減に関わる現象や出来事、省エネ行動の阻害要因となる事象(以下、イベントとする)を格納するためのテーブルである。
イベント情報テーブル240は、ユーザを識別するユーザIDを格納するフィールド241と、イベント情報の分類であるカテゴリ名称を格納するフィールド242と、イベント情報を識別するイベントIDを格納するフィールド243と、イベント情報の内容を格納するフィールド244とを備える。
例えば、イベント情報テーブル240のレコード240Aの例では、ユーザID「user0001」のユーザのイベント情報が設定されている。レコード240Aは、カテゴリ「気象」に関するイベント情報「雨や曇り」が、イベントID「ERC」であることを示している。
図3は、図1のメモリ102の一例300を示した図である。メモリ300は、CO2排出量係数格納エリア310と、目標値格納エリア320とを備える。
CO2排出量係数格納エリア310は、CO2排出量係数をユーザ毎に管理するためのエリアである。CO2排出量係数格納エリア310は、ユーザを識別するユーザIDを格納するフィールド311と、光熱種別を格納するフィールド312と、光熱種別毎のCO2排出量係数を格納するフィールド313とを備える。これらのCO2排出量係数は、ユーザの店舗や住居に電気やガス、水道水などを供給している電力会社、ガス会社、水道局などから提供される数値を用いることを想定している。店舗や住居に、太陽光発電装置や燃料電池などの自家発電可能な装置を設置している場合は、独自に排出量係数を設定することもできる。
例えば、CO2排出量係数格納エリア310のレコード310Aの例では、ユーザID「user0001」のユーザの光熱種別が「電気」の場合のCO2排出量係数が設定されている。レコード310Aは、「電気」のCO2排出量係数が「0.339」kg-CO2/kWhであることを示している。このように、CO2排出量係数をユーザ毎に管理することによって、エネルギーの使用量に応じてそのユーザに適したCO2排出量を算出することができる。
目標値格納エリア320は、前年の一日当たりの実績値、一日当たりの削減目標値、一日当たりのエネルギーの目標消費量、及び累積目標値をユーザ毎に管理するためのエリアである。
目標値格納エリア320は、ユーザを識別するユーザIDを格納するフィールド321と、対象年月を格納するフィールド322と、前年同月の一日当たりの実績値を格納するフィールド323と、対象年月の一日当たりの削減目標値を格納するフィールド324と、所定の日数間隔で算出された累積目標値を格納するフィールド325とを備える。ここでは、図示を省略しているが、目標値格納エリア320は、更に、一日当たりのエネルギーの目標消費量を格納するエリアを備えていてもよい。
例えば、目標値格納エリア320のレコード320Aの例では、ユーザID「user0001」のユーザの対象年月「2011年4月度」について、前年実績値、削減目標値、及び累積目標値が設定されている。レコード320Aは、前年の実績値が「4463」kWh/日であり、削減目標値が「446」kWh/日であり、累積目標値が月初の1日(累積目標値1)が「446」であり、10日目(累積目標値2)が「4460」であり、20日目(累積目標値3)が「8920」であり、末日(累積目標値4)が「13380」kWh/日であることを示している。
このように、初日から10日毎及び末日に累積目標値を設定することによって、累積目標値1から累積目標値2を「上旬」、累積目標値2の翌日から累積目標値3を「中旬」、累積目標値3の翌日から累積目標値4を「下旬」と、3つの期間に分類することができ、省エネ行動の評価を行う時の基準、すなわち減量ペースとして簡易に利用することができる。
図4は、図1の知識データベース119の一例400を示した図である。知識データベース400は、指導知識テーブル410と、イベント判定知識テーブル420とを備える。
指導知識テーブル410は、指導者側の入出力端末130にユーザに対する指導文の候補を提示するために利用するテーブルである。指導知識テーブル410は、ユーザを識別するユーザIDを格納するフィールド411と、指導文のカテゴリを示す着目点の情報を格納するフィールド412と、指導文を生成するための条件式を格納するフィールド413と、条件式に一致したときに提示する指導文を格納するフィールド414とを備える。
例えば、指導知識テーブル410のレコード410Aの例では、累積削減量TDEEが月末の累積目標値(累積目標値4と同じ)OTEE以下であるとき(TDEE及びOTEEは負の値として計算する)、すなわち累積目標値よりも削減量が大きいとき、「目標値をクリアしました。この調子で頑張りましょう。」という指導文の候補が設定されていることを示している。このように、累積削減量と累積目標値とを比較して電力削減量の進捗状況を評価して指導文を提示することによって、省エネ行動の継続を支援できる。
また、例えば、指導知識テーブル410のレコード410Bの例では、累積削減量TDEEが累積目標値OTEE以下、かつ上旬の減量ペースが下旬の減量ペースよりも大きいとき、すなわち下旬よりも上旬の減量ペースが大きいとき、「後半はゆるやかでしたが、前半頑張り目標達成です。」という指導文の候補が設定されていることを示している。
また、例えば、指導知識テーブル410のレコード410Cの例では、累積削減量TDEEが累積目標値OTEEより大きい、かつ下旬の減量ペースが上旬の減量ペースよりも大きいとき、すなわち目標値を達成できていないが上旬よりも下旬の減量ペースの方が大きいとき、「目標達成はできませんでしたが、後半は頑張りましたね。引き続きこのペースで頑張りましょう。」という指導文の候補が設定されていることを示している。このように、累積削減量の目標値だけでなく、電力削減量の進捗状況を示す減量ペースを用いることによって、指導員がユーザに対してより幅広く褒める指導を行うことができる。したがって、ユーザがモチベーションを維持でき、省エネ行動の継続意識を向上させることができる。
また、例えば、指導知識テーブル410のレコード410Dの例では、累積削減量TDEEが累積目標値OTEEより大きい、かつ省エネ行動の実施率EARの平均値AVE(EAR)が1以上、すなわち目標値を達成できていないが省エネ行動は一日の目標とする実施率1を上回っているとき、「目標達成はできませんでしたが、省エネ行動は目標以上です。このまま頑張りましょう。」という指導文の候補が設定されていることを示している。このように、累積削減量の目標値だけでなく、一日当たりの省エネ行動の実施結果に応じて指導文の候補が設定されている。特に、本実施例では、省エネ行動の実施状況を示す実施率を用いることによって、電力量の削減ができなかった場合でも、省エネ行動を適切に評価できる。したがって、ユーザがモチベーションを維持でき、省エネ行動の継続意識を向上させることができる。
イベント判定知識テーブル420は、イベントが生じたかを判定するために利用するテーブルである。イベント判定知識テーブル420は、ユーザを識別するユーザIDを格納するフィールド421と、電力センサ160や環境センサ161などのセンサ情報の条件式を格納するフィールド422と、連携機器・連携システム170からの情報の条件式を格納するフィールド423と、継続時間や対象期間などの時間に関する情報を格納するフィールド424と、フィールド421から423の判定知識をもとに判定された結果として出力されるイベントIDを格納するフィールド425と、備考フィールド426とを備える。
例えば、イベント判定知識テーブル420のレコード420Aの例では、60分間における1分毎の電力使用量DEEmが予め設定された定数C1より小さい場合、すなわち電力使用量が1時間変動がない場合、イベントID「EAC-1」が出力されることを示している。
また例えば、イベント判定知識テーブル420のレコード420Bの例では、「7/1(7月1日)」から「9/E(9月末日)」について、1分毎の電力使用量DEEmが予め設定された定数C2より大きく、かつ温度が20℃より高い状態が60分間継続した場合、イベントID「EAC」が出力されることを示している。
また、例えば、イベント判定知識テーブル420のレコード420Cの例では、気象情報取得部104が取得した気象情報に基づいて、「Rain(雨)」か「Cloudy(曇り)」を判定した場合、イベントID「ERC」が出力されることを示している。
また、例えば、イベント判定知識テーブル420のレコード420Dの例では、連携機器・連携システム170(例えば、POSシステム)から取得した顧客数Csが定数C3(例えば、1000人)以上の場合、イベントID「ECR」が出力されることを示している。
このように、イベント判定知識テーブル420を用いることによって、電力センサ160や環境センサ161のセンサ情報や、時間情報、及び連携機器・連携システム170の連携情報に応じてイベント情報を判定するための知識を簡易に構築することができる。
図5は、図1のデータ蓄積データベース118の一例500を示した図である。データ蓄積データベース500は、センサデータ蓄積テーブル510と、実施記録データ蓄積テーブル520と、実施記録サマリテーブル530とを備える。
センサデータ蓄積テーブル510は、設定された時間間隔で電力量や温度等のセンサ値を格納するためのテーブルである。センサデータ蓄積テーブル510は、ユーザを識別するユーザIDを格納するフィールド511と、日時を格納するフィールド512と、フィールド512の日時に対応する電力量や温度等のセンサ値を格納するフィールド513とを備える。センサデータ蓄積テーブル510では、1分毎のセンサデータを格納しているが、30分毎、1時間毎などにも設定することもできる。
例えば、センサデータ蓄積テーブル510のレコード510Aの例では、ユーザID「user0001」のユーザに関して、2011年7月9日23:31の1分間の電力量が、10[kWh]であることを示している。
実施記録データ蓄積テーブル520は、ユーザの実施記録やイベント情報を格納するためのテーブルである。実施記録データ蓄積テーブル520は、ユーザを識別するユーザIDを格納するフィールド521と、日時を格納するフィールド522と、フィールド522の日時に実施されたエコ行動を識別するカードIDやイベントIDなどを格納するフィールド523と、カードIDやイベントIDがユーザにより入力された(入力フラグ「user」)、または本システムにより登録されたか(入力フラグ「system」)を判別する入力フラグを格納するフィールド524とを備える。
例えば、実施記録データ蓄積テーブル520のレコード520Aの例では、ユーザID「user0001」が2011年7月9日11時31分に、カードID「AC」に該当するエコ行動を入力したことを示している。
また、例えば、実施記録データ蓄積テーブル520のレコード520Bの例では、ユーザID「user0001」のカードID「AC-1」が、2011年7月9日14時に、本システムにより登録されたことを示している。
実施記録サマリテーブル530は、一日毎の各種情報(電力使用量、実施記録、実施率、達成度、イベント、コメントなど)を格納するためのテーブルである。実施記録サマリテーブル530は、ユーザを識別するユーザIDを格納するフィールド531と、日付を格納するフィールド532と、フィールド532の日付の電力使用量の合計値を格納するフィールド533と、フィールド532の日付の平均気温を格納するフィールド534と、ユーザが実施した省エネ行動の実施記録を格納するフィールド537と、省エネ行動で削減された電力量の目安として実施記録から算出される電力削減量の合計値を格納するフィールド538と、省エネ行動の実施率を格納するフィールド539と、一日の省エネ行動の達成度を格納するフィールド540と、イベントの実施記録を格納するフィールド541と、ユーザが入力したコメント文を格納するフィールド542とを備える。
例えば、実施記録サマリテーブル530のレコード530Bの例では、ユーザID「user0001」のユーザに関して、2011年7月10日に、その日の電力使用量が4112[kWh]であり、省エネ行動の実施記録が「SC:1」「AC:1」「AC-1:2」「LC:1」であり、その実施記録で削減された電力量が-235[kWh]であることを示している。
<省エネルギー行動支援システムの動作>
次に、省エネルギー行動支援システム10の動作を、フローチャートを用いて説明する。図6は、データサーバ100の初回利用時の動作を表すフローチャートである。
次に、省エネルギー行動支援システム10の動作を、フローチャートを用いて説明する。図6は、データサーバ100の初回利用時の動作を表すフローチャートである。
ステップ601において、まず、制御部101は、表示画面生成部114及び出力部107を起動する。そして、表示画面生成部114が、初回利用時の画面を生成し、出力部107が、表示画面生成部114によって生成された画面を、ユーザ側の入出力端末120に出力する。例えば、図10に示す画面が、ユーザ側の入出力端末120に表示される。図10の画面については後述する。ここで、ユーザは、表示された画面に店舗の情報、過去の電力使用量の情報などを入力する。ユーザの入力が終了した後、制御部101は、入力された固有情報と実施期間と目標削減率をユーザ情報テーブル210に格納する。
また、制御部101は、電力使用量取得部105を起動してもよい。電力使用量取得部105は、過去の電力使用量等の情報を外部から取得して、電力使用量テーブル220に格納する。
次に、ステップ602において、制御部101は、気象情報取得部104を起動する。気象情報取得部104は、入力された住所情報をもとに最も距離の近い気象台や測候所、アメダスなどの気象データ観測点から、地域の気象情報を取得する。
例えば、ユーザID「user0001」のユーザの住所が「BBB」であり、最も距離の近い観測点が「CCC」である場合、その観測点から気象情報を取得することになる。これにより、都道府県が異なる場合でも、類似の気象条件である観測点の情報を利用できるので、より正確な気象情報を取得することが可能となる。
次に、ステップ603において、制御部101は、目標消費電力量設定部108及び期間目標算出部109を起動する。
目標消費電力量設定部108は、ステップ601で入力された実施期間に基づいて、前年実績電力消費量を取得する。そして、目標消費電力量設定部108は、入力された目標削減率と前年実績電力消費量とに基づいて、実施期間における目標消費電力量を算出する。具体的には、目標消費電力量設定部108は、電力使用量テーブル220から、初回利用時の前年同月以降で実施期間の月数分に該当する期間の毎月の電力使用量を抽出する。次に、目標消費電力量設定部108は、抽出した電力使用量を合算した値を前年実績電力消費量として算出する。さらに、目標消費電力量設定部108は、その目標消費電力量設定部108に目標削減率を乗算した値を目標消費電力量として算出する。その後、目標消費電力量設定部108は、図10の画面に算出結果を表示し、ユーザ情報テーブル210に算出結果を格納する。
また、ステップ603において、期間目標算出部109は、一日当たりのエネルギーの目標消費量と、一日当たりのエネルギーの目標削減量と、目標累積削減量とを算出する。具体的には、期間目標算出部109は、電力使用量テーブル220から、初回利用時の前年同月以降で実施期間の月数分に該当する期間の毎月の電力使用量を抽出する。期間目標算出部109は、前年の各月の電力使用量を各月の日数分で割って、前年の一日当たりの実績値を算出する。期間目標算出部109は、前年の一日当たりの実績値に目標削減率を乗算した値を、一日当たりのエネルギーの目標削減量として算出する。さらに、期間目標算出部109は、一日当たりのエネルギーの目標削減量を日数分だけ加算していき、目標累積削減量を算出する。さらに、期間目標算出部109は、前年の一日当たりの実績値と一日当たりのエネルギーの目標削減量との差分によって、一日当たりのエネルギーの目標消費量も算出する。
その後、期間目標算出部109は、算出結果をメモリ102の目標値格納エリア320に格納する。
以上で、データサーバ100の初回利用時の動作が終了する。
図10は、データサーバ100の初回利用時に入出力端末120に表示される画面例1000を示した図である。以下では、図6のステップと対応させて説明する。
画面1000は、ユーザが省エネ行動プログラムに参加するにあたり、ユーザ情報を入力する際の画面である。画面1000は、固有情報入力エリア1010と、使用量情報入力エリア1020と、目標設定エリア1030とを備える。
ステップ601において、ユーザは、固有情報入力エリア1010に、名称やパスワード、住所などのユーザ固有情報を入力する。
使用量情報入力エリア1020は、ユーザ自身が過去の電力使用量を入力するためのエリアである。ユーザは、過去の請求書などに記載された請求年月、使用量、使用期間、使用日数等の情報を参考にして、年次選択ボックス1021と月次選択ボックス1022から対象年月を選択し、電力使用量等の情報を入力できる。ここで、入力した情報は、電力使用量テーブル220に格納される。
なお、この例では、ユーザが、使用量情報入力エリア1020において過去の電力使用量をユーザ自身で入力しているが、上述したように、電力会社などのエネルギー関連会社から自動的に過去の電力使用量を取得してもよい。
次に、ユーザは、目標設定エリア1030に、省エネ行動プログラムの実施期間と目標削減率を入力する。ここで、ユーザが登録ボタン1040を押すと、ステップ603として、目標消費電力量設定部108が、ステップ601で入力された実施期間と目標削減率に基づいて、前年実績電力消費量及び目標消費電力量を算出する。算出された前年実績電力消費量及び目標消費電力量は、目標設定エリア1030に表示されている。図10の例では、目標削減率が-10%であり、前年実績電力消費量が、2,000,000kWhであり、目標消費電力量が、1,800,000kWhである。
図7は、データサーバ100のユーザ行動判定時の動作を表すフローチャートである。
ステップ701において、まず、制御部101は、ユーザ行動判定部110を起動する。ユーザ行動判定部110は、センサデータ蓄積テーブル510からセンサデータを読み出す。次に、ステップ702において、ユーザ行動判定部110は、連携機器・連携システム170からデータを取得する。
次に、ステップ703において、ユーザ行動判定部110は、ステップ701及びステップ702で読み出したセンサデータと連携機器・連携システム170のデータに基づいて、イベント判定知識テーブル420に格納された判定知識を用いてイベント情報を判定する。すなわち、このステップ703においては、センサデータと連携機器・連携システム170のデータに基づいて、イベントがあったかどうかが自動的に判定される。
次に、ステップ704において、ユーザ行動判定部110は、ステップ703で判定したイベント情報や、センサデータなどに基づいて、省エネ行動の有無や省エネ行動の回数をエコ行動カードの実施記録として判定する。すなわち、ステップ704においては、ユーザ自身が省エネ行動を実施記録として入力していなくても、省エネ行動があったかどうかが自動的に判定される。
次に、ステップ705において、ユーザ行動判定部110は、ステップ703及びステップ704で判定したイベント情報とエコ行動カードをデータ蓄積データベース500の実施記録データ蓄積テーブル520に格納する。
次に、ステップ706において、ユーザ行動判定部110は、終了するか否かを定期的に(例えば1分毎など)判定し、終了しないと判定した場合は、ステップ701から繰り返し実行する。
例えば、連携機器・連携システム170(例えば、POSシステム)から顧客情報を取得できる場合、取得した顧客情報から顧客数(Cs)を抽出する。図4のイベント判定知識テーブル420のレコード420Dの例では、顧客数(Cs)が閾値(C3)以上であるという条件が設定されている。したがって、ステップ703では、顧客数(Cs)が閾値(C3)以上の場合は、イベントID「ECR」のイベント情報が判定される。そして、ステップ705において、ユーザ行動判定部110は、実施記録データ蓄積テーブル520にレコード520Dを記録する。
また、例えば、図4のイベント判定知識テーブル420のレコード420Bの例では、電力使用量及び温度についての条件が設定されている。夏季(例えば7月から9月)に、エアコンに接続された電力センサ160で計測された1分毎の電力使用量DEEmが予め設定された閾値(C2)より大きく、かつ環境センサで計測された1分毎の温度が28℃以下の状態が60分間継続した場合は、ステップ703において、イベントID「EAC」のイベント情報が判定される。そして、ステップ705において、ユーザ行動判定部110は、イベントID「AC」のイベント情報を実施記録データ蓄積テーブル520に記録する。
このように、イベント判定知識テーブル420を利用することによって、イベント情報を自動的に登録することが可能となる。
また、例えば、図4のイベント判定知識テーブル420のレコード420Aの例では、電力使用量及び時間についての条件が設定されている。エアコンに接続された電力センサ160で計測された1分間の電力使用量DEEmが予め設定された閾値(C1)より小さく、かつその状態が60分間継続していた場合、すなわちエアコンが1時間使用されていないと判断された場合は、ステップ703において、イベントID「EAC-1」のイベント情報が判定される。さらに、ステップ704において、ユーザ行動判定部110は、エアコンが1時間使用されていないと判定し、エコ行動カードID「AC-1」の省エネ行動が実施されたと判定する。そして、ステップ705において、ユーザ行動判定部110は、実施記録データ蓄積テーブル520にレコード520Bを記録する。
このように、イベント判定知識テーブル420を利用することによって、ユーザの省エネ行動を判定し、省エネ行動(エコ行動カード)情報を自動的に登録することが可能となる。
図8は、データサーバ100の実施記録入力時の動作を表すフローチャートである。
まず、ステップ801において、制御部101は、行動実施入力部106と表示画面生成部114と出力部107とを起動する。行動実施入力部106は、図11に示す画面においてユーザによって入力される情報を受付ける。図11の画面の詳細については後述する。
次に、ステップ802において、行動実施入力部106は、入力された情報を実施記録サマリテーブル530に記録する。
次に、ステップ803において、表示画面生成部114は、表示画面を生成する。このステップ803の詳細については後述する。
最後に、ステップ804において、出力部107が、表示画面生成部114によって生成された画面をユーザ側の入出力端末120に出力する。
図11は、ユーザが省エネ行動の日々の実施記録を入力する際に入出力端末120に表示される画面の例1100を示した図である。
画面1100は、対象日を選択する日付選択ボックス1110と、対象日における時間を設定する時間ボックス1111と、入力する実施記録の種類を選択するためのタブ1120,1130,1140とを備える。
図11の例では、エコ行動実施入力タブ1120が選択されている。例えば、図8のステップ801において、エコ行動実施入力タブ1120が選択されると、表示画面生成部114が、エコ行動実施記録を入力するエリアを生成し、出力部107が、生成されたエリアを出力する。ここで、ユーザは、電力使用量を削減するための省エネ行動プログラムにおいて、各日に実行した省エネ行動(以下、エコ行動とする)の実施記録を入力する。
画面1100のエコ行動実施記録を入力するエリアは、実行したエコ行動を選択して入力するカラム1231と、エコ行動の実行回数を表示するカラム1232と、エコ行動の内容を表示するカラム1233と、エコ行動の実施で削減できる1日の電力使用量(以下、電力削減量とする)を表示するカラム1234と、エコ行動の実行回数に応じたエコ行動カード毎の電力使用量の削減量(以下、実施削減量とする)を表示するカラム1235と、全ての実施削減量の合計値(以下、実施合計値とする)を表示するエリア1236と、一日の目標削減量に達成するまでに必要な残りの削減量を表示するエリア1237とを備える。
ユーザは、電力使用量を削減する行動を実行した場合、カラム1231のチェックボックスをクリックすることでエコ行動に関する実施記録を入力することができる。また、同じエコ行動を複数回実行した場合は、チェックボックスをその回数分クリックすることで実施記録を入力することができる。
また、この際、制御部101は、データ蓄積データベース500の実施記録データ蓄積テーブル520に格納されたエコ行動カード情報を読み出し、画面1100に表示する。例えば、本実施例では、実施記録データ蓄積テーブル520のレコード520Bにエコ行動カードID「AC-1」520Bが登録されているので、エコ行動カード「エアコンを1時間短縮」1230Cが自動的に入力されることになる。これにより、入力時間を短縮することができるだけでなく、入力忘れを防止することができる。また、もし自動的に入力された実施記録データが正しくない場合でも、入力し直しすることで修正できるので、より正確に実施状況を記録することが可能となる。
ユーザが実施記録を入力すると、例えば、制御部101は、その入力結果に応じて実施削減量及び実施合計値を算出する。そして、その算出結果は、カラム1235とエリア1236に表示される。
例えば、画面1100の例では、1回の行動で20[kWh]の電力使用量を削減することができるエコ行動「ショーケースに詰め過ぎない」1230Aでは、実施記録として1回分実施されているため、このエコ行動の電力使用量の削減量として-20[kWh]が表示されている。
また、エコ行動「ショーケースに詰め過ぎない」1回分、「適切な温度に管理する」1回分、「エアコンを1時間短縮」2回分、「不要な照明を消灯する」1回分が実施記録として入力されているため、実施合計値「-235」が表示されている。
また、画面1100の例では、一日の目標削減量が446[kWh]であり、実施合計値が「-235」のため、残りの削減量として、「211」が表示されている。このように、省エネ行動の実施入力に応じて、残りの削減量が表示されるので、その日に必要な省エネ行動を把握することが可能となる。
図12は、ユーザが省エネ行動の日々の実施記録を入力する際に入出力端末120に表示される画面の別の例1200を示した図である。
図12の例では、イベント実施入力タブ1130が選択されている。例えば、図8のステップ801において、イベント実施入力タブ1130が選択されると、表示画面生成部114が、イベント実施記録を入力するエリアを生成し、出力部107が、生成されたエリアを出力する。
画面1200のイベント実施記録を入力するエリアは、イベントの実施状況を入力するカラム1341と、イベントの種類を表示するカラム1342とを備える。ユーザは、イベントの種類に該当する現象や出来事があった場合、カラム1341のチェックボックスをクリックすることによってイベントに関する実施記録を入力することができる。
例えば、天候が雨や曇りなどの場合、イベント「雨や曇り」1340Aをクリックして入力することになる。また、この際、制御部101は、データ蓄積データベース500の実施記録データ蓄積テーブル520に格納されたイベント情報を読み出し、画面1200に表示する。例えば、本実施例では、実施記録データ蓄積テーブル520のレコード520DにイベントID「ECR」が登録されているので、イベント「お客様多数」1340Bが自動的に入力されることになる。これにより、入力時間を短縮することができるだけでなく、入力忘れを防止することができる。
図13は、ユーザが省エネ行動の日々の実施記録を入力する際に入出力端末120に表示される画面の更に別の例1300を示した図である。
図13の例では、コメント入力タブ1140が選択されている。例えば、図8のステップ801において、コメント入力タブ1140が選択されると、表示画面生成部114が、コメントを入力するエリアを生成し、出力部107が、生成されたエリアを出力する。
画面1300のコメントを入力するエリアは、文章で入力するエリア1451を備える。エリア1451には、省エネ行動ができなかった理由や言い訳、また、省エネ行動が実施できたことを自分で褒めるための褒め言葉などを入力できる。画面1300の例は、「今日は残業で夜遅くまで商品整理をしていました。」が入力されていることがわかる。
入力が完了して登録ボタン1160が選択されると、ステップ802において、行動実施入力部106は、入力された情報を実施記録サマリテーブル530に記録する。例えば、図11の画面1000から図13の画面1300の場合、行動実施入力部106は、レコード530Bを実施記録サマリテーブル530に格納することになる。
図8のステップ803の画面生成の内容を詳細に説明する。図9は、ステップ803における動作を表すフローチャートである。
ステップ901において、まず、表示画面生成部114は、対象日となる一日の電力使用量の目標値(一日当たりの電力の目標消費量)OEEを目標値格納エリア320から読み出す。
次に、ステップ902において、表示画面生成部114は、対象日となる一日の電力使用量の実績値REEを実施記録サマリテーブル530から読み出す。
次に、ステップ903において、制御部101は、累積削減量算出部111を起動する。累積削減量算出部111は、以下の数式1を用いて、目標値OEEと実績値REEの差分から対象日となる一日の電力使用量の削減量DEEを算出する。
DEE=OEE-REE [kWh] ・・・(数式1)
次に、ステップ904において、累積削減量算出部111は、以下の数式2を用いて、開始日BDTから対象日ODTまでの削減量DEEを加算し、累積削減量TDEEを算出する。
次に、ステップ904において、累積削減量算出部111は、以下の数式2を用いて、開始日BDTから対象日ODTまでの削減量DEEを加算し、累積削減量TDEEを算出する。
ODT
TDEE(n) = Σ DEE(n) [kWh] ・・・(数式2)
n=BDT
これにより、累積削減量TDEEが算出される。
TDEE(n) = Σ DEE(n) [kWh] ・・・(数式2)
n=BDT
これにより、累積削減量TDEEが算出される。
次に、ステップ905において、制御部101は、実施率算出部112を起動する。実施率算出部112は、対象日となる一日の削減目標値(一日当たりの電力の目標削減量)OEAを目標値格納エリア320から読み出す。
次に、ステップ906において、実施率算出部112は、実施記録サマリテーブル530から、対象日におけるユーザの実施記録を読み出す。ここで、実施率算出部112は、実施記録のエコ行動カードに対応する削減量をエコ行動カードテーブル230から取得し、一日当たりの合計削減量TEAを算出する。
次に、ステップ907において、実施率算出部112は、以下の数式3を用いて、削減目標値OEAと合計削減量TEAに基づいて実施率EARを算出する。
EAR = TEA/OEE ・・・(数式3)
次に、ステップ908において、制御部101は、達成度算出部113を起動する。達成度算出部113は、以下の数式4を用いて、達成度EADを算出する。
次に、ステップ908において、制御部101は、達成度算出部113を起動する。達成度算出部113は、以下の数式4を用いて、達成度EADを算出する。
EAD = 2 (但し、EAR≧1) ・・・(数式4)
1 (但し、0<EAR<1)
0 (但し、EAR≦0)
ここで、達成度EADが0、1、2のとき、それぞれ「×」「○」「◎」が表示される。
1 (但し、0<EAR<1)
0 (但し、EAR≦0)
ここで、達成度EADが0、1、2のとき、それぞれ「×」「○」「◎」が表示される。
最後に、ステップ909において、表示画面生成部114は、目標値OEEと、実績値REEと、累積削減量TDEEと、達成度EADとに基づいて表示画面を生成し、出力部107に出力する。
図1の下部、図17、及び図18は、表示画面生成部114によって生成された画面が入出力端末120に表示された例を示している。図1の下部は、省エネ行動プログラムの実施期間が10日間の例である。また、図17は、省エネ行動プログラムの実施期間が1ヶ月の例である。図18は、省エネ行動プログラムの実施期間が3ヶ月の例である。
入出力端末120の画面は、グラフ表示エリアを備える。グラフ表示エリアでは、横軸に日付、縦軸に電力使用量(消費電力量123)及び電力削減量の累積削減量TDEE(累積削減量121)のグラフが示されている。このグラフにおいて、電力使用量の実績値REEは棒グラフで示されており、一日の目標値OEE(目標値122)は線グラフで示されている。また、累積削減量TDEEは、折れ線グラフで示されており、累積削減量TDEEは、実施期間の開始日を「0」として、削減量の値に応じて下向きに数値を取っている。また、グラフ内の黒色の四角印は、電力削減量の累積目標値を示している。ここでは、目標値格納エリア320の累積目標値を表示している。
また、エコ行動の実施記録に関しては、達成度125が、対象日と対応するようにグラフの日付と同軸上に表示されている。達成度125は、一日の目標値以上の削減量が達成できた場合に「◎」が表示され、一日の目標値未満であるが省エネ行動は実施した(すなわちエコ行動カードの実施記録がある)場合には「○」が表示され、省エネ行動を実施しなかった(すなわちエコ行動カードの記録がない)場合には「×」が表示されている。
平均気温124は、対象日と対応するようにグラフの日付と同軸上に表示され、数値で示されている。さらに、イベント126も対象日と対応するようにグラフの日付と同軸上に表示されている。イベント126については、イベントがあった日にチェックマーク「レ」が表示されている。
このように、省エネ行動と電力削減量との関連性が表示されるので、ユーザは日々の行動と電力削減量の結果を比較して参照でき、日々の実施状況を適切に把握することができる。また、日々の実施記録が一覧で参照できるので、日々の実施状況を簡単に把握することができる。
これにより、省エネ行動が適切にできているときは、電力が削減できている等、省エネ行動の結果として電力削減効果を簡易に把握できるので、省エネ行動の動機づけが可能となる。
また、イベント情報とともに一覧で参照できるので、省エネ行動を実施した場合に、様々な要因で期待通りに電力量が削減できなかった場合でも、その原因を把握できるため、モチベーションを維持でき、継続を支援することができる。
また、省エネルギー行動支援システムでは、通常、消費電力量の累積値を単に表示することが考えられるが、本発明では、累積削減量を用いたグラフ表示を行うことによって、消費電力量の累積値のグラフ表示と比較して、少ない表示エリアでも適切に表示することができる。例えば、本実施例では、目標削減率が10%のため、累積削減量は、消費電力量の累積値の10%の表示エリアでも表示できる。そのため、少ない表示エリアでも日々の電力量の変動(削減量の変動)を細かく把握できるため、省エネ行動と電力削減量との関係性をより把握しやすくすることができる。このように、累積削減量を用いた表示によって、効率的な表示が可能となる。また、スマートフォンやタブレット端末など、画面サイズの小さい表示デバイスでも、1画面で表示、スクロール表示など含めて、効率的な表示が可能となる。
さらに、累積削減量を用いたグラフ表示によって、図17のような1ヶ月間のグラフ表示や、図18のような3ヶ月間のグラフ表示、また1年間のグラフ表示など、長期間の省エネ行動と電力削減量との関連性を表示することができる。したがって、3ヶ月間や四半期毎、季節毎、1年間など、様々な期間の省エネ行動プログラムに、効果的かつ効率的に利用することが可能となる。
次に、指導者がユーザに対して省エネ行動の支援を行うための構成について説明する。図14は、指導者が月次レポートを作成する際のデータサーバ100の動作を表すフローチャートである。
まず、ステップ1501において、制御部101は、表示画面生成部114及び出力部107を起動する。そして、表示画面生成部114が、図15に示す指導者用画面を生成し、出力部107が、表示画面生成部114によって生成された画面を、指導者側の入出力端末130に出力する。指導者は、図15に示す画面において、ユーザの情報を入力する。図15の画面の詳細については、後述する。
次に、ステップ1502において、制御部101は、図15に画面で入力された情報を用いて、目標値格納エリア320から、削減目標値や累積目標値などを読み出す。
次に、ステップ1503において、制御部101は、前年の一日当たりの電力使用量の実績値を目標値格納エリア320から読み出す。
さらに、ステップ1504において、制御部101は、気象情報取得部104を起動し、気象情報取得部104が、気象情報を取得する。
次に、ステップ1505において、制御部101は、実施記録サマリテーブル530から実施記録を読み出す。
次に、ステップ1506において、制御部101は、指導文候補生成部115を起動する。指導文候補生成部115は、ステップ1502~1505において取得された目標値、実績値、気象情報などを用いて、知識データベース400の指導知識テーブル410を参照する。そして、指導文候補生成部115は、指導知識テーブル410から、条件が一致した指導文の候補を取得する。
次に、ステップ1507において、制御部101は、レポート作成部116を起動する。レポート作成部116は、指導文候補生成部115が取得した指導文の候補を指導者側の入出力端末130に出力する。この際、表示画面生成部114が、図16に示す指導者用画面を生成し、出力部107が、表示画面生成部114によって生成された画面を、指導者側の入出力端末130に出力する。図16の画面の詳細については、後述する。
図15は、指導者がユーザの情報を入力するときの入出力端末130に表示される画面の例1600を示した図である。
ステップ1501において、指導者側の入出力端末130には、画面1600が表示される。画面1600は、対象顧客を選択するエリア1610と、対象のユーザ(ここでは、店舗名)を選択するエリア1620と、指導文を作成する際に対象とする月次を選択するエリア1630とを備える。
指導者が各エリア1610,1620,1630を選択した後、実行ボタン1660が押されると、図14のステップ1502以降のステップが実行されることになる。
図16は、指導者が候補文を作成する際に入出力端末130に表示される画面の例1700を示した図である。
ステップ1507において、指導者側の入出力端末130には、画面1700が表示される。画面1700は、レポート作成エリア1710と、指導文候補表示エリア1730とを備える。
レポート作成エリア1710は、ユーザ側の入出力端末120に表示される画面が表示されるエリア1720と、選択後の指導文が表示されるエリア1740とを備える。この例では、エリア1720には、図17に示すユーザ側の画面が表示されている。
ステップ1507において出力された指導文の候補は、指導文候補表示エリア1730に着目点(消費電力量1730A、減量ペース1730B、エコ行動1730C)毎に分類されて表示される。このように、着目点毎に指導文の候補が表示されるので、異なる着目点で構成された指導文を簡単に作成することができ、ユーザに対して効果的に継続を支援することができる。
指導者は、指導文の候補を指導文候補表示エリア1730において選択すると、その指導文の文章が、エリア1740の指導文編集ボックス1741にコピーされる。指導者が、指導文編集ボックス1741内の指導文を編集し、登録ボタン1761を押すと、指導文を含む月次レポートが電子メールでユーザに送信される。なお、別形態として、データ蓄積データベース500が、指導者が作成した月次レポートを格納するためのテーブルを備え、月次レポートをデータ蓄積データベース500に格納するようにしてもよい。
このように、本システムにより、指導者は指導文候補を選択するだけで、簡単に指導文を作成することができるので、業務効率を向上することが可能となる。
また、指導者からの月次レポートを受信したユーザは、月次の実施記録を閲覧できるとともに、自身の省エネ行動に基づく指導文を確認できるので、省エネ行動のモチベーションを維持、さらに、省エネ行動のモチベーションを向上させることができる。例えば、本実施例では、月次レポートの指導文として、指導文編集ボックス1741の指導文「前半はゆるやかでしたが、後半頑張り目標達成です。」を確認できる。このように、累積削減量という結果だけでなく、電力削減量の進捗状況という経過まで含めた指導文を確認できるので、ユーザが省エネ行動のモチベーションを維持でき、継続意識を向上させることができる。
また、本実施例では、指導知識テーブル410を用いて、累積削減量と省エネ行動の実施状況に応じて適切な指導文が生成される。電力削減量の進捗状況や省エネ行動の実施状況などに応じて日々の省エネ行動が適切に評価され、指導者からの指導文としてその評価が提示されるので、ユーザが省エネ行動のモチベーションを維持でき、継続意識を向上させることができる。
従来の技術では、電力等のエネルギーの使用量をモニタリングして表示するのみで、どのような省エネ行動が実施されているかモニタリングされておらず、エネルギーの使用量と省エネ行動との関連性を把握することができなかった。
本実施形態では、実施率算出部112が、一日当たりの目標削減量と、ユーザの省エネ行動の実施記録から求めた合計削減量とに基づいて、実施率を算出する。さらに、達成度算出部113が、実施率算出部112によって算出された実施率に基づいて達成度を算出し、達成度がユーザ側の入出力端末120に表示される。
この構成によれば、ユーザの省エネ行動とエネルギーの使用量との関連性を提示することによって、モチベーションの維持や継続を支援することが可能となる。
また、従来の技術では、省エネ行動に対してその結果として表れる消費電力量の変動を俯瞰的に把握できず、省エネ行動のモチベーションの維持ができないという課題もあった。
本実施形態では、累積削減量算出部111が、実施期間の開始日から対象日までの一日当たりの削減量を加算することによって累積削減量を算出し、この累積削減量と達成度がユーザ側の入出力端末120において同軸上に表示される。
この構成によれば、ユーザが、累積削減量という形で消費電力量の変動を俯瞰的に把握することができ、モチベーションの維持や継続を支援することが可能となる。また、達成度と累積削減量とがユーザ側の入出力端末120において同軸上に表示されるので、ユーザの省エネ行動と削減量とを関係性が容易に把握できる。これにより、より効果的にモチベーションの維持や継続を支援することが可能となる。
また、本実施形態では、行動実施入力部106が、省エネ行動の阻害要因となる事象をイベント情報として入力させる処理を実行し、イベント情報と達成度がユーザ側の入出力端末120において同軸上に表示される。
この構成によれば、ユーザは、様々な要因で期待通りに電力量が削減できなかった場合でも、省エネ行動の阻害要因とともに把握できるので、ユーザの省エネ行動のモチベーションを維持でき、継続を支援することが可能となる。
また、本実施形態では、ユーザ行動判定部110が、センサデータと連携機器・連携システム170のデータに基づいて、イベントがあったかどうかを自動的に判定する。さらに、ユーザ行動判定部110は、省エネ行動の有無や省エネ行動の回数も自動的に判定する。
この構成によれば、イベントや省エネ行動があったかどうかが自動的に判定されるので、ユーザの入力忘れを防止することができ、より正確にイベントやユーザの省エネ行動を記録することが可能となる。
また、従来の技術では、省エネ行動の評価を消費電力量の変動に応じて適切に評価することができず、省エネ行動の継続を適正に支援できないという課題があった。
本実施形態では、指導文候補生成部115が、指導知識テーブル410を用いることによって、電力削減量の進捗状況又はユーザの省エネ行動の実施状況などに応じて、指導文面を変えて出力する。
この構成によれば、日々の省エネ行動が適切に評価され、指導者からの指導文としてその評価が提示されるので、ユーザが省エネ行動のモチベーションを維持でき、継続意識を向上させることができる。
以上、本発明の実施の形態につき述べたが、本発明は既述の実施形態に限定されるものでなく、本発明の技術的思想に基づいて各種の変形及び変更が可能である。
上述の実施形態において、省エネルギー行動支援システム10は、主に、電力エネルギーを対象としているが、電力に限定されず、ガスや水道など様々な光熱関連のエネルギーを対象にすることができる。
また、上述の実施形態において、ユーザ側の入出力端末120の画面には、達成度125、累積削減量121、イベント126の情報等の様々な情報が表示されているが、ユーザが省エネ行動とその結果との関連性が把握されればよく、例えば、達成度125及び累積削減量121の少なくとも1つが表示されればよい。達成度は、上述した3段階の評価に限られず、別の評価方法を用いてもよい。更に、累積削減量121だけでなく、1日当たりの削減量も表示してもよい。
また、上述の実施形態において、エコ行動カードテーブル230には、省エネ行動を実施したときに抑制されるエネルギーに関連する削減値として、電力の削減量が設定されている。この削減値は、電力に限定されず、例えば、メモリ102のCO2排出量係数格納エリア310を用いて、CO2の排出削減量にしてもよい。また、エネルギーの削減量に限定されず、エネルギーの削減量によって計算される節約金額など、ユーザのモチベーションの維持に関連するものに設定してもよい。
また、上述の実施形態において、本システムは、データサーバ100とユーザ側の入出力端末120と指導者側の入出力端末130の3つの装置で構成されているが、3つの装置の機能を1つの装置にまとめて構成することもできる。その場合、例えば、ユーザに提示される指導文は、指導知識テーブル410の条件に一致したものを自動的に表示するようにしてもよい。
また、上述した実施形態の構成は、それらの一部や全部を、例えば、集積回路で設計する等によりハードウェアで実現することができる。また、本発明は、実施形態の機能を実現するソフトウェアのプログラムコードで実現してもよい。この場合、プログラムコードを記録した記憶媒体をデータサーバ100等の情報処理装置に提供し、その情報処理装置のコンピュータ(又はCPUやMPU)が記憶媒体に格納されたプログラムコードを読み出す。この場合、記憶媒体から読み出されたプログラムコード自体が前述した実施形態の機能を実現することになり、そのプログラムコード自体、及びそれを記憶した記憶媒体は本発明を構成することになる。このようなプログラムコードを供給するための記憶媒体としては、例えば、フレキシブルディスク、CD-ROM、DVD-ROM、ハードディスク、光ディスク、光磁気ディスク、CD-R、磁気テープ、不揮発性のメモリカード、ROMなどが用いられる。
また、プログラムコードの指示に基づき、コンピュータ上で稼動しているOS(オペレーティングシステム)などが実際の処理の一部又は全部を行い、その処理によって前述した実施の形態の機能が実現されるようにしてもよい。さらに、記憶媒体から読み出されたプログラムコードが、コンピュータ上のメモリに書きこまれた後、そのプログラムコードの指示に基づき、コンピュータのプロセッサ(又は演算部)などが実際の処理の一部又は全部を行い、その処理によって前述した実施の形態の機能が実現されるようにしてもよい。
さらに、実施の形態の機能を実現するソフトウェアのプログラムコードを、ネットワークを介して配信することにより、それを情報処理装置のハードディスクやメモリ等の記憶手段又はCD-RW、CD-R等の記憶媒体に格納し、使用時にその装置のコンピュータ(又はCPUやMPU)が当該記憶手段や当該記憶媒体に格納されたプログラムコードを読み出して実行するようにしてもよい。
最後に、ここで述べたプロセス及び技術は本質的に如何なる特定の装置に関連することはなく、コンポーネントの如何なる相応しい組み合わせによってでも実装できることを理解する必要がある。更に、汎用目的の多様なタイプのデバイスがここで記述した教示に従って使用可能である。ここで述べた方法のステップを実行するのに、専用の装置を構築するのが有益であることが判るかもしれない。本発明は、具体例に関連して記述したが、これらは、すべての観点に於いて限定の為ではなく説明の為である。本分野にスキルのある者には、本発明を実施するのに相応しいハードウェア、ソフトウェア、及びファームウエアの多数の組み合わせがあることが解るであろう。例えば、本実施形態に記載の機能を実現するプログラムコードは、アセンブラ、C/C++、perl、Shell、PHP、Java(登録商標)等の広範囲のプログラム又はスクリプト言語で実装できる。
また、上述の実施形態において、制御線や情報線は、説明上必要と考えられるものを示しており、製品上必ずしも全ての制御線や情報線を示しているとは限らない。全ての構成が相互に接続されていてもよい。
100 データサーバ
101 制御部
102 メモリ
103 通信部
104 気象情報取得部
105 電力使用量取得部
106 行動実施入力部
107 出力部
108 目標消費電力量設定部
109 期間目標算出部
110 ユーザ行動判定部
111 累積削減量算出部
112 実施率算出部
113 達成度算出部
114 表示画面生成部
115 指導文候補生成部
116 レポート作成部
117 ユーザ情報データベース
118 データ蓄積データベース
119 知識データベース
120,130 入出力端末
140 ネットワーク
150 受信端末
160 電力センサ
161 環境センサ
170 連携機器・連携システム
101 制御部
102 メモリ
103 通信部
104 気象情報取得部
105 電力使用量取得部
106 行動実施入力部
107 出力部
108 目標消費電力量設定部
109 期間目標算出部
110 ユーザ行動判定部
111 累積削減量算出部
112 実施率算出部
113 達成度算出部
114 表示画面生成部
115 指導文候補生成部
116 レポート作成部
117 ユーザ情報データベース
118 データ蓄積データベース
119 知識データベース
120,130 入出力端末
140 ネットワーク
150 受信端末
160 電力センサ
161 環境センサ
170 連携機器・連携システム
Claims (10)
- エネルギーの消費量を抑制する省エネ行動の情報と、前記省エネ行動を実施したときに抑制されるエネルギーに関連する削減値と、ユーザの前記省エネ行動の実施結果の情報とを格納する記憶部と、
前記省エネ行動の前記実施結果を記録する対象期間と、該対象期間における期間目標値とに基づいて、少なくとも1つの目標値を算出する目標算出部と、
前記エネルギーの消費量を測定するエネルギー消費測定部と、
前記省エネ行動の前記実施結果を入力させるための行動実施入力部と、
前記省エネ行動の前記実施結果によって抑制された削減結果値を、前記削減値を用いて算出し、前記削減結果値と前記目標値とを比較することによって達成度を算出する達成度算出部と、
前記達成度を表示する表示部と
を備える省エネルギー行動支援システム。 - 請求項1に記載の省エネルギー行動支援システムにおいて、
前記目標算出部は、前記目標値として一日当たりのエネルギーの目標消費量を算出し、
前記省エネルギー行動支援システムは、
対象日の前記エネルギーの消費量と前記目標消費量とに基づいて前記対象日の削減消費量を算出し、前記対象期間の開始日から前記対象日までの前記削減消費量を加算して累積削減量を算出する累積削減量算出部を更に備え、
前記表示部が、前記達成度と前記累積削減量を同軸上に表示することを特徴とする省エネルギー行動支援システム。 - 請求項1又は2に記載の省エネルギー行動支援システムにおいて、
前記目標算出部は、前記目標値として一日当たりのエネルギーの目標削減量を算出し、
前記達成度算出部は、前記削減結果値と前記目標削減量とに基づいて前記省エネ行動に関する実施率を算出し、前記実施率に基づいて前記達成度を算出することを特徴とする省エネルギー行動支援システム。 - 請求項1乃至3のいずれか一項に記載の省エネルギー行動支援システムにおいて、
前記エネルギー消費測定部からの情報に基づいて、前記ユーザが前記省エネ行動を実施したかを自動的に判定するユーザ行動判定部を備え、
前記ユーザ行動判定部は、判定結果を前記省エネ行動の前記実施結果として前記記憶部に記録することを特徴とする省エネルギー行動支援システム。 - 請求項1乃至4のいずれか一項に記載の省エネルギー行動支援システムにおいて、
前記行動実施入力部は、前記省エネ行動の阻害要因となる事象をイベント情報として入力させる処理を更に実行し、
前記表示部は、前記イベント情報を前記達成度と同軸上に表示することを特徴とする省エネルギー行動支援システム。 - 請求項5に記載の省エネルギー行動支援システムにおいて、
前記省エネ行動の阻害要因となる事象を自動的に判定し、前記イベント情報を前記記憶部に記録するイベント判定部を更に備えることを特徴とする省エネルギー行動支援システム。 - 請求項1乃至6のいずれか一項に記載の省エネルギー行動支援システムにおいて、
前記ユーザに対する指導文面を出力する指導文生成部を備えることを特徴とする省エネルギー行動支援システム。 - 請求項7に記載の省エネルギー行動支援システムにおいて、
前記指導文生成部が、前記削減結果値と前記目標値との比較によって前記指導文面を変えて出力することを特徴とする省エネルギー行動支援システム。 - 請求項7又は8に記載の省エネルギー行動支援システムにおいて、
前記指導文生成部が、前記ユーザの前記省エネ行動の前記実施結果に応じて前記指導文面を変えて出力することを特徴とする省エネルギー行動支援システム。 - ユーザの省エネルギー行動を支援する処理をコンピュータに実行させるためのコンピュータプログラムであって、前記コンピュータが、記憶部と、演算部と、表示部とを備え、
前記コンピュータに、
エネルギーの消費量を抑制する省エネ行動の情報と、前記省エネ行動を実施したときに抑制されるエネルギーに関連する削減値と、ユーザの前記省エネ行動の実施結果の情報とを前記記憶部に格納する処理と、
前記演算部により、前記省エネ行動の前記実施結果を記録する対象期間と、該対象期間における期間目標値とに基づいて、少なくとも1つの目標値を算出する処理と、
前記演算部により、前記エネルギーの消費量を測定する処理と、
前記演算部により、前記省エネ行動の前記実施結果を入力させる処理と、
前記演算部により、前記省エネ行動の前記実施結果によって抑制された削減結果値を前記削減値を用いて算出し、前記削減結果値と前記目標値とを比較して達成度を算出する処理と、
前記表示部により、前記達成度を表示する処理と
を実行させるためのコンピュータプログラム。
Applications Claiming Priority (2)
| Application Number | Priority Date | Filing Date | Title |
|---|---|---|---|
| JP2012070223 | 2012-03-26 | ||
| JP2012-070223 | 2012-03-26 |
Publications (1)
| Publication Number | Publication Date |
|---|---|
| WO2013145809A1 true WO2013145809A1 (ja) | 2013-10-03 |
Family
ID=49259095
Family Applications (1)
| Application Number | Title | Priority Date | Filing Date |
|---|---|---|---|
| PCT/JP2013/050513 Ceased WO2013145809A1 (ja) | 2012-03-26 | 2013-01-15 | 省エネルギー行動支援システム |
Country Status (2)
| Country | Link |
|---|---|
| JP (1) | JPWO2013145809A1 (ja) |
| WO (1) | WO2013145809A1 (ja) |
Cited By (2)
| Publication number | Priority date | Publication date | Assignee | Title |
|---|---|---|---|---|
| JP2017027170A (ja) * | 2015-07-16 | 2017-02-02 | パナソニックIpマネジメント株式会社 | 節電目標決定装置、節電目標決定方法及び制御プログラム |
| JPWO2023135678A1 (ja) * | 2022-01-12 | 2023-07-20 |
Families Citing this family (1)
| Publication number | Priority date | Publication date | Assignee | Title |
|---|---|---|---|---|
| JP2015143914A (ja) * | 2014-01-31 | 2015-08-06 | 株式会社日立製作所 | 省エネ行動支援システム及び省エネ行動支援方法 |
Citations (4)
| Publication number | Priority date | Publication date | Assignee | Title |
|---|---|---|---|---|
| JP2005266873A (ja) * | 2004-03-16 | 2005-09-29 | Osaka Gas Co Ltd | 省エネ行動指針提供システム |
| JP2008102709A (ja) * | 2006-10-18 | 2008-05-01 | Toshiba Corp | エネルギー管理システム及びエネルギー管理方法 |
| JP2011013755A (ja) * | 2009-06-30 | 2011-01-20 | Hitachi Ltd | Co2排出量削減支援システム,co2排出量削減社会支援システム及び支援方法 |
| JP2011034205A (ja) * | 2009-07-30 | 2011-02-17 | Toda Constr Co Ltd | Co2削減メディアシステム及びco2削減支援方法 |
Family Cites Families (1)
| Publication number | Priority date | Publication date | Assignee | Title |
|---|---|---|---|---|
| JP5394085B2 (ja) * | 2009-01-29 | 2014-01-22 | 株式会社インティ | 省エネルギー支援システム及び省エネルギー支援プログラム |
-
2013
- 2013-01-15 WO PCT/JP2013/050513 patent/WO2013145809A1/ja not_active Ceased
- 2013-01-15 JP JP2014507459A patent/JPWO2013145809A1/ja active Pending
Patent Citations (4)
| Publication number | Priority date | Publication date | Assignee | Title |
|---|---|---|---|---|
| JP2005266873A (ja) * | 2004-03-16 | 2005-09-29 | Osaka Gas Co Ltd | 省エネ行動指針提供システム |
| JP2008102709A (ja) * | 2006-10-18 | 2008-05-01 | Toshiba Corp | エネルギー管理システム及びエネルギー管理方法 |
| JP2011013755A (ja) * | 2009-06-30 | 2011-01-20 | Hitachi Ltd | Co2排出量削減支援システム,co2排出量削減社会支援システム及び支援方法 |
| JP2011034205A (ja) * | 2009-07-30 | 2011-02-17 | Toda Constr Co Ltd | Co2削減メディアシステム及びco2削減支援方法 |
Cited By (3)
| Publication number | Priority date | Publication date | Assignee | Title |
|---|---|---|---|---|
| JP2017027170A (ja) * | 2015-07-16 | 2017-02-02 | パナソニックIpマネジメント株式会社 | 節電目標決定装置、節電目標決定方法及び制御プログラム |
| JPWO2023135678A1 (ja) * | 2022-01-12 | 2023-07-20 | ||
| WO2023135678A1 (ja) * | 2022-01-12 | 2023-07-20 | 三菱電機株式会社 | エネルギー管理支援装置、プログラム及びエネルギー管理支援方法 |
Also Published As
| Publication number | Publication date |
|---|---|
| JPWO2013145809A1 (ja) | 2015-12-10 |
Similar Documents
| Publication | Publication Date | Title |
|---|---|---|
| JP5852941B2 (ja) | 省エネルギー行動継続支援システム | |
| JP5780833B2 (ja) | ネットワークサービスシステム | |
| JP4648482B1 (ja) | 分析装置及び計測管理システム | |
| US11586998B2 (en) | Gaming apparatus based on competitive use of residential energy | |
| Han et al. | Household-level analysis of the impacts of electricity consumption on welfare and the environment in Cambodia: Empirical evidence and policy implications | |
| JP2009070339A (ja) | エネルギー消費情報通知システム | |
| JP5479779B2 (ja) | 省エネルギー運転の省消費電力効果を表示する省エネルギー運転支援装置およびその支援方法 | |
| JP2002189779A (ja) | エネルギー情報処理システム並びにサーバ及びエネルギー情報処理装置並びに記録媒体 | |
| Sunikka-Blank et al. | Improving energy efficiency of social housing areas: A case study of a retrofit achieving an “A” energy performance rating in the UK | |
| JP5382790B2 (ja) | Co2削減メディアシステム及びco2削減支援方法 | |
| JP5520530B2 (ja) | Co2排出量削減支援システム,co2排出量削減社会支援システム及び支援方法 | |
| WO2013145809A1 (ja) | 省エネルギー行動支援システム | |
| Brown | Using wireless power meters to measure energy use of miscellaneous and electronic devices in buildings | |
| JP2023068356A (ja) | 省エネルギー支援システム | |
| JP6018348B1 (ja) | 節電支援装置、及び節電支援方法 | |
| JP3836597B2 (ja) | ガス使用量の用途別分解方法および省エネ診断システム | |
| JP2005025654A (ja) | エネルギ管理システム | |
| JP2016177836A (ja) | 発電量評価装置、発電量評価方法および発電量評価プログラム | |
| Suciu et al. | Cloud-Based platform for enhancing energy consumption awareness and substantiating the adoption of energy efficiency measures within SMEs | |
| JP2017041202A (ja) | 情報端末の制御方法及び情報システム | |
| Harnanan et al. | Measurement and analysis of energy-saving devices for vending machines at a university | |
| JP2015190625A (ja) | 空調システムのアドバイス装置 | |
| JP2023128870A (ja) | 再生可能エネルギー管理装置、及び再生可能エネルギー管理方法 | |
| Wang et al. | Design a smart control strategy to implement an intelligent energy safety and management system | |
| Zhao et al. | Economic analysis of using a renewable wind power system at a signalized intersection |
Legal Events
| Date | Code | Title | Description |
|---|---|---|---|
| 121 | Ep: the epo has been informed by wipo that ep was designated in this application |
Ref document number: 13767700 Country of ref document: EP Kind code of ref document: A1 |
|
| ENP | Entry into the national phase |
Ref document number: 2014507459 Country of ref document: JP Kind code of ref document: A |
|
| NENP | Non-entry into the national phase |
Ref country code: DE |
|
| 122 | Ep: pct application non-entry in european phase |
Ref document number: 13767700 Country of ref document: EP Kind code of ref document: A1 |