WO2013140558A1 - 質量分析装置 - Google Patents
質量分析装置 Download PDFInfo
- Publication number
- WO2013140558A1 WO2013140558A1 PCT/JP2012/057272 JP2012057272W WO2013140558A1 WO 2013140558 A1 WO2013140558 A1 WO 2013140558A1 JP 2012057272 W JP2012057272 W JP 2012057272W WO 2013140558 A1 WO2013140558 A1 WO 2013140558A1
- Authority
- WO
- WIPO (PCT)
- Prior art keywords
- voltage
- ion
- step width
- mass
- voltage value
- Prior art date
Links
Images


Classifications
-
- G—PHYSICS
- G01—MEASURING; TESTING
- G01N—INVESTIGATING OR ANALYSING MATERIALS BY DETERMINING THEIR CHEMICAL OR PHYSICAL PROPERTIES
- G01N27/00—Investigating or analysing materials by the use of electric, electrochemical, or magnetic means
- G01N27/62—Investigating or analysing materials by the use of electric, electrochemical, or magnetic means by investigating the ionisation of gases, e.g. aerosols; by investigating electric discharges, e.g. emission of cathode
-
- H—ELECTRICITY
- H01—ELECTRIC ELEMENTS
- H01J—ELECTRIC DISCHARGE TUBES OR DISCHARGE LAMPS
- H01J49/00—Particle spectrometers or separator tubes
- H01J49/02—Details
- H01J49/06—Electron- or ion-optical arrangements
-
- H—ELECTRICITY
- H01—ELECTRIC ELEMENTS
- H01J—ELECTRIC DISCHARGE TUBES OR DISCHARGE LAMPS
- H01J49/00—Particle spectrometers or separator tubes
- H01J49/02—Details
- H01J49/06—Electron- or ion-optical arrangements
- H01J49/062—Ion guides
-
- H—ELECTRICITY
- H01—ELECTRIC ELEMENTS
- H01J—ELECTRIC DISCHARGE TUBES OR DISCHARGE LAMPS
- H01J49/00—Particle spectrometers or separator tubes
- H01J49/02—Details
- H01J49/10—Ion sources; Ion guns
Definitions
- the present invention relates to a mass spectrometer, and more particularly to a technique for automatically adjusting a voltage applied to an ion transport optical system for transporting ions to a subsequent stage in the mass spectrometer.
- a plurality of ion transport optical elements are used for transporting to a subsequent stage while suppressing divergence of ions derived from a sample.
- a desolvation tube, Q array disposed between an ion source and a quadrupole mass filter that is a mass analyzer.
- An ion guide, a skimmer, an octopole ion guide, an entrance lens electrode, a prerod electrode, and the like are all ion transport optical elements.
- the production efficiency of desired product ions depends on the collision energy of ions incident on the collision cell.
- the collision energy is determined by the voltage applied to the collision cell and the ion transport optical element in the preceding stage, and the ion intensity is changed by adjusting this voltage. Therefore, it can be said that the collision cell is also an ion transport optical element in a broad sense.
- the optimum voltage value at which the maximum ion intensity can be obtained is slightly different for each apparatus.
- the optimum voltage value also differs depending on the mass-to-charge ratio of the analysis target component. Therefore, in order to perform high-sensitivity and high-accuracy analysis, it is necessary to find an optimum value of the voltage applied to each ion transport optical element for each apparatus and for each mass-to-charge ratio prior to actual analysis.
- the conventional mass spectrometer is equipped with an auto-tuning function that automatically obtains the optimum value of the applied voltage to each ion transport optical element. This reduces the burden of manually performing the task of finding the optimum voltage value.
- the voltage value here is the amplitude value when the applied voltage is a high-frequency voltage, and is the voltage value itself when the applied voltage is a DC voltage.
- the present invention has been made to solve the above-mentioned problems, and the object of the present invention is to reduce the time required for automatically adjusting the voltage applied to the ion transport optical element while reducing the ion intensity as much as possible.
- An object of the present invention is to provide a mass spectrometer capable of realizing a more appropriate voltage adjustment by finding a maximum state or a state close thereto.
- the change in the ion intensity when the voltage applied to the ion transport optical element such as an ion guide is changed shows a peak in a mountain shape as described above. It was found that the larger the mass-to-charge ratio, the larger the voltage value (absolute value) that gives the maximum ionic strength and the broader the peak width. That is, the larger the mass-to-charge ratio and the higher the applied voltage, the smaller the ionic strength change with respect to the unit voltage change amount. If the ionic strength change with respect to the unit voltage change amount is small, it is possible to find a voltage (optimum voltage) that gives an ionic strength that hardly decreases from the maximum ionic strength even if the step width of the voltage change is widened. The inventor of the present application pays attention to such points, and when searching for the optimum voltage while changing the voltage value of the applied voltage step by step, he came up with the idea of changing the voltage step width according to the applied voltage and mass-to-charge ratio. .
- the first invention made to solve the above problems comprises an ion transport optical element between an ion source and a detector, and the ion transport based on the result of mass analysis of a predetermined component in a sample.
- a mass spectrometer having an adjustment function for optimizing the voltage applied to the optical element, a) means for stepwise changing the voltage value of the applied voltage to the ion transport optical element with a predetermined step width, the voltage applying means for changing the step width according to the voltage value; b) Optimal voltage search means for acquiring ion intensity information for ions derived from a predetermined component each time the applied voltage is changed by the voltage applying means, and obtaining a voltage value that gives the maximum ion intensity based on the ion intensity information.
- a voltage search means for acquiring ion intensity information for ions derived from a predetermined component each time the applied voltage is changed by the voltage applying means, and obtaining a voltage value that gives the maximum ion intensity based on the ion intensity information.
- the voltage applying means has the step width continuously or stepwise so that the step width increases as the voltage value in the absolute value of the applied voltage increases. It is preferable to change the configuration.
- a mass spectrometer having an adjustment function for optimizing the voltage applied to the element, a) means for stepwise changing the voltage value of the voltage applied to the ion transport optical element with a predetermined step width, the voltage applying means changing the step width according to the mass-to-charge ratio of the ion to be analyzed
- Optimal voltage search means for acquiring ion intensity information for ions derived from a predetermined component each time the applied voltage is changed by the voltage applying means, and obtaining a voltage value that gives the maximum ion intensity based on the ion intensity information.
- It is characterized by having.
- the voltage application unit is configured to perform the step continuously or stepwise so that the step width becomes wider as the mass-to-charge ratio of ions to be analyzed increases. It is preferable that the width is changed.
- the ion transport optical element is not limited to the ion transport optical element generally called an ion guide or an ion lens, but the ionization chamber in a substantially atmospheric pressure atmosphere is the next stage. It also includes a thin tubular body for transporting ions to the vacuum chamber, a skimmer having an ion passage opening across a vacuum chamber in a different vacuum atmosphere, or a collision cell.
- the ion intensity is examined in fine voltage steps in the applied voltage range in which the ion intensity change relative to the unit voltage change amount is relatively large. Thereby, even if the voltage range giving the maximum ion intensity or the ion intensity close to it is narrow, it is possible to accurately grasp the voltage value giving such a large ion intensity without overlooking.
- the ion intensity is examined in rough voltage increments. As a result, even if the voltage range to be searched is wide, the number of search points, that is, the number of measurement points for acquiring the ion intensity can be suppressed without missing a voltage value that gives a large ion intensity.
- the mass spectrometers of the first and second inventions it is not necessary to acquire unnecessary ion intensity information more than necessary in order to search for a voltage value that gives a large ion intensity.
- the time required for adjustment for optimizing the voltage applied to the ion transport optical element can be shortened.
- the accuracy of adjustment can be maintained, and high analysis sensitivity and analysis accuracy can be achieved.
- the schematic block diagram of the principal part of the mass spectrometer by one Example of this invention The figure which shows the measurement result of the relationship between the voltage value of the high frequency voltage in a Q array, and ion intensity. The figure which shows the relationship between the mass charge ratio based on the actual measurement result of FIG. 2, and the voltage value of a high frequency voltage.
- movement in the mass spectrometer of a present Example Explanatory drawing of the voltage automatic adjustment operation
- FIG. 1 is a schematic configuration diagram of a main part of a mass spectrometer according to the present embodiment.
- This mass spectrometer is an atmospheric pressure ionization mass spectrometer that performs mass analysis of various components contained in a liquid sample, and is a high vacuum that is evacuated by an ionization chamber 1 that is a substantially atmospheric pressure atmosphere and a high-performance vacuum pump (not shown). It has a multistage differential exhaust system configuration in which two chambers, a first intermediate vacuum chamber 2 and a second intermediate vacuum chamber 3, are provided between the analysis chamber 4 which is an atmosphere.
- the ionization chamber 1 and the first intermediate vacuum chamber 2 communicate with each other via a thin desolvation tube 7, and the first intermediate vacuum chamber 2 and the second intermediate vacuum chamber 3 are provided at the top of the skimmer 9.
- the small diameter passage hole (orifice) communicates.
- An ESI ionization probe 5 is disposed inside the ionization chamber 1. As shown in FIG. 1, a liquid sample containing a sample component is supplied to the ESI ionization probe 5 and reaches the nozzle 6 at the tip of the probe 5. Then, the liquid sample is sprayed into the ionization chamber 1 while being charged. The sprayed charged droplet collides with the surrounding gas and is refined, and the solvent in the droplet is vaporized. In the process, the sample component is ionized. It should be noted that ionization is naturally possible by using other atmospheric pressure ionization methods such as APCI instead of ESI.
- Ions generated in the ionization chamber 1 and fine droplets in which the solvent has not yet completely evaporated are drawn into the desolvation tube 7 due to the differential pressure, and further finer while passing through the heated desolvation tube 7. The vaporization of the solvent from the droplets proceeds and ionization is promoted.
- a first ion guide 8 called a Q array is provided in the first intermediate vacuum chamber 2 in order to transport ions while converging them under a relatively high gas pressure.
- the Q array has a configuration in which a plurality of four electrode plates arranged so as to surround the optical axis C in a plane orthogonal to the ion optical axis C are arranged in the ion optical axis C direction.
- the ions fed into the first intermediate vacuum chamber 2 through the desolvation tube 7 are converged by the first ion guide 8 and pass through the orifice at the top of the skimmer 9 and enter the second intermediate vacuum chamber 3.
- a second ion guide 10 including eight rod electrodes arranged so as to surround the ion optical axis C is provided in the second intermediate vacuum chamber 3.
- the ions are fed into the analysis chamber 4 through the opening of the entrance lens electrode 11 while being converged by the second ion guide 10.
- the analysis chamber 4 there are a quadrupole mass filter 13 composed of four rod electrodes extending in the direction of the ion optical axis C, and four rod electrodes shorter than the quadrupole mass filter 13 in the preceding stage. And a pre-filter 12 is provided.
- a detection signal from the ion detector 14 is input to the data processing unit 15 and converted into digital data, and then various data processing such as creation of a mass spectrum, a mass chromatogram, and a total ion chromatogram is executed.
- the desolvation tube 7, the first ion guide 8, the skimmer 9, the second ion guide 10, the entrance lens electrode 11, and the prefilter 12 correspond to the ion transport optical element in the present invention.
- a voltage obtained by superimposing a high frequency voltage and a DC voltage or only a DC voltage is applied to each of these elements from the power supply units 20 to 25 under the control of the control unit 30. Note that voltages are also applied to the quadrupole mass filter 13, the ionization probe 5, the ion detector 14, and the like, but the description of the power supply unit that applies these voltages is omitted here.
- the control unit 30 includes an optimum voltage adjustment control unit 31, a voltage step information storage unit 32, an optimum voltage information storage unit 33, and the like as functional blocks. The operation of each part will be described in detail later.
- the functions of the data processing unit 15 and the control unit 30 can be embodied by a personal computer equipped with predetermined control / processing software.
- the ions to be analyzed must be introduced into the quadrupole mass filter 13 with the highest possible efficiency.
- the ion passage efficiency in each of the ion transport optical elements described above must be maximized or close to it.
- the voltage value of the high-frequency voltage applied from the power supply unit 21 to the first ion guide 8 and the direct current is focusing on the first ion guide 8, in order to make the ion passage efficiency as high as possible with the first ion guide 8, the voltage value of the high-frequency voltage applied from the power supply unit 21 to the first ion guide 8 and the direct current.
- the mass spectrometer of this embodiment has a characteristic voltage automatic adjustment (auto-tuning) function. Next, the automatic voltage adjustment operation will be described.
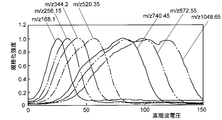
- FIG. 2 shows the relationship between the voltage value of the high-frequency voltage applied to the first ion guide 8 and the ion intensity detected by the ion detector 14 (here, the standardized ion intensity). It is a figure which shows the result measured in z. During this measurement, the voltage value is changed in 1V steps.
- FIG. 3 is a diagram showing the relationship between the mass-to-charge ratio and the optimum voltage value (voltage value giving the maximum ion intensity) obtained based on the actual measurement result of FIG. From the result of FIG. 2, the ionic strength change with respect to the change in the voltage value of the high-frequency voltage shows a substantially peak, but the larger the mass-to-charge ratio, the higher the optimum voltage value and the higher the mass-to-charge ratio. You can see that it is getting wider. Moreover, it can be seen from the results of FIG. 3 that the mass-to-charge ratio and the optimum voltage value are substantially proportional.
- the peak of the high-frequency voltage is in the range of about 10V to 40V (width of about 30V).
- a peak is in the range where the voltage value of the high frequency voltage is about 50V to 150V (width of about 100V). It has spread.
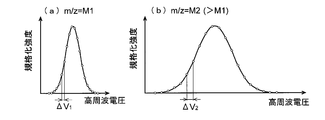
- a peak shape showing a change in ion intensity with respect to a change in voltage value can be approximated by a Gaussian distribution as shown in FIG.
- the optimum voltage step width ⁇ V 1 is 1.5V.
- M2 1048.65 in FIG. 4B where the peak width is relatively wide
- the optimum voltage step width ⁇ V 2 is 5V.
- the optimum voltage step width at an arbitrary mass-to-charge ratio can be obtained by linear interpolation from the optimum voltage step width at the two mass-to-charge ratios. That is, the optimum voltage step width for an arbitrary mass-to-charge ratio can be obtained from the straight line indicated by P in FIG.
- the relational expression representing the straight line P shown in FIG. 5 is stored in the voltage step information storage unit 32 in advance.
- This relational expression can be initially calculated by the apparatus maker based on the actual measurement result. For example, disassembly / reassembly is performed for the purpose of removing dirt on the first ion guide 8 or the ion guide.
- the arrangement of the electrode plates and the like may change slightly, and the relational expression may change.
- a mode for executing measurement and data processing for newly obtaining the above relational expression is prepared, and a new relational expression is obtained when the user instructs execution of the mode. May be.
- a table indicating the correspondence between the mass to charge ratio and the optimum voltage step width may be used.
- the optimum voltage adjustment control unit 31 When performing automatic voltage adjustment for the first ion guide 8, the optimum voltage adjustment control unit 31 first refers to the relational expression as described above stored in the voltage step information storage unit 32 and corresponds to the mass to charge ratio to be adjusted.
- the optimum voltage step width is obtained. For example, in the relational expression shown in FIG. 5, if the mass-to-charge ratio to be adjusted is M1, ⁇ V 1 is obtained as the optimum voltage step width. Therefore, the power supply unit 21 is controlled so that the voltage value of the high-frequency voltage applied to the first ion guide 8 changes stepwise by the optimum voltage step width ⁇ V 1 for a predetermined voltage range.
- the voltage range for scanning the voltage value may be stored in the voltage step information storage unit 32 corresponding to the mass to charge ratio.
- the data processing unit 15 acquires ion intensity data for ions derived from the sample component whose mass-to-charge ratio is M1.
- the optimum voltage adjustment control unit 31 sequentially determines the magnitude relationship of the ion intensity obtained each time the voltage applied to the first ion guide 8 changes, obtains the voltage value that maximizes the ion intensity, and the mass-to-charge ratio M1 Is stored in the optimum voltage information storage unit 33 as an optimum voltage value for.
- a liquid sample containing sample components corresponding to these mass-to-charge ratios may be introduced, and the same measurement and processing as described above may be repeated.
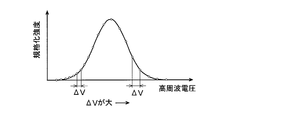
- the voltage step width is wider than when the mass-to-charge ratio is small.
- the change in ion intensity with respect to the voltage change is small as shown in FIG. It is possible to find a voltage value that gives the maximum ionic strength or a state close to it even if the width is wide.
- the voltage step width is widened, so that the number of measurement points for acquiring ion intensity data can be reduced. Therefore, the time required for automatic voltage adjustment can be shortened by reducing the number of measurements.
- the voltage value is changed stepwise by changing the voltage step width according to the target mass-to-charge ratio by the same method, and the optimum voltage value is set. Can be asking.
- the voltage step width is changed according to the target mass-to-charge ratio, and the voltage value of the high-frequency voltage or the voltage value of the DC voltage is gradually increased.
- the optimum voltage value can be obtained by changing.
- the voltage step width does not depend on the mass-to-charge ratio or is negligibly small.
- the optimum voltage step width is obtained from the mass-to-charge ratio according to the relational expression indicated by the straight line P in FIG. 5, but the stepwise relation as indicated by the broken line Q in FIG.
- This may be stored in the voltage step information storage unit 32 (for example, in the form of a table), and the optimum voltage step width may be calculated from the mass to charge ratio accordingly.
- the relationship between the mass-to-charge ratio and the optimum voltage step width is almost linear, linear interpolation is used.
- the relationship between the mass-to-charge ratio and the optimum voltage step width is used. It may be appropriate to approximate the curve.
- the relationship between the mass-to-charge ratio and the voltage step width may be defined not by the primary expression but by a multi-order expression of the second or higher order. It is also clear that a table or the like may be used when it is difficult to define with a formula.
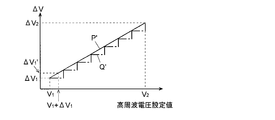
- the relationship between the voltage value of the high-frequency voltage and the optimum voltage step width can be expressed by a linear equation or the like regardless of the mass to charge ratio. Specifically, for example, from the relationship between the optimum voltage value V 1 and the optimum voltage step width ⁇ V 1 at the mass to charge ratio M1, and from the relationship between the optimum voltage value V 2 and the optimum voltage step width ⁇ V 2 at the mass to charge ratio M2.
- the relationship between an arbitrary voltage value and the optimum voltage step width can be obtained by linear interpolation. That is, if a straight line indicated by P ′ in FIG. 6 is obtained, the optimum voltage step width for an arbitrary high-frequency voltage value can be obtained based on this straight line.
- the relational expression of the straight line P ′ shown in FIG. 6 is stored in the voltage step information storage unit 32 in advance. Similar to the above embodiment, this relational expression may be initially determined by the device manufacturer based on the actual measurement result, but a mode for executing measurement and data processing for newly obtaining the above relational expression is prepared. In addition, a new relational expression may be obtained when the user instructs execution of the mode.
- the optimum voltage adjustment control unit 31 refers to the relational expression as described above stored in the voltage step information storage unit 32 and applies it to the first ion guide 8.
- the optimum voltage step width corresponding to the voltage value of the high frequency voltage is obtained.
- the relationship as described above stored in the voltage step information storage unit 32 before the voltage is actually applied. It is preferable to calculate all the voltage values to be applied stepwise within a predetermined voltage range with reference to the equation.
- the voltage value Motomari optimum voltage step width [Delta] V 1 for V 1 is the voltage value V 1 + ⁇ V 1 with an increased voltage by the step width 1 is wide [Delta] V 1 'than found as the optimum voltage step width.
- FIG. 7 is a diagram showing the relationship between the voltage change and the ionic strength during automatic voltage adjustment at a certain mass-to-charge ratio.
- the voltage step width is constant (see FIG. 4), but in this embodiment, When searching for the optimum voltage value for a certain mass-to-charge ratio, the voltage step width is gradually increased.
- the time required for automatic voltage adjustment can be shortened without overlooking the optimum voltage value that gives the maximum ion intensity.
Landscapes
- Chemical & Material Sciences (AREA)
- Analytical Chemistry (AREA)
- Physics & Mathematics (AREA)
- Immunology (AREA)
- Chemical Kinetics & Catalysis (AREA)
- Electrochemistry (AREA)
- Health & Medical Sciences (AREA)
- Life Sciences & Earth Sciences (AREA)
- Biochemistry (AREA)
- General Health & Medical Sciences (AREA)
- General Physics & Mathematics (AREA)
- Pathology (AREA)
- Plasma & Fusion (AREA)
- Engineering & Computer Science (AREA)
- Other Investigation Or Analysis Of Materials By Electrical Means (AREA)
- Electron Tubes For Measurement (AREA)
Abstract
Description
a)前記イオン輸送光学素子への印加電圧の電圧値を所定ステップ幅で段階的に変化させる手段であって、その電圧値に応じて前記ステップ幅を変更する電圧印加手段と、
b)前記電圧印加手段により印加電圧が変化される毎に、所定成分由来のイオンに対するイオン強度情報を取得し、該イオン強度情報に基づいて最大のイオン強度を与える電圧値を求める最適電圧探索手段と、
を備えることを特徴としている。
a)前記イオン輸送光学素子への印加電圧の電圧値を所定ステップ幅で段階的に変化させる手段であって、分析対象であるイオンの質量電荷比に応じて前記ステップ幅を変更する電圧印加手段と、
b)前記電圧印加手段により印加電圧が変化される毎に、所定成分由来のイオンに対するイオン強度情報を取得し、該イオン強度情報に基づいて最大のイオン強度を与える電圧値を求める最適電圧探索手段と、
を備えることを特徴としている。
なお、第1イオンガイド8に印加する電圧値を変化させる毎にイオン強度を検出し、イオン強度が最大となる電圧値を見出し、求まった電圧値を最適電圧値として最適電圧情報記憶部33に保存することは上記実施例と同じである。
2…第1中間真空室
3…第2中間真空室
4…分析室
5…ESIイオン化プローブ
6…ノズル
7…脱溶媒管
8…第1イオンガイド
9…スキマー
10…第2イオンガイド
11…入口レンズ電極
12…プレフィルタ
13…四重極マスフィルタ
14…イオン検出器
15…データ処理部
20~25…電源部
30…制御部
31…最適電圧調整制御部
32…電圧ステップ情報記憶部
33…最適電圧情報記憶部
C…イオン光軸
Claims (4)
- イオン源と検出器との間にイオン輸送光学素子を具備し、試料中の所定成分を質量分析した結果に基づいて前記イオン輸送光学素子に印加する電圧を最適化する調整機能を有する質量分析装置において、
a)前記イオン輸送光学素子への印加電圧の電圧値を所定ステップ幅で段階的に変化させる手段であって、その電圧値に応じて前記ステップ幅を変更する電圧印加手段と、
b)前記電圧印加手段により印加電圧が変化される毎に、所定成分由来のイオンに対するイオン強度情報を取得し、該イオン強度情報に基づいて最大のイオン強度を与える電圧値を求める最適電圧探索手段と、
を備えることを特徴とする質量分析装置。 - 請求項1に記載の質量分析装置であって、
前記電圧印加手段は、印加電圧の絶対値における電圧値が大きくなるに従いステップ幅が広くなるように連続的又は段階的に該ステップ幅を変更することを特徴とする質量分析装置。 - イオン源と検出器との間にイオン輸送光学素子を具備し、試料中の所定成分を質量分析した結果に基づいて前記イオン輸送光学素子に印加する電圧を最適化する調整機能を有する質量分析装置において、
a)前記イオン輸送光学素子への印加電圧の電圧値を所定ステップ幅で段階的に変化させる手段であって、分析対象であるイオンの質量電荷比に応じて前記ステップ幅を変更する電圧印加手段と、
b)前記電圧印加手段により印加電圧が変化される毎に、所定成分由来のイオンに対するイオン強度情報を取得し、該イオン強度情報に基づいて最大のイオン強度を与える電圧値を求める最適電圧探索手段と、
を備えることを特徴とする質量分析装置。 - 請求項3に記載の質量分析装置であって、
前記電圧印加手段は、分析対象であるイオンの質量電荷比が大きくなるに従いステップ幅が広くなるように連続的又は段階的に該ステップ幅を変更することを特徴とする質量分析装置。
Priority Applications (5)
| Application Number | Priority Date | Filing Date | Title |
|---|---|---|---|
| EP12872192.5A EP2821782B1 (en) | 2012-03-22 | 2012-03-22 | Mass spectrometer |
| CN201280071666.5A CN104204791B (zh) | 2012-03-22 | 2012-03-22 | 质量分析装置 |
| JP2014505888A JP5780355B2 (ja) | 2012-03-22 | 2012-03-22 | 質量分析装置 |
| PCT/JP2012/057272 WO2013140558A1 (ja) | 2012-03-22 | 2012-03-22 | 質量分析装置 |
| US14/386,453 US9218948B2 (en) | 2012-03-22 | 2012-03-22 | Mass spectrometer |
Applications Claiming Priority (1)
| Application Number | Priority Date | Filing Date | Title |
|---|---|---|---|
| PCT/JP2012/057272 WO2013140558A1 (ja) | 2012-03-22 | 2012-03-22 | 質量分析装置 |
Publications (1)
| Publication Number | Publication Date |
|---|---|
| WO2013140558A1 true WO2013140558A1 (ja) | 2013-09-26 |
Family
ID=49222052
Family Applications (1)
| Application Number | Title | Priority Date | Filing Date |
|---|---|---|---|
| PCT/JP2012/057272 WO2013140558A1 (ja) | 2012-03-22 | 2012-03-22 | 質量分析装置 |
Country Status (5)
| Country | Link |
|---|---|
| US (1) | US9218948B2 (ja) |
| EP (1) | EP2821782B1 (ja) |
| JP (1) | JP5780355B2 (ja) |
| CN (1) | CN104204791B (ja) |
| WO (1) | WO2013140558A1 (ja) |
Cited By (3)
| Publication number | Priority date | Publication date | Assignee | Title |
|---|---|---|---|---|
| WO2018154932A1 (ja) * | 2017-02-21 | 2018-08-30 | 株式会社島津製作所 | 液体クロマトグラフ質量分析装置 |
| JP2018156879A (ja) * | 2017-03-21 | 2018-10-04 | 株式会社島津製作所 | タンデム四重極型質量分析装置および該装置の制御パラメータ最適化方法 |
| WO2020054013A1 (ja) * | 2018-09-13 | 2020-03-19 | 株式会社島津製作所 | 質量分析装置 |
Families Citing this family (2)
| Publication number | Priority date | Publication date | Assignee | Title |
|---|---|---|---|---|
| JP6292319B2 (ja) * | 2014-12-24 | 2018-03-14 | 株式会社島津製作所 | 飛行時間型質量分析装置 |
| CN109477815A (zh) * | 2016-07-11 | 2019-03-15 | 株式会社岛津制作所 | 分析装置 |
Citations (3)
| Publication number | Priority date | Publication date | Assignee | Title |
|---|---|---|---|---|
| JPS5727553A (en) * | 1980-07-25 | 1982-02-13 | Jeol Ltd | Adjusting method for ion source of mass-spectrometer |
| JP2000314724A (ja) * | 1999-05-06 | 2000-11-14 | Shimadzu Corp | 液体クロマトグラフ質量分析装置 |
| JP2009192388A (ja) | 2008-02-15 | 2009-08-27 | Shimadzu Corp | 質量分析装置 |
Family Cites Families (13)
| Publication number | Priority date | Publication date | Assignee | Title |
|---|---|---|---|---|
| GB8625529D0 (en) * | 1986-10-24 | 1986-11-26 | Griffiths I W | Control/analysis of charged particles |
| DE4316738C2 (de) * | 1993-05-19 | 1996-10-17 | Bruker Franzen Analytik Gmbh | Auswurf von Ionen aus Ionenfallen durch kombinierte elektrische Dipol- und Quadrupolfelder |
| US5463219A (en) * | 1994-12-07 | 1995-10-31 | Mds Health Group Limited | Mass spectrometer system and method using simultaneous mode detector and signal region flags |
| US6621077B1 (en) * | 1998-08-05 | 2003-09-16 | National Research Council Canada | Apparatus and method for atmospheric pressure-3-dimensional ion trapping |
| US7019289B2 (en) * | 2003-01-31 | 2006-03-28 | Yang Wang | Ion trap mass spectrometry |
| US7157698B2 (en) * | 2003-03-19 | 2007-01-02 | Thermo Finnigan, Llc | Obtaining tandem mass spectrometry data for multiple parent ions in an ion population |
| WO2005043115A2 (en) * | 2003-10-20 | 2005-05-12 | Ionwerks, Inc. | Ion mobility tof/maldi/ms using drift cell alternating high and low electrical field regions |
| WO2008005283A2 (en) * | 2006-06-29 | 2008-01-10 | Sionex Corporation | Tandem differential mobility spectrometers and mass spectrometer for enhanced analysis |
| JP4369454B2 (ja) * | 2006-09-04 | 2009-11-18 | 株式会社日立ハイテクノロジーズ | イオントラップ質量分析方法 |
| US8338779B2 (en) * | 2008-02-27 | 2012-12-25 | Thermo Finnigan Llc | Optimization of excitation voltage amplitude for collision induced dissociation of ions in an ion trap |
| US8754368B2 (en) * | 2008-06-20 | 2014-06-17 | Shimadzu Corporation | Mass spectrometer |
| US20120119083A1 (en) * | 2009-03-30 | 2012-05-17 | Shimadzu Corporation | Ion Trap Device |
| WO2011091023A1 (en) * | 2010-01-20 | 2011-07-28 | Waters Technologies Corporation | Techniques for efficient fragmentation of peptides |
-
2012
- 2012-03-22 JP JP2014505888A patent/JP5780355B2/ja not_active Expired - Fee Related
- 2012-03-22 CN CN201280071666.5A patent/CN104204791B/zh not_active Expired - Fee Related
- 2012-03-22 US US14/386,453 patent/US9218948B2/en active Active
- 2012-03-22 EP EP12872192.5A patent/EP2821782B1/en not_active Not-in-force
- 2012-03-22 WO PCT/JP2012/057272 patent/WO2013140558A1/ja active Application Filing
Patent Citations (3)
| Publication number | Priority date | Publication date | Assignee | Title |
|---|---|---|---|---|
| JPS5727553A (en) * | 1980-07-25 | 1982-02-13 | Jeol Ltd | Adjusting method for ion source of mass-spectrometer |
| JP2000314724A (ja) * | 1999-05-06 | 2000-11-14 | Shimadzu Corp | 液体クロマトグラフ質量分析装置 |
| JP2009192388A (ja) | 2008-02-15 | 2009-08-27 | Shimadzu Corp | 質量分析装置 |
Non-Patent Citations (2)
| Title |
|---|
| GUZOWSKI J P. ET AL.: "Characteristics of a rf-only hexapole ion-guide interface for plasma-source time-of-flight mass spectrometry", JOURNAL OF ANALYTICAL ATOMIC SPECTROMETRY, vol. 16, no. 8, August 2001 (2001-08-01), pages 781 - 792, XP055146860 * |
| See also references of EP2821782A4 |
Cited By (4)
| Publication number | Priority date | Publication date | Assignee | Title |
|---|---|---|---|---|
| WO2018154932A1 (ja) * | 2017-02-21 | 2018-08-30 | 株式会社島津製作所 | 液体クロマトグラフ質量分析装置 |
| JPWO2018154932A1 (ja) * | 2017-02-21 | 2019-06-27 | 株式会社島津製作所 | 液体クロマトグラフ質量分析装置 |
| JP2018156879A (ja) * | 2017-03-21 | 2018-10-04 | 株式会社島津製作所 | タンデム四重極型質量分析装置および該装置の制御パラメータ最適化方法 |
| WO2020054013A1 (ja) * | 2018-09-13 | 2020-03-19 | 株式会社島津製作所 | 質量分析装置 |
Also Published As
| Publication number | Publication date |
|---|---|
| EP2821782A4 (en) | 2015-05-13 |
| US20150108348A1 (en) | 2015-04-23 |
| JPWO2013140558A1 (ja) | 2015-08-03 |
| EP2821782B1 (en) | 2018-10-31 |
| CN104204791A (zh) | 2014-12-10 |
| JP5780355B2 (ja) | 2015-09-16 |
| EP2821782A1 (en) | 2015-01-07 |
| US9218948B2 (en) | 2015-12-22 |
| CN104204791B (zh) | 2016-06-15 |
Similar Documents
| Publication | Publication Date | Title |
|---|---|---|
| US8927927B2 (en) | Mass spectrometer | |
| US8822915B2 (en) | Atmospheric pressure ionization mass spectrometer | |
| JP5780355B2 (ja) | 質量分析装置 | |
| EP2587521A1 (en) | Atmospheric-pressure ionization mass-spectrograph apparatus | |
| WO2012124020A1 (ja) | 質量分析装置 | |
| JP6202103B2 (ja) | 質量分析装置及び質量分析方法 | |
| US8368010B2 (en) | Quadrupole mass spectrometer | |
| US9548193B2 (en) | Quadrupole mass spectrometer with quadrupole mass filter as a mass separator | |
| WO2015118681A1 (ja) | 質量分析装置及び質量分析方法 | |
| JP2018511917A (ja) | 質量分析計のロバスト性を向上させるためのrf/dcフィルタ | |
| US8410436B2 (en) | Quadrupole mass spectrometer | |
| US10705048B2 (en) | Mass spectrometer | |
| US8207495B2 (en) | Quadrupole mass spectrometer | |
| JP4848657B2 (ja) | Ms/ms型質量分析装置 | |
| JP2010020916A (ja) | Ms/ms型質量分析装置 | |
| JP2007323838A (ja) | 四重極型質量分析装置 | |
| WO2018011861A1 (ja) | 分析装置 | |
| JP2012234632A (ja) | 質量分析装置 | |
| CN112103169B (zh) | 一种针对离子阱的调整方法和离子阱 | |
| US11367609B2 (en) | Mass spectrometer | |
| WO2021210165A1 (ja) | イオン分析装置 | |
| EP2315233B1 (en) | Quadrupole mass spectrometer | |
| CN117153657A (zh) | 飞行时间型质量分析装置及其调整方法 | |
| JP2020027038A (ja) | 誘導結合プラズマ質量分析方法 |
Legal Events
| Date | Code | Title | Description |
|---|---|---|---|
| 121 | Ep: the epo has been informed by wipo that ep was designated in this application |
Ref document number: 12872192 Country of ref document: EP Kind code of ref document: A1 |
|
| ENP | Entry into the national phase |
Ref document number: 2014505888 Country of ref document: JP Kind code of ref document: A |
|
| WWE | Wipo information: entry into national phase |
Ref document number: 2012872192 Country of ref document: EP |
|
| WWE | Wipo information: entry into national phase |
Ref document number: 14386453 Country of ref document: US |
|
| NENP | Non-entry into the national phase |
Ref country code: DE |