WO2012165558A1 - 制御装置および提示方法 - Google Patents
制御装置および提示方法 Download PDFInfo
- Publication number
- WO2012165558A1 WO2012165558A1 PCT/JP2012/064105 JP2012064105W WO2012165558A1 WO 2012165558 A1 WO2012165558 A1 WO 2012165558A1 JP 2012064105 W JP2012064105 W JP 2012064105W WO 2012165558 A1 WO2012165558 A1 WO 2012165558A1
- Authority
- WO
- WIPO (PCT)
- Prior art keywords
- detection
- detection device
- unit
- presentation
- area
- Prior art date
- Legal status (The legal status is an assumption and is not a legal conclusion. Google has not performed a legal analysis and makes no representation as to the accuracy of the status listed.)
- Ceased
Links
Images



















Classifications
-
- G—PHYSICS
- G01—MEASURING; TESTING
- G01N—INVESTIGATING OR ANALYSING MATERIALS BY DETERMINING THEIR CHEMICAL OR PHYSICAL PROPERTIES
- G01N33/00—Investigating or analysing materials by specific methods not covered by groups G01N1/00 - G01N31/00
- G01N33/0004—Gaseous mixtures, e.g. polluted air
- G01N33/0009—General constructional details of gas analysers, e.g. portable test equipment
- G01N33/0027—General constructional details of gas analysers, e.g. portable test equipment concerning the detector
- G01N33/0031—General constructional details of gas analysers, e.g. portable test equipment concerning the detector comprising two or more sensors, e.g. a sensor array
- G01N33/0032—General constructional details of gas analysers, e.g. portable test equipment concerning the detector comprising two or more sensors, e.g. a sensor array using two or more different physical functioning modes
-
- F—MECHANICAL ENGINEERING; LIGHTING; HEATING; WEAPONS; BLASTING
- F24—HEATING; RANGES; VENTILATING
- F24F—AIR-CONDITIONING; AIR-HUMIDIFICATION; VENTILATION; USE OF AIR CURRENTS FOR SCREENING
- F24F11/00—Control or safety arrangements
- F24F11/50—Control or safety arrangements characterised by user interfaces or communication
- F24F11/52—Indication arrangements, e.g. displays
-
- F—MECHANICAL ENGINEERING; LIGHTING; HEATING; WEAPONS; BLASTING
- F24—HEATING; RANGES; VENTILATING
- F24F—AIR-CONDITIONING; AIR-HUMIDIFICATION; VENTILATION; USE OF AIR CURRENTS FOR SCREENING
- F24F2110/00—Control inputs relating to air properties
- F24F2110/50—Air quality properties
- F24F2110/65—Concentration of specific substances or contaminants
- F24F2110/66—Volatile organic compounds [VOC]
-
- G—PHYSICS
- G01—MEASURING; TESTING
- G01D—MEASURING NOT SPECIALLY ADAPTED FOR A SPECIFIC VARIABLE; ARRANGEMENTS FOR MEASURING TWO OR MORE VARIABLES NOT COVERED IN A SINGLE OTHER SUBCLASS; TARIFF METERING APPARATUS; MEASURING OR TESTING NOT OTHERWISE PROVIDED FOR
- G01D7/00—Indicating measured values
- G01D7/02—Indicating value of two or more variables simultaneously
-
- G—PHYSICS
- G01—MEASURING; TESTING
- G01N—INVESTIGATING OR ANALYSING MATERIALS BY DETERMINING THEIR CHEMICAL OR PHYSICAL PROPERTIES
- G01N33/00—Investigating or analysing materials by specific methods not covered by groups G01N1/00 - G01N31/00
- G01N33/0004—Gaseous mixtures, e.g. polluted air
- G01N33/0009—General constructional details of gas analysers, e.g. portable test equipment
- G01N33/0027—General constructional details of gas analysers, e.g. portable test equipment concerning the detector
- G01N33/0036—General constructional details of gas analysers, e.g. portable test equipment concerning the detector specially adapted to detect a particular component
- G01N33/004—CO or CO2
-
- Y—GENERAL TAGGING OF NEW TECHNOLOGICAL DEVELOPMENTS; GENERAL TAGGING OF CROSS-SECTIONAL TECHNOLOGIES SPANNING OVER SEVERAL SECTIONS OF THE IPC; TECHNICAL SUBJECTS COVERED BY FORMER USPC CROSS-REFERENCE ART COLLECTIONS [XRACs] AND DIGESTS
- Y02—TECHNOLOGIES OR APPLICATIONS FOR MITIGATION OR ADAPTATION AGAINST CLIMATE CHANGE
- Y02B—CLIMATE CHANGE MITIGATION TECHNOLOGIES RELATED TO BUILDINGS, e.g. HOUSING, HOUSE APPLIANCES OR RELATED END-USER APPLICATIONS
- Y02B30/00—Energy efficient heating, ventilation or air conditioning [HVAC]
- Y02B30/70—Efficient control or regulation technologies, e.g. for control of refrigerant flow, motor or heating
Definitions
- the present invention relates to a control device and a presentation method, and more particularly to a control device that controls the presentation of detection results in a detection device and a presentation method thereof.
- Patent Document 1 Japanese Patent Laid-Open No. 5-142173 (hereinafter referred to as Patent Document 1) performs a detection operation with a contamination sensor for detecting dust, carbon dioxide concentration, etc.
- An apparatus is disclosed that automatically analyzes the indoor contamination status by determining the result using a reference value, that is, performing correction processing using temperature and humidity.
- Patent Document 2 JP-T-2009-529684 (hereinafter referred to as Patent Document 2) considers the mutual relationship between a plurality of environmental parameters, determines the air quality level based on a table, and displays a message corresponding to the level. The technology is disclosed.
- Patent Document 2 for example, if the dust level is high and the environment is warm and humid, it is predicted that there are many bacteria in the air. For example, volatilization occurs at a temperature of 25 to 35 ° C.
- a combination of a plurality of environmental parameter conditions such as a level of the organic compound higher than 600 ⁇ g / m 3 is stored in advance, and based on these, “potential problem: high-level formaldehyde, corresponding to the problem” Present the appropriate message to the user for the environmental conditions such as “Recommendation: Open the window”.
- Patent Document 1 since the technique disclosed in Patent Document 1 is not a technique for detecting the amount of bacteria in the air, there is a problem that the state of the degree of air contamination may not be determined correctly.
- Patent Document 2 it can be predicted that there are many bacteria in the air because a plurality of environmental parameters are used in combination.
- the amount of bacteria is not actually detected and is a prediction based on the correlation between a plurality of environmental parameters, the state of the degree of air pollution may still not be determined correctly. There's a problem.
- Patent Document 2 has a problem that the state of air pollution cannot be determined comprehensively in consideration of the state of the area to be detected.
- the present invention has been made in view of such problems, and an object of the present invention is to provide a control device and a presentation method capable of appropriately presenting an air state.
- the control device is connected to a detection device including a sensor for detecting an air state, and control for presenting a detection result of the detection device.
- a first acquisition unit for acquiring information including a detection result from the detection device, a second acquisition unit for acquiring information specifying the position of the detection device, and a first acquisition unit
- a presentation unit for presenting the information acquired in step (b) based on the position of the detection device acquired by the second acquisition unit.
- control device further includes a third acquisition unit for acquiring identification information for specifying the area where the detection device is located, and the presentation unit presents the detection result in association with the area.
- a 1st acquisition part acquires the detection result in a different position from a detection apparatus
- a presentation part is a detection result of the air state of the said area for every area where each detection apparatus is located. Generate data for presentation.
- the presentation unit presents the information acquired by the first acquisition unit by displaying the air states of different areas on one screen.
- the presenting unit presents the information acquired by the first acquiring unit by displaying in the area for each area, and the control device stores the correspondence relationship between the detection result and the display mode of the area.
- the presentation unit further executes processing for determining the display mode of the display area of the area where the detection device is located based on the detection result.
- the presenting unit displays a first screen that displays a detection result of an air state in a region including a plurality of areas on a display screen, and a second screen that displays the detection result of the air state for each area.
- a first screen that displays a detection result of an air state in a region including a plurality of areas on a display screen
- a second screen that displays the detection result of the air state for each area.
- a 1st acquisition part acquires the detection result in the different position in the same area from a detection apparatus, and a presentation part detects each position of a different position in an area as a detection result of the air state of an area. Present the detection results.
- the control device has a correspondence relationship between the fourth acquisition unit for acquiring information specifying the user's position, and the display content representing the air state and the distance between the user's position and the detection device's position.
- a second storage unit for storing the information, a presentation unit calculating a distance between the position of the user and the position of the detection device, and a process of specifying the presentation content based on the distance Is executed further.
- the presentation unit presents the detection result from the detection device, the presentation representing the distance between the user position and the detection device position, and the presentation representing the detection result from the detection device according to the distance. And do.
- the detection device further detects the wind direction and the wind force
- the presentation unit further executes a process of calculating a horizontal component in a direction between the wind detection device and the user, and the presentation unit is detected on the display screen.
- a horizontal component is displayed together in the direction of the detection device and the user of the wind power.
- control device is further connected to a plurality of presentation devices, and further includes a fifth acquisition unit for acquiring information specifying the positions of the plurality of presentation devices, and the presentation unit is selected from the plurality of presentation devices. Further, a process of specifying the presentation device closest to the user's position and a process of transmitting the presentation data to the presentation device closest to the user's position and performing the presentation are further executed.
- the presentation method is a method for presenting a detection result in a detection device including a sensor for detecting an air state to a display device, and obtains information including the detection result from the detection device.
- the presentation method further includes a step of acquiring identification information for specifying the area where the detection device is located, and the presenting step presents the detection result in association with the area.
- the presenting method further includes a step of acquiring information for specifying the position of the user, and the presenting step stores in advance a step of calculating a distance between the position of the user and the position of the detection device. And specifying the content of presentation based on the distance between the user's position and the position of the detection device and the display content representing the air state according to the correspondence relationship.
- the control device detects the presence or absence of a person in the detection target space, the first detection device including a sensor for detecting the state of air in the detection target space.
- a first acquisition unit for acquiring information including detection results from the first detection device and the second detection device, and a control device connected to a second detection device including the second sensor;
- a second acquisition unit for acquiring information specifying the positions of the first detection device and the second detection device, a detection result obtained by the first detection unit obtained by the first acquisition unit, and a second And a control unit for presenting the detection result of the detection device according to the position of each detection device obtained by the second acquisition unit.
- the control unit includes the first detection device and the second detection device. The area where the device is located is specified, and the first detection device and the second Presenting the detection result of the detection device.
- control device further includes a second storage unit for storing a correspondence relationship between the detection result of the first detection device and the presentation mode, and the control unit is configured to display the detection result of the first detection device. Processing for determining the presentation mode is further executed.
- a control part produces
- control device further includes a third acquisition unit for acquiring information specifying the position of the presentation device, and the control unit is configured to determine that there is a person within a predetermined range from the position of the presentation device.
- the presentation data is transmitted to the presentation device for presentation.
- the detection result from the second detection device includes the number of persons in the detection target space, and the control unit detects whether there is a person for each area and the detection result from the second detection device. The detected number of people is displayed.
- control unit determines that there is a person within a predetermined range from the position of the presentation device and determines that the distance from the presentation device to the person is equal to or greater than the predetermined distance.
- a control signal for performing a notification operation is output.
- control unit determines that there is a person within a predetermined range from the position of the presentation device and determines that the presentation device is not in a mode for immediately accepting an operation input
- a control signal for performing a notification operation is output together with the data.
- control unit presents the detection result by displaying the air states of different areas on one screen.
- the presenting method detects a first detection device including a sensor for detecting a state of air in the detection target space and the presence or absence of a person in the detection target space.
- a method of presenting a detection result with a second detection device including a sensor of the first method the step of obtaining information including the detection result from the first detection device and the second detection device, and a first detection Obtaining information for specifying the positions of the device and the second detection device, and presenting the detection result of the first detection device and the detection result of the second detection device according to the position of each detection device.
- the step of presenting includes the step of specifying the area where the first detection device and the second detection device are located, and presenting the detection results of the first detection device and the second detection device for each area Steps to do Including.
- the control device is a control device connected to an adjustment device including an adjustment mechanism for adjusting the state of air in the target space, and the state of air in the detection target space is determined.
- First information for acquiring information including detection result input from a first detection device including a sensor for detection and a second detection device including a sensor for detecting the presence or absence of a person in the detection target space.
- 1 acquisition part and the control part for controlling an adjustment apparatus based on the information acquired by the 1st acquisition part.
- the control device stores a second acquisition unit for acquiring information for specifying the positions of the first detection device and the second detection device, and information for specifying an area serving as a control unit. And a storage unit, and the control unit controls the adjustment device based on a combination of a detection result from the first detection device and a detection result from the second detection device located in the same area.
- control device further includes a third acquisition unit for acquiring information for specifying the position of the adjustment device, and each of the control units from the first detection device located in the same area as the adjustment device.
- the adjustment device is controlled based on the combination of the detection result and the detection result from the second detection device.
- the first detection device is a detection device for detecting microorganisms in the air
- the adjustment device is an air cleaner
- the control unit is configured to detect the amount of microorganisms detected by the first detection device. Is greater than the threshold value and the second detection device detects that there is a person, the detection results of the first detection device, the detection results of the second detection device, which are stored in advance, And according to the correspondence of the drive of the adjustment device, the drive of the adjustment device is turned on, otherwise the drive of the adjustment device is turned off.
- the first detection device is a detection device for detecting microorganisms in the air
- the adjustment device is an air cleaner
- the control unit is configured to detect the amount of microorganisms detected by the first detection device. Is greater than the threshold value and the second detection device detects that there is a person, the detection results of the first detection device, the detection results of the second detection device, which are stored in advance,
- the driving amount of the adjusting device is set to an amount larger than the prescribed amount in accordance with the correspondence relationship of the driving of the adjusting device, and otherwise the driving amount of the adjusting device is set to an amount smaller than the prescribed amount.
- the control method is a control method for controlling an adjustment device including an adjustment mechanism for adjusting the state of air in the target space, and detects the state of air in the detection target space.
- Acquiring information including detection result input from a first detection device including a sensor for detecting and a second detection device including a sensor for detecting the presence or absence of a person in the detection target space; Controlling the adjusting device based on the information obtained.
- control device includes input information including a detection result from the first detection device including a sensor for detecting a state of air in the detection target space, and the detection target space.
- control device further includes a first communication unit for communicating with the first detection device and a second communication unit for communicating with the second detection device.
- control device stores a first acquisition unit for acquiring information for specifying the positions of the first detection device and the second detection device, and information for specifying an area serving as a control unit.
- a control unit for determining the content of the presentation based on a combination of the detection result from the first detection device and the detection result from the second detection device located in the same area. Includes a decision part.
- the determination unit stores the detection result of the first detection device, the presence / absence of a person as the detection result of the second detection device, and the position of the person detected by the second detection device, which are stored in advance.
- the content of the presentation is determined based on the correspondence between the combination of the distance between the position where the first detection device is installed and the content of the presentation, and the control unit is configured to detect the person detected by the second detection device.
- a process of calculating a distance between the position and the position where the first detection device is installed is further executed.
- the first detection device includes a plurality of sensors as sensors for detecting the state of air in the detection target space, and the detection result of the first detection device includes a plurality of sensors.
- a detection result is included, and the determination unit stores in advance a combination of a detection result of each of the plurality of sensors that is a detection result of the first detection device and a combination of the detection result of the second detection device.
- the content of the presentation is determined based on the correspondence with the content of the presentation.
- control unit executes information presentation for an area where the second detection device detects that a person is present.
- control device further includes a second acquisition unit for acquiring information specifying a position of the presentation device that presents the information, and the control unit is within a predetermined range from the person detected by the second detection device.
- the information is presented to the presentation device inside.
- the presenting method detects a first detection device including a sensor for detecting a state of air in the detection target space and the presence or absence of a person in the detection target space.
- the detection result from the first detection device and the second detection device A step of determining the content of the presentation based on the combination with the detection result, and a step of executing a process for causing the determined content to be presented.
- the air condition can be appropriately presented.
- FIG. 1 It is a figure which shows the specific example of a structure of the 1st example of a microbe sensor. It is a block diagram which shows the specific example of a function structure of the microorganisms sensor concerning a 1st example. It is a time chart which shows the flow of control in the measurement control part of an environment detection apparatus. It is a figure showing the specific example of the relationship between the variation
- FIG. 10 is a flowchart showing a flow of second display processing in the processing apparatus 300. It is a figure which shows the other example of the display with the processing apparatus concerning 2nd Embodiment. It is a figure which shows the specific example of the corresponding relationship required for the display of FIG. 32A. It is a figure which shows the other example of the display with the processing apparatus concerning 2nd Embodiment.
- FIG. 33A It is a figure which shows the specific example of the correspondence required for the display of FIG. 33A. It is a figure which shows the other example of the display with the processing apparatus concerning 2nd Embodiment. It is a figure which shows the specific example of the corresponding relationship required for the display of FIG. 34A. It is a figure which shows the other example of the display with the processing apparatus concerning 2nd Embodiment. It is a block diagram which shows the specific example of a function structure of the processing apparatus concerning 3rd Embodiment. It is a figure which shows the specific example of the corresponding
- FIG. 1 is a diagram showing a specific example of the configuration of an environment detection system (hereinafter abbreviated as system) 1 according to the present embodiment.
- system 1 includes a plurality of environment detection devices 100A, 100B,... For acquiring environment information connected by wired or wireless network 600, and attribute detection for detecting environment attributes.
- the apparatus 200, the processing apparatus 300 provided with the display part, the adjustment apparatus 400 for adjusting an environment, and the display terminal 500 which has the display part 550 are included.
- the plurality of environment detection devices 100A, 100B,... Are representatively referred to as the environment detection device 100.
- the display terminal 500 may include a plurality of display terminals 500A, 500B,. In this case, the plurality of display terminals 500A, 500B,.
- the environment detection device 100 includes a plurality of sensors for acquiring environment information.
- Environmental information refers to information indicating the amount of parameters that determine the air condition in the space to be measured. For example, the amount of microorganisms in the air in the space to be measured, the amount of dust, humidity, temperature, and gas that causes odors Amount, etc. Therefore, as will be described later, the environment detection device 100 includes a microorganism sensor, a dust sensor, a humidity sensor, a temperature sensor, a gas sensor causing odor, and the like.
- the plurality of environment detection devices 100A, 100B,... are installed at various different positions. For example, in the case of a space having a plurality of rooms, it may be installed for each room, or in the case of a space having a plurality of floors, it may be installed for each floor.
- the environmental attribute indicates a parameter that affects the state of air in the space to be measured.
- the attribute detection device 200 includes a human sensor, a wind direction sensor, a wind sensor, and the like, which are an infrared sensor, an ultrasonic sensor, a visible light sensor, a pressure sensor, a temperature sensor, and the like.
- the environment attribute includes the position of the environment detection apparatus 100 in the target space.
- the environment detection apparatus 100 and the attribute detection apparatus 200 each have a communication function for performing wireless communication between them.
- This wireless communication corresponds to communication using radio waves such as Bluetooth (registered trademark) or WiFi (registered trademark), infrared communication, or the like.
- the attribute detection device 200 multicasts a response request within a predetermined communication range, and the environment detection device 100 within the communication range receives the response request and responds to it with identification information identifying itself. .
- the method of specifying the position of the environment detection device 100 using communication in the attribute detection device 200 is not limited to this method. Other methods may be adopted as long as the environment detection device 100 within the predetermined range is specified on the attribute detection device 200 side by establishing communication between these devices.
- the attribute detection device 200 detects the presence / absence / position of a person within the detection target range, the wind direction / volume, and the position of the environment detection device 100 as environmental attributes, and the processing device 300 as environmental attributes. Shall be sent.
- the processing device 300 identifies and stores the position where the attribute detection device 200 is installed by communicating with the attribute detection device 200 via the network 600.
- the position of the attribute detection device 200 is specified by using a service that provides position information using communication radio waves, such as GPS (Global Positioning System) or PlaceEngine (registered trademark), or image processing is performed.
- the position may be specified by specifying the identification image of the attribute detection device 200.
- the installation position may be registered in the processing apparatus 300 in advance. Note that the above-described position specifying method in the processing apparatus 300 is the same when specifying the position of another apparatus.
- the processing device 300 may be configured by any device as long as it includes at least a communication function, a display unit, and a computing device. As an example, it may be composed of a general personal computer.
- the processing device 300 receives a sensor signal from the environment detection device 100 via the network 600, and performs processing for displaying it on a display unit described later.
- the adjustment device 400 is a device for adjusting the amount of parameters that determine the air state of the target space, and corresponds to, for example, a humidifier / dehumidifier or an ion generator.
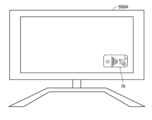
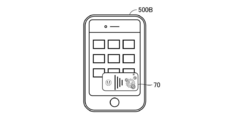
- the display terminal 500 may be any device as long as it has at least a display function and a communication function, and includes a mobile phone, an electronic book browsing terminal, a personal computer (PC), a television receiver, and the like.
- the processing device 300 communicates with each other via the display terminal 500 and the network 600 to identify and store the positions where they are installed.
- the installation position is a device that is fixed in principle, such as a television receiver
- the installation position may be registered in the processing device 300 in advance.
- the processing device 300 may store a correspondence relationship between the display terminal 500 and the user.
- the network 600 may be a network using communication using a dedicated line such as a local area network (LAN) or a wireless LAN, a network using communication using a public line such as the Internet, or wireless communication. For example, direct communication may be used.
- a dedicated line such as a local area network (LAN) or a wireless LAN
- a network using communication using a public line such as the Internet
- wireless communication For example, direct communication may be used.
- FIG. 2 is a block diagram illustrating a specific example of the configuration of the environment detection apparatus 100.
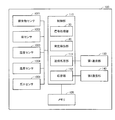
- an environment detection apparatus 100 includes a microorganism sensor 1001, a dust sensor 1002, a humidity sensor 1003, a temperature sensor 1004, and a gas sensor 1005 as sensors for acquiring environment information, and a CPU (Central Processing Unit) (not shown). ), A control unit 110 for controlling the entire apparatus, a program executed by the CPU, a memory 120 for storing a sensor signal from the sensor, its own identification information, and the like, and others via the network 600 A first communication unit 130 for communicating with the first device, and a second communication unit 140 for wirelessly communicating with the attribute detection device 200. The detailed configuration of each sensor will be described later.
- control unit 110 of environment detection device 100 calculates signal processing unit 30 that is a function for processing signals from each sensor, and calculates a parameter amount to be detected based on the signals.
- the measurement detection unit 40 which is a function for executing the process, and the calculated parameter amount that is the detection result are processed as environment information together with its own identification information, name information, network address, and other attribute information.
- a transmission processing unit 111 that is a function for transmitting to the device 300 and a response for transmitting the identification information stored in advance in response to a request from the attribute detecting device 200 to the attribute detecting device 200 Part 112. These are functions mainly formed by the CPU by the CPU included in the control unit 110 reading and executing a program stored in the memory 120, but at least a part thereof is configured by hardware such as an electric circuit. May be.
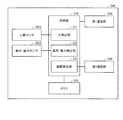
- FIG. 3 is a block diagram illustrating a specific example of the configuration of the attribute detection apparatus 200.
- the attribute detection device 200 is an infrared sensor, an ultrasonic sensor, a pressure sensor, or the like, and detects a human sensor 2001 for detecting the presence / absence of a person in a detection target region, and a wind direction and wind force.
- a first communication unit 230 for communicating with other devices via the network 600 and a second communication unit 240 for wirelessly communicating with the environment detection device 100 are included.
- the control unit 210 of the attribute detection apparatus 200 includes a person detection unit 211 that is a function for detecting the presence and position of a person based on a sensor signal from the human sensor 2001,
- the position of the environment detection device 100 is determined based on the communication result of the wind direction / wind force detection unit 212 and the second communication unit 240, which are functions for detecting the wind direction / wind force based on the sensor signal from the wind direction / wind force sensor 2002.
- a device detection unit 213 which is a function for detection.
- the human detection unit 211 identifies the relative position of the person from the position of the attribute detection device 200 based on the sensor signal from the human sensor 2001, and transmits it to the processing device 300 as an environmental attribute.
- the attribute detection apparatus 200 acquires its own position information using GPS, or acquires a position information using a service that provides position information using communication radio waves, such as PlaceEngine (registered trademark).
- PlaceEngine registered trademark
- the person detection unit 211 detects the person whose relative position is detected based on the position information of the person.
- the position information may be calculated and the position information may be used as the environment attribute.
- the device detection unit 213 is based on the communication result in the second communication unit 240, that is, when communication with the environment detection device 100 is established in the second communication unit 240, the communication strength in the second communication unit 240, etc.
- the position of the environment detection device 100 is specified based on the information, and the position is transmitted to the processing device 300 as an environment attribute together with the received identification information of the environment detection device 100.
- the attribute detection apparatus 200 stores its own position in advance
- the position of the environment detection apparatus 100 may be calculated from its own position, and the position information may be used as the environment attribute.
- FIG. 4A is a block diagram illustrating a specific example of the configuration of the processing apparatus 300.
- the processing device 300 is configured by a general personal computer. Therefore, it has a general personal computer configuration as shown in FIG. 4A.
- the processing device 300 includes a control unit 310 for controlling the entire device including a CPU (not shown), a program executed by the CPU, a sensor signal from the sensor, and display processing.
- a memory 320 for storing information and the like, a communication unit 330 for communicating with other devices via the network 600, and a display unit 350 are included.
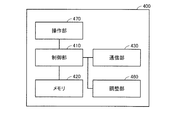
- FIG. 4B is a block diagram illustrating a specific example of the configuration of the adjustment device 400.
- the adjustment device 400 has, for example, a function for adjusting the temperature and humidity and a function for generating ions as a function for adjusting the amount of the parameter that determines the air state of the target space.
- adjustment device 400 is necessary for a control unit 410 for controlling the entire device including a CPU (not shown), and a program executed by the CPU and a sensor signal from the sensor and display processing.
- a memory 420 for storing information and the like, a communication unit 430 for communicating with other devices via the network 600, and an adjustment unit 460 are included.
- the adjustment device 400 has a function of generating ions, and the adjustment unit 460 is an ion generation unit. The detailed configuration of the adjustment unit 460 that is an ion generation unit will be described later.
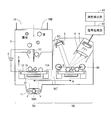
- FIG. 5 is a diagram illustrating a specific example of the configuration of the first example of the microorganism sensor 1001.
- the microorganism sensor 1001 according to the first example charges particles suspended in the air and adsorbs them to an electrode using an electrostatic force, and based on the difference in the amount of fluorescence before and after heating the electrodes, the microorganisms in the particles Is detected.
- a microorganism sensor 1001 has a case 5 provided with an introduction hole 10 and an exhaust hole 11 for introducing external air.
- An air introduction mechanism 50 for introducing air is included.
- the flow rate of the air introduced by the air introduction mechanism 50 is preferably 1 L (liter) / min to 50 m 3 / min.
- control unit 110 of the environment detection device 100 has a signal processing unit 30 that is a function for processing a signal from the microorganism sensor 1001, and a microorganism amount based on the signal.
- a measurement detection unit 40 that is a function for executing the processing to be calculated is included.
- the microorganism sensor 1001 includes a detection mechanism, a collection mechanism, and a heating mechanism.
- FIG. 5 shows an example of the collection mechanism including the discharge electrode 17, the collection jig 12, and the high-voltage power supply 2.
- the discharge electrode 17 is electrically connected to the negative electrode of the high voltage power source 2.
- the positive electrode of the high voltage power supply 2 is grounded.
- the collection jig 12 is a support substrate 4 made of a glass plate or the like having a conductive transparent film 3.
- the film 3 is grounded.
- the negatively charged airborne particles in the air move toward the collecting jig 12 by electrostatic force and are adsorbed by the conductive film 3 to be collected on the collecting jig 12.
- the detection mechanism includes a light-emitting element 6 that is a light source, a lens (or a lens group) 7 that is provided in the irradiation direction of the light-emitting element 6 and makes the light from the light-emitting element 6 parallel light or has a predetermined width.
- the aperture 13, the light receiving element 9 and the light receiving element 9 are provided in the light receiving direction of the light receiving element 9, and the fluorescence generated by irradiating the floating fine particles collected on the collecting jig 12 by the collecting mechanism from the light emitting element 6.
- 9 includes a condensing lens (or lens group) 8 for condensing light to 9 and a filter (or filter group) 14 for preventing irradiation light from entering the light receiving element 9.
- Conventional technology can be applied to these configurations.
- the light emitting element 6 includes a semiconductor laser or an LED element.
- the wavelength may be in the ultraviolet or visible region as long as it excites a microorganism to emit fluorescence.
- the wavelength is from 300 nm to 450 nm, which is contained in a microorganism and excites fluorescent tryptophan, NaDH, riboflavin, and the like efficiently.
- the heating mechanism includes a heater 91 that is electrically connected to the measurement detection unit 40 and whose heating amount (heating time, heating temperature, etc.) is controlled by the measurement detection unit 40.
- a ceramic heater is preferably used as the heater 91.
- FIG. 6A is a cross-sectional view of the microorganism sensor 1001 viewed from the AA position in FIG. 5 in the direction of the arrow
- FIG. 6B is a cross-sectional view viewed from the BB position in FIG. 6A in the direction of the arrow.
- these drawings do not show a collecting mechanism other than the collecting jig 12.
- light emitting element 6 and lens 7, light receiving element 9 and condenser lens 8 are provided at a right angle or a substantially right angle when viewed from the direction of arrow A (upper surface) in FIG.
- Reflected light from the irradiation region 15 formed on the surface of the collecting jig 12 from the light emitting element 6 through the lens 7 and the aperture 13 is directed in a direction along the incident light. Therefore, with this configuration, the reflected light does not directly enter the light receiving element 9.
- the arrangement is not limited to the illustrated arrangement as long as it is an arrangement that can prevent the reflected light and stray light from entering the light receiving element 9.
- the collection jig 12 has a configuration for collecting fluorescence from the particles collected on the surface corresponding to the irradiation region 15 in the light receiving element 9.
- This configuration corresponds to, for example, a spherical recess 51 with reference to FIG. 6B.
- the collection jig 12 is preferably provided so as to be inclined by an angle ⁇ in the direction toward the light receiving element 9 so that the surface of the collection jig 12 faces the light receiving element 9.
- the size of the recess 51 is not limited, but is preferably larger than the irradiation region 15.
- the light receiving element 9 is connected to the signal processing unit 30 and outputs a current signal proportional to the amount of received light to the signal processing unit 30. Therefore, the light emitted from the light-emitting element 6 by irradiating the particles floating in the introduced air and collected on the surface of the collecting jig 12 from the light-emitting element 6 is received by the light-receiving element 9. The amount of received light is detected by the signal processing unit 30.
- shutters 16A and 16B are installed in the introduction hole 10 and the discharge hole 11 of the case 5, respectively.
- the shutters 16A and 16B are connected to the measurement detection unit 40, and their opening and closing are controlled. By closing the shutters 16A and 16B, the inflow of air into the case 5 and the incidence of external light are blocked.
- the measurement detection unit 40 closes the shutters 16A and 16B during fluorescence measurement to be described later, and blocks the inflow of air into the case 5 and the incidence of external light. This interrupts the collection of suspended particles in the collection mechanism during fluorescence measurement.
- stray light in the case 5 can be suppressed by blocking external light from entering the case 5 during fluorescence measurement.
- either one of the shutters 16A and 16B for example, at least the shutter 16B of the discharge hole 11 may be provided.
- the detection principle in the microorganism sensor 1001 according to the first example will be described.
- fluorescence is emitted when a microorganism floating in the air is irradiated with ultraviolet light or blue light.
- fluorescent substances such as chemical fiber dust are floating in the air, and it can be distinguished whether it is from microorganisms or chemical fiber dust only by detecting the fluorescence. Not.
- the inventors performed heat treatment on each of microorganisms and dust of chemical fibers, and measured changes in fluorescence before and after heating. As a result, the fluorescence intensity of dust does not change by heat treatment. On the other hand, it was found that the fluorescence intensity of microorganisms increased by heat treatment. Therefore, in the microorganism sensor 1001 according to the first example, this phenomenon that the inventors have observed is applied as a detection principle.
- the fluorescence spectrum measured before heat treatment includes fluorescence from microorganisms and fluorescence from dust that emits fluorescence. Therefore, microorganisms cannot be detected separately from chemical fiber dust.
- the heat treatment only the microorganisms increase the fluorescence intensity, and the fluorescence intensity of the dust that emits fluorescence does not change. Therefore, the amount of microorganisms can be determined by measuring the difference between the fluorescence intensity before the heat treatment and the fluorescence intensity after the predetermined heat treatment.
- FIG. 7 is a block diagram showing a specific example of a functional configuration of a microorganism sensor 1001 as a first example that detects microorganisms in the air using the above principle.
- the control unit 110 of the environment detection apparatus 100 includes the signal processing unit 30 and the measurement detection unit 40 as functions for processing a signal from the microorganism sensor 1001.
- FIG. 7 shows an example in which the function of the signal processing unit 30 is realized by a hardware configuration that is mainly an electric circuit. However, at least a part of these functions may be a software configuration realized by a CPU included in the control unit 110 executing a program stored in the memory 120.
- the configuration of the measurement detection unit 40 is a software configuration is shown. However, at least some of these functions may be realized by a hardware configuration such as an electric circuit.
- the signal processing unit 30 includes a current-voltage conversion circuit 34 connected to the light receiving element 9 and an amplification circuit 35 connected to the current-voltage conversion circuit 34.
- the measurement detection unit 40 includes a measurement control unit 41, a storage unit 42, and a clock generation unit 47. Further, the measurement detection unit 40 includes an external connection unit 46 for performing processing necessary for data exchange with other devices in the first communication unit 130, the shutters 16A and 16B, the air introduction mechanism 50, and the heater 91. And a driving unit 48 for driving the motor.
- the fluorescence from the particles in the irradiation region 15 is condensed on the light receiving element 9. .
- a current signal corresponding to the amount of received light is output from the light receiving element 9 to the signal processing unit 30.
- the current signal is input to the current-voltage conversion circuit 34.
- the current-voltage conversion circuit 34 detects the peak current value H representing the fluorescence intensity from the current signal input from the light receiving element 9, and converts it into the voltage value Eh.
- the voltage value Eh is amplified to a preset amplification factor by the amplification circuit 35 and output to the measurement detection unit 40.
- the measurement control unit 41 of the measurement detection unit 40 receives an input of the voltage value Eh from the signal processing unit 30 and sequentially stores it in the storage unit 42.
- the clock generation unit 47 generates a clock signal and outputs it to the measurement control unit 41.
- the measurement control unit 41 outputs a control signal for opening and closing the shutters 16A and 16B to the driving unit 48 at a timing based on the clock signal, and controls the opening and closing of the shutters 16A and 16B.
- the measurement control part 41 is electrically connected with the light emitting element 6 and the light receiving element 9, and controls those ON / OFF.
- the measurement control unit 41 includes a calculation unit 411.
- the calculation unit 411 an operation for calculating the amount of microorganisms in the introduced air is performed using the voltage value Eh stored in the storage unit. A specific operation will be described with reference to a time chart showing a flow of control in the measurement control unit 41 of FIG.
- the concentration of microorganisms in the air introduced into the case 5 is calculated as the amount of microorganisms.
- the measurement control unit 41 of the measurement detection unit 40 outputs a control signal to the drive unit 48 to drive the air introduction mechanism 50 when the measurement operation in the microorganism sensor 1001 starts. Further, the measurement control unit 41 outputs a control signal for opening (turning on) the shutters 16 ⁇ / b> A and 16 ⁇ / b> B to the drive unit 48 at time T ⁇ b> 1 based on the clock signal from the clock generation unit 47. Thereafter, at time T2 after time ⁇ T1 has elapsed from time T1, the measurement control unit 41 outputs a control signal for closing (OFF) the shutters 16A and 16B to the drive unit 48.
- the shutters 16A and 16B are opened from time T1 to time ⁇ T1, and external air is introduced into the case 5 through the introduction hole 10 by driving the air introduction mechanism 50. Particles in the air introduced into the case 5 are negatively charged by the discharge electrode 17, and due to the flow of air and the electric field formed between the discharge electrode 17 and the coating 3 on the surface of the collecting jig 12, It is collected on the surface of the collecting jig 12 for a time ⁇ T1.
- the shutters 16A and 16B are closed, and the air flow in the case 5 stops. Thereby, collection of the floating particles by the collection jig 12 is completed. This also blocks stray light from the outside.
- the measurement control unit 41 outputs a control signal for causing the light receiving element 9 to start receiving light (ON) at time T2 when the shutters 16A and 16B are closed. Further, at the same time (time T2) or at time T3 slightly delayed from time T2, a control signal for starting (ON) light emission to the light emitting element 6 is output. After that, at time T4 after the time ⁇ T2 that is a predetermined measurement time for measuring the fluorescence intensity from time T3, the measurement control unit 41 controls the light receiving element 9 to end (OFF) light reception, And the control signal for making the light emitting element 6 complete
- the measurement time may be set in advance in the measurement control unit 41, or input or changed by a signal received from another device by the first communication unit 130 via the network 600. It may be.
- irradiation from the light emitting element 6 is started from time T3 (or time T2).
- the light from the light emitting element 6 is applied to the irradiation region 15 on the surface of the collecting jig 12, and fluorescence is emitted from the collected particles.
- Fluorescence for a prescribed measurement time ⁇ T2 from time T3 is received by the light receiving element 9, and a voltage value corresponding to the fluorescence intensity F1 is input to the measurement detection unit 40 and stored in the storage unit 42.
- the light received from the reflection region (not shown) where the particles on the surface of the collecting jig 12 are not collected, which is emitted from a light emitting element (not shown) such as an LED provided separately, is received.
- Light may be received by an element (not shown), and F1 / I0 may be stored in the storage unit 42 using the received light amount as a reference value I0.
- the measurement control unit 41 outputs a control signal for starting (ON) heating of the heater 91 at time T4 (or time slightly delayed from time T4) when the light emission of the light emitting element 6 and the light reception of the light receiving element 9 are terminated. Output. Then, at time T5 after the elapse of time ⁇ T3, which is a predetermined heat treatment time for the heat treatment from the start of heating of the heater 91 (time T4 or a time slightly delayed from time T4), the measurement control unit 41 turns the heater 91 on. A control signal for finishing (OFF) heating is output.
- the heat treatment is performed on the particles collected in the irradiation region 15 on the surface of the collection jig 12 by the heater 91 from the time T4 (or a time slightly delayed from the time T4) to the heat treatment time ⁇ T3. .
- the heating temperature at this time is defined in advance.
- a predetermined heating amount is applied to the particles collected on the surface of the collection jig 12.
- the heat treatment time ⁇ T3 (that is, the heating amount) may also be set in advance in the measurement control unit 41 as in the case of the measurement time, or may be input by a signal received from another device, It may be changed.
- An air introduction mechanism 50 may be used for the cooling process, and in this case, external air may be taken in from an inlet (not shown in FIG. 5) provided with a separate HEPA (High Efficiency Particulate Air) filter. .
- a cooling mechanism such as a Peltier element may be used separately.
- the measurement control unit 41 outputs a control signal for ending the operation of the air introduction mechanism 50, and outputs a control signal for starting (ON) light reception by the light receiving element 9 at time T6. Further, at the same time (time T6) or at time T7 slightly delayed from time T6, a control signal for starting (ON) the light emitting element 6 to emit light is output. Thereafter, at time T8 after the measurement time ⁇ T2 has elapsed from time T7, the measurement control unit 41 causes the light receiving element 9 to end (OFF) light reception and the light emitting element 6 to end light emission (OFF). The control signal is output.
- the fluorescent light for the measurement time ⁇ T2 after the particles collected from the light emitting element 6 to the irradiation region 15 on the surface of the collecting jig 12 are heated for the time ⁇ T3 is received by the light receiving element 9. .
- the voltage value corresponding to the fluorescence intensity F2 is input to the measurement detection unit 40 and stored in the storage unit 42.
- the calculation unit 411 calculates the difference between the stored fluorescence intensity F1 and fluorescence intensity F2 as the increase amount ⁇ F.
- the increase amount ⁇ F is related to the amount of microorganisms (such as the number or concentration of microorganisms).
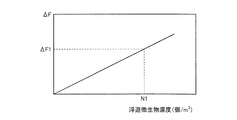
- the calculation unit 411 stores a correspondence relationship between the increase amount ⁇ F and the microorganism amount (concentration) as illustrated in FIG. 9 in advance. Then, the calculation unit 411 calculates the microbial concentration obtained using the calculated increase amount ⁇ F and the corresponding relationship as the microbial concentration in the air introduced into the case 5 during the time ⁇ T1.
- the correspondence between the increase amount ⁇ F and the microorganism concentration is experimentally determined in advance.
- one type of microorganism such as Escherichia coli, Bacillus or mold is sprayed using a nebulizer, and the microorganism concentration is maintained at N / m 3 , and the microorganism sensor 1001 Is used to collect microorganisms for a time ⁇ T1 by the above-described detection method.
- the microorganisms collected at a predetermined heating amount (heating time ⁇ T3, predetermined heating temperature) are subjected to heat treatment by the heater 91, and after cooling for the predetermined time ⁇ T4, the increase amount ⁇ F of fluorescence intensity before and after heating is measured.
- the same measurement is performed for various microorganism concentrations, whereby the relationship between the increase ⁇ F and the microorganism concentration (cells / m 3 ) shown in FIG. 9 is obtained.
- the correspondence between the increase amount ⁇ F and the microorganism concentration may be input from another device and stored in the calculation unit 411.
- the calculation unit 411 calculates the microorganism concentration N1 (pieces / m 3 ) by specifying a value corresponding to the increase amount ⁇ F1 from the correspondence relationship in FIG.
- the calculation unit 411 defines one of the microorganisms as a standard microorganism and stores the correspondence between the increase amount ⁇ F and the concentration of the microorganism.
- the microorganism concentration in various environments is calculated as a microorganism concentration converted with reference to the standard microorganism. As a result, various environments can be compared, and environmental management becomes easy.
- the increase ⁇ F uses the difference in fluorescence intensity before and after the heat treatment of a predetermined heating amount (predetermined heating temperature, heating time ⁇ T3), but these ratios are used. Also good.
- the concentration of the collected microorganisms calculated by the calculation unit 411 is transmitted to the processing apparatus 300 at a predetermined timing by the output process in the measurement control unit 41.
- the microorganism sensor 1001 according to the first example uses the difference in properties due to the heat treatment between the fluorescence from the microorganism and the fluorescence from the dust that emits the fluorescence, and based on the increase after the predetermined heat treatment, Is detected. That is, the microorganism sensor 1001 according to the first example detects microorganisms by utilizing the phenomenon that when the collected microorganisms and dust are heated, the fluorescence intensity of the microorganisms increases and the dust does not change. is there. For this reason, even when dust that emits fluorescence is contained in the introduced air, microorganisms can be separated and detected from dust that emits fluorescence in real time and with high accuracy.
- FIG. 10 is a diagram showing another specific example of the configuration of the microorganism sensor 1001 according to the first example.
- the detection mechanism and the collection mechanism may be provided in different spaces.
- a microorganism sensor 1001 includes a trapping mechanism including at least a part of a trapping mechanism separated by a wall 5C that is a partition wall having a hole 5C ′.
- a collection chamber 5A and a detection chamber 5B including a detection mechanism are provided.
- the collection chamber 5A is provided with a needle-like discharge electrode 17 and a collection jig 12 as a collection mechanism, and the detection chamber 5B has a light emitting element 6, a light receiving element 9, and a condenser lens 8 as a detection mechanism. Deployed.
- the discharge electrode 17 side and the collection jig 12 are respectively provided with an introduction hole 10 and a discharge hole 11 for introducing air into the collection chamber 5A.
- a fan 50A as an air introduction mechanism is provided in the vicinity of the discharge hole 11. Air from the suction port is introduced into the collection chamber 5A by the fan 50A.
- the drive mechanism of the fan 50A is controlled by the measurement detection unit 40, and the flow rate of the introduced air is controlled.
- the flow rate of the air introduced by the fan 50A is 1 L (liter) / min to 50 m 3 / min.
- the fan 50A is driven by a drive mechanism (not shown) controlled by the measurement detection unit 40, so that air outside the collection chamber 5A is collected from the introduction hole 10 through the collection chamber 5A as represented by a dotted arrow in the figure.
- the air in the collection chamber 5A is exhausted from the discharge hole 11 to the outside of the collection chamber 5A.
- airborne particles introduced from the introduction hole 10 by driving the fan 50A are negatively charged in the vicinity of the discharge electrode 17.
- the negatively charged particles move toward the collecting jig 12 by electrostatic force and are adsorbed by the conductive film, thereby being collected on the collecting jig 12.
- a light emitting element 6 and a light receiving element 9 are arranged in the detection chamber 5B.
- the light receiving element 9 is connected to the signal processing unit 30 and outputs a current signal proportional to the amount of received light to the signal processing unit 30. Therefore, the light emitted from the light-emitting element 6 by irradiating the particles floating in the introduced air and collected on the surface of the collecting jig 12 from the light-emitting element 6 is received by the light-receiving element 9. The amount of received light is detected by the signal processing unit 30.
- a brush 60 for refreshing the surface of the collecting jig 12 is provided at a position in the detection chamber 5B that touches the surface of the collecting jig 12.
- the brush 60 is connected to a moving mechanism (not shown) controlled by the measurement detection unit 40 and moves so as to reciprocate on the collecting jig 12 as indicated by a double-sided arrow B in the drawing. Thereby, dust and microorganisms adhering to the surface of the collecting jig 12 are removed.
- the unit including the collecting jig 12 and the heater 91 is referred to herein as a collecting unit 12A.
- the collection unit 12A is connected to a moving mechanism (not shown) controlled by the measurement detection unit 40, and as shown by a double-sided arrow A in the drawing, that is, from the collection chamber 5A to the detection chamber 5B, from the detection chamber 5B. It moves to the collection chamber 5A through the hole 5C ′ provided in the wall 5C.
- the heater 91 is a position where airborne particles collected on the collecting jig 12 can be heated, and at least when heated, sensor devices such as the light emitting element 6 and the light receiving element 9 are used. Therefore, it is not included in the collection unit 12A and may be provided at another position.
- the heater 91 when the heating operation is performed in the collection chamber 5A, the heater 91 is not included in the collection unit 12A, and is a position of the collection chamber 5A where the collection unit 12A is set, and a collection jig. 12 may be fixed to the side opposite to the sensor device such as the light emitting element 6 and the light receiving element 9. Even in this way, the heater 91 is separated from the sensor device such as the light emitting element 6 and the light receiving element 9 by the collecting jig 12 during heating, thereby suppressing the influence of heat on the light emitting element 6 and the light receiving element 9 and the like. be able to. In this case, at least the collection jig 12 may be included in the collection unit 12A.
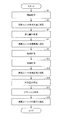
- the functional configuration of the microorganism sensor 1001 is the same as that shown in the block diagram of FIG. A specific measurement operation in the measurement control unit 41 will be described with reference to the flowchart of FIG.
- the concentration of microorganisms in the air introduced in the collection chamber 5A for a predetermined time is calculated as the amount of microorganisms.
- step S1 when microbial sensor 1001 is turned on, in step S1, the collection operation in collection chamber 5A is performed for a time ⁇ T1 that is a predefined collection time.
- the measurement control unit 41 outputs a control signal to the drive unit 48 to drive the fan 50A and take air into the collection chamber 5A. Particles in the air introduced into the collection chamber 5A are charged with a negative charge by the discharge electrode 17, and formed between the air flow by the fan 50A and the coating 3 on the surface of the discharge electrode 17 and the collection jig 12. Is collected in a narrow range corresponding to the irradiation region 15 on the surface of the collecting jig 12.
- the measurement control unit 41 ends the collection operation, that is, finishes driving the fan 50A.
- step S3 the measurement control unit 41 outputs a control signal to the drive unit 48 to operate a mechanism for moving the collection unit 12A, and detects the collection unit 12A from the collection chamber 5A. Move to chamber 5B.
- a detection operation is performed in step S5.
- the measurement control unit 41 causes the light emitting element 6 to emit light and causes the light receiving element 9 to receive the fluorescence for a predetermined measurement time ⁇ T2.
- the light from the light emitting element 6 is applied to the irradiation region 15 on the surface of the collecting jig 12, and fluorescence is emitted from the collected particles.
- a voltage value corresponding to the fluorescence intensity F ⁇ b> 1 is input to the measurement detection unit 40 and stored in the storage unit 42. Thereby, the fluorescence amount S1 before heating is measured.
- the measurement time ⁇ T2 may be set in advance in the measurement control unit 41, or may be input or changed from another device.
- the light received from the reflection region (not shown) where the particles on the surface of the collecting jig 12 are not collected, which is emitted from a light emitting element (not shown) such as an LED provided separately, is received.
- Light may be received by an element (not shown), and F1 / I0 may be stored in the storage unit 42 using the received light amount as a reference value I0.
- step S7 the measurement control unit 41 operates a mechanism for outputting a control signal to the drive unit 48 to move the collection unit 12A, and the collection unit 12A is moved.
- the detection chamber 5B is moved to the collection chamber 5A.
- step S9 similarly to the microorganism sensor 1001 according to the second example, the measurement control unit 41 causes the heater 91 to perform heating for a time ⁇ T3 which is a predetermined heat treatment time. The heating temperature at this time is defined in advance.
- step S11 the measurement control unit 41 outputs a control signal to the drive unit 48, and reversely rotates the fan 50A for a predetermined cooling time. It cools by making external air touch the collection unit 12A.
- the heat treatment time ⁇ T3, the heating temperature, and the cooling time may also be set in advance in the measurement control unit 41, or may be input and changed from another device.
- step S7 the collection unit 12A is moved to the collection chamber 5A, and then the heating operation and the cooling operation are performed in the collection chamber 5A.
- the collection unit 12A moves to the detection chamber 5B so
- the heater 91 is located at a distance from the sensor device such as the light emitting element 6 and the light receiving element 9 and is also separated by the wall 5C and the like, thereby suppressing the influence of heat on the light emitting element 6, the light receiving element 9 and the like. be able to.
- the heater 91 is in the collection chamber 5A separated from the sensor devices such as the light emitting element 6 and the light receiving element 9 by the wall 5C and the like at the time of heating as described above, the heater 91 is disposed in the collection unit 12A.
- the surface far from the discharge electrode 17, that is, the surface far from the light emitting element 6, the light receiving element 9, etc. when the collection unit 12 ⁇ / b> A moves to the detection chamber 5 ⁇ / b> B may not be present. It may be on the side.
- step S13 the measurement control unit 41 operates a mechanism for moving the collection unit 12A by outputting a control signal to the drive unit 48.
- the collection unit 12A is moved from the collection chamber 5A to the detection chamber 5B.
- the detection operation is performed again in step S15.
- the detection operation in step S15 is the same as the detection operation in step S5.
- the voltage value according to the fluorescence intensity F2 is input to the measurement detection unit 40 and stored in the storage unit 42. Thereby, the fluorescence amount S2 after heating is measured.
- step S17 When the fluorescence amount S2 after heating is measured in step S15, the refresh operation of the collection unit 12A is performed in step S17.
- step S ⁇ b> 17 the measurement control unit 41 outputs a control signal to the driving unit 48 to operate a mechanism for moving the brush 60, and reciprocates the brush 60 a predetermined number of times on the surface of the collection unit 12 ⁇ / b> A.
- step S19 the measurement control unit 41 outputs a control signal to the drive unit 48 to operate a mechanism for moving the collection unit 12A, and the collection unit 12A is moved to the detection chamber. Move from 5B to collection chamber 5A. Thereby, the next collection operation (S1) can be started immediately upon receiving the start instruction.
- the calculation unit 411 calculates the difference between the stored fluorescence intensity F1 and fluorescence intensity F2 as the increase amount ⁇ F. Then, in the same manner as the microorganism sensor 1001 according to the second example, the calculated increase amount ⁇ F and the correspondence relationship (FIG. 9) between the increase amount ⁇ F and the microorganism amount (concentration) stored in advance are obtained. The obtained microbial concentration is calculated as the microbial concentration in the air introduced into the collection chamber 5A during the time ⁇ T1. The calculated concentration of microorganisms in the collected particles is transmitted to the processing apparatus 300 at a predetermined timing by the output processing in the measurement control unit 41.
- the collection chamber 5A and the detection chamber 5B are separated, and the collection unit 12A moves back and forth between them to perform collection and detection. Collection and detection can be performed continuously.
- the collection jig 12 is heated and cooled in the collection chamber 5A as described above and is moved to the detection chamber 5B, the influence of heat on the sensors and the like in the detection chamber 5B can be suppressed. .
- microorganism sensor 1001 In the microorganism sensor 1001 according to the first example, airborne particles in the air are adsorbed and collected, and microorganisms are detected from the airborne particles based on the difference in the amount of fluorescence before and after heating.
- the method for detecting microorganisms from suspended particles is not limited to this method, and other methods may be used.
- Another example is a sensor that employs a method of detecting microorganisms from suspended particles using the difference in intensity of scattered light from suspended particles in the air. That is, the intensity of scattered light from airborne particles in the air depends on the size and refractive index of the airborne particles. Since microorganisms are filled with a liquid close to water, the microorganism can be approximated to transparent particles having a refractive index close to water.
- the microorganism sensor 1001 uses light of a dust particle of the same size when assuming that the refractive index of the microorganism floating in the air is a refractive index close to water. By utilizing the difference in scattering intensity at a specific scattering angle when irradiating, the microorganisms are separated from the suspended particles that are not, and detected.
- microorganisms at a predetermined scattering angle for example, 60 degrees
- a value between a scattering intensity from a particle having a refractive index of 1.3 (assuming a particle having a refractive index of 1.3) and a scattering intensity from dust (assuming a particle having a refractive index of 1.6) is stored.
- the microbial sensor 1001 measures the size and scattering intensity of the suspended particles in the introduced air, and stores the measured scattering intensity at the predetermined scattering angle in advance for the measured size.
- Microorganisms are detected from suspended particles by discriminating them as microbe particles when the boundary value is smaller than the boundary value and dust particles when the boundary value is larger.
- the size of the suspended particles in the air that is introduced is that the velocity of suspended particles in the air that is transported at a certain flow rate becomes slower if the size of the suspended particles increases if the air flow rate is not large. Can be detected. In other words, since the speed decreases as the size of the suspended particles increases, it can be used that the time that the suspended particles cross the irradiation light becomes longer.
- Scattered light generated by suspended particles carried at a certain flow velocity across the irradiation light from the light emitting element 6 is received by the light receiving element 9, and a pulsed current signal is output from the light receiving element 9. Is done.
- the pulse width is related to the time that the suspended particles cross the irradiation light. Therefore, the size of suspended particles is converted from the pulse width of the output current signal.
- the pulse width of the current signal from the light-receiving element 9 causes the outside air to flow into the microorganism sensor 1001 at a flow rate that is not too large so as to reflect the size of the suspended particles.
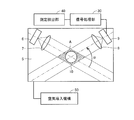
- FIG. 12 is a diagram showing a specific example of the configuration of the microorganism sensor 1001 according to the second example.
- the microorganism sensor 1001 according to the second example has a case 5 provided with an introduction hole 10 for introducing air from the suction port and an exhaust hole (not shown), and is introduced into the case 5.
- An air introduction mechanism 50 for introducing external air from the hole 10 is included.
- the flow rate of air introduced by the air introduction mechanism 50 is preferably 0.01 L (liter) / min to 10 L / min as a flow rate suitable for detecting the size of the above-mentioned suspended particles.
- a light emitting element 6 that is a light source
- a lens 7 that is provided in the irradiation direction of the light emitting element 6, makes the light from the light emitting element 6 parallel light or has a predetermined width, and a light receiving element 9.
- a condensing lens 8 for condensing the scattered light generated from the suspended fine particles present in the air by parallel light to the light receiving element 9.
- the fluorescence is cut before the condenser lens 8 or the light receiving element 9 so that the fluorescence from the microorganisms does not enter the light receiving element 9.
- An optical filter is installed.
- the light emitting element 6 and the lens 7, and the light receiving element 9 and the condensing lens 8 are respectively the irradiation direction of the light emitting element 6 made parallel light by the lens 7 and the light receiving element by being condensed by the condensing lens 8.
- the light receiving direction is set at a predetermined scattering angle ⁇ (for example, 60 degrees).
- the air moving from the introduction hole 10 to the discharge hole is condensed by the irradiation region from the light emitting element 6 which is converted into parallel light by the lens 7 and the light collecting element 8.
- 9 is installed at an angle so as to pass through the area A in FIG. 12, which is an area overlapping the area where light can be received.
- FIG. 12 shows an example in which these are installed so that the angle ⁇ is about 60 degrees and the region A is in front of the introduction hole 10.
- the angle ⁇ is not limited to 60 degrees and may be another angle.
- the light receiving element 9 is connected to the signal processing unit 30 and outputs a current signal proportional to the amount of received light to the signal processing unit 30.
- a current signal proportional to the amount of received light is emitted.
- the signal processing unit 30 is connected to the measurement detection unit 40 and outputs a result of processing the pulsed current signal to the measurement detection unit 40. Based on the processing result from the signal processing unit 30, the measurement detection unit 40 detects microorganisms from airborne particles in the air and performs processing for outputting the detection result.
- FIG. 13 is a block diagram showing a specific example of a functional configuration of a microorganism sensor 1001 as a second example that detects microorganisms in the air using the above principle.
- the control unit 110 of the environment detection apparatus 100 includes a signal processing unit 30 and a measurement detection unit 40 as functions for processing a signal from the microorganism sensor 1001.
- FIG. 13 shows an example in which the function of the signal processing unit 30 is realized by a hardware configuration that is mainly an electric circuit. However, at least a part of these functions may be a software configuration realized by a CPU included in the control unit 110 executing a program stored in the memory 120.
- the configuration of the measurement detection unit 40 is a software configuration is shown. However, at least some of these functions may be realized by a hardware configuration such as an electric circuit.
- signal processing unit 30 is connected to pulse width measuring circuit 32 connected to light receiving element 9, pulse width-voltage converting circuit 33 connected to pulse width measuring circuit 32, and light receiving element 9.
- a filter circuit 31 is provided between the light receiving element 9, the pulse width measurement circuit 32, and the current-voltage conversion circuit 34 for removing a signal having a preset current value or less. It is done. By providing the filter circuit 31, noise components due to stray light in the detection signal of the light receiving element 9 can be reduced.
- the measurement detection unit 40 includes a calculation unit 45, a storage unit 42, and an output unit 43 for outputting a detection result.
- a pulsed current signal corresponding to the amount of received light is output to the signal processing unit 30.
- the current signal is input to the pulse width measurement circuit 32 and the current-voltage conversion circuit 34 of the signal processing unit 30.
- a signal equal to or less than a preset current value is cut through the filter circuit 31.
- the current-voltage conversion circuit 34 detects the peak current value H representing the scattering intensity from the current signal input from the light receiving element 9, and converts it into the voltage value Eh.
- the voltage value Eh is amplified to a preset gain by the amplifier circuit 35 and output to the voltage comparison circuit 36.
- the pulse width measurement circuit 32 measures the pulse width W of the current signal input from the light receiving element 9.
- the method for measuring the pulse width or the value related thereto in the pulse width measuring circuit 32 is not limited to a specific method, and may be a well-known signal processing method. As an example, a measurement method when a differential circuit (not shown) is incorporated in the pulse width measurement circuit 32 will be described. That is, when a pulsed current signal is input, in the differentiating circuit, a constant voltage determined according to the first pulse signal is generated, and the voltage returns to 0 according to the next pulse signal.
- the pulse width measuring circuit 32 can measure the time from the rising edge to the falling edge of the voltage signal generated in the differentiating circuit and use it as the pulse width.
- the pulse width W may be a width between peaks of a differential curve obtained through a differentiating circuit.
- an interval of a half value of the peak voltage value of the pulse waveform that is, a half value width, or an interval from the rising edge to the falling edge of the pulse waveform may be used.
- a signal indicating the pulse width W measured by such a method or by another method is output to the pulse width-voltage conversion circuit 33.
- a voltage value Ew used as a boundary value of the scattering intensity for determining whether or not it is a microorganism is set in advance.
- the pulse width-voltage conversion circuit 33 converts the input pulse width W into a voltage value Ew according to the setting.
- the correspondence between the pulse width W and the voltage value Ew may be set as a function or a coefficient, or may be set in a table.
- the voltage value Ew is output to the voltage comparison circuit 36.
- the voltage value Ew which is a boundary value corresponding to the pulse width W, is experimentally determined in advance.
- a type of microorganism such as Escherichia coli, Bacillus or mold is sprayed into a 1 m 3 container using a nebulizer, and a pulse is generated from a current signal from the light receiving element 9 using a microorganism sensor 1001.
- the width and scattering intensity (peak voltage value) are measured.
- polystyrene particles having the same size are substituted for dust, and the pulse width and scattering intensity (peak voltage value) are measured using the microorganism sensor 1001.
- regions is determined from each area
- a voltage value Ew used as the boundary value determined in this way is set.
- the correspondence relationship between the pulse width W used as the boundary value and the voltage value Ew may be set by being input from another device.
- the correspondence relationship between the pulse width W and the voltage value Ew once set in the voltage comparison circuit 36 may be updated.
- the voltage comparison circuit 36 has a boundary value corresponding to the voltage value Eh representing the scattering intensity input from the current-voltage conversion circuit 34 via the amplification circuit 35 and the pulse width W input from the pulse width-voltage conversion circuit 33. Is compared with the voltage value Ew. Based on this comparison, the voltage comparison circuit 36 determines whether or not the suspended particles that generate the scattered light received by the light receiving element 9 are microorganisms.
- the determination by the voltage comparison circuit 36 is performed based on the scattered light from the particles every time the suspended light crosses the irradiation light from the light emitting element 6, and a signal indicating the determination result is output to the measurement detection unit 40.
- the calculation unit 45 of the measurement detection unit 40 receives an input of the determination result from the voltage comparison circuit 36 and sequentially stores it in the storage unit 42.
- the calculation unit 45 inputs the number of signals indicating a determination result that the detection target suspended particles are microorganisms and / or other determination results. This counts the number of times signals are input.
- the calculation unit 45 reads the flow rate of the introduced air from the air introduction mechanism 50 and multiplies the detection time to obtain the air amount Vs introduced into the case 5 during the detection time. As the detection result, the calculation unit 45 divides the number Ns of microorganisms or the number Nd of dust particles, which is the above-described total result, by the air amount Vs to obtain the concentration Ns / Vs of microorganisms or the concentration Nd / Vs of dust particles. .
- the number of microorganisms Ns and the number of dust particles Nd counted within the detection time, the calculated microorganism concentration Ns / Vs, and the dust particle concentration Nd / Vs, which are detection results, are stored in the storage unit 42. The Then, it is transmitted to the processing device 300 at a predetermined timing.
- a general gas sensor can be adopted.
- a semiconductor gas sensor such as SB-AQ1 manufactured by FIS can be used.
- a heater coil and an electrode lead wire are embedded in a gas-sensitive material obtained by adding a sensitizer to metal oxide secondary particles such as oxidized varnish (SnO 2 ) and sintering at high temperature.
- This gas sensitive element is mounted on a base with three electrode terminals, and is connected in series with the sensor resistance in a state where a constant voltage is applied to the heater to control the temperature of the gas sensitive element. Gas is detected by detecting a change in output voltage across the load resistor.
- Metal oxide crystals such as oxidized varnish adsorb oxygen on the surface in clean air and maintain a stable state.
- a reducing gas is present in the air, the adsorbed oxygen is reduced by reacting with oxygen and gas on the crystal surface, and as a result, electrons in the crystal are increased. Thereby, the resistance value of the metal oxide decreases.
- the gas sensor 1005 can detect the gas concentration in the air using the principle described above. In other words, when SB-AQ1 manufactured by FIS is used, the sensor resistance value decreases as the gas concentration increases, and is based on the change in output voltage across the load resistance connected in series with the sensor resistance. The gas concentration can be obtained by calculating the sensor resistance value. This detection value is also transmitted to the processing device 300 at a predetermined timing.
- the adjustment part 460 which is an ion part contained in the adjustment apparatus 400 is demonstrated.
- a configuration of a type that is used independently as an ion generator will be described as an example.
- a configuration as a part that is incorporated in the entire adjustment device 400 may be used.
- FIG. 14 is a diagram showing a specific example of the appearance of the adjustment unit 460 that is an ion generation unit.
- adjustment unit 460 that is an ion generation unit has a rectangular parallelepiped case with a hole cut, and a line for connecting to a DC power source of about 12 V (not shown) extends from the case.
- a plurality of holes are drilled, and a positive needle electrode 301A and a negative needle electrode 301B are positioned at the approximate center of each of the pair of holes.
- FIG. 15 is a diagram illustrating a specific example of a circuit configuration corresponding to a pair of holes of the adjustment unit 460 that is an ion generation unit.
- a plurality of circuit configurations shown in FIG. 16 are included in the adjustment unit 460 that is an ion generation unit.
- each circuit includes a conversion circuit for converting a direct current having a transistor and a piezoelectric element into an alternating current, and high voltage generation circuits 303A and 303B.
- FIG. 16 is a diagram showing a specific example of the circuit configuration on the positive electrode side in FIG.
- switch 302A when switch 302A is closed, a current from a DC power source of about 1.5V to 12V is converted to DC by a conversion circuit, rectified to the positive side by a diode, and then a high voltage is generated through a protection circuit.
- the high voltage generation circuit 303A includes a piezoelectric element, and generates a high voltage by boosting the input voltage rectified to the positive electrode side.
- the high voltage is supplied to the positive needle electrode 301A, and corona discharge occurs at the tip of the electrode 301A.
- positive ions are generated and discharged out of the case from the hole of the case of the adjustment unit 460 that is the ion generation unit provided with the electrode 301A.
- the positive ion is a cluster ion in which a plurality of water molecules are attached around a hydrogen ion (H + ), and is represented as H + (H 2 O) m (m is an arbitrary natural number).
- the negative ion is a cluster ion in which a plurality of water molecules are attached around an oxygen ion (O 2 ⁇ ), and is expressed as O 2 ⁇ (H 2 O) n (n is an arbitrary natural number).
- the switches 302A and 302B are connected to the control unit 410 of the adjustment device 400 and are turned ON / OFF by the control. When both switches are ON, positive and negative ions are released from the circuit, and when only one of the switches is ON, positive or negative unipolar ions are output from the circuit. Released. When both switches are OFF, no ions are released from the circuit.
- control unit 410 When functioning as a conventional ion generator, the control unit 410 turns on only one of the switches to generate unipolar ions such as negative ions from the circuit.
- 2- (H 2 O) n (n is an arbitrary natural number) is generated in an approximately equivalent amount, so that both ions surround airborne fungi and viruses in the air, and the active species produced at that time It is possible to remove floating fungi and the like by the action of hydroxyl radicals (.OH).
- the adjustment unit 460 which is an ion generation unit, is installed in the flow path on the downstream side of the filter. As a result, the generated ions ride on the air cleaned by the filter and are released from the exhaust port to the outside of the machine.
- the control unit 410 controls ON / OFF of the switches 302A and 302B in accordance with a control signal from the processing device 300 described later.
- the control signal from the processing apparatus 300 is a signal that generates a high concentration of ions for generating ions
- the switches of all the circuits included in the adjustment unit 460 that is an ion generation unit are turned on and lower than that.
- the switches of a predetermined number of circuits stored in advance are turned on and the switches of other circuits are turned off. By doing so, the ion concentration to be generated is controlled.
- the method for controlling the concentration of ions to be generated there is a method for controlling the ON / OFF intervals of the switches 302A and 302B.
- the ion concentration can be easily controlled.
- the environment detection devices 100 are installed at various positions, and the air state of the area is displayed for each predetermined area.
- the position where each environment detection apparatus 100 is installed is detected by the attribute detection apparatus 200, and information indicating the position of the environment detection apparatus 100 is sent from the attribute detection apparatus 200 to the processing apparatus 300 as an environment attribute.
- the processing device 300 the area where each environment detection device 100 is installed is specified based on the environment attribute from the attribute detection device 200. And the state of the air for every area is displayed based on the detection result from the environment detection apparatus 100 installed in the said area.
- This display process is hereinafter referred to as a first display process.
- the position where the user is located is detected by the attribute detection apparatus 200, and information representing the position where the user is located is sent from the attribute detection apparatus 200 to the processing apparatus 300 as an environmental attribute.
- the processing device 300 when the detection result of the environment detection device 100 is displayed, the air state of the area including the position where the user is present is displayed on the corresponding display terminal 500. This display process is hereinafter referred to as a second display process.
- the processing device 300 stores the position where the adjustment device 400 is provided in advance, and the adjustment device 400 arranged at a necessary position is controlled with a suitable control amount according to the detection result of the environment detection device 100. Control.
- the position of the adjustment device 400 may be detected by the attribute detection device 200 and sent to the processing device 300 in the same manner as the method of detecting the position of the environment detection device 100. This may be performed in parallel with the first display process or the second display process described above.
- FIG. 17 is a block diagram illustrating a specific example of a functional configuration of the processing device 300 for performing display control according to the first embodiment.
- Each function shown in FIG. 17 is mainly formed in the CPU by reading and executing a program stored in the memory 320 by the CPU included in the control unit 310 of the processing device 300.
- the unit may be realized by a hardware configuration such as an electric circuit.
- processing device 300 for performing display control inputs a measurement value and identification information of environment detection device 100 as environment information from environment detection device 100.
- a measurement value and identification information of environment detection device 100 as environment information from environment detection device 100.
- Attribute input unit 312 based on the input information, a specifying unit 313 for specifying the area where the environment detection apparatus 100 is installed, the area where the user is, and the like, and the display content are determined and displayed.
- areas that are display units are set in advance for the space to be detected, and the environment detection device 100 is arranged at various positions in the space.
- position information for each area is stored in a predetermined area of the memory 320 in advance.
- the position information is represented by latitude / longitude and the area that is the unit of display is a room
- the latitude / longitude for each room is stored in advance.
- the specifying unit 313 refers to the position information for each area stored in a predetermined area of the memory 320, and in which area the environment detection device 100 that has input the environment information is arranged, that is, the input detection result is Identify which area is the detection result. And the display process part 315 performs the process for displaying the state of air about the display target area based on the input detection result.
- the specifying unit 313 refers to the position information for each area stored in a predetermined area of the memory 320, and mutually stores the position where the attribute detection device 200 is stored in advance or the network 600. Based on the installation position of the attribute detection device 200 obtained by communication, in which area the attribute detection device 200 to which the environment attribute is input is arranged, that is, in which area the input environment attribute is Specify whether it is an attribute. Then, the display processing unit 315 further performs processing for displaying the air state for the display target area using the environment attribute.
- FIG. 18 is a flowchart showing the flow of the first display process in the processing apparatus 300.
- the operation shown in the flowchart of FIG. 18 is realized by causing the CPU included in the control unit 310 of the processing device 300 to read and execute a program stored in the memory 320 and to cause each unit shown in FIG. 17 to function. Is done.
- the CPU specifies a detection area of environment detection device 100 in step S103.
- the position information of the environment detection device 100 is previously acquired from the attribute detection device 200 together with the identification information of the environment detection device 100 and stored.
- the CPU calculates the position of the environment detection apparatus 100 based on the position information of the attribute detection apparatus 200 stored in advance, thereby the position information. To get.
- step S ⁇ b> 103 the CPU specifies the position information of the environment detection device 100 represented by the identification information input together with the detection result in step S ⁇ b> 101, and for each area stored in the position information and a predetermined area of the memory 320. By comparing the position information, the area where the environment detection apparatus 100 is installed is specified.
- step S105 the CPU determines the display mode for the area to be displayed based on the detection result of the area. That is, when the area where the environment detection apparatus 100 in which the detection result is input in step S101 is installed is a display target area, the display mode of the display target area is based on the detection result input in step S101. To decide. When there are a plurality of environment detection devices 100 installed in the display target area, the display mode of the display target area is determined based on the detection results of the plurality of environment detection devices 100. For example, the display mode of the display target area may be determined based on the value obtained by adding the detection results of the plurality of environment detection devices 100, or using a statistical value such as an average value thereof. The display mode of the display target area may be determined. The determination method here will be described later with a specific example.
- the CPU When the CPU receives designation of an area for displaying the detection result from the operation unit 370 (YES in step S107), the CPU executes a process for displaying the detection result of the area on the display unit 350. As a result, the detection result for the designated area is displayed on the display unit 350.
- FIG. 19 is a diagram illustrating a first specific example of a display screen in the first display process.
- a process for displaying the air state in the area is performed.
- the display processing unit 315 stores a reference value for dividing the bacteria into “high”, “low”, and “none” in advance, and compares the reference value with the detection value from the environment detection apparatus 100. By doing so, rank the amount of bacteria.
- the CPU stores the correspondence between the rank of the amount of bacteria and the display mode in advance.
- the display mode is hatched with diagonal lines when the amount of bacteria is “high” rank, hatched with a dotted horizontal line when rank is “low”, and no hatch when rank is “none”.
- An example in which is stored is shown.
- the display mode is not limited to hatching, and includes color, density, display size, a combination thereof, and the like.
- the display is not limited to the two-dimensional display and may be a three-dimensional display. In that case, the display mode includes a three-dimensional depth.
- the memory 320 stores the position information of areas A to F (or areas A to E) for each floor from 1F to 5F as areas that are display units in advance. ing. Then, by comparing with the position information of each environment detection device 100, the environment detection device 100 installed in the display target area is specified, and the amount of bacteria as a detection result from the environment detection device 100 is obtained. At this time, as described above, when a plurality of environment detection devices 100 are installed in the display target area, the amount of bacteria for the area is obtained based on the detection results of the plurality of environment detection devices 100. . And the display mode showing the state of the air of the said area is determined based on the quantity of the microbe.
- detection results for a wide range including a plurality of areas may be displayed. That is, as shown in FIG. 19, for each floor, the amount of bacteria on the floor based on the detection result for each area of the floor may be displayed.
- FIG. 20 is a diagram showing a second specific example of the display screen in the first display process.
- the button representing 5F is clicked, as shown by the arrow in FIG. 19, the display unit The screen displayed on 350 is represented.
- the arrangement and size of the area for each floor are stored in advance in the memory 320 as map information. Then, after determining the display range of the areas A to F of the 5F based on the map information, the display mode corresponding to the amount of bacteria in each area is determined.
- the state of the air in each area of the designated floor is displayed in a display mode according to the amount of bacteria detected in the display range according to the actual arrangement and size.
- the displayed example is shown.
- the state of air near each installation position is determined based on the detection result of each environment detection device 100 as a more detailed air state in the area. You may make it display.
- FIG. 21 is a diagram showing a third specific example of the display screen in the first display process, as indicated by an arrow in FIG. 19 or as indicated by an arrow in FIG. Further, a screen displayed on the display unit 350 when the button representing the area A on 5F is clicked is shown. It is assumed that two environment detection devices 100 are installed in area A on 5F.
- the air state based on the detection result of each environment detection device 100 installed in the area A of 5F is displayed in a position corresponding to each installation position according to the detection result. Is displayed.
- the CPU of the processing device 300 identifies each position of the environment detection device 100 in the area based on the position information of the environment detection device 100 and the position information of the area. And it displays in the display mode according to each detection result in the position according to the installation position of the environment detection apparatus 100 among the display range of the said area. By displaying in this way, the distribution of the air state in one area can be grasped at a glance.
- the adjustment device 400 is displayed together with the air state.
- the CPU of the processing device 300 specifies the position of the adjustment device 400 in the display target area based on the position information of the adjustment device 400 stored in advance. Then, a mark representing the adjustment device 400 is displayed at a position corresponding to the installation position of the adjustment device 400 in the display range of the area. The mark is a selectable mark.
- the CPU of the processing apparatus 300 accepts a control instruction to the adjustment apparatus 400 by accepting selection (clicking) of the mark. Become.
- an option for instructing the drive amount of the adjustment unit 460 of the adjustment device 400 is displayed on the display screen.
- driving amounts of “strong”, “medium”, “weak”, and “stop” are displayed.
- the user who sees the display of the air state can instruct the driving of the adjusting device 400 installed in the area.
- the adjustment device 400 is an ion generator and the air state in the area is a state where the amount of bacteria is “large”, the user can adjust the adjustment device 400 installed in the area or the bacteria It is possible to instruct the adjustment device 400 installed in the vicinity of the position where the amount is “large” to increase the air cleaning capability by setting the driving amount to “strong”.
- the air state in the area is a state where the amount of bacteria is “low” or “none”
- the user drives the adjustment device 400 installed in the area with “low”. Or can be instructed to stop driving. In this way, the optimum driving amount according to the displayed air condition can be obtained.
- the CPU of the processing device 300 controls the driving amount of the adjustment device 400 by accepting a selection operation from the user.
- the memory 220 of the processing device 300 adjusts the air state and adjustment in advance.
- the CPU is installed in the area based on the air state obtained from the detection result of the target area based on the correspondence relationship.
- the drive amount of the device 400 may be determined, and a control signal that will be the drive amount may be transmitted to the adjustment device 400.
- the air conditioner of each area is displayed, and the adjustment device 400 is automatically controlled so as to obtain a better air condition.
- the air state changes, the air state after the change is also displayed, and the user can confirm the effect of the control.
- the air state based on the amount of bacteria is displayed.
- the air state based on other parameters may be displayed, or the air state based on a combination of a plurality of parameters. May be displayed.
- FIG. 22 is a diagram showing a specific example of the display window 70 in the second display process.
- the air state is displayed based on the detection result from the microorganism sensor 1001 and the detection result from the dust sensor 1002 using a specific example substantially similar to the description of the first display process.
- display window 70 displayed in the second display process includes a mark 71 representing the air state based on the amount of bacteria, and environmental detection device 100 installed in the display target area.
- a mark 72 which is a meter representing the distance from the position to the user's position, a mark 73 representing the amount of dust, and a mark 74 for instructing the end of display of the display window 70 are displayed.
- the mark 71 is a mark imitating a human face, and the state of the air is expressed by its expression (smiling face, crying face, no expression, etc.).
- the mark 72 which is a meter represents the distance from the position of the environment detection apparatus 100 to the position of the user by the length of the meter.
- the mark 73 is a mark that represents each dust in a pseudo manner, and the amount of dust is expressed by the number.
- the predetermined area of the memory 320 stores in advance the correspondence between the amount of parameter represented by each mark and the state of the mark.
- 23A to 23C are diagrams showing specific examples of the correspondence relationship between the amount of parameter represented by each mark and the state of the mark.
- FIG. 23A is a correspondence relationship for displaying the mark 72
- FIG. FIG. 23C is a specific example of the correspondence for displaying 73 and FIG. 23C.
- the memory 320 stores the meter length corresponding to the rank of the distance from the position of the environment detection device 100 to the user's position as a correspondence relationship for displaying the mark 72. Yes.
- memory 320 stores the number of images presented as a pseudo representation of one dust corresponding to the dust amount rank, as a correspondence relationship for displaying mark 73.
- FIG. 23C in memory 320, as a correspondence relationship for displaying mark 71, a person corresponding to the rank of the amount of bacteria and the rank of the distance from the position of environment detection device 100 to the user's position is displayed. The expression of the mark imitating the face is stored.
- the specifying unit 313 of the processing device 300 for executing the second display processing receives the detection result of the microorganism sensor 1001 and the detection result of the dust sensor 1002 of the environment detection device 100, and ranks the amount of bacteria. , And rank the amount of dust. Further, the processing device 300 receives input of environmental attributes representing the position of the person detected by the attribute detection device 200 and the position of the environment detection device 100, calculates the distance between them, and divides the rank. The rank is the same as the rank in the first display process. Then, with reference to the correspondence relationships shown in FIGS. 23A to 23C stored in the memory 320, the marks 71, 72, and 73 for the display target area are specified.
- the specifying unit 313 of the processing device 300 for executing the second display process specifies the display terminal 500 that displays the air state.
- the processing device 300 communicates with each other via the network 600 to specify the position of each display terminal 500 and is stored in a predetermined area of the memory 320 in advance. Therefore, the specifying unit 313 specifies the display terminal 500 installed or positioned in the display target area, and specifies the display terminal 500 as the display terminal 500 that displays the air state.
- the specifying unit 313 may specify the display terminal 500 as the display terminal 500 that displays the air state by receiving a display request using the display terminal 500 from the user.
- FIG. 24 is a flowchart showing the flow of the second display process in the processing apparatus 300.
- the operation shown in the flowchart of FIG. 24 is realized by the CPU included in the control unit 310 of the processing device 300 reading and executing the program stored in the memory 320 and causing each unit shown in FIG. 17 to function. Is done.
- step S201 the CPU specifies the position of each environment detection device 100 based on the environment attribute from attribute detection device 200, and in step S203 specifies the position of the user.
- step S205 the CPU identifies the display terminal 500 that is closest to the position of the user as the display terminal 500 that displays the display window.
- step S207 the CPU specifies an area including the position where the user is present as an area to be displayed, and in step S209, specifies the environment detection apparatus 100 installed in the area.
- step S211 the CPU identifies the amount of bacteria and the amount of dust in the area based on the identified detection result from the environment detection apparatus 100.
- step S213 the CPU refers to the correspondence shown in FIG. 23B based on the specified dust amount, and determines the content of the mark 73, that is, the number of images presented in a pseudo manner representing one dust. To do.
- step S215 the CPU specifies a distance between them based on the specified position of the environment detection device 100 and the position of the user, and in step S217, based on this distance, the correspondence relationship shown in FIG. Referring to the content of the mark 72, that is, the length of the mark 72 as a meter is determined.
- step S219 the CPU refers to the correspondence shown in FIG. 23C based on the distance from the environment detection apparatus 100 to the user and the amount of the specified bacteria, that is, the content of the mark 71, that is, the person The facial expression of the mark that imitates the face is determined as the presentation content.
- step S221 the CPU generates display data for displaying the display window 70 based on the contents of the determined marks 71, 72, 73.
- step S223 a process for displaying the display window 70 based on the display data on the display terminal 500 specified in step S205 is executed.
- 25A and 25B are diagrams showing how the display window 70 is displayed on the specified display terminal 500.
- FIG. 25A and 25B are diagrams showing how the display window 70 is displayed on the specified display terminal 500.
- the display terminal 500A which is a television receiver
- the television receiver A display window 70 is displayed on a part of the display screen of the display terminal 500A.
- the display window 70 is displayed at a position and size that do not hinder the viewing of the program content displayed on the display terminal 500A, which is a television receiver.
- a mark indicating that display data for the display window 70 to be displayed is received is displayed, and the display window 70 is displayed by receiving a predetermined operation specified in advance. You may make it do.
- the display terminal 500B which is a mobile phone carried by the user or an electronic book viewing terminal
- the table shown in FIG. the display window 70 is displayed on a part of the display screen of the display terminal 500B which is a mobile phone or an electronic book browsing terminal.
- the display window 70 is displayed at a position and size that do not hinder the viewing of the content displayed on the display terminal 500B that is a mobile phone or an electronic book browsing terminal. .
- a mark indicating that display data for the display window 70 to be displayed is received is displayed, and a predetermined operation specified in advance is accepted.
- the display window 70 may be displayed.
- a mark indicating that display data is being received is displayed prior to display of the display window 70, so that other displays are temporarily terminated.
- a display window 70 can be displayed.
- the user can check the air condition in the area where he is in real time on the nearest display terminal.
- the air state based on each of the amount of bacteria and the amount of dust is displayed, but only one of them may be displayed, or the air state based on other parameters May be displayed, or an air state based on a combination of a plurality of parameters may be displayed.
- 26A and 26B are diagrams showing another specific example of the display window 70 in the second display process.
- a mark 75 representing the wind direction / air volume may be displayed.
- the mark 75 is an image of an arrow, and the direction represents the wind direction, and the size represents the air volume.
- the correspondence relationship between the wind direction / air volume and the direction and size of the mark is stored in advance, and the CPU of the processing device 300 represents an environment representing the wind direction / air volume from the attribute detection device 200. Based on the attribute, the correspondence relationship is referred to, and the content of the mark 75, that is, the direction and size of the mark 75 that is an arrow is determined.
- the wind direction and the air volume are displayed in consideration of the user position and the position of the environment detection apparatus 100.
- the straight line connecting the user position and the position of the environment detection device 100 is a reference axis and the wind direction is horizontal with respect to the reference axis
- the content of the mark 75 using the detected wind direction / wind force as it is, That is, the direction and size of the mark 75 that is an arrow is determined.
- the wind force (vector) is decomposed into a horizontal component and a vertical component with respect to the reference axis, and the content of the mark 75 for the horizontal component wind force, that is, an arrow.
- the size of the mark 75 is determined.
- the user can also check the state of the wind from the environment detection device 100 to his / her position, and can check the state of air in the direction toward himself / herself. it can.
- the display window 70 may be displayed three-dimensionally as shown in FIG. 26B. By displaying in this way, the user can grasp the state of air sensuously in relation to his / her position.
- the position of the environment detection apparatus 100 is dynamically acquired as an environment attribute. Therefore, even if the installation position of the environment detection device 100 is changed (moved), the position information (detection point) of the environment detection device 100 can be appropriately acquired, and an accurate display can be realized.
- the positional relationship between the user and the position (detection point) of the environment detection device 100 can be specified, the state of the air around the user is easily visible to the user. It can be presented at the terminal.
- the environment detection devices 100 are installed at various positions, and the air condition of the area is also determined using the presence / absence and distribution of people in the area for each predetermined area. Is displayed. In the following description, differences from the first embodiment will be particularly described.
- the attribute detection apparatus 200 uses a human sensor such as an infrared sensor, an ultrasonic sensor, a visible light sensor, or a pressure sensor, in addition to the presence or absence of a person in the space to be detected. The number of people in the space is also detected. Then, environment attributes representing them are sent to the processing device 300. For example, when a pressure sensor is used as the human sensor, the pressure sensor is installed on the floor of the space to be detected, and the human detection unit 211 sets the position where the pressure corresponding to the human weight is detected as the human position. And the number of places where pressure corresponding to the weight of the person is detected can be detected as the number of persons.
- a human sensor such as an infrared sensor, an ultrasonic sensor, a visible light sensor, or a pressure sensor
- the processing device 300 For example, when a pressure sensor is used as the human sensor, the pressure sensor is installed on the floor of the space to be detected, and the human detection unit 211 sets the position where the pressure corresponding to the human weight is detected as the
- the air state for each area is detected from the environment detection device 100 installed in the area.
- the first display process for displaying based on the above and the second display process for displaying on the corresponding display terminal 500 the air condition of the area including the position where the user is present are performed.
- FIG. 27 is a block diagram illustrating a specific example of a functional configuration of the processing device 300 for performing display control according to the second embodiment.
- Each of the functions shown in FIG. 27 is also mainly formed in the CPU by reading and executing a program stored in the memory 320 by the CPU included in the control unit 310 of the processing device 300.
- a part may be realized by a hardware configuration such as an electric circuit.
- a determination unit 316 is provided for determining the display timing based on the environmental attribute representing the presence or absence.
- the flow of the first display process in the processing device 300 is substantially the same as the flow of the first display process in the first embodiment shown in the flowchart of FIG.
- the CPU determines the display mode so that the number of people in each area represented by the environment attribute is also displayed in step S105.
- FIG. 28 is a diagram illustrating a first specific example of a display screen in the first display process.
- the air condition for each area of each floor shown in FIG. An example in which the presence or absence of people in the area is displayed is shown.
- FIG. 29 is a diagram showing a second specific example of the display screen in the first display process.
- the air state of each area of the floor designated as described above is in a display range according to the actual arrangement and size, in a display mode according to the detected amount of bacteria.
- an example is shown in which the presence / absence of persons in each area and the number of persons are displayed.
- the presence of a person is displayed using the mark 76 in the same manner as in FIG. 27, and the number of persons in the area is also displayed in the display range indicating the area where the person is detected.
- the presence / absence and number of people in each area can be grasped at a glance together with the positional relationship and size of each area, as well as the air condition of each area on the designated floor.
- FIG. 30 is a diagram showing a third specific example of the display screen in the first display process.
- the state of the air based on the detection result of each environment detection device 100 installed in the area A of 5F is displayed in a position corresponding to each installation position according to the detection result.
- an example in which the distribution of people in the area A on the 5th floor is displayed.
- a position where a person is present is represented by a black circle.
- the adjustment device 400 is displayed together with the air state and the human distribution, and an instruction for the control is accepted. May be.
- the user who saw the display of the air condition and the distribution of people can instruct the driving of the adjusting device 400 installed in the area in consideration of these.
- the adjustment device 400 is an ion generation device
- the air condition in the area is “high” in the amount of bacteria, and there are people in the vicinity
- the user adjusts the adjustment device installed in the area.
- the device 400 or the adjustment device 400 installed in the vicinity of the position where the amount of bacteria is “large” is instructed to increase the air cleaning capability by setting the driving amount to “strong”. be able to.
- the driving amount can be prevented from changing. In this way, it is possible to obtain an optimum driving amount in accordance with the displayed air state and human distribution.
- the CPU of the processing device 300 controls the driving amount of the adjustment device 400 by accepting a selection operation from the user.
- the CPU is based on the air condition and the human distribution obtained from the detection result of the target area based on the correspondence relationship. Then, the drive amount of the adjustment device 400 installed in the area may be determined, and a control signal that will be the drive amount may be transmitted to the adjustment device 400.
- the driving amount of the adjustment device 400 such as an ion generator can be automatically controlled to be a high driving amount when there is a person in the area or when there are more than a predetermined number of people.
- the adjustment device 400 is automatically controlled so as to obtain a better air condition in consideration of these.
- the air state changes, the air state after the change is also displayed, and the user can confirm the effect of the control.
- the air state based on the amount of bacteria is displayed.
- the air state based on other parameters may be displayed, or the air state based on a combination of a plurality of parameters. May be displayed.
- FIG. 31 is a flowchart showing the flow of the second display process in the processing apparatus 300. The operation shown in the flowchart of FIG. 31 is also performed by causing the CPU included in the control unit 310 of the processing device 300 to read out and execute a program stored in the memory 320 and to cause each unit shown in FIG. 27 to function. Realized.
- the flow of the first display process in the processing device 300 according to the second embodiment is the first display in the first embodiment shown in the flowchart of FIG. It is almost the same as the processing flow. Therefore, the difference in operation from the flowchart of FIG. 18 will be described.
- step S105 of the second display process the CPU, as in the first display process, for the area to be displayed, the detection result of the area, the presence / absence of the person represented as the environmental attribute of the area, and the person The display mode is determined based on the number of persons.
- the CPU when it is detected that there is a person in the area as the environmental attribute of the area, the CPU determines that it is the timing to display the detection result of the area. On the other hand, when it is detected that there is no person in the area as the environmental attribute of the area designated as the area to be displayed, it is determined that it is not time to display the detection result of the area.
- step S1061 If it is determined that the display timing has been reached (YES in step S1061), the CPU determines a display device for displaying the detection result of the area in step S1062, and the display device in which the detection result of the area is determined in step S108. Execute the process for displaying on the screen.
- the CPU determines that the display device 350 of the processing device 300 and the display terminal 500 included in the system 1 are display devices that display a display device with the user in the vicinity thereof.
- the position of the display terminal is detected and stored in the processing device 300 by communicating with each other via the network 600.
- the presence / absence of a person for each area is expressed as an environmental attribute of each area from the attribute detection device 200 and transmitted to the processing device 300. Therefore, the CPU of the processing device 300 compares these to determine whether there is a user in the vicinity of the display unit 350 of the processing device 300 and in the vicinity of each display terminal 500 included in the system 1.
- the display terminal 500 and / or the display unit 350 determined to be in the vicinity are determined as a display device that displays the detection result of the area.
- each display terminal 500 itself includes a human sensor such as an infrared sensor, and the detection result is transmitted to the processing device 300, whereby the processing device 300 identifies the display terminal 500 in which the user is in the vicinity. You may be able to do it.
- a human sensor such as an infrared sensor
- the detection result of the area determined to have a person is displayed, and the detection result of the area determined to have no person is not displayed. Further, it is displayed when the user is in the vicinity of the display terminal, and is not displayed when the user is not in the vicinity. For this reason, necessary information is displayed at a necessary timing, and efficient display is realized.
- the CPU of the processing device 300 may determine the display method in consideration of the positional relationship between the display terminal and the person and the state of the display terminal.
- the CPU of the processing device 300 calculates the distance between the position of the display terminal 500 determined to be displayed and the position of the detected person. If the distance is equal to or greater than a predetermined value, in addition to displaying the detection result Then, a control signal for notifying that the display is performed with sound or light may be transmitted to the display terminal 500. By doing so, it is possible to prompt the user who is slightly away from the display terminal 500 to confirm the display, thereby realizing more efficient display.
- a control signal for notifying that there is a detection result that is a display target by sound, vibration, lighting of a lamp, or the like may be transmitted to the display terminal 500.
- display data may be transmitted in response to a request from the display terminal 500.
- the CPU of the processing device 300 may determine the above-described sound, vibration, and lamp lighting mode according to the detection result. Specifically, when the amount of bacteria is “high” rank, or when the distance between the environment detection device 100 and the user is shorter than a predetermined distance, the sound is heard more than otherwise. It can be increased, vibration can be increased, the lamp lighting interval can be shortened, the amount of light can be increased, and the like. By doing in this way, a detection result can be generally grasped
- the detection result of the microorganism sensor 1001 among the microorganism sensor, dust sensor, humidity sensor, temperature sensor, and gas sensor provided in the environment detection apparatus 100 is displayed. That is, the display of the detection result by one type of sensor is described.
- a display method may be employed in which a plurality of parameters that are detection results of the sensors are combined and displayed.
- FIG. 32A shows a display example that displays the amount of bacteria detected by the microorganism sensor 1001 as three parameters. As an example, each of a plurality of colors (red, yellow, and blue) is lit in a single color. An example of displaying with a lamp to turn on is shown.
- a correspondence relationship between the amount of bacteria and the color of the lamp as shown in FIG. 32B is stored in advance.
- the amount of bacteria that is the detection result from 100 is compared with a threshold value, and the color of the lamp is determined with reference to the corresponding relationship.
- FIG. 33A shows an example in which the amount of bacteria detected by the microorganism sensor 1001 and other parameters are displayed as two parameters, and a display example of a combination of the amount of bacteria and humidity is shown as a specific example. Yes.
- This display shows the occurrence probability of mold, and indicates that the higher the meter (longer), the higher the probability of mold occurrence, and the lower (shorter) meter, the lower the probability of mold occurrence.
- a correspondence relationship between the combination of the amount of bacteria and the humidity and the height (length) of the meter as shown in FIG. 33B is stored in advance.
- the CPU refers to the correspondence relationship and determines the height (length) of the meter based on the combination of the amount of bacteria and the humidity that are detection results from the environment detection apparatus 100.
- FIG. 34A shows an example in which the amount of bacteria detected by the microorganism sensor 1001 and other parameters are displayed as two parameters, and a display example of a combination of the amount of bacteria and the amount of dust is shown as a specific example. It represents.
- This display indicates the quality (cleanliness) of the air in the space to be detected. The higher (longer) the meter, the higher the cleanness, and the lower (shorter) the meter, the lower the cleanness.
- a predetermined area of the memory 320 of the processing apparatus 300 has a correspondence relationship between the combination of the amount of bacteria and the amount of dust and the height (length) of the meter as shown in FIG. 34B in advance.
- the CPU determines the height (length) of the meter based on the combination of the amount of bacteria and the amount of dust that are detection results from the environment detection device 100 with reference to the correspondence.
- the correspondence between the combinations of the parameter amounts and the display contents is stored in advance in a predetermined area of the memory 320 of the processing device 300, and the CPU refers to the correspondence relationship to obtain the detection result from the environment detection device 100. This is realized by determining the display contents based on this.
- the display is not limited to the bar-shaped meter as shown in FIGS. 32A to 34B, but may be other shapes.
- an indicator as shown in FIG. 35 may be used, or a pie chart or a line chart may be used.
- the display form is not limited to the display, and an output form such as sound, light, and vibration may be used. In that case, the sound interval and volume, the light emission interval and the light emission amount, and the vibration interval Alternatively, the detection result may be output using a quantity or the like.
- the detection result can be displayed at an appropriate timing according to the display device that displays the detection result, the environmental attribute, and the detection result of the area, that is, the timing when there is a visible user.
- the user can be notified using an appropriate timing at which the state of the air around the user can be visually recognized and an appropriate display device that can be visually recognized.
- the processing device 300 controls the devices included in the system 1 according to the detection result in the environment detection device 100 and the position where the environment detection device 100 is installed. .
- the adjustment apparatus 400 that is an ion generation apparatus and the environment detection apparatus 100 correspond.
- FIG. 36 is a block diagram illustrating a specific example of a functional configuration of the processing device 300 for performing control according to the third embodiment.
- Each function shown in FIG. 36 is mainly formed in the CPU by reading and executing a program stored in the memory 320 by the CPU included in the control unit 310 of the processing device 300.
- the unit may be realized by a hardware configuration such as an electric circuit.
- processing device 300 for performing control accepts input of measurement values and identification information of environment detection device 100 as environment information from environment detection device 100. For receiving the input of information such as the presence / absence / position of a person within the detection target range, the wind direction / volume, and the position of the environment detection device 100 as environment attributes from the attribute detection device 200 and the measurement value input unit 311 Based on the attribute input unit 312 and the input information, a control determination unit 317 for determining the control content of the adjustment device 400 and the environment detection device 100 and a control signal corresponding to the control content are stored in advance. Or an output unit 318 for generating and executing processing for outputting the control signal from the communication unit 330 to the target device.
- a predetermined area of the memory 320 stores a correspondence relationship between a detection result, a device to be controlled, and its control content.
- the parameter used as the detection result may be a single parameter such as the amount of bacteria, or a combination of two or more parameters such as the amount of bacteria and humidity.
- the detection result may be a combination of environment information that is a detection result from the environment detection apparatus 100 and an environment attribute that is a detection result from the attribute detection apparatus 200.
- FIG. 37A and FIG. 37B are diagrams illustrating specific examples of the correspondence relationship between the detection result stored in the predetermined area of the memory 320, the device to be controlled, and the control content thereof.
- the correspondence relationship between the detection result and the control content of the adjustment device 400 when the adjustment device 400 that is an ion generator is a control target is defined.
- the adjustment device 400 is installed, as an example of controlling ON / OFF of a switch (not shown) of the adjustment device 400 that is an ion generator,
- the switch of the adjustment device 400 is turned on, that is, activated when the amount of bacteria is “large”, and is turned off under other conditions.
- adjustment device 400 As another example, there is a person in the area where adjustment device 400 is installed, as a device for controlling the driving amount (air volume) of adjustment device 400 that is an ion generator, and It is stipulated that the air volume is “strong” when the amount of bacteria is “large”, and the air volume is “weak” when the amount of bacteria is “low”.
- FIG. 38 is a flowchart showing the flow of the control operation in the processing device 300 according to the third embodiment.
- the operation shown in the flowchart of FIG. 38 is realized by causing the CPU included in the control unit 310 of the processing device 300 to read and execute a program stored in the memory 320 and to cause each unit shown in FIG. 36 to function. Is done.
- the CPU of processing device 300 accepts input of environment information that is a detection result from environment detection device 100 and environment attributes that are a detection result from attribute detection device 200 (step S301). Based on the correspondence relationship stored in the predetermined area of the memory 320, the device to be controlled and the control content are specified (step S303), and the control content determined for the device to be controlled is determined. A control signal for performing control is output (step S305).
- a detection result having a rank of “large” as the amount of bacteria is obtained as environmental information, and an environmental attribute indicating that there is a person in the area is obtained.
- the CPU turns on the adjustment device 400, which is an ion generator installed in the area, and outputs a control signal for starting the generation of ions to the ion generator.
- a control signal for setting the air volume from the adjustment device 400, which is an ion generator, to “strong” is output to the ion generator.
- the CPU of the processing device 300 communicates with the adjustment device 400 via the network 600 in step S303.
- the installation position of the adjustment device 400 obtained by performing is stored, and the adjustment device 400 to be controlled is specified based on the stored position of the adjustment device 400.
- the device to be controlled may be the environment detection device 100 as described above.
- the environment detection apparatus 100 has a moving mechanism (not shown).
- the moving mechanism for example, a wheel that moves on a rail provided in a room, a lift, or the like is applicable. This movement is performed according to a control signal from the processing device 300.
- the control of the environment detection device 100 for example, when the environment detection device 100 is not installed and the environment information is not obtained for an area where the presence of a person is detected as an environment attribute, the closest to the area For example, the environment detection device 100 installed at the position is specified, and the environment detection device 100 is moved to the area. By doing in this way, it becomes possible to automatically move the environment detection apparatus 100 to the area where the environment information is desired to be obtained, and to obtain the environment information of the area.
- ⁇ Effect of the third embodiment> By performing such control in the system 1 according to the third embodiment, based on the environment information that is the detection result in the environment detection device 100 and the environment attribute that is the detection result in the attribute detection device 200. Therefore, other devices in the corresponding area can be operated so that the air condition in the area is optimum, so that it is possible to detect the presence of a person without operating at unnecessary timing. It can be operated to make the environment clean.
- the message output destination is assumed to be the display unit 350 of the processing device 300.
- the terminal 500 may be used. Further, similarly to the above example, prior to display, it may be displayed by notifying that there is display data by light or sound, and receiving a predetermined operation.
- FIG. 39 is a block diagram illustrating a specific example of a functional configuration of the processing device 300 for performing the display processing according to the fourth embodiment.
- Each function shown in FIG. 39 is mainly formed in the CPU when the CPU included in the control unit 310 of the processing device 300 reads and executes a program stored in the memory 320.
- the unit may be realized by a hardware configuration such as an electric circuit.
- a processing device 300 for performing display processing inputs a measurement value and identification information of the environment detection device 100 as environment information from the environment detection device 100.
- a measurement value and identification information of the environment detection device 100 as environment information from the environment detection device 100.
- display determination unit 319 for determining message contents based on the input information
- display processing unit for executing processing for displaying the determined message on display unit 350 and the like 315.
- a predetermined area of the memory 320 stores a correspondence relationship between a combination of environment information and environment attributes, which are detection results, and message contents.
- the parameter used as the detection result may be a single parameter such as the amount of bacteria, or a combination of two or more parameters such as the amount of bacteria and humidity.
- the environment attribute parameter may also be a single parameter such as the presence or absence of a person, or a combination of two or more parameters such as the presence or absence of a person and the air volume.
- FIG. 40 is a diagram showing a specific example of a correspondence relationship between a combination of environment information and environment attributes stored in a predetermined area of the memory 320 and message contents.
- the environmental information includes a combination of a parameter of the amount of bacteria and other parameters (dust, pollen, smell, temperature, humidity, etc.), and environmental attributes such as human distribution (presence / absence) and A message corresponding to the combination with the distance to the environment detection apparatus 100 is defined.
- the detection result from the microorganism sensor 1001 of the environment detection apparatus 100 is a rank of “high” in the amount of bacteria, and from other sensors.
- the amount (the amount of dust, pollen, and gas) represented by the detection result is “large”, there is a person in the area, and the distance from the person's position to the position of the environment detection device 100 is greater than the specified distance. If it is too short (close), the message contents “Be careful about ambient air and be careful” and “Beware of germs / mold” are specified.
- the distance from the person's position to the position of the environment detection device 100 is longer (far) than the specified distance, the message content “There is a contaminated area in the room” is specified.
- the amount (the amount of dust, pollen, gas) represented by the detection results from other sensors is “low”, there is a person in the area, and the distance from the position of the person to the position of the environment detection device 100 Is shorter (closer) than the specified distance, the message content “Beware of germs / molds” is specified. Further, when the distance from the person's position to the position of the environment detection device 100 is longer (far) than the specified distance, the message content “There is a possibility of occurrence of germs / mold in the room” is specified. .
- the message content “Comfortable environmental condition” is specified.
- the message content “The indoor environment is a comfortable environment state” is specified.
- the temperature and humidity may be further used as environmental information parameters, and the message may be defined by a combination of the season and the like as other information.
- the message content is stored in a predetermined area of the memory 320 in advance, but may be input or changed by a predetermined operation.
- the CPU of the processing device 300 accepts input of environment information that is a detection result from the environment detection device 100 and an environment attribute that is a detection result from the attribute detection device 200, and based on them, a predetermined area of the memory 320
- the message content is specified with reference to the correspondence relationship stored in the message, and the process for displaying the determined message on the display unit 350 is executed.
- the CPU of the processing device 300 calculates the distance between them based on the position of the person detected by the attribute detection device 200 and the position of the environment detection device 100. Then, by comparing the distance with a threshold value stored in advance, it is determined whether the distance is “near” or “far”.
- the processing device 300 is installed in the vicinity of the position of the user detected by the environment detection device 100 by performing the same processing as the processing described in the second embodiment (or the relevant device).
- the display terminal 500 (which the user carries) may be specified, and a message may be displayed on the display terminal 500. In that case, as shown in the example of FIG. 40, when it is detected that there is no person in the display target area, the message may not be displayed.
- the position of the environment detection device 100 is detected by the attribute detection device 200 and sent to the processing device 300 as an environment attribute, and the positions of the attribute detection device 200 and the display terminal 500 are detected by the processing device 300. Yes.
- the attribute detection device 200 may detect the positions of the environment detection device 100, the attribute detection device 200, and the display terminal 500 and send them to the processing device 300.
- at least one of the environment detection device 100, the attribute detection device 200, and the display terminal 500 stores its own installed position, and the identification information for specifying the position together with its own identification information is a processing device. You may make it transmit to 300.
- identification information may be transmitted together with the detection result, for example, or may be transmitted in response to a request from the processing apparatus 300.
- the identification information for specifying the position is, for example, information (latitude / longitude, living room on the first floor, etc.) indicating a specific installed position, a network address for communication on the network 600, and the like. Also good.
- a program for causing a computer to execute the processing in the processing device 300 can also be provided.
- a program is a flexible disk attached to the computer, a CD-ROM (Compact Disk-Read Only).
- the program can be provided by being recorded on a computer-readable recording medium such as a memory (ROM), a read only memory (ROM), a random access memory (RAM), and a memory card.
- the program can be provided by being recorded on a recording medium such as a hard disk built in the computer.
- a program can also be provided by downloading via a network.
- the program according to the present invention is a program module that is provided as a part of a computer operating system (OS) and calls necessary modules in a predetermined arrangement at a predetermined timing to execute processing. Also good. In that case, the program itself does not include the module, and the process is executed in cooperation with the OS. A program that does not include such a module can also be included in the program according to the present invention.
- OS computer operating system
- the program according to the present invention may be provided by being incorporated in a part of another program. Even in this case, the program itself does not include the module included in the other program, and the process is executed in cooperation with the other program. Such a program incorporated in another program can also be included in the program according to the present invention.
- the provided program product is installed in a program storage unit such as a hard disk and executed.
- the program product includes the program itself and a recording medium on which the program is recorded.
Landscapes
- Chemical & Material Sciences (AREA)
- Life Sciences & Earth Sciences (AREA)
- Engineering & Computer Science (AREA)
- Health & Medical Sciences (AREA)
- Medicinal Chemistry (AREA)
- Food Science & Technology (AREA)
- Combustion & Propulsion (AREA)
- Physics & Mathematics (AREA)
- Analytical Chemistry (AREA)
- Biochemistry (AREA)
- General Health & Medical Sciences (AREA)
- General Physics & Mathematics (AREA)
- Immunology (AREA)
- Pathology (AREA)
- User Interface Of Digital Computer (AREA)
Abstract
処理装置は、空気の状態を検出するためのセンサを含んだ検出装置からの検出結果の入力を受け付けるための測定値入力部(311)と、検出装置の設置された位置を特定する情報を含む環境属性の入力を受け付けるための属性入力部(312)と、表示画面を表示部(350)に表示させるための表示処理部(315)とを含み、表示処理部は、検出結果を検出装置の位置に応じて表示する表示画面用の表示データを生成して表示部(350)に送信する。
Description
この発明は制御装置および提示方法に関し、特に、検出装置での検出結果の提示を制御する制御装置およびその提示方法に関する。
空気の状態を検出して表示する技術として、たとえば、特開平5-142173号公報(以下、特許文献1)は、塵埃、炭酸ガス濃度などを検知するための汚染センサで検出動作を行ない、その結果に対して基準値を用いて判定することで、つまり、温度、湿度を用いて補正処理を行なって、室内の汚染状況を自動的に分析する装置を開示している。
また、特表2009-529684号公報(以下、特許文献2)は、複数の環境パラメータの相互関係を考慮し、テーブルに基づいて空気の質のレベルを判定し、レベルに対応したメッセージを表示する技術を開示している。特許文献2では、たとえば、粉塵レベルが高く、かつ、温暖で湿潤な環境であれば、空気中の菌が多いことが予測されるなどの相互関係と、たとえば、温度が25~35℃で揮発性有機化合物レベルが600μg/m3より高い、などの複数の環境パラメータの条件の組み合わせとを予め記憶しておき、これらに基づいて、「潜在的な問題:高レベルなホルムアルデヒド、問題に対応する推奨事項:窓をあけてください」などの環境の状態に対して適切なメッセージをユーザに提示する。
しかしながら、特許文献1に開示された技術は空気中の菌の量を検出する技術ではないため、空気の汚染度の状態が正しく判定されない場合もある、という問題がある。
一方、特許文献2の技術では複数の環境パラメータを組み合わせて用いるために空気中の菌が多いことは予測され得る。しかしながら、特許文献2では実際に菌の量を検出するものではなく、複数の環境パラメータの相互関係に基づいた予測であるため、やはり、空気の汚染度の状態が正しく判定されない場合もある、という問題がある。
さらに、特許文献2の技術では、検出対象のエリアの状態を考慮して総合的に空気の汚染度の状態を判定することができない、という問題もある。
本発明はこのような問題に鑑みてなされたものであって、適切に空気の状態を提示することができる制御装置および提示方法を提供することを目的としている。
上記目的を達成するために、本発明のある局面に従うと、制御装置は、空気の状態を検出するためのセンサを含んだ検出装置と接続され、検出装置での検出結果を提示するための制御装置であって、検出装置から検出結果を含む情報を取得するための第1の取得部と、検出装置の位置を特定する情報を取得するための第2の取得部と、第1の取得部で取得した情報を第2の取得部で取得した検出装置の位置に基づいて提示するための提示部とを備える。
好ましくは、制御装置は検出装置の位置するエリアを特定するための識別情報を取得するための第3の取得部をさらに備え、提示部は検出結果をエリアに対応づけて提示する。
より好ましくは、第1の取得部は、検出装置からの異なる位置での検出結果を取得し、提示部は、検出装置のそれぞれの位置するエリアごとに、当該エリアの空気の状態の検出結果として提示用のデータを生成する。
好ましくは、提示部は、1つの画面に異なる複数のエリアのそれぞれの空気の状態を表示することで第1の取得部で取得した情報を提示する。
好ましくは、提示部は、エリアごとの領域で表示することで第1の取得部で取得した情報を提示し、制御装置は検出結果とエリアの表示態様との対応関係を記憶するための第1の記憶部をさらに備え、提示部は、検出結果に基づいて、検出装置の位置するエリアの表示領域の表示態様を決定する処理をさらに実行する。
好ましくは、提示部は、表示画面において、複数のエリアを含んだ領域の空気の状態の検出結果を表示する第1の画面と、前記エリアごとの空気の状態の検出結果を表示する第2の画面とを表示することで第1の取得部で取得した情報を提示する。
好ましくは、第1の取得部は検出装置からの同じエリア内における異なる位置での検出結果を取得し、提示部は、エリアの空気の状態の検出結果として、エリアにおける異なる位置のそれぞれの位置の検出結果を提示する。
好ましくは、制御装置は、ユーザの位置を特定する情報を取得するための第4の取得部と、ユーザの位置および検出装置の位置の間の距離と空気の状態を表わす表示内容との対応関係を記憶するための第2の記憶部とをさらに備え、提示部は、ユーザの位置と検出装置の位置との間の距離を算出する処理と、その距離に基づいて提示内容を特定する処理とをさらに実行する。
好ましくは、提示部は、検出装置からの検出結果を表わす提示と、ユーザの位置と検出装置の位置との間の距離を表わす提示と、その距離に応じて検出装置からの検出結果を表わす提示とを行なう。
好ましくは、検出装置は風向および風力をさらに検出し、提示部は、風力の検出装置とユーザとの方向に水平な成分を算出する処理をさらに実行し、提示部は表示画面に、検出された風力のうちの検出装置とユーザとの方向に水平な成分を併せて表示させる。
好ましくは、制御装置は複数の提示装置に接続され、複数の提示装置のそれぞれの位置を特定する情報を取得するための第5の取得部をさらに備え、提示部は、複数の提示装置のうち、ユーザの位置に最も近い提示装置を特定する処理と、ユーザの位置に最も近い提示装置に対して提示用のデータを送信して提示を行なわせる処理とをさらに実行する。
本発明の他の局面に従うと、提示方法は空気の状態を検出するためのセンサを含んだ検出装置における検出結果を表示装置に提示する方法であって、検出装置から検出結果を含む情報を取得するステップと、検出装置の位置を特定する情報を取得するステップと、検出装置から取得した検出結果を含む情報を検出装置の位置に基づいて提示するステップとを備える。
好ましくは、提示方法は検出装置の位置するエリアを特定するための識別情報を取得するステップをさらに備え、提示するステップは、検出結果をエリアに対応づけて提示する。
好ましくは、提示方法はユーザの位置を特定する情報を取得するステップをさらに備え、提示するステップは、ユーザの位置と検出装置の位置との間の距離を算出するステップと、予め記憶している、ユーザの位置および検出装置の位置の間の距離と空気の状態を表わす表示内容との対応関係に従って、その距離に基づいて提示内容を特定するステップとを含む。
本発明のさらに他の局面に従うと、制御装置は、検出対象空間内の空気の状態を検出するためのセンサを含んだ第1の検出装置と、検出対象空間内の人の有無を検知するためのセンサを含んだ第2の検出装置と接続された制御装置であって、第1の検出装置および第2の検出装置から検出結果を含む情報を取得するための第1の取得部と、第1の検出装置および第2の検出装置の位置を特定する情報を取得するための第2の取得部と、第1の取得部で得られた第1の検出装置での検出結果および第2の検出装置での検出結果を、第2の取得部で得られたそれぞれの検出装置の位置に応じて提示するための制御部とを備え、制御部は、第1の検出装置および第2の検出装置の位置するエリアを特定し、エリアごとに第1の検出装置および第2の検出装置の検出結果を提示する。
好ましくは、制御装置は第1の検出装置での検出結果と提示態様との対応関係を記憶するための第2の記憶部をさらに備え、制御部は、第1の検出装置での検出結果の提示態様を決定する処理をさらに実行する。
好ましくは、制御部は、エリアごとの当該エリアの空気の状態の検出結果の提示用のデータを生成し、人がいることが検出されたエリアについての提示するためのデータを提示装置に対して送信して提示させる。
好ましくは、制御装置は提示装置の位置を特定する情報を取得するための第3の取得部をさらに備え、制御部は、提示装置の位置から所定範囲内に人がいると判断された場合に、提示装置に対して提示用のデータを送信して提示させる。
好ましくは、第2の検出装置からの検出結果には検出対象空間内の人数も含まれ、制御部は、第2の検出装置からの検出結果として、エリアごとの人の有無と、当該エリアで検出された人数とを提示させる。
好ましくは、制御部は、提示装置の位置から所定範囲内に人がいると判断され、かつ、提示装置から人までの距離が所定距離以上と判断された場合に、提示装置に対して提示用のデータに併せて報知動作を行なわせるための制御信号を出力する。
好ましくは、制御部は、提示装置の位置から所定範囲内に人がいると判断され、かつ、提示装置が直ちに操作入力を受け付けるモードでないと判断された場合に、提示装置に対して提示用のデータに併せて報知動作を行なわせるための制御信号を出力する。
好ましくは、制御部は、1つの画面に異なる複数のエリアのそれぞれの空気の状態を表示することで検出結果を提示する。
本発明のさらに他の局面に従うと、提示方法は、検出対象空間内の空気の状態を検出するためのセンサを含んだ第1の検出装置と、検出対象空間内の人の有無を検知するためのセンサを含んだ第2の検出装置とでの検出結果を提示する方法であって、第1の検出装置および第2の検出装置から検出結果を含む情報を取得するステップと、第1の検出装置および第2の検出装置の位置を特定する情報を取得するステップと、第1の検出装置での検出結果および第2の検出装置での検出結果をそれぞれの検出装置の位置に応じて提示するステップとを備え、提示するステップは、第1の検出装置および第2の検出装置の位置するエリアを特定するステップと、エリアごとに第1の検出装置および第2の検出装置の検出結果を提示するステップとを含む。
本発明のさらに他の局面に従うと、制御装置は対象空間内の空気の状態を調整するための調整機構を含む調整装置に接続される制御装置であって、検出対象空間内の空気の状態を検出するためのセンサを含む第1の検出装置と、検出対象空間内の人の有無を検知するためのセンサを含む第2の検出装置とから検出結果の入力を含む情報を取得するための第1の取得部と、第1の取得部で取得された情報に基づいて調整装置を制御するための制御部とを備える。
好ましくは、制御装置は、第1の検出装置および第2の検出装置の位置を特定する情報を取得するための第2の取得部と、制御単位となるエリアを特定する情報を記憶するための記憶部とを備え、制御部は、同一のエリア内に位置する第1の検出装置からの検出結果および第2の検出装置からの検出結果の組み合わせに基づいて調整装置を制御する。
好ましくは、制御装置は調整装置の位置を特定する情報を取得するための第3の取得部をさらに備え、制御部は、それぞれ調整装置と同一のエリア内に位置する第1の検出装置からの検出結果および第2の検出装置からの検出結果の組み合わせに基づいて調整装置を制御する。
好ましくは、第1の検出装置は空気中の微生物を検出するための検出装置であって、調整装置は空気清浄機であって、制御部は、第1の検出装置によって検出された微生物の量がしきい値よりも多く、かつ第2の検出装置によって人がいると検出された場合には、予め記憶している、第1の検出装置の検出結果、第2の検出装置の検出結果、および調整装置の駆動の対応関係に従って調整装置の駆動をONにし、それ以外の場合には調整装置の駆動をOFFする。
好ましくは、第1の検出装置は空気中の微生物を検出するための検出装置であって、調整装置は空気清浄機であって、制御部は、第1の検出装置によって検出された微生物の量がしきい値よりも多く、かつ第2の検出装置によって人がいると検出された場合には、予め記憶している、第1の検出装置の検出結果、第2の検出装置の検出結果、および調整装置の駆動の対応関係に従って調整装置の駆動量を規定量よりも大きい量とし、それ以外の場合には調整装置の駆動量を規定量よりも小さい量とする。
本発明のさらに他の局面に従うと、制御方法は対象空間内の空気の状態を調整するための調整機構を含む調整装置を制御する制御方法であって、検出対象空間内の空気の状態を検出するためのセンサを含む第1の検出装置と、検出対象空間内の人の有無を検知するためのセンサを含む第2の検出装置とから検出結果の入力を含む情報を取得するステップと、取得された情報に基づいて調整装置を制御するステップとを備える。
本発明のさらに他の局面に従うと、制御装置は、検出対象空間内の空気の状態を検出するためのセンサを含んだ第1の検出装置からの検出結果を含む入力情報と、検出対象空間内の人の有無を検知するためのセンサを含んだ第2の検出装置からの検出結果を含む入力情報とに基づいた情報の提示を制御するための制御部を備える。
好ましくは、制御装置は、第1の検出装置と通信するための第1の通信部と、第2の検出装置と通信するための第2の通信部とをさらに備える。
好ましくは、制御装置は、第1の検出装置および第2の検出装置の位置を特定する情報を取得するための第1の取得部と、制御単位となるエリアを特定する情報を記憶するための記憶部とをさらに備え、制御部は、同一のエリアに位置する第1の検出装置からの検出結果および第2の検出装置からの検出結果との組み合わせに基づいて提示の内容を決定するための決定部を含む。
好ましくは、決定部は、予め記憶されている、第1の検出装置の検出結果、第2の検出装置の検出結果である人の有無、および第2の検出装置で検出された人の位置と第1の検出装置の設置された位置との間の距離の組み合わせと提示の内容との対応関係に基づいて提示の内容を決定し、制御部は、第2の検出装置で検出された人の位置と第1の検出装置の設置された位置との間の距離を算出する処理をさらに実行する。
好ましくは、第1の検出装置は、検出対象空間内の空気の状態を検出するためのセンサとして複数のセンサを含んで、第1の検出装置での検出結果には複数のセンサのそれぞれでの検出結果が含まれ、決定部は、予め記憶されている、第1の検出装置の検出結果である複数のセンサのそれぞれでの検出結果の組み合わせと第2の検出装置の検出結果との組み合わせと、提示の内容との対応関係に基づいて提示の内容を決定する。
好ましくは、制御部は、第2の検出装置において人がいることが検出されたエリアについて情報の提示を実行する。
好ましくは、制御装置は情報の提示を行なう提示装置の位置を特定する情報を取得するための第2の取得部をさらに備え、制御部は、第2の検出装置によって検出された人から所定範囲内にある提示装置に情報の提示をさせる。
本発明のさらに他の局面に従うと、提示方法は、検出対象空間内の空気の状態を検出するためのセンサを含んだ第1の検出装置と、検出対象空間内の人の有無を検知するためのセンサを含んだ第2の検出装置とでの検出結果に基づいた情報を提示する方法であって、第1の検出装置および第2の検出装置から検出結果を含む入力情報を受け付けるステップと、記憶されている、第1の検出装置の検出結果および第2の検出装置の検出結果の組み合わせと提示の内容との対応関係に従って、第1の検出装置からの検出結果と第2の検出装置からの検出結果との組み合わせに基づいて提示の内容を決定するステップと、決定された内容を提示させるための処理を実行するステップとを備える。
この発明によると、適切に空気の状態を提示することができる。
以下に、図面を参照しつつ、本発明の実施の形態について説明する。以下の説明では、同一の部品および構成要素には同一の符号を付してある。それらの名称および機能も同じである。
<システム構成>
図1は、本実施の形態にかかる環境検出システム(以下、システムと略する)1の構成の具体例を示す図である。
図1は、本実施の形態にかかる環境検出システム(以下、システムと略する)1の構成の具体例を示す図である。
図1を参照して、システム1は、有線または無線のネットワーク600で接続された、環境情報を取得するための複数の環境検出装置100A,100B,…と、環境属性を検出するための属性検出装置200と、表示部を備えた処理装置300と、環境を調整するための調整装置400と、表示部550を有する表示端末500とを含む。なお、上記複数の環境検出装置100A,100B,…を代表させて環境検出装置100と称する。
表示端末500として、複数の表示端末500A,500B,…が含まれてもよい。この場合、これら複数の表示端末500A,500B,…を代表させて表示端末500と称する。
環境検出装置100は、各々、環境情報を取得するための、複数のセンサを含む。環境情報とは測定対象の空間の空気の状態を決定付けるパラメータの量を表わす情報を指し、たとえば、測定対象の空間の空気中の微生物量、埃量、湿度、温度、においの原因となるガス量、などが相当する。そのため、後述するように、環境検出装置100は、各々、微生物センサ、埃センサ、湿度センサ、温度センサ、においの原因となるガスセンサ、などを含む。
複数の環境検出装置100A,100B,…は、各々、様々な異なる位置に設置されることが想定される。たとえば、複数の部屋を有する空間である場合に、部屋ごとに設置されてもよいし、複数フロアを有する空間である場合に、フロアごとに設置されてもよい。
環境属性は、測定対象の空間の空気の状態に影響を与えるパラメータを指し、たとえば、測定対象の空間の人・物の有無やその位置、風向や風力などが該当する。そのため、後述するように、属性検出装置200は、赤外線センサ、超音波センサ、可視光センサ、圧力センサ、温度センサなどである、人感センサ、風向センサ、風力センサなどを含む。
さらに、環境属性には、対象の空間内での環境検出装置100の位置が含まれる。属性検出装置200において環境検出装置100の位置を取得するための機能として、環境検出装置100と属性検出装置200とは、それぞれ、これらの間で無線通信を行なうための通信機能を備える。この無線通信はBluetooth(登録商標)やWifi(登録商標)などの電波を利用した通信や赤外線通信などが該当する。属性検出装置200は所定の通信範囲内に対して応答要求をマルチキャスト出力し、当該通信範囲内にある環境検出装置100が当該応答要求を受信してそれに対して自身を特定する識別情報と共に応答する。属性検出装置200において通信を用いて環境検出装置100の位置を特定する方法はこの方法には限定されない。これら装置間の通信が確立することによって属性検出装置200側で所定範囲内にある環境検出装置100が特定される方法であれば、他の方法が採用されてもよい。
以降の説明においては、属性検出装置200は、環境属性として、検出対象範囲内の人の有無・その位置、風向・風量、および環境検出装置100の位置を検出し、環境属性として処理装置300に送信するものとする。
処理装置300は、属性検出装置200とネットワーク600を介して相互に通信することで、属性検出装置200が設置されている位置を特定し、記憶しておく。他の方法として、GPS(Global Positioning System)や、PlaceEngine(登録商標)などと呼ばれる、通信電波を用いた位置情報を提供するサービスを利用して属性検出装置200の位置を特定したり、画像処理で当該属性検出装置200の識別画像を特定することで位置を特定したりしてもよい。属性検出装置200の設置される位置が固定されている場合、設置位置が予め処理装置300に登録されていてもよい。なお、処理装置300における上述の位置の特定方法は、他の装置の位置を特定する場合も同様とする。
処理装置300は、少なくとも、通信機能と表示部と演算装置とを備えていれば、どのような装置で構成されてもよい。一例として、一般的なパーソナルコンピュータで構成されていてよい。処理装置300は環境検出装置100からのセンサ信号をネットワーク600を介して受信し、それを、後述する表示部で表示するための処理を行なう。
調整装置400は、対象の空間の空気の状態を決定付けるパラメータの量を調整するための装置であって、たとえば、加湿・除湿機やイオン発生装置などが該当する。
表示端末500は少なくとも表示機能と通信機能とを有する装置であればどのような装置であってもよく、携帯電話機や電子書籍閲覧端末やパソコン(PC)やテレビジョン受像機、などが該当する。処理装置300は、表示端末500とネットワーク600を介して相互に通信することで、それらが設置されている位置を特定し、記憶しておく。テレビジョン受像機のように設置される位置が原則固定される装置である場合、設置位置が予め処理装置300に登録されていてもよい。さらに、処理装置300は、表示端末500とユーザとの対応関係を記憶していてもよい。
ネットワーク600は、LAN(Local Area Network)、無線LANなどの専用回線を用いた通信を利用するネットワークや、インターネットなどの公衆回線を用いた通信を利用するネットワークなどであってもよいし、無線通信などを用いて直接通信するものであってもよい。
<装置構成>
図2は、環境検出装置100の構成の具体例を示すブロック図である。
図2は、環境検出装置100の構成の具体例を示すブロック図である。
図2を参照して、環境検出装置100は、環境情報を取得するセンサとしての、微生物センサ1001、埃センサ1002、湿度センサ1003、温度センサ1004、およびガスセンサ1005と、図示しないCPU(Central Processing Unit)を含んで、装置全体を制御するための制御部110と、CPUで実行されるプログラムやセンサからのセンサ信号や自身の識別情報などを記憶するためのメモリ120と、ネットワーク600を介して他の装置と通信するための第1通信部130と、属性検出装置200と無線通信するための第2通信部140とを含む。各センサの詳細な構成については後述する。
さらに図2を参照して、環境検出装置100の制御部110は、各センサからの信号を処理するための機能である信号処理部30と、当該信号に基づいて検出対象のパラメータ量を算出する処理を実行するための機能である測定検出部40と、検出結果である算出されたパラメータ量を環境情報として、予め記憶している自身の識別情報や名称やネットワークのアドレスなどの属性情報と共に処理装置300に対して送信するための機能である送信処理部111と、属性検出装置200からの要求に応じて予め記憶している自身の識別情報を属性検出装置200に対して送信するための応答部112とを含む。これらは、制御部110に含まれるCPUがメモリ120に記憶されるプログラムを読み込んで実行することで、主にCPUで形成される機能であるが、少なくとも一部が電気回路などのハードウェアで構成されてもよい。
図3は、属性検出装置200の構成の具体例を示すブロック図である。
図3を参照して、属性検出装置200は、赤外線センサや超音波センサや圧力センサなどであって、検出対象領域内に人の有無を検出するための人感センサ2001および風向や風力を検出するための風向・風力センサ2002と、図示しないCPUを含んで装置全体を制御するための制御部210と、CPUで実行されるプログラムやセンサからのセンサ信号などを記憶するためのメモリ220と、ネットワーク600を介して他の装置と通信するための第1通信部230と、環境検出装置100と無線通信するための第2通信部240とを含む。
図3を参照して、属性検出装置200は、赤外線センサや超音波センサや圧力センサなどであって、検出対象領域内に人の有無を検出するための人感センサ2001および風向や風力を検出するための風向・風力センサ2002と、図示しないCPUを含んで装置全体を制御するための制御部210と、CPUで実行されるプログラムやセンサからのセンサ信号などを記憶するためのメモリ220と、ネットワーク600を介して他の装置と通信するための第1通信部230と、環境検出装置100と無線通信するための第2通信部240とを含む。
さらに、図3を参照して、属性検出装置200の制御部210は、人感センサ2001からのセンサ信号に基づいて人の有無およびその位置を検出するための機能である人検出部211と、風向・風力センサ2002からのセンサ信号に基づいて風向・風力を検出するための機能である風向・風力検出部212と、第2通信部240での通信結果に基づいて環境検出装置100の位置を検出するための機能である装置検出部213とを含む。これらは、制御部210に含まれるCPUがメモリ220に記憶されるプログラムを読み込んで実行することで、主にCPUで形成される機能であるが、少なくとも一部が電気回路などのハードウェアで構成されてもよい。
人検出部211は、人感センサ2001からのセンサ信号に基づいて当該属性検出装置200の位置からの人の相対的な位置を特定し、それを環境属性として処理装置300に送信する。
または、属性検出装置200がGPSを利用して自身の位置情報を取得したり、PlaceEngine(登録商標)などと呼ばれる、通信電波を用いた位置情報を提供するサービスを利用して位置情報を取得したり、予め自身の位置が入力されたりして、自身の位置情報がメモリ220に記憶されている場合、人検出部211は、自身の位置情報に基づいて相対的な位置が検出された当該人の位置を算出し、その位置情報を環境属性としてもよい。
装置検出部213は、第2通信部240での通信結果に基づいて、つまり、第2通信部240で環境検出装置100との通信が確立した場合に、第2通信部240での通信強度などに基づいて当該環境検出装置100の位置を特定して、受信した当該環境検出装置100の識別情報と共に、その位置を環境属性として処理装置300に送信する。このとき、同様に、属性検出装置200が自身の位置を予め記憶している場合には、自身の位置から当該環境検出装置100の位置を算出し、その位置情報を環境属性としてもよい。
図4Aは、処理装置300の構成の具体例を示すブロック図である。処理装置300は、上述のように、一般的なパーソナルコンピュータで構成されるものとする。そのため、図4Aに示されるような、一般的なパーソナルコンピュータの構成を有する。
すなわち、図4Aを参照して、処理装置300は、図示しないCPUを含んで装置全体を制御するための制御部310と、CPUで実行されるプログラムやセンサからのセンサ信号や表示処理に必要な情報などを記憶するためのメモリ320と、ネットワーク600を介して他の装置と通信するための通信部330と、表示部350とを含む。
図4Bは、調整装置400の構成の具体例を示すブロック図である。調整装置400は、上述のように、対象の空間の空気の状態を決定付けるパラメータの量を調整するための機能として、たとえば、温度や湿度を調整する機能やイオンを発生させる機能を有する。
すなわち、図4Bを参照して、調整装置400は、図示しないCPUを含んで装置全体を制御するための制御部410と、CPUで実行されるプログラムやセンサからのセンサ信号や表示処理に必要な情報などを記憶するためのメモリ420と、ネットワーク600を介して他の装置と通信するための通信部430と、調整部460とを含む。本例では、調整装置400はイオンを発生させる機能を有するものとし、調整部460がイオン発生部とする。イオン発生部である調整部460の詳細な構成については後述する。
<微生物センサの構成>
(微生物センサ1001の第1の例)
図5は、微生物センサ1001の第1の例の構成の具体例を示す図である。第1の例による微生物センサ1001は、空気中を浮遊する粒子を帯電させて静電力を利用して電極に吸着させ、当該電極の加熱前後の蛍光量の差に基づいて、当該粒子中の微生物を検出する。
(微生物センサ1001の第1の例)
図5は、微生物センサ1001の第1の例の構成の具体例を示す図である。第1の例による微生物センサ1001は、空気中を浮遊する粒子を帯電させて静電力を利用して電極に吸着させ、当該電極の加熱前後の蛍光量の差に基づいて、当該粒子中の微生物を検出する。
図5を参照して、第1の例による微生物センサ1001は、外部空気を導入するための導入孔10および排出孔11が設けられたケース5を有し、ケース5内に導入孔10から外部空気を導入するための空気導入機構50を含む。空気導入機構50で導入する空気の流速は、好ましくは、1L(リットル)/minから50m3/minである。
また、環境検出装置100の制御部110には、図2に示されたように、微生物センサ1001からの信号を処理するための機能である信号処理部30と、当該信号に基づいて微生物量を算出する処理を実行するための機能である測定検出部40とが含まれる。これら機能については、後に機能ブロック図を用いて説明する。
微生物センサ1001は、検出機構と捕集機構と加熱機構とを含む。図5は、捕集機構の一例として、放電電極17、捕集治具12、および高圧電源2を含むものを示している。放電電極17は高圧電源2の負極に電気的に接続される。高圧電源2の正極は接地される。これにより、導入された空気中の浮遊粒子は放電電極17付近にて負に帯電される。捕集治具12は、導電性の透明の皮膜3を有する、ガラス板などからなる支持基板4である。皮膜3は、接地される。これにより、負に帯電された空気中の浮遊粒子は静電気力で捕集治具12の方向に移動して導電性の皮膜3に吸着されることで、捕集治具12上に捕集される。
検出機構は、光源である発光素子6と、発光素子6の照射方向に備えられ、発光素子6からの光を平行光にする、または所定幅とするためのレンズ(またはレンズ群)7と、アパーチャ13と、受光素子9と、受光素子9の受光方向に備えられ、捕集機構により捕集治具12上に捕集された浮遊微粒子に発光素子6から照射することにより生じる蛍光を受光素子9に集光するための集光レンズ(またはレンズ群)8と、照射光が受光素子9に入り込むのを防ぐためのフィルタ(またはフィルタ群)14とを含む。これらの構成は、従来技術を応用できる。
発光素子6は、半導体レーザまたはLED素子を含む。波長は、微生物を励起して蛍光を発させるものであれば、紫外または可視いずれの領域の波長でもよい。好ましくは、特表2008-508527号公報に開示されているように、微生物中に含まれ、蛍光を発するトリプトファン、NaDH、リボフラビン等が効率よく励起される300nmから450nmである。受光素子9は、従来用いられている、フォトダイオード、イメージセンサなどが用いられる。レンズ7とアパーチャ13との組み合わせにより、発光素子6の発光は捕集治具12の表面に照射され、捕集治具12上に照射領域15を形成する。
加熱機構は、測定検出部40に電気的に接続され、測定検出部40によって加熱量(加熱時間、加熱温度等)が制御されるヒータ91を含む。ヒータ91としては、好適にはセラミックヒータが用いられる。
図5、図6A、および図6Bを用いて、発光素子6および受光素子9の配置の一例について説明する。図6Aは、微生物センサ1001を図5のA-A位置から矢印の方向に見た断面図であり、図6Bは、図6AのB-B位置から矢印の方向に見た断面図である。なお、説明の便宜上、これらの図には捕集治具12以外の収集機構は示されていない。
図6Aを参照して、発光素子6およびレンズ7と、受光素子9および集光レンズ8とは、図5の矢印A方向(上面)から見て直角または略直角に設けられる。発光素子6からレンズ7およびアパーチャ13を通って捕集治具12表面に形成される照射領域15からの反射光は、入射光に沿った方向に向かう。そのため、この構成とすることで、反射光が直接受光素子9に入らない。なお、捕集治具12表面からの蛍光は等方的に発光するので、反射光および迷光の受光素子9への入射を抑えられる配置であれば、図示された配置には限定されない。
より好ましくは、捕集治具12は、照射領域15に対応する表面に捕集した粒子からの蛍光を受光素子9に集めるための構成を備える。該構成は、図6Bを参照して、たとえば球面状の窪み51が該当する。さらに、捕集治具12は、好ましくは、受光素子9に捕集治具12表面が相対するよう、受光素子9に向かう方向に角度θだけ傾けて設けられる。この構成により、球面状の窪み51内の粒子から等方的に発光した蛍光が球面表面で反射して受光素子9方向に集められる効果があり、受光信号を大きくできるメリットがある。窪み51の大きさは限定されないが、好ましくは、照射領域15よりも大きい。
再び図5を参照して、受光素子9は信号処理部30に接続されて、受光量に比例した電流信号を信号処理部30に対して出力する。従って、導入された空気中に浮遊し、捕集治具12表面に捕集された粒子に発光素子6から光が照射されることによって該粒子から発光された蛍光は、受光素子9において受光され、信号処理部30においてその受光量が検出される。
さらに、ケース5の導入孔10および排出孔11には、それぞれ、シャッタ16A,16Bが設置される。シャッタ16A,16Bは、それぞれ測定検出部40に接続され、その開閉が制御される。シャッタ16A,16Bが閉塞されることでケース5内への空気の流入および外部光の入射が遮断される。測定検出部40は、後述する蛍光測定時にシャッタ16A,16Bを閉塞し、ケース5内への空気の流入および外部光の入射を遮断する。これにより、蛍光測定時には捕集機構での浮遊粒子の捕集が中断される。また、蛍光測定時に外部光のケース5内への入射が遮断されることで、ケース5内の迷光が抑えられる。なお、シャッタ16A,16Bのうちのいずれか一方、たとえば、少なくとも排出孔11のシャッタ16Bのみが備えられてもよい。
第1の例による微生物センサ1001における検出原理について説明する。
特表2008-508527号公報にも開示されているように、空気中に浮遊する微生物に紫外光または青色光を照射すると蛍光を発することは、従来から知られている。しかし、空気中には化学繊維の埃など同様に蛍光を発するものが浮遊しており、蛍光を検出するのみでは、微生物からのものであるか化学繊維の埃などからのものであるかが区別されない。
特表2008-508527号公報にも開示されているように、空気中に浮遊する微生物に紫外光または青色光を照射すると蛍光を発することは、従来から知られている。しかし、空気中には化学繊維の埃など同様に蛍光を発するものが浮遊しており、蛍光を検出するのみでは、微生物からのものであるか化学繊維の埃などからのものであるかが区別されない。
これに対して、発明者らは、微生物と化学繊維の埃などとのそれぞれに対して加熱処理を施し、加熱の前後における蛍光の変化を測定したところ、埃は加熱処理によって蛍光強度が変化しないのに対して、微生物は加熱処理によって蛍光強度が増加することを見出した。そこで、第1の例による微生物センサ1001では、検出原理として、発明者らの見致したこの現象が応用される。
すなわち、空気中では、埃と、微生物が付着した埃と、微生物とが混合されている。上述の現象を基にすると、捕集した粒子に蛍光を発する埃が混ざっている場合、加熱処理前に測定される蛍光スペクトルには、微生物からの蛍光と蛍光を発する埃からの蛍光とが含まれ、微生物を化学繊維の埃などから区別して検出することができない。しかしながら、加熱処理を施すことで微生物だけが蛍光強度が増加し、蛍光を発する埃の蛍光強度は変化しない。そのため、加熱処理前の蛍光強度と所定の加熱処理後の蛍光強度との差を測定することで、微生物の量を求めることができる。
図7は、上の原理を利用して空気中の微生物を検出する、第1の例としての微生物センサ1001の機能構成の具体例を示すブロック図である。上述のように、環境検出装置100の制御部110は、微生物センサ1001からの信号を処理するための機能として信号処理部30および測定検出部40を含む。図7では、信号処理部30の機能が主に電気回路であるハードウェア構成で実現される例が示されている。しかしながら、これら機能のうちの少なくとも一部は、制御部110に含まれるCPUがメモリ120に記憶されるプログラムを実行することによって実現される、ソフトウェア構成であってもよい。また、測定検出部40の構成がソフトウェア構成である例が示されている。しかしながら、これら機能のうちの少なくとも一部は、電気回路などのハードウェア構成で実現されてもよい。
図7を参照して、信号処理部30は、受光素子9に接続される電流-電圧変換回路34と、電流-電圧変換回路34に接続される増幅回路35とを含む。
測定検出部40は、測定制御部41、記憶部42、およびクロック発生部47を含む。さらに、測定検出部40は、第1通信部130で他の装置とのデータ等のやり取りに必要な処理を行なうための外部接続部46と、シャッタ16A,16B、空気導入機構50、およびヒータ91を駆動させるための駆動部48とを含む。
ケース5に導入され捕集治具12上に捕集された粒子に対して発光素子6から照射されることで、照射領域15にある当該粒子からの蛍光が、受光素子9に集光される。受光素子9から、受光量に応じた電流信号が信号処理部30に対して出力される。電流信号は、電流-電圧変換回路34に入力される。
電流-電圧変換回路34は、受光素子9から入力された電流信号より蛍光強度を表わすピーク電流値Hを検出し、電圧値Ehに変換する。電圧値Ehは増幅回路35で予め設定した増幅率に増幅され、測定検出部40に対して出力される。測定検出部40の測定制御部41は信号処理部30から電圧値Ehの入力を受け付けて、順次、記憶部42に記憶させる。
クロック発生部47はクロック信号を発生させ、測定制御部41に対して出力する。測定制御部41は、クロック信号に基づいたタイミングで、シャッタ16A,16Bを開閉させるための制御信号を駆動部48に対して出力して、シャッタ16A,16Bの開閉を制御する。また、測定制御部41は発光素子6および受光素子9と電気的に接続され、それらのON/OFFを制御する。
測定制御部41は計算部411を含み、計算部411において、記憶部42に記憶された電圧値Ehを用いて、導入された空気中の微生物量を算出するための動作が行なわれる。具体的な動作について、図8の測定制御部41での制御の流れを示すタイムチャートを用いて説明する。ここでは、微生物量として、ケース5内に導入された空気中の微生物濃度を算出するものとする。
図8を参照して、測定検出部40の測定制御部41は、微生物センサ1001での測定動作が開始すると駆動部48に対して制御信号を出力し、空気導入機構50を駆動させる。また、測定制御部41は、クロック発生部47からのクロック信号に基づいた時刻T1に、駆動部48に対して、シャッタ16A,16Bを開放(ON)させるための制御信号を出力する。その後、時刻T1から時間ΔΔT1経過後の時刻T2に、測定制御部41は、駆動部48に対して、シャッタ16A,16Bを閉塞(OFF)させるための制御信号を出力する。
これにより、時刻T1から時間ΔT1の間シャッタ16A,16Bが開放され、空気導入機構50の駆動により外部空気がケース5内に導入孔10を通じて導入される。ケース5内に導入された空気中の粒子は、放電電極17により負電荷に帯電され、空気の流れと放電電極17および捕集治具12表面の皮膜3の間で形成される電界とにより、捕集治具12表面に時間ΔT1の間、捕集される。
また、時刻T2にシャッタ16A,16Bが閉塞され、ケース5内の空気の流れが止まる。これにより、捕集治具12での浮遊粒子の捕集が終了する。また、これにより、外部からの迷光が遮光される。
測定制御部41は、シャッタ16A,16Bが閉塞した時刻T2に、受光素子9に受光を開始(ON)させるための制御信号を出力する。さらに、それと同時(時刻T2)または時刻T2から少し遅れた時刻T3に、発光素子6に発光を開始(ON)させるための制御信号を出力する。その後、時刻T3から蛍光強度を測定するための予め規定した測定時間である時間ΔT2経過後の時刻T4に、測定制御部41は、受光素子9に受光を終了(OFF)させるための制御信号、および発光素子6に発光を終了(OFF)させるための制御信号を出力する。なお、上記測定時間は測定制御部41に予め設定されているものであってもよいし、ネットワーク600を介して第1通信部130によって他の装置から受信した信号などによって入力、変更されるものであってもよい。
これにより、時刻T3(または時刻T2)より発光素子6からの照射が開始される。発光素子6からの光は、捕集治具12の表面の照射領域15に照射され、捕集された粒子から蛍光が発光される。時刻T3から規定の測定時間ΔT2分の蛍光が受光素子9により受光され、その蛍光強度F1に応じた電圧値が測定検出部40に入力されて記憶部42に記憶される。
このとき、別途設けたLED等の発光素子(図示せず)からの発光の、捕集治具12表面の粒子が捕集されない反射領域(図示せず)からの反射光を、別途設けた受光素子(図示せず)で受光し、その受光量を参照値I0として用いてF1/I0を記憶部42に記憶してもよい。参照値I0に対する比率を算出することで、発光素子や受光素子の温度、湿度等の環境条件や劣化等による特性変動に起因する蛍光強度の変動を補償することができるという利点が生じる。
測定制御部41は、発光素子6の発光および受光素子9の受光を終了させた時刻T4(または時刻T4から少し遅れた時刻)に、ヒータ91に加熱を開始(ON)させるための制御信号を出力する。そして、ヒータ91の加熱開始(時刻T4または時刻T4から少し遅れた時刻)から加熱処理のための予め規定した加熱処理時間である時間ΔT3経過後の時刻T5に、測定制御部41はヒータ91に加熱を終了(OFF)させるための制御信号を出力する。
これにより、時刻T4(または時刻T4から少し遅れた時刻)から加熱処理時間ΔT3の間、ヒータ91によって捕集治具12表面の照射領域15に捕集した粒子に対して加熱処理が施される。このときの加熱温度は予め規定されている。時間ΔT3の間加熱処理されることで、捕集治具12表面に捕集された粒子に対して所定の加熱量が加えられることになる。なお、加熱処理時間ΔT3(すなわち加熱量)もまた、上記測定時間と同様に、測定制御部41に予め設定されているものであってもよいし、他の装置から受信した信号などによって入力、変更されるものであってもよい。
その後、ΔT4の間、加熱した粒子が冷却処理される。冷却処理には空気導入機構50が用いられてもよく、この場合、別途HEPA(High Efficiency Particulate Air)フィルタを設けた導入口(図5には図示せず)から外部空気が取り込まれてもよい。または、別途ペルチェ素子等の冷却機構が用いられてもよい。
その後、測定制御部41は空気導入機構50の動作を終了させるための制御信号を出力し、時刻T6に受光素子9に受光を開始(ON)させるための制御信号を出力する。さらに、それと同時(時刻T6)または時刻T6から少し遅れた時刻T7に、発光素子6に発光を開始(ON)させるための制御信号を出力する。その後、時刻T7から測定時間ΔT2経過後の時刻T8に、測定制御部41は、受光素子9に受光を終了(OFF)させるための制御信号、および発光素子6に発光を終了(OFF)させるための制御信号を出力する。
これにより、発光素子6から捕集治具12表面の照射領域15に捕集した粒子に対して時間ΔT3の間加熱処理された後の、測定時間ΔT2分の蛍光が受光素子9により受光される。その蛍光強度F2に応じた電圧値は測定検出部40に入力されて記憶部42に記憶される。
計算部411は、記憶された蛍光強度F1と蛍光強度F2との差分を増大量ΔFとして算出する。上述のように、増大量ΔFは微生物量(微生物数または濃度等)に関連している。計算部411は、予め、図9に表わされたような、増大量ΔFと微生物量(濃度)との対応関係を記憶しておく。そして、計算部411は、算出された増大量ΔFと該対応関係とを用いて得られる微生物濃度を、ケース5内に時間ΔT1の間に導入された空気中の微生物濃度として算出する。
増大量ΔFと微生物濃度との対応関係は、予め実験的に決められる。たとえば、1m3の大きさの容器内に、大腸菌やバチルス菌やカビ菌などの微生物の一種を、ネブライザを利用して噴霧し、微生物濃度をN個/m3に維持して、微生物センサ1001を用いて、上述の検出方法により時間ΔT1の間微生物を捕集する。そして、所定加熱量(加熱時間ΔT3、所定の加熱温度)で捕集した微生物に対してヒータ91によって加熱処理を施し、所定時間ΔT4の冷却の後、加熱前後の蛍光強度の増大量ΔFを測定する。種々の微生物濃度について同様の測定がなされることで、図9に示された増大量ΔFと微生物濃度(個/m3)との関係が得られる。なお、増大量ΔFと微生物濃度との対応関係は他の装置から入力され、計算部411に記憶されてもよい。
計算部411は、増大量ΔFが差分ΔF1と算出された場合、図9の対応関係から増大量ΔF1に対応する値を特定することで微生物濃度N1(個/m3)を算出する。
ただし、増大量ΔFと微生物濃度との対応関係は、微生物の種類(たとえば菌種)によって異なる可能性がある。そこで、計算部411は、いずれかの微生物を標準の微生物と規定して、増大量ΔFと該微生物の濃度との対応関係を記憶する。これにより、様々な環境における微生物濃度が、標準の微生物を基準として換算された微生物濃度として算出される。その結果、様々な環境を比較することが可能となり、環境管理が容易となる。
なお、上述の例では増大量ΔFには、所定の加熱量(所定の加熱温度、加熱時間ΔT3)の加熱処理の前後の蛍光強度の差分が用いられているが、これらの比率が用いられてもよい。
計算部411で算出された捕集された微生物の濃度は、測定制御部41での出力処理によって、所定のタイミングで処理装置300に対して送信される。
このように、第1の例による微生物センサ1001は、微生物からの蛍光と蛍光を発する埃からの蛍光との加熱処理による性質の差を利用し、所定の加熱処理後の増大量に基づいて微生物を検出するものである。すなわち、第1の例による微生物センサ1001は、捕集された微生物と埃とに加熱処理を施すと微生物は蛍光強度が増加し埃は変化しない、という現象を利用して微生物を検出するものである。そのため、導入された空気中に蛍光を発する埃が含まれている場合であっても、リアルタイムに、かつ精度よく、微生物を蛍光を発する埃から分離して検出することができる。
なお、第1の例による微生物センサ1001の変形例として、他の構成が挙げられる。図10は、第1の例による微生物センサ1001の構成の他の具体例を示す図である。第1の例による微生物センサ1001の変形例として、検出機構と捕集機構とが別の空間で設けられてもよい。
詳しくは、図10を参照して、第1の例の変形例による微生物センサ1001は、孔5C’を有する区切り壁である壁5Cで隔てられた、捕集機構の少なくとも一部を含んだ捕集室5Aと、検出機構を含んだ検出室5Bとを備える。捕集室5Aには、捕集機構として針状の放電電極17および捕集治具12が配備され、検出室5Bには、検出機構として発光素子6、受光素子9、および集光レンズ8が配備される。
捕集室5Aの放電電極17側および捕集治具12には、それぞれ、捕集室5A内に空気を導入するための導入孔10および排出孔11が設けられる。
排出孔11近傍には空気導入機構としてのファン50Aが設けられる。ファン50Aによって、吸引口からの空気が捕集室5Aに導入される。好ましくは、ファン50Aの駆動機構は、測定検出部40によって制御され、導入する空気の流速が制御される。好ましくは、ファン50Aで導入する空気の流速は1L(リットル)/minから50m3/minである。ファン50Aは測定検出部40によって制御される図示しない駆動機構により駆動することで、図中の点線矢印で表わされたように、導入孔10から捕集室5A外の空気を捕集室5A内に導入し、捕集室5A内の空気を排出孔11から捕集室5A外に排気する。
変形例にかかる微生物センサ1001では、ファン50Aの駆動によって導入孔10から導入された空気中の浮遊粒子は、放電電極17付近にて負に帯電される。負に帯電した粒子は静電気力で捕集治具12の方向に移動して導電性の皮膜に吸着されることで、捕集治具12上に捕集される。
検出室5B内には発光素子6および受光素子9が配される。受光素子9は信号処理部30に接続されて、受光量に比例した電流信号を信号処理部30に対して出力する。従って、導入された空気中に浮遊し、捕集治具12表面に捕集された粒子に発光素子6から光が照射されることによって該粒子から発光された蛍光は、受光素子9において受光され、信号処理部30においてその受光量が検出される。
検出室5B内の、捕集治具12表面に触れる位置には、捕集治具12表面をリフレッシュするためのブラシ60が設けられる。ブラシ60は、測定検出部40によって制御される図示しない移動機構に接続され、図中の両側矢印Bに示されるように、すなわち、捕集治具12上を往復するように移動する。これにより、捕集治具12表面に付着した埃や微生物が取り除かれる。
捕集治具12とヒータ91とを含んだユニットをここでは捕集ユニット12Aと称する。捕集ユニット12Aは測定検出部40によって制御される図示しない移動機構に接続され、図中の両側矢印Aに示されるように、すなわち、捕集室5Aから検出室5Bへ、検出室5Bから捕集室5Aへ、壁5Cに設けられた孔5C’を通って移動する。なお、上述のように、ヒータ91は、捕集治具12上に捕集された空気中の浮遊粒子を加熱し得る位置であって、少なくとも加熱時には発光素子6、受光素子9等のセンサ機器から何かによって隔てられる位置に配備されればよいため、捕集ユニット12Aに含まれず、他の位置に備えられてもよい。後述するように加熱動作が捕集室5Aで行なわれる場合、ヒータ91は捕集ユニット12Aに含まれず、捕集室5Aの、捕集ユニット12Aがセットされる位置であって、捕集治具12の、発光素子6、受光素子9等のセンサ機器と反対側に固定されていてもよい。このようにすることよっても加熱時にはヒータ91は捕集治具12によって発光素子6、受光素子9等のセンサ機器から隔てられ、それにより発光素子6、受光素子9等への熱の影響を抑えることができる。この場合、捕集ユニット12Aには少なくとも捕集治具12が含まれていればよい。
この微生物センサ1001の機能構成は、図7のブロック図で示されたものと同様である。測定制御部41での具体的な測定動作について、図11のフローチャートを用いて説明する。ここでは、微生物量として、捕集室5A内に所定時間の間に導入された空気中の微生物濃度を算出するものとする。
図11を参照して、微生物センサ1001がONされると、ステップS1で、予め規定されている捕集時間である時間ΔT1の間、捕集室5Aでの捕集動作が行なわれる。ステップS1での具体的な動作としては、測定制御部41は駆動部48に対して制御信号を出力してファン50Aを駆動させて捕集室5A内に空気を取り込む。捕集室5A内に導入された空気中の粒子は、放電電極17により負電荷に帯電され、ファン50Aによる空気の流れと放電電極17および捕集治具12表面の皮膜3の間で形成される電界とにより、捕集治具12表面の照射領域15に対応した狭い範囲に捕集される。捕集時間ΔT1が経過すると測定制御部41は捕集動作を終了、すなわち、ファン50Aの駆動を終了させる。
これにより、時間ΔT1の間、外部空気が捕集室5A内に導入孔10を通じて導入され、その空気中の粒子は、捕集治具12表面に時間ΔT1の間、捕集される。
次に、ステップS3で測定制御部41は、駆動部48に対して制御信号を出力して捕集ユニット12Aを移動させるための機構を稼動させて、捕集ユニット12Aを捕集室5Aから検出室5Bに移動させる。移動が完了すると、ステップS5で検出動作が行なわれる。ステップS5では第2の例による微生物センサ1001と同様に、測定制御部41は発光素子6に発光させ、規定の測定時間ΔT2の間、受光素子9により蛍光を受光させる。発光素子6からの光は、捕集治具12の表面の照射領域15に照射され、捕集された粒子から蛍光が発光される。その蛍光強度F1に応じた電圧値が測定検出部40に入力されて記憶部42に記憶される。これにより、加熱前の蛍光量S1が測定される。
なお、上記測定時間ΔT2は測定制御部41に予め設定されているものであってもよいし、他の装置から入力、変更されるものであってもよい。
このとき、別途設けたLED等の発光素子(図示せず)からの発光の、捕集治具12表面の粒子が捕集されない反射領域(図示せず)からの反射光を、別途設けた受光素子(図示せず)で受光し、その受光量を参照値I0として用いてF1/I0を記憶部42に記憶してもよい。参照値I0に対する比率を算出することで、発光素子や受光素子の温度、湿度等の環境条件や劣化等による特性変動に起因する蛍光強度の変動を補償することができるという利点が生じる。
ステップS5の測定動作が終了すると、ステップS7で測定制御部41は、駆動部48に対して制御信号を出力して捕集ユニット12Aを移動させるための機構を稼動させて、捕集ユニット12Aを検出室5Bから捕集室5Aに移動させる。移動が完了すると、ステップS9で加熱動作が行なわれる。ステップS9では第2の例による微生物センサ1001と同様に、測定制御部41は予め規定した加熱処理時間である時間ΔT3の間、ヒータ91に加熱を行なわせる。このときの加熱温度は予め規定されている。
加熱動作後、ステップS11で冷却動作が行なわれる。ステップS11では、測定制御部41は、駆動部48に制御信号を出力して、所定の冷却時間、ファン50Aを逆回転させる。捕集ユニット12Aに外部の空気を触れさせることで冷却する。加熱処理時間ΔT3、加熱温度、および冷却時間も、測定制御部41に予め設定されているものであってもよいし、他の装置から入力、変更されるものであってもよい。
ステップS7で捕集ユニット12Aを捕集室5Aに移動させた後に捕集室5A内で加熱動作および冷却動作が行なわれ、冷却後に捕集ユニット12Aが検出室5Bに移動することで、加熱時にヒータ91は発光素子6、受光素子9等のセンサ機器から隔てられた距離に位置し、また、壁5C等によっても隔てられ、それにより発光素子6、受光素子9等への熱の影響を抑えることができる。なお、このように加熱時にヒータ91は発光素子6、受光素子9等のセンサ機器とは壁5C等によっても隔てられた捕集室5A内にあることから、ヒータ91は捕集ユニット12A内の必ずしも放電電極17から遠い側の面、すなわち検出室5Bに捕集ユニット12Aが移動したときに発光素子6、受光素子9等から遠い側の面になくてもよく、たとえば放電電極17から近い側の面にあってもよい。
ステップS9の加熱動作およびステップS11の冷却動作が終了すると、ステップS13で測定制御部41は、駆動部48に対して制御信号を出力して捕集ユニット12Aを移動させるための機構を稼動させて、捕集ユニット12Aを捕集室5Aから検出室5Bに移動させる。移動が完了すると、ステップS15で再度検出動作が行なわれる。ステップS15の検出動作はステップS5での検出動作と同じである。ここでの蛍光強度F2に応じた電圧値が測定検出部40に入力されて記憶部42に記憶される。これにより、加熱後の蛍光量S2が測定される。
ステップS15で加熱後の蛍光量S2が測定されると、ステップS17で捕集ユニット12Aのリフレッシュ動作が行なわれる。ステップS17で測定制御部41は、駆動部48に対して制御信号を出力してブラシ60を移動させるための機構を稼動させて、捕集ユニット12A表面でブラシ60を所定回数往復移動させる。このリフレッシュ動作が完了すると、ステップS19で測定制御部41は、駆動部48に対して制御信号を出力して捕集ユニット12Aを移動させるための機構を稼動させて、捕集ユニット12Aを検出室5Bから捕集室5Aに移動させる。これにより、開始の指示を受けると直ちに次の捕集動作(S1)を開始することができる。
計算部411は、記憶された蛍光強度F1と蛍光強度F2との差分を増大量ΔFとして算出する。そして、第2の例による微生物センサ1001と同様にして、算出された増大量ΔFと、予め記憶している増大量ΔFと微生物量(濃度)との対応関係(図9)とを用いて得られる微生物濃度を、捕集室5A内に時間ΔT1の間に導入された空気中の微生物濃度として算出する。算出された捕集された粒子中の微生物の濃度は、測定制御部41での出力処理によって、所定のタイミングで処理装置300に対して送信される。
このように、第1の例の変形例による微生物センサ1001では捕集室5Aと検出室5Bとが区切られ、その間を捕集ユニット12Aが行き来して捕集と検出とが行なわれるため、捕集と検出とを連続して行なうことができる。また、上述のように捕集室5Aで捕集治具12が加熱され、冷却された後に検出室5Bに移動させるため、検出室5B内にあるセンサ等への熱の影響を抑えることができる。
(微生物センサ1001の第2の例)
なお、第1の例による微生物センサ1001では、空気中の浮遊粒子を吸着させて捕集し、加熱前後の蛍光量の差によって浮遊粒子から微生物を検出するとしている。しかしながら、浮遊粒子から微生物を検出する方法はこの方法に限定されず、他の方法であってもよい。
なお、第1の例による微生物センサ1001では、空気中の浮遊粒子を吸着させて捕集し、加熱前後の蛍光量の差によって浮遊粒子から微生物を検出するとしている。しかしながら、浮遊粒子から微生物を検出する方法はこの方法に限定されず、他の方法であってもよい。
他の例として、空気中の浮遊粒子からの散乱光の強度の差を利用して浮遊粒子から微生物を検出する方法を採用したセンサが挙げられる。すなわち、空気中の浮遊粒子からの散乱光の強度は、浮遊粒子のサイズと屈折率とに依存する。微生物は細胞内が水に近い液体で満たされていることから、屈折率が水に近い、透明な粒子と近似できる。
そこで、この原理を採用すると、第2の例による微生物センサ1001は、空気中の浮遊する微生物の屈折率を水に近い屈折率であると仮定したときの、同サイズの埃粒子との、光を照射したときの特定の散乱角での散乱強度の差を利用して、微生物をそうでない浮遊粒子から分別し、検出する。
そのため、第2の例による微生物センサ1001には、予め、粒子サイズごとの、微生物とそれ以外の浮遊粒子とを判別するための境界値として、所定の散乱角(たとえば60度)での微生物(屈折率1.3の粒子と仮定)からの散乱強度と埃(屈折率1.6の粒子と仮定)からの散乱強度と間の値が記憶されている。そして、微生物センサ1001は、導入された空気中の浮遊粒子のサイズと散乱強度とを測定し、測定された上記所定の散乱角での散乱強度が測定されたサイズに対して予め記憶されている境界値よりも小なる場合に微生物の粒子、大なる場合に埃粒子、と判別することで、浮遊粒子から微生物を検出する。
さらに、導入された空気中の浮遊粒子のサイズは、ある流速で運ばれる空気中の浮遊粒子の速度が、空気の流速が大きくない場合には浮遊粒子のサイズが大きくなれば遅くなることを利用して検出することができる。すなわち、浮遊粒子のサイズが大きくなると速度が遅くなるために、浮遊粒子が照射光を横切る時間が長くなることを利用することができる。
ある流速で運ばれる浮遊粒子が発光素子6からの照射光を横切ることによって当該浮遊粒子が発生させた散乱光は、受光素子9で受光されると、受光素子9からパルス状の電流信号が出力される。そのパルス幅は、当該浮遊粒子が照射光を横切る時間に関係する。従って、出力される電流信号のパルス幅から浮遊粒子のサイズが換算される。この換算を可能とするため、空気導入機構50では、受光素子9からの電流信号のパルス幅は浮遊粒子のサイズを反映したものとなるような、大きすぎない流速で外部空気を微生物センサ1001内に導入する。
図12は、第2の例による微生物センサ1001の構成の具体例を示す図である。図12を参照して、第2の例による微生物センサ1001は、吸引口からの空気を導入するための導入孔10および図示されない排気孔が設けられたケース5を有し、ケース5内に導入孔10から外部空気を導入するための空気導入機構50を含む。空気導入機構50で導入する空気の流速は、上述の浮遊粒子のサイズを検出するのに適した流速として、好ましくは、0.01L(リットル)/minから10L/minである。
ケース5内には、光源である発光素子6と、発光素子6の照射方向に備えられ、発光素子6からの光を平行光にする、または所定幅とするためのレンズ7と、受光素子9と、受光素子9の受光方向に備えられ、平行光により空気中に存在する浮遊微粒子からの生じる散乱光を受光素子9に集光するための集光レンズ8とが配される。
発光素子6からの照射光が紫外領域の波長の光である場合は、微生物からの蛍光が受光素子9に入らないように、集光レンズ8または受光素子9の前に、蛍光をカットするような光学フィルタが設置される。
発光素子6およびレンズ7と、受光素子9および集光レンズ8とは、それぞれ、レンズ7によって平行光とされた発光素子6の照射方向と、集光レンズ8で集光されることで受光素子9において受光可能な方向とが、所定の散乱角α(たとえば60度)となる角度を保って設置される。さらに、これらは、それぞれ、導入孔10から排出孔へと移動する空気が、レンズ7によって平行光とされた発光素子6からの照射領域と、集光レンズ8で集光されることで受光素子9において受光可能な領域との重なる領域である、図12の領域Aを通過するような角度を保って、設置される。図12では、角度αが約60度となる位置関係であり、かつ、領域Aが導入孔10の正面となるように、これらが設置されている例が示されている。角度αは60度に限定されず、他の角度であってもよい。
受光素子9は信号処理部30に接続されて、受光量に比例した電流信号を信号処理部30に対して出力する。図12の構成により、発光素子6から照射され、空気導入機構50によって領域Aで導入孔10から排出孔へと所定速度で移動する空気中に浮遊する粒子で散乱された光のうちの、発光素子6の照射方向に対して角度α(=60度)方向の散乱光が、受光素子9において受光され、その受光量が検出される。
信号処理部30は測定検出部40に接続されて、パルス状の電流信号を処理した結果を測定検出部40に対して出力する。測定検出部40は、信号処理部30からの処理結果に基づいて、空気中の浮遊粒子から微生物を検出し、検出結果として出力するための処理を行なう。
図13は、上の原理を利用して空気中の微生物を検出する、第2の例としての微生物センサ1001の機能構成の具体例を示すブロック図である。第1の例としての微生物センサ1001と同様に、環境検出装置100の制御部110は、微生物センサ1001からの信号を処理するための機能として信号処理部30および測定検出部40を含む。図13では、信号処理部30の機能が主に電気回路であるハードウェア構成で実現される例が示されている。しかしながら、これら機能のうちの少なくとも一部は、制御部110に含まれるCPUがメモリ120に記憶されるプログラムを実行することによって実現される、ソフトウェア構成であってもよい。また、測定検出部40の構成がソフトウェア構成である例が示されている。しかしながら、これら機能のうちの少なくとも一部は、電気回路などのハードウェア構成で実現されてもよい。
図13を参照して、信号処理部30は、受光素子9に接続されるパルス幅測定回路32と、パルス幅測定回路32に接続されるパルス幅-電圧変換回路33と、受光素子9に接続される電流-電圧変換回路34と、電流-電圧変換回路34に接続される増幅回路35と、パルス幅-電圧変換回路33および増幅回路35に接続される電圧比較回路36とを含む。好ましくは、図13に示されるように、受光素子9とパルス幅測定回路32および電流-電圧変換回路34との間に、予め設定した電流値以下の信号を除去するためのフィルタ回路31が設けられる。フィルタ回路31が設けられることにより、受光素子9の検出信号中の、迷光によるノイズ成分を低減できる。
測定検出部40は、算出部45と、記憶部42と、検出結果を出力するための出力部43とを含む。
ケース5に導入された浮遊粒子に発光素子6から照射されることで、図12の領域Aにある当該浮遊粒子からの散乱光が、受光素子9に集光される。受光素子9から、受光量に応じたパルス状の電流信号が信号処理部30に対して出力される。電流信号は、信号処理部30のパルス幅測定回路32および電流-電圧変換回路34に入力される。受光素子9からの電流信号のうちの、予め設定された電流値以下の信号は、フィルタ回路31を介することでカットされる。
電流-電圧変換回路34は、受光素子9から入力された電流信号より散乱強度を表わすピーク電流値Hを検出し、電圧値Ehに変換する。電圧値Ehは増幅回路35で予め設定した増幅率に増幅され、電圧比較回路36に対して出力される。
パルス幅測定回路32は、受光素子9から入力された電流信号のパルス幅Wを測定する。パルス幅測定回路32でのパルス幅またはそれに関連した値の測定方法は特定の方法に限定されず、従来よく知られた信号処理方法でよい。一例として、パルス幅測定回路32に図示しない微分回路が組み込まれている場合の測定方法について説明する。すなわち、パルス状の電流信号が入力されることで、微分回路では、最初のパルス信号に応じて決められた一定電圧が生じ、次のパルス信号に応じて、電圧が0に戻る。パルス幅測定回路32は、微分回路に生じた電圧信号の立ち上がりから立ち下がりまでの時間を測定して、それをパルス幅とすることができる。すなわち、パルス幅Wは微分回路を通して得られる微分曲線のピーク間の幅でもよい。他の例としては、パルス波形のピーク電圧値の半分の値の間隔、すなわち半値幅でもよいし、パルス波形の立ち上がりから立下りの間隔でもよい。このような方法により、または他の方法により測定されたパルス幅Wを示す信号は、パルス幅-電圧変換回路33に対して出力される。
パルス幅-電圧変換回路33には、予め、各パルス幅Wに対して、微生物であるか否かの判別を行なうための散乱強度の境界値として用いる電圧値Ewが設定されている。パルス幅-電圧変換回路33は、該設定に従って、入力されるパルス幅Wを電圧値Ewに変換する。パルス幅Wと電圧値Ewとの対応は、関数や係数として設定されてもよいし、テーブルで設定されてもよい。電圧値Ewは電圧比較回路36に対して出力される。
パルス幅Wに対応する境界値である電圧値Ewは、予め実験的に決められる。たとえば、1m3の大きさの容器内に、大腸菌やバチルス菌やカビ菌などの微生物の一種を、ネブライザを利用して噴霧し、微生物センサ1001を用いて、受光素子9からの電流信号よりパルス幅および散乱強度(ピーク電圧値)を測定する。同様に、サイズが揃ったポリスチレン粒子などを埃の代替とし、微生物センサ1001を用いて、パルス幅および散乱強度(ピーク電圧値)を測定する。そして、微生物およびポリスチレン粒子のそれぞれから得られた、パルス幅に対する散乱強度(ピーク電圧値)をプロットして得られるそれぞれの領域から、これら領域の境界値が決定される。パルス幅-電圧変換回路33には一例としてこのようにして決定された境界値として用いる電圧値Ewが設定される。境界値として用いられるパルス幅Wと電圧値Ewとの対応関係は、他の装置から入力されることで設定されてもよい。また、いったん電圧比較回路36に設定されたパルス幅Wと電圧値Ewとの対応関係が更新されてもよい。
電圧比較回路36は、電流-電圧変換回路34から増幅回路35を介して入力された散乱強度を表わす電圧値Ehと、パルス幅-電圧変換回路33から入力されたパルス幅Wに対応した境界値としての電圧値Ewとを比較する。電圧比較回路36は、この比較に基づいて、受光素子9が受光した散乱光を生じた浮遊粒子が微生物であるか否かを判定する。
電圧比較回路36での判定は、発光素子6からの照射光を浮遊粒子が横切るたびにその粒子からの散乱光に基づいて行なわれ、判定結果を示す信号が、測定検出部40に対して出力される。測定検出部40の算出部45は電圧比較回路36からの判定結果の入力を受け付けて、順次、記憶部42に記憶させる。
算出部45は、記憶部42に記憶された所定の検出時間分の判定結果について、検出対象の浮遊粒子が微生物であるとの判定結果を示す信号の入力回数、および/またはそれ以外の判定結果を示す信号の入力回数を集計する。
算出部45は、空気導入機構50から、導入される空気の流速を読出し、上記検出時間に乗じることで、上記検出時間にケース5に導入された空気量Vsを得る。算出部45は、検出結果として、上述の集計結果である微生物の個数Nsまたは埃粒子の個数Ndを空気量Vsで除して、微生物の濃度Ns/Vsまたは埃粒子の濃度Nd/Vsを得る。
検出結果である、当該検出時間内にカウントされた微生物の個数Ns、埃粒子の個数Ndや、算出された微生物の濃度Ns/Vs、埃粒子の濃度Nd/Vsは、記憶部42に記憶される。そして、所定のタイミングで処理装置300に対して送信される。
<ガスセンサの構成>
ガスセンサ1005としては、一般的なガスセンサを採用することができる。たとえば、エフアイエス社製SB-AQ1などの半導体ガスセンサを用いることができる。具体的には、金属酸化物二次粒子としてたとえば酸化第ニスズ(SnO2)などに増感剤を添加して高温で焼結させた感ガス材料に、ヒータコイルと電極リード線とを埋設して感ガス素子として用いる。この感ガス素子は3本の電極端子付のベースにマウントされ、ヒータに一定の電圧を印加して感ガス素子の温度を制御した状態で、センサ抵抗と直列に接続されている、固定あるいは可変負荷抵抗両端の出力電圧変化を検出することでガスが検出される。
ガスセンサ1005としては、一般的なガスセンサを採用することができる。たとえば、エフアイエス社製SB-AQ1などの半導体ガスセンサを用いることができる。具体的には、金属酸化物二次粒子としてたとえば酸化第ニスズ(SnO2)などに増感剤を添加して高温で焼結させた感ガス材料に、ヒータコイルと電極リード線とを埋設して感ガス素子として用いる。この感ガス素子は3本の電極端子付のベースにマウントされ、ヒータに一定の電圧を印加して感ガス素子の温度を制御した状態で、センサ抵抗と直列に接続されている、固定あるいは可変負荷抵抗両端の出力電圧変化を検出することでガスが検出される。
エフアイエス社製SB-AQ1でのガス検出原理を説明する。
酸化第ニスズなどの金属酸化物結晶は、清浄空気中ではその表面に空気中の酸素が吸着し、安定状態を保つ。空気中に還元性ガスが存在すると、結晶表面の酸素とガスと反応することで吸着酸素が減少し、その結果、結晶内の電子が増加する。これにより、当該金属酸化物の抵抗値が下がる。
酸化第ニスズなどの金属酸化物結晶は、清浄空気中ではその表面に空気中の酸素が吸着し、安定状態を保つ。空気中に還元性ガスが存在すると、結晶表面の酸素とガスと反応することで吸着酸素が減少し、その結果、結晶内の電子が増加する。これにより、当該金属酸化物の抵抗値が下がる。
ガスセンサ1005は上述の原理を利用して空気中のガス濃度を検出することができる。つまり、エフアイエス社製SB-AQ1を利用する場合にはセンサ抵抗値はガス濃度の増加に伴って減少することになり、センサ抵抗と直列に接続されている負荷抵抗両端の出力電圧変化に基づいてセンサ抵抗値を算出することによって、ガス濃度を得ることができる。この検出値もまた、所定のタイミングで処理装置300に対して送信される。
<イオン発生部の説明>
調整装置400に含まれる、イオン部である調整部460について説明する。以降の説明では、イオン発生装置として独立して用いるタイプの構成を例に挙げて説明するが、調整装置400の全体の中に組み込まれるパーツとしての構成であってもよい。
調整装置400に含まれる、イオン部である調整部460について説明する。以降の説明では、イオン発生装置として独立して用いるタイプの構成を例に挙げて説明するが、調整装置400の全体の中に組み込まれるパーツとしての構成であってもよい。
図14は、イオン発生部である調整部460の外観の具体例を示す図である。図14を参照して、イオン発生部である調整部460は、削孔された直方体のケースを有し、該ケースから図示しない12V程度の直流電源に接続するためのラインが伸びる。孔は複数対削孔されており、一対の孔のそれぞれのほぼ中央には、正極の針状電極301Aと、負極の針状電極301Bとが位置する。
図15は、イオン発生部である調整部460の、一対の孔に対応した回路構成の具体例を示す図である。イオン発生部である調整部460内には、図16に表わされた回路構成が複数含まれる。
図15を参照して、ケース内の回路構成の具体例としては、大きくは、正極側の回路と負極側の回路とからなり、それぞれ、スイッチ302A,302Bによって、直流電源に接続/非接続となる。各回路は、トランジスタと圧電素子とを有する直流を交流に変換するための変換回路と、高圧発生回路303A,303Bとを含む。
図16は、図15中の正極側の回路構成の具体例を示す図である。図16を参照して、スイッチ302Aが閉じると、1.5V~12V程度である直流電源からの電流は変換回路によって直流に変換され、ダイオードによって正極側に整流された後に保護回路を経て高圧発生回路303Aに入力される。高圧発生回路303Aは圧電素子を含み、正極側に整流された入力電圧を昇圧させて高電圧を発生させる。高電圧は正極の針状電極301Aに供給され、電極301Aの先端でコロナ放電が生じる。これにより、正イオンが発生し、電極301Aが設けられたイオン発生部である調整部460のケースの孔からケース外に放出される。
負極側の回路についても、図16の回路のダイオードの向きを逆とするのみで、後は同様である。すなわち、スイッチ302Bが閉じると、負極の針状電極301Bの先端でもコロナ放電が生じ、これにより負イオンが発生してケース外に放出される。
ここで、正イオンは、水素イオン(H+)の周囲に複数の水分子が付随したクラスターイオンであり、H+(H2O)m(mは任意の自然数)として表わされる。また負イオンは、酸素イオン(O2-)の周囲に複数の水分子が付随したクラスターイオンであり、O2-(H2O)n(nは任意の自然数)として表わされる。
スイッチ302A,302Bは調整装置400の制御部410に接続され、その制御によってON/OFFされる。両スイッチともONの場合には当該回路から正イオンおよび負イオンの両極性のイオンが放出され、いずれか一方のスイッチのみONの場合には当該回路から正イオンまたは負イオンの単極性のイオンが放出される。両スイッチともOFFの場合には当該回路からいずれのイオンも放出されない。
従来のイオン発生装置として機能する場合、制御部410がいずれか一方のスイッチのみONさせることで、当該回路から単極イオン、たとえば負イオンを発生させる。
当該回路から正イオンおよび負イオンの両極性のイオンが放出される場合には、空気中の正イオンであるH+(H2O)m(mは任意の自然数)と、負イオンであるO2-(H2O)n(nは任意の自然数)とが略同等量発生することにより、両イオンが空気中の浮遊カビ菌やウィルスの周りを取り囲み、その際に生成される活性種の水酸化ラジカル(・OH)の作用により、浮遊カビ菌などを除去することが可能となる。
イオン発生部である調整部460は、フィルタよりも下流側の流路内に設置される。これにより、発生したイオンは、フィルタによって清浄された空気に乗って排気口から機外に放出される。
制御部410は後述する処理装置300からの制御信号に従ってスイッチ302A,302BのON/OFFを制御する。たとえば、処理装置300からの制御信号がイオン発生に高濃度のイオンを発生させるものである場合にはイオン発生部である調整部460に含まれるすべての回路のスイッチをONとし、そのよりも低い濃度のイオンを発生させるものである場合、予め記憶されている所定数の回路のスイッチをONとしその他の回路のスイッチをOFFとする。このようにすることで、発生させるイオン濃度が制御される。
なお、発生させるイオン濃度を制御する方法の他の例としては、スイッチ302A,302BのON/OFFの間隔を制御する方法も挙げられる。この方法では簡易にイオン濃度を制御することができる。
[第1の実施の形態]
<動作概要>
第1の実施の形態にかかるシステム1では、環境検出装置100がそれぞれ様々な位置に設置され、予め規定されたエリアごとに当該エリアの空気の状態が表示される。
<動作概要>
第1の実施の形態にかかるシステム1では、環境検出装置100がそれぞれ様々な位置に設置され、予め規定されたエリアごとに当該エリアの空気の状態が表示される。
各環境検出装置100が設置される位置は属性検出装置200によって検出され、環境検出装置100の位置を表わした情報が環境属性として属性検出装置200から処理装置300に対して送られる。処理装置300では、属性検出装置200からの環境属性に基づいて各環境検出装置100が設置されているエリアを特定する。そして、エリアごとの空気の状態を当該エリアに設置されている環境検出装置100からの検出結果に基づいて表示する。この表示のための処理を、以降、第1の表示処理と称する。
また、属性検出装置200によってユーザのいる位置が検出され、ユーザのいる位置を表わした情報が環境属性として属性検出装置200から処理装置300に対して送られる。処理装置300では、環境検出装置100での検出結果を表示する際に、ユーザのいる位置を含んだエリアの空気の状態を、対応する表示端末500で表示する。この表示のための処理を、以降、第2の表示処理と称する。
なお、処理装置300は予め調整装置400の設けられた位置を記憶しておき、環境検出装置100での検出結果に応じて、必要な位置に配された調整装置400を、適した制御量で制御する。調整装置400の位置は、環境検出装置100の位置を検出する方法と同じ方法で属性検出装置200によって検出されて処理装置300に送られてもよい。これは、上述の第1の表示処理または第2の表示処理と並行して行なわれてもよい。
<機能構成>
図17は、第1の実施の形態にかかる表示制御を行なうための処理装置300の機能構成の具体例を示すブロック図である。図17に示される各機能は、処理装置300の制御部310に含まれるCPUがメモリ320に記憶されるプログラムを読み込んで実行することで、主にCPUに形成されるものであるが、少なくとも一部が電気回路などのハードウェア構成で実現されてもよい。
図17は、第1の実施の形態にかかる表示制御を行なうための処理装置300の機能構成の具体例を示すブロック図である。図17に示される各機能は、処理装置300の制御部310に含まれるCPUがメモリ320に記憶されるプログラムを読み込んで実行することで、主にCPUに形成されるものであるが、少なくとも一部が電気回路などのハードウェア構成で実現されてもよい。
図17を参照して、第1の実施の形態にかかる表示制御を行なうための処理装置300は、環境検出装置100からの環境情報として測定値と当該環境検出装置100の識別情報との入力を受け付けるための測定値入力部311と、属性検出装置200からの環境属性として検出対象範囲内の人の有無・その位置、風向・風量、および環境検出装置100の位置などの情報の入力を受け付けるための属性入力部312と、これら入力された情報に基づいて、環境検出装置100が設置されたエリアや、ユーザのいるエリアなどを特定するための特定部313と、表示内容を決定して表示部350などに表示させる処理を実行するための表示処理部315と、操作部370からの表示に関する指示の入力を受け付けるための指示入力部314とを含む。
当該システム1においては、検出対象の空間に対して予め表示の単位であるエリアが設定されており、当該空間内の様々な位置に環境検出装置100が配置されている。
第1の表示処理を実行する場合、メモリ320の所定領域には、予め、エリアごとの位置情報が記憶されている。たとえば位置情報が緯度・経度で表わされ、表示の単位であるエリアが部屋である場合、部屋ごとの緯度・経度が予め記憶されている。
特定部313はメモリ320の所定領域に記憶されているエリアごとの位置情報を参照して、環境情報を入力した環境検出装置100がどのエリアに配置されているか、つまり、入力された検出結果がどのエリアの検出結果であるかを特定する。そして、表示処理部315は、入力された検出結果に基づいて表示対象のエリアについて空気の状態を表示するための処理を実行する。
また、特定部313はメモリ320の所定領域に記憶されているエリアごとの位置情報を参照して、予め記憶している属性検出装置200の設置されている位置、またはネットワーク600を介して相互に通信することで得られた属性検出装置200の設置されている位置に基づき、環境属性を入力した属性検出装置200がどのエリアに配置されているか、つまり、入力された環境属性がどのエリアの環境属性であるかを特定する。そして、表示処理部315は、さらに環境属性も用いて、表示対象のエリアについて空気の状態を表示するための処理を実行する。
<第1の表示処理の動作フロー>
図18は、処理装置300での第1の表示処理の流れを表わしたフローチャートである。図18のフローチャートに表わされた動作は、処理装置300の制御部310に含まれるCPUが、メモリ320に記憶されるプログラムを読み出して実行し、図17に示される各部を機能させることで実現される。
図18は、処理装置300での第1の表示処理の流れを表わしたフローチャートである。図18のフローチャートに表わされた動作は、処理装置300の制御部310に含まれるCPUが、メモリ320に記憶されるプログラムを読み出して実行し、図17に示される各部を機能させることで実現される。
図18を参照して、環境検出装置100から識別情報などの属性情報と共に検出結果の入力を受け付けると(ステップS101でYES)、ステップS103でCPUは、当該環境検出装置100の検出エリアを特定する。ここでは、予め属性検出装置200から、環境検出装置100の識別情報と共に当該環境検出装置100の位置情報を取得しておき、記憶している。位置情報が属性検出装置200からの相対位置である場合には、CPUは、予め記憶している属性検出装置200の位置情報に基づいて環境検出装置100の位置を算出することで、その位置情報を取得する。ステップS103でCPUは、ステップS101で検出結果と共に入力された識別情報で表わされた環境検出装置100の位置情報を特定し、その位置情報とメモリ320の所定領域に記憶されているエリアごとの位置情報とを比較することで、当該環境検出装置100の設置されているエリアを特定する。
ステップS105でCPUは、表示対象とするエリアについて、当該エリアの検出結果に基づいて表示態様を決定する。つまり、上記ステップS101で検出結果を入力した環境検出装置100の設置されているエリアが表示対象のエリアである場合、上記ステップS101で入力された検出結果に基づいて当該表示対象のエリアの表示態様を決定する。なお、当該表示対象のエリアに設置される環境検出装置100が複数ある場合、これら複数の環境検出装置100での検出結果に基づいて当該表示対象のエリアの表示態様を決定する。たとえば、複数の環境検出装置100での検出結果を合算して得られた値に基づいて当該表示対象のエリアの表示態様を決定してもよいし、これらの平均値などの統計値を用いて当該表示対象のエリアの表示態様を決定してもよい。ここでの決定方法については、後に具体例を挙げて説明する。
CPUは、操作部370から、検出結果を表示させるエリアの指定を受け付けると(ステップS107でYES)、そのエリアの検出結果を表示部350に表示するための処理を実行する。これにより、指示されたエリアについての検出結果が表示部350に表示されることになる。
図19は、第1の表示処理における表示画面の第1の具体例を示す図である。
具体例として、表示対象のエリアにある環境検出装置100の微生物センサ1001での検出結果に基づいて、当該エリア内の空気の状態を表示するための処理を行なうものとする。このとき、表示処理部315は、予め菌を「多い」「少ない」「なし」とランクわけするための基準値を記憶しておき、基準値と当該環境検出装置100からの検出値とを比較することで、菌の量をランクわけする。
具体例として、表示対象のエリアにある環境検出装置100の微生物センサ1001での検出結果に基づいて、当該エリア内の空気の状態を表示するための処理を行なうものとする。このとき、表示処理部315は、予め菌を「多い」「少ない」「なし」とランクわけするための基準値を記憶しておき、基準値と当該環境検出装置100からの検出値とを比較することで、菌の量をランクわけする。
さらに、CPUは、予め菌の量のランクと表示態様との対応を記憶している。一例として、図19では、菌の量が「多い」ランクの場合には斜線でハッチング、「少ない」ランクの場合には点線横線でハッチング、「なし」ランクの場合にはハッチングなし、の表示態様が記憶されている例が示されている。表示態様はハッチングに限定されず、色や濃度や表示サイズやそれらの組み合わせなどが含まれる。また、表示は2次元表示に限定されず3次元表示でもよく、その場合、表示態様には3次元の奥行きも含まれる。
図19の例では、メモリ320には、予め表示の単位であるエリアとしての、1F~5Fまでの各フロアについてのエリアA~F(またはエリアA~E)について、それぞれの位置情報が記憶されている。そして、各環境検出装置100の位置情報と比較することで表示対象のエリアに設置されている環境検出装置100を特定して、当該環境検出装置100からの検出結果である菌の量を得る。このとき、上述のように、表示対象のエリアに環境検出装置100が複数設置されている場合には、これら複数の環境検出装置100での検出結果に基づいて当該エリアについての菌の量を得る。そして、その菌の量に基づいて当該エリアの空気の状態を表わす表示態様を決定する。
図19の表示例では、そのようにして各フロアのエリアごとの空気の状態が、検出された菌の量に応じた表示態様で表示されている例が示されている。このように表示されることで、各エリア(各フロアの各エリア)の空気の状態を一目で把握することができる。
さらに、複数のエリアを併せた広い範囲についての検出結果を表示するようにしてもよい。すなわち、図19に示されているように、各フロアについて、当該フロアのエリアごとの検出結果に基づいた当該フロアの菌の量を表示するようにしてもよい。
さらに、第1の表示処理として、表示画面において位置を指定する指示を受け付けることで、さらにその位置について実際の配置に応じた表示を行なってもよい。図20は、第1の表示処理における表示画面の第2の具体例を示す図であって、図19において矢印で表わされているように、5Fを表わすボタンがクリックされたときに表示部350に表示される画面を表わしている。
図20の例では、メモリ320には、予めフロアごとのエリアの配置、大きさがマップ情報として記憶されている。そして、当該マップ情報に基づいて5FのエリアA~Fの表示範囲を決定した上で、それぞれのエリアの菌の量に応じた表示態様を決定する。
図20の表示例では、そのようにして、指定されたフロアの各エリアの空気の状態が、実際の配置、大きさに従った表示範囲で、検出された菌の量に応じた表示態様で表示されている例が示されている。このように表示されることで、各エリアの位置関係、大きさと共に、指定されたフロアの各エリアの空気の状態を一目で把握することができる。
1つのエリアに複数の環境検出装置100が配置されている場合、当該エリアのより詳細な空気の状態として、各環境検出装置100での検出結果に基づいてそれぞれの設置位置付近の空気の状態を表示するようにしてもよい。
図21は、第1の表示処理における表示画面の第3の具体例を示す図であって、図19において矢印で表わされているように、または図20において矢印で表わされているように、5FのエリアAを表わすボタンがクリックされたときに表示部350に表示される画面を表わしている。5FのエリアAには、2つの環境検出装置100が設置されているものとする。
図21の表示例では、5FのエリアAに設置されたそれぞれの環境検出装置100での検出結果に基づいた空気の状態が、それぞれの設置位置に応じた位置に当該検出結果に応じた表示態様で表示されている。この場合、処理装置300のCPUは、環境検出装置100の位置情報とエリアの位置情報とに基づいて、当該エリア内の環境検出装置100のそれぞれの位置を特定する。そして、当該エリアの表示範囲のうちの環境検出装置100の設置位置に応じた位置に、それぞれの検出結果に応じた表示態様で表示する。このように表示されることで、1つのエリア内の空気の状態の分布を一目で把握することができる。
さらに、図21の表示例では、空気の状態と共に、調整装置400が表示されている。この場合、処理装置300のCPUは、予め記憶している調整装置400の位置情報に基づいて表示対象のエリア内の当該調整装置400の位置を特定する。そして、当該エリアの表示範囲のうちの調整装置400の設置位置に応じた位置に、調整装置400を表わすマークを表示する。当該マークは選択可能なマークであって、図21に示されるように、そのマークの選択(クリック)を受け付けることで、処理装置300のCPUは、当該調整装置400への制御指示を受け付けるモードとなる。
さらに好ましくは、図21に示されるように、表示画面には調整装置400の調整部460の駆動量を指示するための選択肢が表示される。図21の例では、「強」「中」「弱」「止」の駆動量が表示されている。図21の画面において調整装置400を表わすマークの選択を受け付け、さらに、駆動量の選択を受け付けることで、処理装置300のCPUは、選択された駆動量となるように制御信号を調整装置400に対して送信する。
このようにすることで、空気の状態の表示を見たユーザは、当該エリアに設置されている調整装置400の駆動を指示することができる。調整装置400がイオン発生装置であり、当該エリアの空気の状態が菌の量が「多い」状態であった場合には、ユーザは、そのエリアに設置されている調整装置400、または、菌の量が「多い」状態とされた位置付近に設置されている調整装置400を駆動量が「強」となるようにして、空気の清浄能力が高くなるように指示することができる。逆に、当該エリアの空気の状態が菌の量が「少ない」状態または「なし」状態であった場合には、ユーザは、そのエリアに設置されている調整装置400を駆動量が「弱」となるように、または駆動を中止するように指示することができる。このように、表示された空気の状態に応じた最適な駆動量とすることができる。
なお、図21の例では、ユーザからの選択操作を受け付けることで処理装置300のCPUが調整装置400の駆動量を制御するものとしているが、処理装置300のメモリ220が予め空気の状態と調整装置400の駆動量との対応関係を記憶しておくことで、CPUが当該対応関係に基づいて、対象とするエリアの検出結果から得られた空気の状態に基づいて当該エリアに設置された調整装置400の駆動量を決定し、その駆動量となるような制御信号を調整装置400に対して送信するようにしてもよい。
このようにすることで、各エリアの空気の状態が表示されつつ、さらに、よりよい空気の状態となるように調整装置400が自動的に制御される。そして、その制御の結果、空気の状態が変化した場合には、その変化後の空気の状態も表示されることになり、ユーザは制御の効果を確認することができる。
なお、上の例では、菌の量に基づく空気の状態が表示されるものとしているが、他のパラメータに基づく空気の状態が表示されてもよいし、複数のパラメータの組み合わせに基づく空気の状態が表示されてもよい。
<第2の表示処理の説明>
図22は、第2の表示処理における表示ウィンドウ70の具体例を示す図である。ここでは、第1の表示処理の説明と概ね同様の具体例を用いて、微生物センサ1001での検出結果と、埃センサ1002からの検出結果とに基づいて空気の状態を表示するものとする。
図22は、第2の表示処理における表示ウィンドウ70の具体例を示す図である。ここでは、第1の表示処理の説明と概ね同様の具体例を用いて、微生物センサ1001での検出結果と、埃センサ1002からの検出結果とに基づいて空気の状態を表示するものとする。
図22を参照して、第2の表示処理で表示される表示ウィンドウ70には、菌の量に基づいた空気の状態を表わすマーク71と、表示対象のエリアに設置された環境検出装置100の位置からユーザの位置までの距離を表わすメータであるマーク72と、埃の量を表わすマーク73と、当該表示ウィンドウ70の表示終了を指示するためのマーク74とが表示される。
詳しくは、マーク71は人の顔を模したマークであって、その表情(笑顔、泣き顔、無表情、等)で空気の状態が表現される。
メータであるマーク72は、当該メータの長さで環境検出装置100の位置からユーザの位置までの距離を表わす。
マーク73は個々の埃を擬似的に表わしたマークであって、その数で埃の量が表現される。
第2の表示処理を実行するため、メモリ320の所定領域には、予め、それぞれのマークで表わすパラメータの量とマークの状態との対応関係が記憶されている。図23A~図23Cは、それぞれのマークで表わすパラメータの量とマークの状態との対応関係の具体例を示す図であって、図23Aはマーク72を表示するための対応関係、図23Bはマーク73を表示するための対応関係、および図23Cはマーク71を表示するための対応関係の具体例である。
詳しくは、図23Aを参照して、メモリ320にはマーク72を表示するための対応関係として、環境検出装置100の位置からユーザの位置までの距離のランクに対応したメータ長さが記憶されている。図23Bを参照して、メモリ320には、マーク73を表示するための対応関係として、埃の量のランクに対応した埃1つを擬似的に表わした画像の提示個数が記憶されている。図23Cを参照して、メモリ320には、マーク71を表示するための対応関係として、菌の量のランクと環境検出装置100の位置からユーザの位置までの距離のランクとに対応した人の顔を模したマークの表情が記憶されている。
第2の表示処理を実行するための処理装置300の特定部313は、環境検出装置100の微生物センサ1001での検出結果および埃センサ1002での検出結果の入力を受け付け、菌の量のランクわけ、および埃の量のランクわけを行なう。さらに、処理装置300は、属性検出装置200で検出された人の位置および環境検出装置100の位置を表わす環境属性の入力を受け付け、それらの間の距離を算出してランクわけする。ランクわけは、第1の表示処理におけるランクわけと同様である。そして、メモリ320に記憶されている、図23A~図23Cに表わされた対応関係を参照して、表示対象のエリアについてのマーク71,72,73を特定する。
さらに、第2の表示処理を実行するための処理装置300の特定部313は、空気の状態を表示させる表示端末500を特定する。処理装置300ではネットワーク600を介して相互に通信することで各表示端末500の位置を特定し、予めメモリ320の所定領域に記憶されている。そこで、特定部313は、表示対象のエリアに設置されている、または位置している表示端末500を特定し、その表示端末500を空気の状態を表示させる表示端末500と特定する。
なお、特定部313は、ユーザから表示端末500を用いた表示要求を受け付けることで、当該表示端末500を空気の状態を表示させる表示端末500と特定してもよい。
<第2の表示処理の動作フロー>
図24は、処理装置300での第2の表示処理の流れを表わしたフローチャートである。図24のフローチャートに表わされた動作は、処理装置300の制御部310に含まれるCPUが、メモリ320に記憶されるプログラムを読み出して実行し、図17に示される各部を機能させることで実現される。
図24は、処理装置300での第2の表示処理の流れを表わしたフローチャートである。図24のフローチャートに表わされた動作は、処理装置300の制御部310に含まれるCPUが、メモリ320に記憶されるプログラムを読み出して実行し、図17に示される各部を機能させることで実現される。
図24を参照して、ステップS201でCPUは、属性検出装置200からの環境属性に基づいて各環境検出装置100の位置を特定し、ステップS203でユーザの位置を特定する。そして、ステップS205でCPUは、ユーザのいる位置に最も近い位置にある表示端末500を、表示ウィンドウを表示させる表示端末500と特定する。
ステップS207でCPUは、ユーザのいる位置が含まれるエリアを表示対象のエリアとして特定し、ステップS209でそのエリアに設置されている環境検出装置100を特定する。そして、ステップS211でCPUは、特定された当該環境検出装置100からの検出結果に基づいて、そのエリアの菌の量および埃の量を特定する。
ステップS213でCPUは、特定された埃量に基づいて、図23Bに示された対応関係を参照して、マーク73の内容、つまり、埃1つを擬似的に表わした画像の提示個数を決定する。
ステップS215でCPUは、特定された環境検出装置100の位置とユーザの位置とに基づいてこれらの間の距離を特定し、ステップS217でこの距離に基づいて、図23Aに示された対応関係を参照して、マーク72の内容、つまり、メータであるマーク72の長さを決定する。
さらに、ステップS219でCPUは、環境検出装置100からユーザまでの距離と特定された菌の量とに基づいて、図23Cに示された対応関係を参照して、マーク71の内容、つまり、人の顔を模したマークの表情を提示内容として決定する。
ステップS221でCPUは、決定されたマーク71,72,73の内容に基づいて表示ウィンドウ70を表示させるための表示データを生成する。そして、ステップS223で、表示データに基づいた表示ウィンドウ70を上記ステップS205で特定された表示端末500に表示させるための処理を実行する。
図25Aおよび図25Bは、特定された表示端末500に表示ウィンドウ70が表示される様子を表わした図である。
上記ステップS205において、上記ステップS203で特定されたユーザの位置に最も近い表示端末としてテレビジョン受像機である表示端末500Aが特定された場合、図25Aに表わされたように、テレビジョン受像機である表示端末500Aの表示画面の一部に表示ウィンドウ70が表示される。このとき、好ましくは、図25Aに表わされたように、テレビジョン受像機である表示端末500Aで表示されている番組内容の視認を妨げない位置およびサイズで表示ウィンドウ70が表示される。また、表示ウィンドウ70の表示に先立って、表示する表示ウィンドウ70のための表示データを受信していることを表わすマークを表示し、予め規定された所定の操作を受け付けることで表示ウィンドウ70を表示するようにしてもよい。
上記ステップS205において、上記ステップS203で特定されたユーザの位置に最も近い表示端末として当該ユーザの携帯している携帯電話機または電子書籍閲覧端末である表示端末500Bが特定された場合、図25Bに表わされたように、携帯電話機または電子書籍閲覧端末である表示端末500Bの表示画面の一部に表示ウィンドウ70が表示される。このとき、好ましくは、図25Bに表わされたように、携帯電話機または電子書籍閲覧端末である表示端末500Bで表示されているコンテンツの視認を妨げない位置およびサイズで表示ウィンドウ70が表示される。また、上述の例と同様に、表示ウィンドウ70の表示に先立って、表示する表示ウィンドウ70のための表示データを受信していることを表わすマークを表示し、予め規定された所定の操作を受け付けることで表示ウィンドウ70を表示するようにしてもよい。特に、携帯電話機や電子書籍閲覧端末は表示部が小さいため、表示データを受信していることを表わすマークを表示ウィンドウ70の表示に先立って表示させることで、他の表示をいったん終了させてから表示ウィンドウ70を表示させることができる。
このように表示されることで、ユーザは、自身のいるエリアの空気の状態を最も近い表示端末でリアルタイムで確認することができる。
なお、上の例では、菌の量と埃の量とのそれぞれに基づく空気の状態が表示されるものとしているが、いずれか一方のみであってもよいし、他のパラメータに基づく空気の状態が表示されてもよいし、複数のパラメータの組み合わせに基づく空気の状態が表示されてもよい。
さらに、環境属性に含まれる風向・風量が併せて表示されてもよい。
図26Aおよび図26Bは、第2の表示処理における表示ウィンドウ70の他の具体例を示す図である。
図26Aおよび図26Bは、第2の表示処理における表示ウィンドウ70の他の具体例を示す図である。
一例として、図26Aに示されるように、図22においてマーク71,72,73で表わされた空気の状態に加えて、風向・風量を表わすマーク75が表示されてもよい。詳しくは、マーク75は矢印の画像であって、その向きで風向を表わし、大きさで風量を表わす。
この場合、メモリ320の所定領域には、風向・風量とマークの向きおよび大きさの対応関係を予め記憶しておき、処理装置300のCPUは、属性検出装置200からの風向・風量を表わす環境属性に基づいて、上記対応関係を参照して、マーク75の内容、つまり、矢印であるマーク75の向きおよび大きさを決定する。
その際、ユーザ位置と環境検出装置100の位置とを考慮して風向・風量を表示する。一例として、ユーザ位置と環境検出装置100の位置とを結ぶ直線を基準軸とし、風向が当該基準軸に対して水平である場合は、検出された風向・風力をそのまま用いてマーク75の内容、つまり、矢印であるマーク75の向きおよび大きさを決定する。
風向が当該基準軸に対して水平でない場合は、風力(ベクトル)を当該基準軸に対して水平成分と垂直成分とに分解して、水平成分の風力についてマーク75の内容、つまり、矢印であるマーク75の大きさを決定する。
このように表示されることで、ユーザは、環境検出装置100から自身の位置までの間の風の状態も併せて確認することができ、自身に向かう方向での空気の状態を確認することができる。
なお、表示の他の例として、図26Bに示されるように、表示ウィンドウ70が3次元表示されてもよい。このように表示されることで、ユーザは、自身の位置との関係で感覚的に空気の状態を把握することができる。
<第1の実施の形態の効果>
第1の実施の形態にかかるシステム1においてこのような表示がなされることで、表示対象のエリアに配置されている環境検出装置100の位置(検出ポイント)と当該環境検出装置100での検出情報が関連付けて表示されるため、ユーザは、表示対象のエリアの空気の状態を直感的に把握することができる。
第1の実施の形態にかかるシステム1においてこのような表示がなされることで、表示対象のエリアに配置されている環境検出装置100の位置(検出ポイント)と当該環境検出装置100での検出情報が関連付けて表示されるため、ユーザは、表示対象のエリアの空気の状態を直感的に把握することができる。
また、第1の実施の形態にかかるシステム1では環境検出装置100の位置が環境属性として動的に取得される。そのため、環境検出装置100の設置位置が変更(移動)されても当該環境検出装置100の位置情報(検出ポイント)を適切に取得でき、精度よい表示を実現できる。
また、第1の実施の形態にかかるシステム1ではユーザと環境検出装置100の位置(検出ポイント)との位置関係を特定できるので、当該ユーザ周辺の空気の状態を、当該ユーザにとって視認しやすい表示端末にて提示することができる。
[第2の実施の形態]
<動作概要>
第2の実施の形態にかかるシステム1では、環境検出装置100がそれぞれ様々な位置に設置され、予め規定されたエリアごとに当該エリアにおける人の有無、分布も利用して当該エリアの空気の状態が表示される。以降の説明では、第1の実施の形態と異なる点を特に説明する。
<動作概要>
第2の実施の形態にかかるシステム1では、環境検出装置100がそれぞれ様々な位置に設置され、予め規定されたエリアごとに当該エリアにおける人の有無、分布も利用して当該エリアの空気の状態が表示される。以降の説明では、第1の実施の形態と異なる点を特に説明する。
第2の実施の形態にかかる属性検出装置200は、赤外線センサ、超音波センサ、可視光センサ、圧力センサなどである人感センサを用いて、検出対象の空間内の人の有無に加えて、当該空間内にいる人数も検出する。そして、それらを表わす環境属性を処理装置300に送る。たとえば、人感センサとして圧力センサを用いる場合、検出対象の空間の床部に圧力センサを設置し、人検出部211は人の重みに相当する圧力が検出された位置を人の位置としてその位置を特定すると共に、人の重みに相当する圧力が検出された箇所数を人数として検出することができる。
なお、第2の実施の形態にかかるシステム1でも、第1の実施の形態にかかるシステム1と同様に、エリアごとの空気の状態を当該エリアに設置されている環境検出装置100からの検出結果に基づいて表示するための第1の表示処理と、ユーザのいる位置を含んだエリアの空気の状態を対応する表示端末500で表示するための第2の表示処理とが行なわれる。
<機能構成>
図27は、第2の実施の形態にかかる表示制御を行なうための処理装置300の機能構成の具体例を示すブロック図である。図27に示される各機能もまた、処理装置300の制御部310に含まれるCPUがメモリ320に記憶されるプログラムを読み込んで実行することで、主にCPUに形成されるものであるが、少なくとも一部が電気回路などのハードウェア構成で実現されてもよい。
図27は、第2の実施の形態にかかる表示制御を行なうための処理装置300の機能構成の具体例を示すブロック図である。図27に示される各機能もまた、処理装置300の制御部310に含まれるCPUがメモリ320に記憶されるプログラムを読み込んで実行することで、主にCPUに形成されるものであるが、少なくとも一部が電気回路などのハードウェア構成で実現されてもよい。
図27を参照して、第2の実施の形態にかかる表示制御を行なうための処理装置300は、図17に示された第1の実施の形態での機能構成に加えて、さらに、人の有無を表わした環境属性に基づいて表示のタイミングを判定するための判定部316を含む。
<第1の表示処理の動作フロー>
処理装置300での第1の表示処理の流れは、図18のフローチャートで表わされた第1の実施の形態での第1の表示処理の流れと概ね同じである。第2の実施の形態にかかる処理装置300では、上記ステップS105でCPUが、環境属性で表わされる各エリアにいる人数も表示するよう表示態様を決定する。
処理装置300での第1の表示処理の流れは、図18のフローチャートで表わされた第1の実施の形態での第1の表示処理の流れと概ね同じである。第2の実施の形態にかかる処理装置300では、上記ステップS105でCPUが、環境属性で表わされる各エリアにいる人数も表示するよう表示態様を決定する。
図28は、第1の表示処理における表示画面の第1の具体例を示す図である。
図28の表示例では、第2の実施の形態での第1の表示処理では、図19に表わされた各フロアのエリアごとの空気の状態に併せて、各フロアのエリアごとに、当該エリアの人の有無が表示されている例が示されている。
図28の表示例では、第2の実施の形態での第1の表示処理では、図19に表わされた各フロアのエリアごとの空気の状態に併せて、各フロアのエリアごとに、当該エリアの人の有無が表示されている例が示されている。
具体例として、人がいることを表わすマーク76を用いて、人がいると検出されたエリアを表わす表示範囲に当該マーク76を併せて表示することで、そのエリアに人がいることを表わしている。もちろん、他の方法で表示してもよい。このように表示されることで、各エリア(各フロアの各エリア)の空気の状態と共に、各エリアの人の有無を一目で把握することができる。
図29は、第1の表示処理における表示画面の第2の具体例を示す図である。
図29の表示例では、上述のようにして指定されたフロアの各エリアの空気の状態が、実際の配置、大きさに従った表示範囲で、検出された菌の量に応じた表示態様で表示されると共に、各エリアの人の有無および人の人数が表示されている例が示されている。
図29の表示例では、上述のようにして指定されたフロアの各エリアの空気の状態が、実際の配置、大きさに従った表示範囲で、検出された菌の量に応じた表示態様で表示されると共に、各エリアの人の有無および人の人数が表示されている例が示されている。
人がいることは図27と同様にマーク76を用いて表示し、さらに、人がいると検出されたエリアを表わす表示範囲に当該エリアの人数を併せて表示している。このように表示されることで、各エリアの位置関係、大きさと共に、指定されたフロアの各エリアの空気の状態と共に、各エリアの人の有無および人数を一目で把握することができる。
図30は、第1の表示処理における表示画面の第3の具体例を示す図である。
図30の表示例では、5FのエリアAに設置されたそれぞれの環境検出装置100での検出結果に基づいた空気の状態が、それぞれの設置位置に応じた位置に当該検出結果に応じた表示態様で表示されると共に、5FのエリアA内での人の分布が表示されている例が示されている。図30において、人がいる位置は黒丸で表わされている。このように表示されることで、1つのエリア内の空気の状態の分布と共に、当該エリア内の人の分布を一目で把握することができる。
図30の表示例では、5FのエリアAに設置されたそれぞれの環境検出装置100での検出結果に基づいた空気の状態が、それぞれの設置位置に応じた位置に当該検出結果に応じた表示態様で表示されると共に、5FのエリアA内での人の分布が表示されている例が示されている。図30において、人がいる位置は黒丸で表わされている。このように表示されることで、1つのエリア内の空気の状態の分布と共に、当該エリア内の人の分布を一目で把握することができる。
さらに、第1の実施の形態の第1の表示処理と同様に、図30の表示例でも、空気の状態および人の分布と共に、調整装置400が表示され、その制御についての指示を受け付けるようにしてもよい。このようにすることで、空気の状態および人の分布の表示を見たユーザは、これらを考慮して当該エリアに設置されている調整装置400の駆動を指示することができる。調整装置400がイオン発生装置であり、当該エリアの空気の状態が菌の量が「多い」状態であり、かつその付近に人がいる場合には、ユーザは、そのエリアに設置されている調整装置400、または、菌の量が「多い」状態とされた位置付近に設置されている調整装置400を駆動量が「強」となるようにして、空気の清浄能力が高くなるように指示することができる。その付近に人がいない場合には、駆動量を変化させないようにすることができる。このように、表示された空気の状態および人の分布に応じた最適な駆動量とすることができる。
なお、図30の例でも、ユーザからの選択操作を受け付けることで処理装置300のCPUが調整装置400の駆動量を制御するものとしているが、処理装置300のメモリ220が予め空気の状態および人の分布と調整装置400の駆動量との対応関係を記憶しておくことで、CPUが当該対応関係に基づいて、対象とするエリアの検出結果から得られた空気の状態および人の分布に基づいて当該エリアに設置された調整装置400の駆動量を決定し、その駆動量となるような制御信号を調整装置400に対して送信するようにしてもよい。
すなわち、あるエリアの空気の状態が所定以上であった場合でも、当該エリアに人がいない場合、またはいる人が所定人数よりも少ない場合には、イオン発生装置などである調整装置400の駆動量をあまり高い駆動量とせず、当該エリアに人がいる場合、またはいる人が所定人数よりも多い場合に高い駆動量とする、などと自動的に制御することができる。
このようにすることで、各エリアの空気の状態および人の分布が表示されつつ、さらに、これらを考慮してよりよい空気の状態となるように調整装置400が自動的に制御される。そして、その制御の結果、空気の状態が変化した場合には、その変化後の空気の状態も表示されることになり、ユーザは制御の効果を確認することができる。
なお、上の例では、菌の量に基づく空気の状態が表示されるものとしているが、他のパラメータに基づく空気の状態が表示されてもよいし、複数のパラメータの組み合わせに基づく空気の状態が表示されてもよい。
<第2の表示処理の動作フロー>
図31は、処理装置300での第2の表示処理の流れを表わしたフローチャートである。図31のフローチャートに表わされた動作もまた、処理装置300の制御部310に含まれるCPUが、メモリ320に記憶されるプログラムを読み出して実行し、図27に示される各部を機能させることで実現される。
図31は、処理装置300での第2の表示処理の流れを表わしたフローチャートである。図31のフローチャートに表わされた動作もまた、処理装置300の制御部310に含まれるCPUが、メモリ320に記憶されるプログラムを読み出して実行し、図27に示される各部を機能させることで実現される。
図27を参照して、第2の実施の形態にかかる処理装置300での第1の表示処理の流れは、図18のフローチャートに表わされた第1の実施の形態での第1の表示処理の流れと概ね同じである。そのため、図18のフローチャートとの動作の差異について説明する。
第2の表示処理のステップS105でCPUは、第1の表示処理と同様に、表示対象とするエリアについて、当該エリアの検出結果と、当該エリアの環境属性として表わされた人の有無および人の人数に基づいて表示態様を決定する。
第2の表示処理において、CPUは、操作部370から、検出結果を表示させるエリアの指定を受け付けると(ステップS107でYES)、さらに、そのエリアについての検出結果を表示するタイミングであるか否かを判定する。ここでは、当該エリアの環境属性として、当該エリアに人がいることが検出されている場合、CPUは当該エリアの検出結果を表示するタイミングと判断する。一方、表示させるエリアとして指定されたエリアの環境属性として、当該エリアに人がいないことが検出されている場合、当該エリアの検出結果を表示するタイミングではないと判断する。
表示するタイミングと判断した場合(ステップS1061でYES)、さらに、ステップS1062でCPUは、当該エリアの検出結果を表示させる表示装置を決定し、ステップS108でそのエリアの検出結果を決定された表示装置に表示するための処理を実行する。
上記ステップ1062でCPUは、当該処理装置300の表示部350および当該システム1に含まれる表示端末500のうちのその近傍にユーザのいる表示装置を表示する表示装置と決定する。表示端末の位置は、ネットワーク600を介して相互に通信を行なうことで、処理装置300において検出され、記憶されている。エリアごとの人の有無は、属性検出装置200からの各エリアの環境属性として表わされ、処理装置300に送信されている。そこで、処理装置300のCPUは、これらを比較することで、当該処理装置300の表示部350の近傍、および当該システム1に含まれる各表示端末500の近傍にユーザの有無を判断し、ユーザが近傍にいると判断される表示端末500および/または表示部350を、当該エリアの検出結果を表示する表示装置として決定する。
なお、ステップS1062での決定方法として、上述の方法は一例であって、他の方法であってもよい。たとえば、各表示端末500自体が赤外線センサ等の人感センサを備えており、それによる検出結果を処理装置300に対して送信することで、処理装置300においてユーザが近傍にいる表示端末500を特定できるようにしてもよい。
このように判断して表示することで、人がいると判断されたエリアの検出結果が表示され、人がいないと判断されたエリアの検出結果は表示されない。さらに、ユーザが表示端末の近傍にいるときに表示され、近傍にいないときには表示されない。このため、必要な情報が必要なタイミングで表示されることになり、効率的な表示が実現される。
さらに、処理装置300のCPUは、表示端末と人との位置関係や、表示端末の状態を考慮して表示の方法について決定してもよい。
一例として、処理装置300のCPUは表示させると決定された表示端末500の位置と検出された人の位置との距離を算出し、その距離が所定以上であった場合、検出結果の表示に加えて、音や光などで表示が行なわれていることを報知させるための制御信号を表示端末500に対して送信してもよい。このようにすることで、表示端末500からやや離れているユーザに表示の確認を促すことができて、より効率的な表示が実現される。
また、処理装置300のCPUは、表示させると決定された表示端末500から、表示のタイミングにおいて操作を受け付けていない状態であることを示す信号を取得した場合、表示データに先立って、または表示データと共に、音や振動やランプの点灯などで表示対象である検出結果があることを報知させるための制御信号を表示端末500に対して送信してもよい。このようにすることで、表示端末500の操作の開始をユーザに促すことができて、より効率的な表示が実現される。なお、先立って報知用の制御信号を送信する場合には、表示端末500からの要求に応じて表示データを送信するようにしてもよい。
さらに、処理装置300のCPUは、上述の音や振動やランプの点灯の態様を検出結果に応じて決定してもよい。具体的には、菌の量が「多い」ランクであったり、環境検出装置100とユーザとの間の距離が所定距離よりも短い距離であったりする場合には、そうでない場合よりも音を大きくしたり、振動を大きくしたり、ランプの点灯の間隔を短くしたり、光量を大きくしたり、などとすることができる。このようにすることで、報知を確認した段階で検出結果を概ね把握することができ、より効率的な表示が実現される。
<表示の他の例>
なお、以上の説明では、環境検出装置100に備えられる微生物センサ、埃センサ、湿度センサ、温度センサ、ガスセンサのうちの微生物センサ1001での検出結果を表示するものとしている。つまり、1種類のセンサでの検出結果の表示について説明されている。
なお、以上の説明では、環境検出装置100に備えられる微生物センサ、埃センサ、湿度センサ、温度センサ、ガスセンサのうちの微生物センサ1001での検出結果を表示するものとしている。つまり、1種類のセンサでの検出結果の表示について説明されている。
複数のセンサが備えられる環境検出装置100での検出結果の表示の例として、以上の説明のように、いずれか3つのセンサでの検出結果である3つのパラメータのみ表示する表示方法のほか、複数のセンサでの検出結果である複数のパラメータを組み合わせて表示する表示方法が採用されてもよい。
図32Aは、3つのパラメータとして微生物センサ1001で検出された菌の量を表示する表示例を表わしており、一例として、複数の色(赤、黄、青)のそれぞれの色が単一色で点灯するランプで表示する例が示されている。
この表示を行なうため、処理装置300のメモリ320の所定領域には、図32Bに示されるような、菌の量とランプの色との対応関係が予め記憶されており、CPUは、環境検出装置100からの検出結果である菌の量をしきい値と比較して、当該対応関係を参照してランプの色を決定する。
図33Aは、2つのパラメータとして微生物センサ1001で検出された菌の量と、他のパラメータとを表示する例を表わしており、具体例として菌の量と湿度との組み合わせの表示例を表わしている。この表示によって、カビの発生確率が示され、メータが高い(長い)ほどカビの発生確率が高く、メータが低い(短い)ほどカビの発生確率が低いことを表わしている。
この表示を行なうため、処理装置300のメモリ320の所定領域には、図33Bに示されるような、菌の量および湿度の組み合わせとメータの高さ(長さ)との対応関係が予め記憶されており、CPUは、当該対応関係を参照して、環境検出装置100からの検出結果である菌の量および湿度の組み合わせに基づいてメータの高さ(長さ)を決定する。
図34Aは、2つのパラメータとして微生物センサ1001で検出された菌の量と、他のパラメータとを表示する例を表わしており、具体例として菌の量と埃の量との組み合わせの表示例を表わしている。この表示によって、検出対象の空間内の空気の質(清浄度)が示され、メータが高い(長い)ほど清浄度が高く、メータが低い(短い)ほど清浄度が低いことを表わしている。
この表示を行なうため、処理装置300のメモリ320の所定領域には、図34Bに示されるような、菌の量および埃の量の組み合わせとメータの高さ(長さ)との対応関係が予め記憶されており、CPUは、当該対応関係を参照して、環境検出装置100からの検出結果である菌の量および埃の量の組み合わせに基づいてメータの高さ(長さ)を決定する。
なお、2つ以上のパラメータの組み合わせを表示する場合も同様である。つまり、これらパラメータの量の組み合わせと表示内容との対応が予め処理装置300のメモリ320の所定領域に記憶されており、CPUが当該対応関係を参照して、環境検出装置100からの検出結果に基づいて表示内容を決定することで実現される。
さらに、表示は図32A~図34Bに表わされたような棒状のメータに限定されず他の形状であってもよい。他の例として、たとえば、図35に示されたようなインジケータを利用してもよいし、円グラフや折れ線グラフで表示するものであってもよい。また、先述の報知の例と同様に、表示に限定されず、音や光やバイブレーションなどの出力形態であってもよく、その場合、音の間隔や音量、発光間隔や発光量、バイブレーションの間隔や量などを利用して検出結果を出力してもよい。
<第2の実施の形態の効果>
第2の実施の形態にかかるシステム1においてこのような表示がなされることで、表示対象のエリアの状態(人の有無・分布、風向き等)と環境センサの検出情報とが関連付けて表示されるため、ユーザは、表示対象のエリアの状態を直感的に把握することができる。
第2の実施の形態にかかるシステム1においてこのような表示がなされることで、表示対象のエリアの状態(人の有無・分布、風向き等)と環境センサの検出情報とが関連付けて表示されるため、ユーザは、表示対象のエリアの状態を直感的に把握することができる。
また、検出結果を、当該エリアの検出結果や環境属性や検出結果を表示する表示装置に応じた適切なタイミング、すなわち、視認可能なユーザがいるタイミングで表示することができる。
また、システム1ではユーザの位置が検出されるため、当該ユーザに対して、自身の周辺の空気の状態を視認可能な適切なタイミング、視認可能な適切な表示装置を用いて報知することができる。
[第3の実施の形態]
<動作概要>
第3の実施の形態にかかるシステム1では、処理装置300は、環境検出装置100における検出結果および当該環境検出装置100の設置されている位置に応じた、システム1に含まれる装置の制御を行なう。処理装置300の制御対象となる装置としては、イオン発生装置である調整装置400や、環境検出装置100が該当する。
<動作概要>
第3の実施の形態にかかるシステム1では、処理装置300は、環境検出装置100における検出結果および当該環境検出装置100の設置されている位置に応じた、システム1に含まれる装置の制御を行なう。処理装置300の制御対象となる装置としては、イオン発生装置である調整装置400や、環境検出装置100が該当する。
<機能構成>
図36は、第3の実施の形態にかかる制御を行なうための処理装置300の機能構成の具体例を示すブロック図である。図36に示される各機能は、処理装置300の制御部310に含まれるCPUがメモリ320に記憶されるプログラムを読み込んで実行することで、主にCPUに形成されるものであるが、少なくとも一部が電気回路などのハードウェア構成で実現されてもよい。
図36は、第3の実施の形態にかかる制御を行なうための処理装置300の機能構成の具体例を示すブロック図である。図36に示される各機能は、処理装置300の制御部310に含まれるCPUがメモリ320に記憶されるプログラムを読み込んで実行することで、主にCPUに形成されるものであるが、少なくとも一部が電気回路などのハードウェア構成で実現されてもよい。
図36を参照して、第2の実施の形態にかかる制御を行なうための処理装置300は、環境検出装置100からの環境情報として測定値と当該環境検出装置100の識別情報との入力を受け付けるための測定値入力部311と、属性検出装置200からの環境属性として検出対象範囲内の人の有無・その位置、風向・風量、および環境検出装置100の位置などの情報の入力を受け付けるための属性入力部312と、これら入力された情報に基づいて、調整装置400や環境検出装置100の制御内容を決定するための制御決定部317と、制御内容に応じた制御信号を予め記憶しておき、または生成し、対象の装置に対して通信部330から当該制御信号を出力する処理を実行するための出力部318とを含む。
第3の実施の形態にかかる制御のために、メモリ320の所定領域には、予め検出結果と制御対象とする装置およびその制御内容との対応関係が記憶されている。検出結果として用いるパラメータは菌の量、などの単一のパラメータであってもよいし、菌の量および湿度、などの2つまたは3つ以上のパラメータの組み合わせであってもよい。
また、検出結果は環境検出装置100からの検出結果である環境情報と、属性検出装置200からの検出結果である環境属性との組み合わせであってもよい。
図37Aおよび図37Bは、メモリ320の所定領域に記憶されている検出結果と制御対象とする装置およびその制御内容との対応関係の具体例を示す図である。図37Aおよび図37Bの例では、イオン発生装置である調整装置400を制御対象としたときの、検出結果と調整装置400の制御内容との対応関係が規定されている。
詳しくは、図37Aを参照して、一例として、イオン発生装置である調整装置400の図示しないスイッチのON/OFFを制御するものとして、当該調整装置400の設置されているエリアに人がいて、かつ菌の量が「多い」ランクである場合には当該調整装置400のスイッチをON、つまり起動させ、それ以外の条件の場合にはOFFする、ことが規定されている。
また、図37Bを参照して、他の例として、イオン発生装置である調整装置400の駆動量(風量)を制御するものとして、当該調整装置400の設置されているエリアに人がいて、かつ菌の量が「多い」ランクである場合には風量を「強」、菌の量が「少ない」レベルである場合には風量を「弱」とする、ことが規定されている。
なお、ここでのランクわけについては、第1の実施の形態で説明したランクわけと同様とする。
<動作フロー>
図38は、第3の実施の形態にかかる処理装置300での制御動作の流れを表わしたフローチャートである。図38のフローチャートに表わされた動作は、処理装置300の制御部310に含まれるCPUが、メモリ320に記憶されるプログラムを読み出して実行し、図36に示される各部を機能させることで実現される。
図38は、第3の実施の形態にかかる処理装置300での制御動作の流れを表わしたフローチャートである。図38のフローチャートに表わされた動作は、処理装置300の制御部310に含まれるCPUが、メモリ320に記憶されるプログラムを読み出して実行し、図36に示される各部を機能させることで実現される。
図38を参照して、処理装置300のCPUは、環境検出装置100からの検出結果である環境情報、および属性検出装置200からの検出結果である環境属性の入力を受け付け(ステップS301)、それらに基づいて、メモリ320の所定領域に記憶されている対応関係を参照して、制御対象とする装置および制御内容を特定し(ステップS303)、当該制御対象とする装置に決定された制御内容の制御を行なうための制御信号を出力する(ステップS305)。
図37Aの例で説明すると、あるエリアについて、環境情報として菌の量が「多い」ランクである検出結果が得られ、当該エリアに人がいることが表わされた環境属性が得られた場合、CPUは、当該エリアに設置されているイオン発生装置である調整装置400をONし、イオンの発生を開始させるための制御信号を当該イオン発生装置に対して出力する。また、図37Bの例では、イオン発生装置である調整装置400からの風量を「強」とするための制御信号を当該イオン発生装置に対して出力する。
ここで、調整装置400が当該システム1に複数含まれる場合や、設置される位置が可動である場合には、上記ステップS303で処理装置300のCPUは、調整装置400とネットワーク600を介した通信を行なうことによって得られた調整装置400の設置された位置を記憶しておき、当該記憶されている調整装置400の位置に基づいて、制御対象となる調整装置400を特定する。
なお、以上の例では制御対象とする装置が調整装置400の場合が説明されているが、上述のように、制御対象とする装置は環境検出装置100であってもよい。この場合、環境検出装置100は図示しない移動機構を有する。移動機構としては、たとえば室内に設けられたレール上を移動する車輪や、リフトなどが該当する。この移動は、処理装置300からの制御信号に従って行なわれるものとする。
環境検出装置100の制御の一例として、たとえば、環境属性として人がいることが検出されたエリアについて、環境検出装置100が設置されておらず環境情報が得られていない場合、当該エリアに最も近い位置に設置されている環境検出装置100を特定して、当該環境検出装置100を当該エリアに移動させる、などの制御が挙げられる。このようにすることで、環境情報を得たいエリアに環境検出装置100を自動的に移動させ、当該エリアの環境情報を得ることが可能となる。
<第3の実施の形態の効果>
第3の実施の形態にかかるシステム1においてこのような制御が行なわれることで、環境検出装置100での検出結果である環境情報と、属性検出装置200での検出結果である環境属性とに基づいて、対応したエリアにある他の装置を当該エリアの空気の状態が最適となるように動作させることができるため、不必要なタイミングで動作させることなく、人がいることが検出されたエリアの環境を清浄な環境とするよう動作させることができる。
第3の実施の形態にかかるシステム1においてこのような制御が行なわれることで、環境検出装置100での検出結果である環境情報と、属性検出装置200での検出結果である環境属性とに基づいて、対応したエリアにある他の装置を当該エリアの空気の状態が最適となるように動作させることができるため、不必要なタイミングで動作させることなく、人がいることが検出されたエリアの環境を清浄な環境とするよう動作させることができる。
[第4の実施の形態]
<動作概要>
第4の実施の形態にかかるシステム1では、検出結果の表示として、環境情報と環境属性とに基づくメッセージを表示する。
<動作概要>
第4の実施の形態にかかるシステム1では、検出結果の表示として、環境情報と環境属性とに基づくメッセージを表示する。
メッセージの出力先として、以降の説明では処理装置300の表示部350であるものとするが、第1の実施の形態、第2の実施の形態などと同様に、ユーザのいる位置に最も近い表示端末500であってもよい。また、上の例と同様に、表示に先立って、表示用のデータがあることを光や音などで報知して、所定の操作を受け付けることで表示するようにしてもよい。
<機能構成>
図39は、第4の実施の形態にかかる表示処理を行なうための処理装置300の機能構成の具体例を示すブロック図である。図39に示される各機能は、処理装置300の制御部310に含まれるCPUがメモリ320に記憶されるプログラムを読み込んで実行することで、主にCPUに形成されるものであるが、少なくとも一部が電気回路などのハードウェア構成で実現されてもよい。
図39は、第4の実施の形態にかかる表示処理を行なうための処理装置300の機能構成の具体例を示すブロック図である。図39に示される各機能は、処理装置300の制御部310に含まれるCPUがメモリ320に記憶されるプログラムを読み込んで実行することで、主にCPUに形成されるものであるが、少なくとも一部が電気回路などのハードウェア構成で実現されてもよい。
図39を参照して、第4の実施の形態にかかる表示処理を行なうための処理装置300は、環境検出装置100からの環境情報として測定値と当該環境検出装置100の識別情報との入力を受け付けるための測定値入力部311と、属性検出装置200からの環境属性として検出対象範囲内の人の有無・その位置、風向・風量、および環境検出装置100の位置などの情報の入力を受け付けるための属性入力部312と、これら入力された情報に基づいて、メッセージ内容を決定するための表示決定部319と、決定されたメッセージを表示部350などに表示させる処理を実行するための表示処理部315とを含む。
第4の実施の形態にかかる表示処理を実行するために、メモリ320の所定領域には、予め検出結果である環境情報および環境属性の組み合わせとメッセージ内容との対応関係が記憶されている。検出結果として用いるパラメータは菌の量、などの単一のパラメータであってもよいし、菌の量および湿度、などの2つまたは3つ以上のパラメータの組み合わせであってもよい。また、環境属性のパラメータも人の有無、などの単一のパラメータであってもよいし、人の有無および風量、などの2つまたは3つ以上のパラメータの組み合わせであってもよい。
図40は、メモリ320の所定領域に記憶されている環境情報および環境属性の組み合わせとメッセージ内容との対応関係の具体例を示す図である。図40の例では、環境情報として、菌の量のパラメータと、その他のパラメータ(埃、花粉、におい、温度、湿度等)との組み合わせと、環境属性として、人の分布(有無)と人から環境検出装置100までの距離との組み合わせと、に応じたメッセージが規定されている。
詳しくは、図40を参照して、表示対象のエリアについて、環境検出装置100の微生物センサ1001からの検出結果が菌の量が「多い」ランクである場合であって、かつ、他のセンサからの検出結果で表わされる量(埃、花粉、ガスの量)が「多い」ランクである場合、当該エリアに人がおり、当該人の位置から環境検出装置100の位置までの距離が規定距離よりも短い(近い)場合には、「周辺空気が汚染、注意せよ。」「雑菌/カビに注意せよ。」とのメッセージ内容が規定されている。また、当該人の位置から環境検出装置100の位置までの距離が規定距離よりも長い(遠い)場合には、「室内に汚染領域があります。」とのメッセージ内容が規定されている。
他のセンサからの検出結果で表わされる量(埃、花粉、ガスの量)が「少ない」ランクである場合、当該エリアに人がおり、当該人の位置から環境検出装置100の位置までの距離が規定距離よりも短い(近い)場合には、「雑菌/カビに注意せよ。」とのメッセージ内容が規定されている。また、当該人の位置から環境検出装置100の位置までの距離が規定距離よりも長い(遠い)場合には、「室内に雑菌/カビ発生の可能性有」とのメッセージ内容が規定されている。
菌の量が「少ない」ランクである場合であって、かつ、他のセンサからの検出結果で表わされる量(埃、花粉、ガスの量)が「多い」ランクである場合、当該エリアに人がおり、当該人の位置から環境検出装置100の位置までの距離が規定距離よりも短い(近い)場合には、「周辺空気が汚染、注意せよ。」とのメッセージ内容が規定されている。また、当該人の位置から環境検出装置100の位置までの距離が規定距離よりも長い(遠い)場合には、「室内に汚れている可能性有」とのメッセージ内容が規定されている。
他のセンサからの検出結果で表わされる量(埃、花粉、ガスの量)が「少ない」ランクである場合、当該エリアに人がおり、当該人の位置から環境検出装置100の位置までの距離が規定距離よりも短い(近い)場合には、「快適な環境状態です。」とのメッセージ内容が規定されている。また、当該人の位置から環境検出装置100の位置までの距離が規定距離よりも長い(遠い)場合には、「室内環境は快適な環境状態です。」とのメッセージ内容が規定されている。
環境情報のパラメータとして、さらに、温度、湿度を用いてもよいし、他の情報として季節などを用いて、その組み合わせでメッセージが規定されていてもよい。
なお、ここでのランクわけについては、第1の実施の形態で説明したランクわけと同様とする。
メッセージ内容は、予めメモリ320の所定領域に記憶されているものとするが、所定の操作によって入力や変更が可能であってもよい。
<動作フロー>
第4の実施の形態にかかる処理装置300での表示動作の流れは、図38のフローチャートに示された第3の実施の形態にかかる処理装置300での制御動作の流れと概ね同様である。
第4の実施の形態にかかる処理装置300での表示動作の流れは、図38のフローチャートに示された第3の実施の形態にかかる処理装置300での制御動作の流れと概ね同様である。
すなわち、処理装置300のCPUは、環境検出装置100からの検出結果である環境情報、および属性検出装置200からの検出結果である環境属性の入力を受け付け、それらに基づいて、メモリ320の所定領域に記憶されている対応関係を参照して、メッセージ内容を特定し、表示部350に決定されたメッセージの表示を行なうための処理を実行する。
メッセージの内容を特定する際、処理装置300のCPUは、属性検出装置200によって検出された人の位置と環境検出装置100との位置に基づいて、それらの間の距離を算出する。そして、その距離と、予め記憶しているしきい値とを比較することで、この距離が「近い」か「遠い」かを判別する。
なお、好ましくは、処理装置300は、第2の実施の形態において説明された処理と同様の処理を行なって、環境検出装置100によって検出されたユーザの位置の近傍に設置されている(または当該ユーザが携帯している)表示端末500を特定し、その表示端末500にメッセージを表示するようにしてもよい。その場合、図40の例に示されたように、表示対象のエリアに人がいないと検出されている場合、メッセージの表示を行なわないようにしてもよい。
<第4の実施の形態の効果>
第4の実施の形態にかかるシステム1においてこのような制御が行なわれることで、検出された空気の状態が分かりやすいメッセージで表示されるため、ユーザは容易に空気の状態を把握することができる。
第4の実施の形態にかかるシステム1においてこのような制御が行なわれることで、検出された空気の状態が分かりやすいメッセージで表示されるため、ユーザは容易に空気の状態を把握することができる。
[変形例]
なお、以上の説明では、環境検出装置100の位置は属性検出装置200が検出して環境属性として処理装置300に送り、属性検出装置200および表示端末500の位置は処理装置300が検出するものとしている。
なお、以上の説明では、環境検出装置100の位置は属性検出装置200が検出して環境属性として処理装置300に送り、属性検出装置200および表示端末500の位置は処理装置300が検出するものとしている。
しかしながら、属性検出装置200が環境検出装置100、属性検出装置200、および表示端末500の位置を検出し、処理装置300に送るようにしてもよい。または、環境検出装置100、属性検出装置200、および表示端末500の少なくともいずれかは自身の設置された位置を記憶しておき、自身の識別情報と共にその位置を特定するための識別情報を処理装置300に送信するようにしてもよい。これらの識別情報は、たとえば検出結果と共に送信されてもよいし、処理装置300からの要求に応じて送信されてもよい。位置を特定するための識別情報は、たとえば、具体的に設置された位置を表わす情報(緯度・経度、1階のリビング、等)や、ネットワーク600で通信するためのネットワークアドレス、などであってもよい。
さらに、以上の説明において、第1の実施の形態~第4の実施の形態のそれぞれの例を挙げて説明を行なっているが、1以上の実施の形態が組み合わされてもよい。
処理装置300での処理をコンピュータに実行させるためのプログラムを提供することもできる。このようなプログラムは、コンピュータに付属するフレキシブルディスク、CD-ROM(Compact Disk-Read Only
Memory)、ROM(Read Only Memory)、RAM(Random Access Memory)およびメモリカードなどのコンピュータ読取り可能な記録媒体にて記録させて、プログラム製品として提供することもできる。あるいは、コンピュータに内蔵するハードディスクなどの記録媒体にて記録させて、プログラムを提供することもできる。また、ネットワークを介したダウンロードによって、プログラムを提供することもできる。
Memory)、ROM(Read Only Memory)、RAM(Random Access Memory)およびメモリカードなどのコンピュータ読取り可能な記録媒体にて記録させて、プログラム製品として提供することもできる。あるいは、コンピュータに内蔵するハードディスクなどの記録媒体にて記録させて、プログラムを提供することもできる。また、ネットワークを介したダウンロードによって、プログラムを提供することもできる。
なお、本発明にかかるプログラムは、コンピュータのオペレーティングシステム(OS)の一部として提供されるプログラムモジュールのうち、必要なモジュールを所定の配列で所定のタイミングで呼出して処理を実行させるものであってもよい。その場合、プログラム自体には上記モジュールが含まれずOSと協働して処理が実行される。このようなモジュールを含まないプログラムも、本発明にかかるプログラムに含まれ得る。
また、本発明にかかるプログラムは他のプログラムの一部に組み込まれて提供されるものであってもよい。その場合にも、プログラム自体には上記他のプログラムに含まれるモジュールが含まれず、他のプログラムと協働して処理が実行される。このような他のプログラムに組み込まれたプログラムも、本発明にかかるプログラムに含まれ得る。
提供されるプログラム製品は、ハードディスクなどのプログラム格納部にインストールされて実行される。なお、プログラム製品は、プログラム自体と、プログラムが記録された記録媒体とを含む。
今回開示された実施の形態はすべての点で例示であって制限的なものではないと考えられるべきである。本発明の範囲は上記した説明ではなくて請求の範囲によって示され、請求の範囲と均等の意味および範囲内でのすべての変更が含まれることが意図される。
1 システム、2 高圧電源、3 皮膜、4 支持基板、5 ケース、5A 捕集室、5B 検出室、5C’ 孔、5C 壁、6 発光素子、7 レンズ、8 集光レンズ、9 受光素子、10 導入孔、11 排出孔、12 捕集治具、12A 捕集ユニット、13 アパーチャ、15 照射領域、16A,16B シャッタ、17 放電電極、30 信号処理部、31 フィルタ回路、32 パルス幅測定回路、33 パルス幅-電圧変換回路、34 パルス幅-電圧変換回路、35 増幅回路、36 電圧比較回路、40 測定検出部、41 測定制御部、42 記憶部、43,318 出力部、45 算出部、46 外部接続部、47 クロック発生部、48 駆動部、50 空気導入機構、50A ファン、60 ブラシ、70 表示ウィンドウ、71,72,73,74,75,76 マーク、91 ヒータ、100,100A,100B,… 環境検出装置、110,210,310,410 制御部、111 送信処理部、112 応答部、120,220,320,420 メモリ、130,230 第1通信部、140,240 第2通信部、200 属性検出装置、211 人検出部、212 風向・風力検出部、213 装置検出部、300 処理装置、301A,301B 針状電極、302A,302B スイッチ、303A,303B 高圧発生回路、311 測定値入力部、312 属性入力部、313 特定部、314 指示入力部、315 表示処理部、316 判定部、317 制御決定部、319 表示決定部、330,430 通信部、350,550 表示部、370 操作部、400 調整装置、411 計算部、460 調整部、500,500A,500B,… 表示端末、600 ネットワーク、1001 微生物センサ、1002 埃センサ、1003 湿度センサ、1004 温度センサ、1005 ガスセンサ、2001 人感センサ、2002 風向・風力センサ。
Claims (37)
- 空気の状態を検出するためのセンサを含んだ検出装置と接続され、前記検出装置での検出結果を提示するための制御装置であって、
前記検出装置から前記検出結果を含む情報を取得するための第1の取得部と、
前記検出装置の位置を特定する情報を取得するための第2の取得部と、
前記第1の取得部で取得した情報を前記第2の取得部で取得した前記検出装置の位置に基づいて提示するための提示部とを備える、制御装置。 - 前記検出装置の位置するエリアを特定するための識別情報を取得するための第3の取得部をさらに備え、
前記提示部は前記検出結果を前記エリアに対応づけて提示する、請求項1に記載の制御装置。 - 前記第1の取得部は、前記検出装置からの異なる位置での検出結果を取得し、
前記提示部は、前記検出装置のそれぞれの位置するエリアごとに、当該エリアの空気の状態の検出結果として提示用のデータを生成する、請求項2に記載の制御装置。 - 前記提示部は、1つの画面に異なる複数の前記エリアのそれぞれの空気の状態を表示することで前記第1の取得部で取得した情報を提示する、請求項3に記載の制御装置。
- 前記提示部は、前記エリアごとの領域で表示することで前記第1の取得部で取得した情報を提示し、
検出結果とエリアの表示態様との対応関係を記憶するための第1の記憶部をさらに備え、
前記提示部は、前記検出結果に基づいて、前記検出装置の位置するエリアの表示領域の表示態様を決定する処理をさらに実行する、請求項2に記載の制御装置。 - 前記提示部は、表示画面において、複数の前記エリアを含んだ領域の空気の状態の検出結果を表示する第1の画面と、前記エリアごとの空気の状態の検出結果を表示する第2の画面とを表示することで前記第1の取得部で取得した情報を提示する、請求項2に記載の制御装置。
- 前記第1の取得部は、前記検出装置からの同じエリア内における異なる位置での検出結果を取得し、
前記提示部は、前記エリアの空気の状態の検出結果として、前記エリアにおける前記異なる位置のそれぞれの位置の前記検出結果を提示する、請求項2に記載の制御装置。 - ユーザの位置を特定する情報を取得するための第4の取得部と、
ユーザの位置および前記検出装置の位置の間の距離と空気の状態を表わす表示内容との対応関係を記憶するための第2の記憶部とをさらに備え、
前記提示部は、
前記ユーザの位置と前記検出装置の位置との間の距離を算出する処理と、
前記距離に基づいて提示内容を特定する処理とをさらに実行する、請求項1に記載の制御装置。 - 前記提示部は、前記検出装置からの前記検出結果を表わす提示と、前記ユーザの位置と前記検出装置の位置との間の距離を表わす提示と、前記距離に応じて前記検出装置からの前記検出結果を表わす提示とを行なう、請求項8に記載の制御装置。
- 前記検出装置は風向および風力をさらに検出し、
前記提示部は、前記風力の前記検出装置と前記ユーザとの方向に水平な成分を算出する処理をさらに実行し、
前記提示部は、前記検出された風力のうちの前記検出装置と前記ユーザとの方向に水平な成分を併せて提示する、請求項8に記載の制御装置。 - 複数の提示装置に接続され、
前記複数の提示装置のそれぞれの位置を特定する情報を取得するための第5の取得部をさらに備え、
前記提示部は、
前記複数の提示装置のうち、前記ユーザの位置に最も近い提示装置を特定する処理と、
前記ユーザの位置に最も近い提示装置に対して提示用のデータを送信して前記提示を行なわせる処理とをさらに実行する、請求項8に記載の制御装置。 - 空気の状態を検出するためのセンサを含んだ検出装置における検出結果を提示する方法であって、
検出装置から検出結果を含む情報を取得するステップと、
前記検出装置の位置を特定する情報を取得するステップと、
前記検出装置から取得した前記検出結果を含む情報を前記検出装置の位置に基づいて提示するステップとを備える、提示方法。 - 検出装置の位置するエリアを特定するための識別情報を取得するステップをさらに備え、
前記提示するステップは、検出結果を前記エリアに対応づけて提示する、請求項12に記載の提示方法。 - ユーザの位置を特定する情報を取得するステップをさらに備え、
前記提示するステップは、
前記ユーザの位置と前記検出装置の位置との間の距離を算出するステップと、
予め記憶している、ユーザの位置および前記検出装置の位置の間の距離と空気の状態を表わす表示内容との対応関係に従って、前記距離に基づいて提示内容を特定するステップとを含む、請求項12に記載の提示方法。 - 検出対象空間内の空気の状態を検出するためのセンサを含んだ第1の検出装置と、検出対象空間内の人の有無を検知するためのセンサを含んだ第2の検出装置と接続された制御装置であって、
前記第1の検出装置および前記第2の検出装置から検出結果を含む情報を取得するための第1の取得部と、
前記第1の検出装置および前記第2の検出装置の位置を特定する情報を取得するための第2の取得部と、
前記第1の取得部で得られた前記第1の検出装置での前記検出結果および前記第2の検出装置での前記検出結果を、前記第2の取得部で得られたそれぞれの検出装置の位置に応じて提示するための制御部とを備え、
前記制御部は、前記第1の検出装置および前記第2の検出装置の位置するエリアを特定し、
前記エリアごとに前記第1の検出装置および前記第2の検出装置の検出結果を提示する、制御装置。 - 前記第1の検出装置での検出結果と提示態様との対応関係を記憶するための第2の記憶部をさらに備え、
前記制御部は、前記第1の検出装置での前記検出結果の提示態様を決定する処理をさらに実行する、請求項15に記載の制御装置。 - 前記制御部は、前記エリアごとの当該エリアの空気の状態の検出結果の提示用のデータを生成し、人がいることが検出されたエリアについての前記提示するためのデータを提示装置に対して送信して提示させる、請求項16に記載の制御装置。
- 前記提示装置の位置を特定する情報を取得するための第3の取得部をさらに備え、
前記制御部は、前記提示装置の位置から所定範囲内に人がいると判断された場合に、前記提示装置に対して前記提示用のデータを送信して提示させる、請求項17に記載の制御装置。 - 前記第2の検出装置からの前記検出結果には前記検出対象空間内の人数も含まれ、
前記制御部は、前記第2の検出装置からの前記検出結果として、前記エリアごとの人の有無と、当該エリアで検出された人数とを提示させる、請求項18に記載の制御装置。 - 前記制御部は、前記提示装置の位置から前記所定範囲内に人がいると判断され、かつ、前記提示装置から前記人までの距離が所定距離以上と判断された場合に、前記提示装置に対して提示用のデータに併せて報知動作を行なわせるための制御信号を出力する、請求項18に記載の制御装置。
- 前記制御部は、前記提示装置の位置から前記所定範囲内に人がいると判断され、かつ、前記提示装置が直ちに操作入力を受け付けるモードでないと判断された場合に、前記提示装置に対して提示用のデータに併せて報知動作を行なわせるための制御信号を出力する、請求項18に記載の制御装置。
- 前記制御部は、1つの画面に異なる複数の前記エリアのそれぞれの空気の状態を表示することで前記検出結果を提示する、請求項15に記載の制御装置。
- 検出対象空間内の空気の状態を検出するためのセンサを含んだ第1の検出装置と、検出対象空間内の人の有無を検知するためのセンサを含んだ第2の検出装置とでの検出結果を提示する方法であって、
前記第1の検出装置および前記第2の検出装置から前記検出結果を含む情報を取得するステップと、
前記第1の検出装置および前記第2の検出装置の位置を特定する情報を取得するステップと、
前記第1の検出装置での前記検出結果および前記第2の検出装置での前記検出結果をそれぞれの検出装置の位置に応じて提示するステップとを備え、
前記提示するステップは、
前記第1の検出装置および前記第2の検出装置の位置するエリアを特定するステップと、
前記エリアごとに前記第1の検出装置および前記第2の検出装置の検出結果を提示するステップとを含む、提示方法。 - 対象空間内の空気の状態を調整するための調整機構を含む調整装置に接続される制御装置であって、
検出対象空間内の空気の状態を検出するためのセンサを含む第1の検出装置と、検出対象空間内の人の有無を検知するためのセンサを含む第2の検出装置とから検出結果の入力を含む情報を取得するための第1の取得部と、
前記第1の取得部で取得された情報に基づいて前記調整装置を制御するための制御部とを備える、制御装置。 - 前記第1の検出装置および前記第2の検出装置の位置を特定する情報を取得するための第2の取得部と、
制御単位となるエリアを特定する情報を記憶するための記憶部とをさらに備え、
前記制御部は、同一のエリア内に位置する前記第1の検出装置からの前記検出結果および前記第2の検出装置からの前記検出結果の組み合わせに基づいて前記調整装置を制御する、請求項24に記載の制御装置。 - 前記調整装置の位置を特定する情報を取得するための第3の取得部をさらに備え、
前記制御部は、それぞれ前記調整装置と同一のエリア内に位置する前記第1の検出装置からの前記検出結果および前記第2の検出装置からの前記検出結果の組み合わせに基づいて前記調整装置を制御する、請求項25に記載の制御装置。 - 前記第1の検出装置は空気中の微生物を検出するための検出装置であって、
前記調整装置は空気清浄機であって、
前記制御部は、前記第1の検出装置によって検出された微生物の量がしきい値よりも多く、かつ前記第2の検出装置によって人がいると検出された場合には、予め記憶している、前記第1の検出装置の検出結果、前記第2の検出装置の検出結果、および前記調整装置の駆動の対応関係に従って前記調整装置の駆動をONにし、それ以外の場合には前記調整装置の駆動をOFFする、請求項24に記載の制御装置。 - 前記第1の検出装置は空気中の微生物を検出するための検出装置であって、
前記調整装置は空気清浄機であって、
前記制御部は、前記第1の検出装置によって検出された微生物の量がしきい値よりも多く、かつ前記第2の検出装置によって人がいると検出された場合には、予め記憶している、前記第1の検出装置の検出結果、前記第2の検出装置の検出結果、および前記調整装置の駆動の対応関係に従って前記調整装置の駆動量を規定量よりも大きい量とし、それ以外の場合には前記調整装置の駆動量を前記規定量よりも小さい量とする、請求項24に記載の制御装置。 - 対象空間内の空気の状態を調整するための調整機構を含む調整装置を制御する制御方法であって、
検出対象空間内の空気の状態を検出するためのセンサを含む第1の検出装置と、検出対象空間内の人の有無を検知するためのセンサを含む第2の検出装置とから検出結果の入力を含む情報を取得するステップと、
前記取得された情報に基づいて前記調整装置を制御するステップとを備える、制御方法。 - 検出対象空間内の空気の状態を検出するためのセンサを含んだ第1の検出装置からの検出結果を含む入力情報と、検出対象空間内の人の有無を検知するためのセンサを含んだ第2の検出装置からの検出結果を含む入力情報とに基づいた情報の提示を制御するための制御部を備える、制御装置。
- 前記第1の検出装置と通信するための第1の通信部と、
前記第2の検出装置と通信するための第2の通信部とをさらに備える、請求項30に記載の制御装置。 - 前記第1の検出装置および前記第2の検出装置の位置を特定する情報を取得するための第1の取得部と、
制御単位となるエリアを特定する情報を記憶するための記憶部とをさらに備え、
前記制御部は、同一のエリアに位置する前記第1の検出装置からの前記検出結果および前記第2の検出装置からの前記検出結果との組み合わせに基づいて前記提示の内容を決定するための決定部を含む、請求項30に記載の制御装置。 - 前記決定部は、予め記憶されている、前記第1の検出装置の検出結果、前記第2の検出装置の検出結果である人の有無、および前記第2の検出装置で検出された人の位置と前記第1の検出装置の設置された位置との間の距離の組み合わせと提示の内容との対応関係に基づいて前記提示の内容を決定し、
前記制御部は、前記第2の検出装置で検出された人の位置と前記第1の検出装置の設置された位置との間の距離を算出する処理をさらに実行する、請求項32に記載の制御装置。 - 前記第1の検出装置は、前記検出対象空間内の空気の状態を検出するためのセンサとして複数のセンサを含んで、前記第1の検出装置での検出結果には前記複数のセンサのそれぞれでの検出結果が含まれ、
前記決定部は、予め記憶されている、前記第1の検出装置の検出結果である前記複数のセンサのそれぞれでの検出結果の組み合わせと前記第2の検出装置の検出結果との組み合わせと、提示の内容との対応関係に基づいて前記提示の内容を決定する、請求項30に記載の制御装置。 - 前記制御部は、前記第2の検出装置において人がいることが検出されたエリアについて前記情報の提示を実行する、請求項30に記載の制御装置。
- 前記情報の提示を行なう提示装置の位置を特定する情報を取得するための第2の取得部をさらに備え、
前記制御部は、前記第2の検出装置によって検出された人から所定範囲内にある提示装置に前記情報の提示をさせる、請求項30に記載の制御装置。 - 検出対象空間内の空気の状態を検出するためのセンサを含んだ第1の検出装置と、検出対象空間内の人の有無を検知するためのセンサを含んだ第2の検出装置とでの検出結果に基づいた情報を提示する方法であって、
前記第1の検出装置および前記第2の検出装置から前記検出結果を含む入力情報を受け付けるステップと、
記憶されている、前記第1の検出装置の検出結果および前記第2の検出装置の検出結果の組み合わせと提示の内容との対応関係に従って、前記第1の検出装置からの前記検出結果と前記第2の検出装置からの前記検出結果との組み合わせに基づいて前記提示の内容を決定するステップと、
前記内容を提示させるための処理を実行するステップとを備える、提示方法。
Applications Claiming Priority (8)
| Application Number | Priority Date | Filing Date | Title |
|---|---|---|---|
| JP2011-125083 | 2011-06-03 | ||
| JP2011125082A JP2012251889A (ja) | 2011-06-03 | 2011-06-03 | 制御装置および提示方法 |
| JP2011125083A JP2012251890A (ja) | 2011-06-03 | 2011-06-03 | 制御装置および提示方法 |
| JP2011-125085 | 2011-06-03 | ||
| JP2011125084A JP2012251732A (ja) | 2011-06-03 | 2011-06-03 | 制御装置および制御方法 |
| JP2011125085A JP2012251891A (ja) | 2011-06-03 | 2011-06-03 | 制御装置および提示方法 |
| JP2011-125082 | 2011-06-03 | ||
| JP2011-125084 | 2011-06-03 |
Publications (1)
| Publication Number | Publication Date |
|---|---|
| WO2012165558A1 true WO2012165558A1 (ja) | 2012-12-06 |
Family
ID=47259410
Family Applications (1)
| Application Number | Title | Priority Date | Filing Date |
|---|---|---|---|
| PCT/JP2012/064105 Ceased WO2012165558A1 (ja) | 2011-06-03 | 2012-05-31 | 制御装置および提示方法 |
Country Status (1)
| Country | Link |
|---|---|
| WO (1) | WO2012165558A1 (ja) |
Cited By (4)
| Publication number | Priority date | Publication date | Assignee | Title |
|---|---|---|---|---|
| CN105180354A (zh) * | 2015-08-19 | 2015-12-23 | 朱正义 | 一种室内净化设备或调湿设备的智能开关 |
| CN107063951A (zh) * | 2015-11-10 | 2017-08-18 | Lg电子株式会社 | 浮游微生物检测装置 |
| US20230194489A1 (en) * | 2020-05-18 | 2023-06-22 | Ambisense Ltd. | Air quality monitoring device and system |
| EP4175684A4 (en) * | 2020-07-01 | 2024-10-23 | Avid Business Pty Ltd (Acn: 083025003) As Trustee for Cedar Creek Trust | PORTABLE PERSONAL PROTECTION DEVICE |
Citations (9)
| Publication number | Priority date | Publication date | Assignee | Title |
|---|---|---|---|---|
| JP2008075973A (ja) * | 2006-09-21 | 2008-04-03 | Toshiba Corp | 空調用センサーシステム |
| WO2008088020A1 (ja) * | 2007-01-17 | 2008-07-24 | Daikin Industries, Ltd. | 空調吹出パネル、同空調吹出パネルを備えた空調制御システム及び空調制御方法 |
| JP2009103347A (ja) * | 2007-10-22 | 2009-05-14 | Yamaha Corp | 環境制御システム |
| JP2009257617A (ja) * | 2008-04-14 | 2009-11-05 | Daikin Ind Ltd | 空調システム及びその制御方法 |
| JP2010133665A (ja) * | 2008-12-05 | 2010-06-17 | Toshiba Corp | 空調監視制御システム |
| JP2010261643A (ja) * | 2009-05-01 | 2010-11-18 | Daikin Ind Ltd | 空調システム |
| JP2011021931A (ja) * | 2009-07-14 | 2011-02-03 | Sharp Corp | 微生物センサユニットおよび空気調和機 |
| JP2011027362A (ja) * | 2009-07-28 | 2011-02-10 | Mitsubishi Heavy Ind Ltd | 適応画面更新web空調監視装置及び方法並びにシステム |
| JP2011075133A (ja) * | 2009-09-29 | 2011-04-14 | Mitsubishi Electric Corp | 空調システム |
-
2012
- 2012-05-31 WO PCT/JP2012/064105 patent/WO2012165558A1/ja not_active Ceased
Patent Citations (9)
| Publication number | Priority date | Publication date | Assignee | Title |
|---|---|---|---|---|
| JP2008075973A (ja) * | 2006-09-21 | 2008-04-03 | Toshiba Corp | 空調用センサーシステム |
| WO2008088020A1 (ja) * | 2007-01-17 | 2008-07-24 | Daikin Industries, Ltd. | 空調吹出パネル、同空調吹出パネルを備えた空調制御システム及び空調制御方法 |
| JP2009103347A (ja) * | 2007-10-22 | 2009-05-14 | Yamaha Corp | 環境制御システム |
| JP2009257617A (ja) * | 2008-04-14 | 2009-11-05 | Daikin Ind Ltd | 空調システム及びその制御方法 |
| JP2010133665A (ja) * | 2008-12-05 | 2010-06-17 | Toshiba Corp | 空調監視制御システム |
| JP2010261643A (ja) * | 2009-05-01 | 2010-11-18 | Daikin Ind Ltd | 空調システム |
| JP2011021931A (ja) * | 2009-07-14 | 2011-02-03 | Sharp Corp | 微生物センサユニットおよび空気調和機 |
| JP2011027362A (ja) * | 2009-07-28 | 2011-02-10 | Mitsubishi Heavy Ind Ltd | 適応画面更新web空調監視装置及び方法並びにシステム |
| JP2011075133A (ja) * | 2009-09-29 | 2011-04-14 | Mitsubishi Electric Corp | 空調システム |
Cited By (5)
| Publication number | Priority date | Publication date | Assignee | Title |
|---|---|---|---|---|
| CN105180354A (zh) * | 2015-08-19 | 2015-12-23 | 朱正义 | 一种室内净化设备或调湿设备的智能开关 |
| CN107063951A (zh) * | 2015-11-10 | 2017-08-18 | Lg电子株式会社 | 浮游微生物检测装置 |
| CN107063951B (zh) * | 2015-11-10 | 2020-06-16 | Lg电子株式会社 | 浮游微生物检测装置 |
| US20230194489A1 (en) * | 2020-05-18 | 2023-06-22 | Ambisense Ltd. | Air quality monitoring device and system |
| EP4175684A4 (en) * | 2020-07-01 | 2024-10-23 | Avid Business Pty Ltd (Acn: 083025003) As Trustee for Cedar Creek Trust | PORTABLE PERSONAL PROTECTION DEVICE |
Similar Documents
| Publication | Publication Date | Title |
|---|---|---|
| JP2012251889A (ja) | 制御装置および提示方法 | |
| JP2012251732A (ja) | 制御装置および制御方法 | |
| JPWO2011024672A1 (ja) | 表示制御装置 | |
| JP2012072946A (ja) | 空気調和機 | |
| JP5766736B2 (ja) | 空気中の生物由来の粒子を検出するための検出装置および検出方法 | |
| US10345216B2 (en) | Systems, devices, and methods for flow control and sample monitoring control | |
| JP2011097861A (ja) | 微生物検出装置および検出方法 | |
| JP2011083214A (ja) | 微生物検出装置および検出方法 | |
| CN113133315B (zh) | 降低室内氡浓度的通风系统 | |
| JP2012047427A (ja) | 空気清浄機および空気清浄機における表示方法 | |
| WO2012165558A1 (ja) | 制御装置および提示方法 | |
| KR101971055B1 (ko) | 실내 공기질 관리 시스템, 실내 공기질 관리 방법 및 실내 공기질 관리를 제어하는 제어 장치 | |
| WO2016105555A1 (en) | Portable airborne particle counting systems and methods | |
| WO2012165036A1 (ja) | 検出装置および検出方法 | |
| KR20200064957A (ko) | 라돈 저감을 위한 풍량 가변형 환기 시스템 | |
| JP2012251890A (ja) | 制御装置および提示方法 | |
| JP2012251891A (ja) | 制御装置および提示方法 | |
| WO2012029649A1 (ja) | 空気清浄機、空気清浄機における表示方法、および空気調和機 | |
| JP2014092334A (ja) | 空気調和システム | |
| US20240361289A1 (en) | Systems and methods for analyzing air of an indoor environment | |
| KR102101711B1 (ko) | 라돈 저감을 위한 풍량 가변형 환기 시스템 | |
| JP2012127727A (ja) | 検出装置および検出方法 | |
| JP2011045547A (ja) | 電気掃除機 | |
| JP2022167708A (ja) | 微粒子計測器を用いた建物内空気浄化支援システム | |
| TW202507668A (zh) | 環境污染狀態通知系統 |
Legal Events
| Date | Code | Title | Description |
|---|---|---|---|
| 121 | Ep: the epo has been informed by wipo that ep was designated in this application |
Ref document number: 12792527 Country of ref document: EP Kind code of ref document: A1 |
|
| NENP | Non-entry into the national phase |
Ref country code: DE |
|
| 122 | Ep: pct application non-entry in european phase |
Ref document number: 12792527 Country of ref document: EP Kind code of ref document: A1 |