WO2012153964A2 - 지질 프로파일을 이용한 비소세포성 폐암의 조직학적 분류를 위한 정보를 제공하는 방법 - Google Patents
지질 프로파일을 이용한 비소세포성 폐암의 조직학적 분류를 위한 정보를 제공하는 방법 Download PDFInfo
- Publication number
- WO2012153964A2 WO2012153964A2 PCT/KR2012/003571 KR2012003571W WO2012153964A2 WO 2012153964 A2 WO2012153964 A2 WO 2012153964A2 KR 2012003571 W KR2012003571 W KR 2012003571W WO 2012153964 A2 WO2012153964 A2 WO 2012153964A2
- Authority
- WO
- WIPO (PCT)
- Prior art keywords
- lipid profile
- mass spectrometry
- cell lung
- information
- lung cancer
- Prior art date
Links
Images


Classifications
-
- G—PHYSICS
- G01—MEASURING; TESTING
- G01N—INVESTIGATING OR ANALYSING MATERIALS BY DETERMINING THEIR CHEMICAL OR PHYSICAL PROPERTIES
- G01N33/00—Investigating or analysing materials by specific methods not covered by groups G01N1/00 - G01N31/00
- G01N33/48—Biological material, e.g. blood, urine; Haemocytometers
- G01N33/50—Chemical analysis of biological material, e.g. blood, urine; Testing involving biospecific ligand binding methods; Immunological testing
- G01N33/53—Immunoassay; Biospecific binding assay; Materials therefor
- G01N33/574—Immunoassay; Biospecific binding assay; Materials therefor for cancer
- G01N33/57407—Specifically defined cancers
- G01N33/57423—Specifically defined cancers of lung
-
- G—PHYSICS
- G01—MEASURING; TESTING
- G01N—INVESTIGATING OR ANALYSING MATERIALS BY DETERMINING THEIR CHEMICAL OR PHYSICAL PROPERTIES
- G01N33/00—Investigating or analysing materials by specific methods not covered by groups G01N1/00 - G01N31/00
- G01N33/48—Biological material, e.g. blood, urine; Haemocytometers
- G01N33/483—Physical analysis of biological material
-
- G—PHYSICS
- G01—MEASURING; TESTING
- G01N—INVESTIGATING OR ANALYSING MATERIALS BY DETERMINING THEIR CHEMICAL OR PHYSICAL PROPERTIES
- G01N33/00—Investigating or analysing materials by specific methods not covered by groups G01N1/00 - G01N31/00
- G01N33/48—Biological material, e.g. blood, urine; Haemocytometers
- G01N33/50—Chemical analysis of biological material, e.g. blood, urine; Testing involving biospecific ligand binding methods; Immunological testing
- G01N33/53—Immunoassay; Biospecific binding assay; Materials therefor
- G01N33/574—Immunoassay; Biospecific binding assay; Materials therefor for cancer
-
- G—PHYSICS
- G01—MEASURING; TESTING
- G01N—INVESTIGATING OR ANALYSING MATERIALS BY DETERMINING THEIR CHEMICAL OR PHYSICAL PROPERTIES
- G01N33/00—Investigating or analysing materials by specific methods not covered by groups G01N1/00 - G01N31/00
- G01N33/48—Biological material, e.g. blood, urine; Haemocytometers
- G01N33/50—Chemical analysis of biological material, e.g. blood, urine; Testing involving biospecific ligand binding methods; Immunological testing
- G01N33/92—Chemical analysis of biological material, e.g. blood, urine; Testing involving biospecific ligand binding methods; Immunological testing involving lipids, e.g. cholesterol, lipoproteins, or their receptors
Definitions
- the present invention relates to a method for providing information for histological classification of lung cancer by analyzing a sample. More specifically, the present invention provides information for histological classification of non-small cell lung cancer by obtaining a lipid profile of a sample through mass spectrometry. It's about how to do it.
- Lung cancer can be largely divided into non small cell carcinoma and small cell carcinoma.
- Non-small cell lung cancer can be divided into squamous cell carcinoma and adenocarcinoma.
- treatment for squamous cell carcinoma and adenocarcinoma has similar basic principles and indications.
- chemotherapy for chemotherapy for adenocarcinoma and squamous cell carcinoma is different.
- drugs such as EGFR inhibitors or bevacizumab may or may not be available depending on histological type. In other words, accurate histologic differentiation is very important because the applicable anticancer agent is determined according to the histological type.
- Histological differentiation between adenocarcinoma and squamous cell carcinomas is very difficult in biopsy using only a small amount of tissue. About 25% of such biopsies for differentiation have been reported to be impossible with current pathological methods.
- immunostaining chemistry is generally performed to distinguish histologically from adenocarcinoma or squamous cell carcinoma.
- the antibodies used at this time are p63, TTF1, cytokeratins 5/6/7, Napsin A and the like. In this method, sensitivity and specificity are not sufficient, and thus the accuracy is not reported to be relatively high (Am J Surg Pathol 34; 12 (2010): 1805-1811, J Thorac Oncol 5 (2010): 442-447).
- Mass-assisted laser desorption and ionization (MALDI) mass spectormetry (MS) is a very sensitive test that has recently been used directly in human tissues, but it is very recent that frozen sinus tissues have been made using sinapinic acid as a matrix. It has been reported that analysis of frozen tissue can provide useful information for the diagnosis and pathological classification of cancer (Lancet 2003; 362 (9382): 433-449, Cancer Res 2005; 65 (17): 7674-7681, Mol Cell Proteomics 2006; 5: 1975-1983).
- Method for providing information for the histological classification of non-small cell lung cancer using a lipid profile to achieve the technical problem (a) preparing a sample by mixing the matrix (matrix) and human tissue; (b) performing mass spectrometry on the prepared sample; (c) selecting first lipid profile data which is information on a lipid profile from the data obtained by the mass spectrometry; And (d) comparing the first lipid profile data with second lipid profile data, which is information on at least one lipid profile selected from adenocarcinoma tissue and squamous cell carcinoma tissue. It includes; providing information that corresponds to any one of (adenocarcinoma) and squamous cell carcinoma (squamous cell carcinoma).
- the substrate may comprise components used for mass spectrometry on lipid molecules.
- the substrate may include at least one of 2,5-dihydroxybenzoic acid (DHB) and a-cyano-4-hydroxycinnamic acid (CHCA).
- DLB 2,5-dihydroxybenzoic acid
- CHCA a-cyano-4-hydroxycinnamic acid
- the mass spectrometry may be matrix-assisted laser desorption and ionization (MALDI) mass spectrometry.
- MALDI matrix-assisted laser desorption and ionization
- the mass spectrometry is MALDI-TOF MS, MALDI-FTICR-MSn, MALDI-Q-TOF, MALDI-QIT-TOF, MALDI-QIT-FTICR-MS, Field Desoption (FD), 252Cf-Plasma desoprtion (PD) , desoprtion chemical ionization (DCI), secondary ion mass spectrometry (SIMS), fast atom bombardment (FAB), electrospray ionization (ESI), and tandem mass spectrometry.
- FD 252Cf-Plasma desoprtion
- DCI desoprtion chemical ionization
- SIMS secondary ion mass spectrometry
- FAB fast atom bombardment
- ESI electrospray ionization
- step (b) may be a step of performing mass spectrometry on the sample in a positive mode and a negative mode, respectively.
- the first and second lipid profile data are 713.5 (m / z) in positive mode, 898.77 (m / z) in negative mode, 652.49 (m / z) in positive mode, and 906.89 (m / z in negative mode). ), 524.28 (m / z) in positive mode, 610.39 (m / z) in positive mode, 593.4 (m / z) in positive mode, 708.67 (m / z) in positive mode, 756.68 (m / z in positive mode) ), Data on the amount or proportion of lipid molecules having at least one molecular weight selected from 530.04 (m / z) in negative mode and 544.06 (m / z) in negative mode.
- first and second lipid profile data may include data on the amount or proportion of lipid molecules having a molecular weight of 906.89 (m / z) in negative mode and 756.68 (m / z) in positive mode. Can be.
- the first and second lipid profile data can be obtained by comparing the amount or ratio of ST-OH ⁇ 42: 1 ⁇ [MH]-in negative mode and PC ⁇ 32: 0 ⁇ [M + Na] + in positive mode. It can include data about.
- the histological type of non-small cell lung cancer can be easily classified more accurately and at low cost with only a small amount of tissue samples.
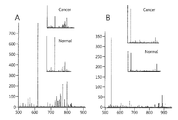
- FIG. 1 is a graph showing the mean spectrum of a sample of 21 patients.
- 1 (A) shows the experimental results in the positive mode
- FIG. 1 (B) shows the experimental results in the negative mode.
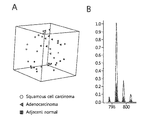
- FIG. 2 is a graph comparing lipid profiles of lung cancer tissues and normal tissues by PCA analysis.
- 2 (A) is a PCA plot of 21 pairs of lung cancer tissues and normal tissues.
- Figure 2 (B) is the intensity profile for lung cancer tissue and normal tissue.
- Figure 3 is a diagram showing the results of the experiment using the validation set to verify the discrimination of the method according to the present invention.
- 3 (A) shows a PCA (principal component analysis) result of 51 surgical samples as a validation set.
- 3 (B) and (C) show experimental results using five biopsy tissues as a validation set. In FIG. 3 (B), red indicates that the specific gravity is high, and green indicates that the specific gravity is low.
- 3 (C) is a mass spectrometry image of the validation set.
- Samples to be used as training sets were prepared as follows. Lung cancer tissues and normal tissues were collected from 21 non-small cell carcinoma patients. Tissue samples were obtained from multiple (average 3) spots from each patient. The collected tissue samples were wrapped in aluminum foil and slowly frozen in nitrogen for 30-60 seconds and stored at -80 ° C until MALDI analysis.
- frozen tissues were cryosectioned (10 ⁇ m), placed on an indium tinc oxide electroconductive glass slide, and vacuum dried.
- Matrix by dissolving 7 mg of 2,5-dihydroxybenzoic acid (DHB) and 7 mg of a-cyano-4-hydroxycinnamic acid (CHCA) in 1 mL of a mixture of 70% methanol, 0.1% TFA and 1% piperidine matrix was prepared. These substrates are fat-soluble to perform mass spectrometry on the lipids of tissue samples. Substrates of other components that are well mixed with lipids or are suitable for mass spectrometry of lipid molecules can also be used. In this embodiment, both 2,5-dihydroxybenzoic acid (DHB) and a-cyano-4-hydroxycinnamic acid (CHCA) were used, but only DHB may be used.
- DHB 2,5-dihydroxybenzoic acid
- CHCA a-cyano-4-hydroxycinnamic acid
- Table 1 is a table summarizing the characteristics of the tissue sample used in the embodiment of the present invention.
- a surgical sample and a biopsy sample were used.
- the surgical sample included 21 tissue samples from a training set and 51 tissue samples from a validation set.
- 21 patients consisted of 10 squamous cell carcinoma patients and 11 adenocarcinoma patients.
- 51 tissue samples consisted of 26 squamous cell carcinoma tissue samples and 25 adenocarcinoma tissue samples.
- Five tissue samples as biopsy samples consisted of three squamous cell carcinoma tissue samples and two adenocarcinoma tissue samples.
- MALDI-TOF MS was used for mass spectrometry.
- other assays capable of mass spectrometry of biomolecules namely MALDI-FTICR-MSn, MALDI-Q-TOF, MALDI-QIT-TOF, MALDI-QIT-FTICR-MS, Field Desoption (FD), 252Cf-Plasma Desoprtion (PD), desoprtion chemical ionization (DCI), secondary ion mass spectrometry (SIMS), fast atom bombardment (FAB), electrospray ionization (ESI), tandem mass spectrometry can also be used.
- the prepared substrates were supplied to the cancer-rich area using micropipette twice at 250 nl. It is also possible to coat the matrix using depositers such as ImagePrep (Bruker) or Chip1000 (Shimazu).
- MALDI analysis was performed using MALDI equipment such as Autoflex III, Ultraflex or UltrafleXtreme (Bruker) equipped with smart-beam laser (Nd: YAG, 355 nm).
- MALDI equipment such as Autoflex III, Ultraflex or UltrafleXtreme (Bruker) equipped with smart-beam laser (Nd: YAG, 355 nm).
- MALDI analysis was performed under optimized linear mode from 500 to 1,200 Da, with a laser frequency of 200 Hz (3,000 consecutive laser shots) and a delay time of 0 ns. The data were obtained in positive ion mode and negative ion mode, respectively.
- Baseline subtraction, spectral recalibration, spectral area calculation, and data reduction were performed as preprocessing for the acquired data.
- Clinprotool version 2.2, Bruker Daltonics
- the resolution was set to 300.
- the data reduction was set to 4, and the spectra recalibration was performed with the maximum peak shift of 2000 ppm.
- the "% Match to Calibrant Peaks" value was set to 20%.
- the signal-to-noise ratio was set to greater than three (signal-to-noise ratios> 3). Peak area was used for peak calculation with zero level integration. This process can be done with software other than ClinProTool.
- FIG. 1 is a graph showing the mean spectrum of a sample of 21 patients.
- 1 (A) shows the experimental results in the positive mode
- FIG. 1 (B) shows the experimental results in the negative mode.
- Average spectrum as shown in Figure 1 shows the lipid expression pattern of the sample (lipid).
- Normalization was performed on the data obtained in the positive mode and the data obtained in the negative mode. This is to standardize experimental differences between tissue samples. In other words, the average peak is normalized so that the data of different patients can be compared with each other.
- the normalized positive mode dataset and the negative mode dataset are combined into one dataset.
- Non-lipid peak (m / z 616.2 ⁇ 2.5 in the positive ion mode, m / z 540.2 ⁇ 2.5 in the negative ion mode) data were excluded.
- Statistical analysis was performed on the combined dataset using BRB-ArrayTools (Biometrics Branch, NCI). The important thing is that both positive and negative mode datasets are used to perform statistical analysis, so there are many ways to reflect the results of both datasets.
- FIG. 2 is a graph comparing lipid profiles of lung cancer tissues and normal tissues by PCA analysis.
- 2 (A) is a PCA plot of 21 pairs of lung cancer tissues and normal tissues.
- Figure 2 (B) is the intensity profile for lung cancer tissue and normal tissue.
- lipid profiles of lung cancer tissues and normal tissues were clearly distinguished from each other in unsupervised analysis.
- the permutation P value was less than 0.001.
- the average prediction accuracy for the test set was 85.7% (6/7) (at feature selection P ⁇ 0.01). Significant differences were found between the 10 squamous cell carcinoma spectra and the 11 adenocarcinoma spectra.
- Table 2 (Discriminatory peak-m / z and assignments) describes data for 11 peaks for adenocarcinoma tissue and squamous cell carcinoma tissue at feature selection of P ⁇ 0.01. At this time, the mass peak can consider tolerance up to ⁇ 2000 ppm.
- Nine peaks out of 11 (p713.5, n898.77, p652.49, n906.89, p524.28, p610.39, p593.4, p708.67, p756.68) were found in adenocarcinoma tissues.
- the larger two peaks (n530.04, n544.06) were larger in squamous cell carcinoma tissue.
- Figure 3 is a diagram showing the results of the experiment using the validation set to verify the discrimination of the method according to the present invention.
- 3 (A) shows a PCA (principal component analysis) result of 51 surgical samples as a validation set.
- 51 tissue samples are surgical samples. As a result, 51 tissue samples could be significantly differentiated according to histological type. As a result of reviewing feature selection of P ⁇ 0.01 using a support vector machine, 41 (80.4%) histological types of 51 tissue samples were correctly classified. In adenocarcinoma, the histological type was correctly classified in 21 out of 25 cases, and in histological cell carcinoma, the histological type was correctly classified in 20 out of 26 cases. In feature selection of P ⁇ 0.02 and P ⁇ 0.05, the accuracy increased to 84.3%.
- 3 (B) and (C) show experimental results using five biopsy tissues as a validation set.
- red indicates that the specific gravity is high
- green indicates that the specific gravity is low.
- 3 (C) is a mass spectrometry image of the validation set.
- a bronchoscopy specimen was used for the vaildation set because it is ultimately applied to the biopsy tissue, not the surgical tissue, for clinical application of the predictive model. Because adenocarcinoma is difficult to obtain by bronchoscopic biopsy due to peripheral distribution, two adenocarcinoma and three squamous cell carcinoma were composed as validation set. MALDI signals were also applied using ImagePrep (Bruker) instead of manual matrix deposition.
- the process of providing predictive information as to whether the unknown tissue is adenocarcinoma tissue or squamous cell carcinoma tissue is as follows.
- a sample is prepared by mixing human tissue and a predetermined substrate requiring histological differentiation (S01).
- MALDI analysis is performed on the prepared sample (S02).
- MALDI-TOF MS was used for histological differentiation, but other analytical methods for analyzing peak data may be used.
- the first lipid profile data which is information on the lipid profile is selected from the data obtained by mass spectrometry (S03). That is, the filtering step is performed to leave only data (first lipid profile data) of 11 peaks in the acquired data.
- the supervised learning algorithm prediction is performed using the filtered data.
- a support vector machine is used as a supervised learning algorithm, but other algorithms such as k-nearest neighbor, compound covariate predictor, linear discriminant analysis, nearest centroid, and the like may be used. You can also use BRB-ArrayTools (NCI) for analysis, but you can use any other software.
- the sample may be adenocarcinoma (Providing information corresponding to any one of adenocarcinoma) and squamous cell carcinoma may be performed (S04).
- the present invention has nine peaks among the eleven peaks (p713.5, n898.77, p652.49, n906.89, p524.28, p610.39, p593.4). , p708.67, and p756.68) provide predictive information that the unknown tissue sample is likely to be adenocarcinoma. If the remaining two peaks (n530.04, n544.06) are large, The tissue may include providing prediction information that the tissue is likely to be squamous cell carcinoma.
- the present invention may include providing prediction information using an arbitrary peak value selected from eleven peaks. For example, using only two peaks out of 11 peaks, n906.89 (ST-OH ⁇ 42: 1 ⁇ [MH]-) and p756.68 (PC ⁇ 32: 0 ⁇ [M + Na] +). It may also provide information for histological differentiation. In other words, if two peak values are large, prediction information that an unknown tissue is likely to be adenocarcinoma is secured.
Abstract
Description
표1


Claims (9)
- (a) 기질(matrix)과 인체 조직을 혼합하여 시료(sample)를 준비하는 단계;(b) 준비된 시료에 대하여 질량분석을 수행하는 단계;(c) 상기 질량분석에 의하여 확보된 데이터에서 지질 프로파일에 대한 정보인 제1 지질 프로파일 데이터를 선별하는 단계; 및(d) 선암(adenocarcinoma) 조직 및 편평세포상피암 (squamous cell carcinoma) 조직 중에서 선택된 적어도 어느 하나의 지질 프로파일에 대한 정보인 제2 지질 프로파일 데이터와 상기 제1 지질 프로파일 데이터를 비교함으로써 상기 시료가 선암(adenocarcinoma) 및 편평세포상피암 (squamous cell carcinoma) 중의 어느 하나에 해당한다는 정보를 제공하는 단계;를 포함하는 지질 프로파일을 이용한 비소세포성 폐암의 조직학적 분류를 위한 정보를 제공하는 방법.
- 제1항에 있어서,상기 기질은 지질 분자에 대한 질량분석을 하는 데 사용되는 성분을 포함하는 것을 특징으로 하는 지질 프로파일을 이용한 비소세포성 폐암의 조직학적 분류를 위한 정보를 제공하는 방법.
- 제1항에 있어서,상기 기질은 2,5-dihydroxybenzoic acid (DHB) 와 a-cyano-4-hydroxycinnamic acid (CHCA) 중에서 적어도 어느 하나를 포함하는 것을 특징으로 하는 지질 프로파일을 이용한 비소세포성 폐암의 조직학적 분류를 위한 정보를 제공하는 방법.
- 제1항에 있어서,상기 질량분석은 MALDI(matrix-assisted laser desorption and ionization) 질량분석인 것을 특징으로 하는 지질 프로파일을 이용한 비소세포성 폐암의 조직학적 분류를 위한 정보를 제공하는 방법.
- 제1항에 있어서,상기 질량분석은 MALDI-TOF MS, MALDI-FTICR-MSn, MALDI-Q-TOF, MALDI-QIT-TOF, MALDI-QIT-FTICR-MS, Field Desoption (FD), 252Cf-Plasma desoprtion (PD), desoprtion chemical ionization (DCI), secondary ion mass spectrometry (SIMS), fast atom bombardment (FAB), electrospray ionization (ESI), Tandem Mass Spectrometry 중에서 선택된 어느 하나인 것을 특징으로 하는 지질 프로파일을 이용한 비소세포성 폐암의 조직학적 분류를 위한 정보를 제공하는 방법.
- 제4항에 있어서,상기 (b)단계는 상기 시료에 대하여 포지티브 모드(positive mode)와 네거티브 모드(negative mode)에서 각각 질량분석을 수행하는 것을 특징으로 하는 지질 프로파일을 이용한 비소세포성 폐암의 조직학적 분류를 위한 정보를 제공하는 방법.
- 제1항에 있어서,상기 제1 및 제2 지질 프로파일 데이터는 포지티브 모드에서 713.5(m/z), 네거티브 모드에서 898.77(m/z), 포지티브 모드에서 652.49(m/z), 네거티브 모드에서 906.89(m/z), 포지티브 모드에서 524.28(m/z), 포지티브 모드에서 610.39(m/z), 포지티브 모드에서 593.4(m/z), 포지티브 모드에서 708.67(m/z), 포지티브 모드에서 756.68(m/z), 네거티브 모드에서 530.04(m/z), 네거티브 모드에서 544.06(m/z) 중에서 선택된 적어도 어느 하나의 분자량을 가지는 지질 분자의 양(abundance) 또는 비율에 대한 데이터를 포함하는 것을 특징으로 하는 지질 프로파일을 이용한 비소세포성 폐암의 조직학적 분류를 위한 정보를 제공하는 방법.
- 제1항에 있어서,상기 제1 및 제2 지질 프로파일 데이터는 네거티브 모드에서 906.89(m/z) 및 포지티브 모드에서 756.68(m/z)의 분자량을 가지는 지질 분자의 양(abundance) 또는 비율에 대한 데이터를 포함하는 것을 특징으로 하는 지질 프로파일을 이용한 비소세포성 폐암의 조직학적 분류를 위한 정보를 제공하는 방법.
- 제1항에 있어서,상기 제1 및 제2 지질 프로파일 데이터는 네거티브 모드에서 ST-OH{42:1}[M-H]- 및 포지티브 모드에서 PC{32:0}[M+Na]+의 양(abundance) 또는 비율에 대한 데이터를 포함하는 것을 특징으로 하는 지질 프로파일을 이용한 비소세포성 폐암의 조직학적 분류를 위한 정보를 제공하는 방법.
Priority Applications (1)
| Application Number | Priority Date | Filing Date | Title |
|---|---|---|---|
| KR1020137025091A KR101384693B1 (ko) | 2011-05-09 | 2012-05-07 | 지질 프로파일을 이용한 비소세포성 폐암의 조직학적 분류를 위한 정보를 제공하는 방법 |
Applications Claiming Priority (2)
| Application Number | Priority Date | Filing Date | Title |
|---|---|---|---|
| KR20110043640 | 2011-05-09 | ||
| KR10-2011-0043640 | 2011-05-09 |
Publications (2)
| Publication Number | Publication Date |
|---|---|
| WO2012153964A2 true WO2012153964A2 (ko) | 2012-11-15 |
| WO2012153964A3 WO2012153964A3 (ko) | 2013-03-21 |
Family
ID=47139795
Family Applications (1)
| Application Number | Title | Priority Date | Filing Date |
|---|---|---|---|
| PCT/KR2012/003571 WO2012153964A2 (ko) | 2011-05-09 | 2012-05-07 | 지질 프로파일을 이용한 비소세포성 폐암의 조직학적 분류를 위한 정보를 제공하는 방법 |
Country Status (2)
| Country | Link |
|---|---|
| KR (1) | KR101384693B1 (ko) |
| WO (1) | WO2012153964A2 (ko) |
Cited By (5)
| Publication number | Priority date | Publication date | Assignee | Title |
|---|---|---|---|---|
| KR101389382B1 (ko) | 2013-05-20 | 2014-04-29 | 국립암센터 | 인지질을 이용한 암의 진단 방법 |
| KR101408217B1 (ko) * | 2013-05-22 | 2014-06-17 | 국립암센터 | 질량분석패턴을 이용한 원발성간내담도암 및 전이성간암의 감별법 |
| EP3701008A4 (en) * | 2017-10-27 | 2021-08-04 | Frontier Diagnostics, LLC | MASS SPECTROMETRY METHODS FOR CARCINOMA ASSESSMENTS |
| CN114199980A (zh) * | 2021-11-08 | 2022-03-18 | 岛津企业管理(中国)有限公司 | 一种基于质谱成像技术的肺癌分型判断系统 |
| CN114295706A (zh) * | 2021-09-28 | 2022-04-08 | 岛津企业管理(中国)有限公司 | 一种基于统计学的非靶向非小细胞肺癌的病理分型方法 |
Citations (1)
| Publication number | Priority date | Publication date | Assignee | Title |
|---|---|---|---|---|
| WO2002008760A1 (en) * | 2000-07-19 | 2002-01-31 | Biotron Limited | Method of identifying cancer markers and uses therefor in the diagnosis of cancer |
Family Cites Families (2)
| Publication number | Priority date | Publication date | Assignee | Title |
|---|---|---|---|---|
| WO2003014724A1 (en) * | 2001-08-03 | 2003-02-20 | Biotron Limited | A novel cancer marker and uses therefor in the diagnosis of cancer |
| JP5422785B2 (ja) * | 2008-09-12 | 2014-02-19 | 国立大学法人名古屋大学 | 質量分析法を利用した複数癌腫の血液検出のための方法および生物マーカー |
-
2012
- 2012-05-07 KR KR1020137025091A patent/KR101384693B1/ko active IP Right Grant
- 2012-05-07 WO PCT/KR2012/003571 patent/WO2012153964A2/ko active Application Filing
Patent Citations (1)
| Publication number | Priority date | Publication date | Assignee | Title |
|---|---|---|---|---|
| WO2002008760A1 (en) * | 2000-07-19 | 2002-01-31 | Biotron Limited | Method of identifying cancer markers and uses therefor in the diagnosis of cancer |
Non-Patent Citations (4)
| Title |
|---|
| JACKSON, S. N. ET AL.: 'Direct profiling of tissue lipids by MALDI-TOFMS.' J. CHROMATOGR. B vol. 877, 2009, pages 2822 - 2829 * |
| LEE, G. K. ET AL.: 'Lipid MALDI profile classifies non-small cell lung cancers according to the histologic type.' LUNG CANCER vol. 76, no. 2, 17 November 2011, pages 197 - 203 * |
| SEELEY, E. H. ET AL.: 'MALDI imaging mass spectrometry of human tissue: method challenges and clinical perspectives.' TRENDS BIOTECHNOL. vol. 29, no. 3, March 2011, pages 136 - 143 * |
| YANAGISAWA, K. ET AL.: 'Proteomic patterns of tumour subsets in non-small-cell lung cancer.' LANCET vol. 362, 09 August 2003, * |
Cited By (7)
| Publication number | Priority date | Publication date | Assignee | Title |
|---|---|---|---|---|
| KR101389382B1 (ko) | 2013-05-20 | 2014-04-29 | 국립암센터 | 인지질을 이용한 암의 진단 방법 |
| WO2014189203A1 (ko) * | 2013-05-20 | 2014-11-27 | 국립암센터 | 인지질을 이용한 암의 진단 방법 |
| KR101408217B1 (ko) * | 2013-05-22 | 2014-06-17 | 국립암센터 | 질량분석패턴을 이용한 원발성간내담도암 및 전이성간암의 감별법 |
| EP3701008A4 (en) * | 2017-10-27 | 2021-08-04 | Frontier Diagnostics, LLC | MASS SPECTROMETRY METHODS FOR CARCINOMA ASSESSMENTS |
| CN114295706A (zh) * | 2021-09-28 | 2022-04-08 | 岛津企业管理(中国)有限公司 | 一种基于统计学的非靶向非小细胞肺癌的病理分型方法 |
| CN114199980A (zh) * | 2021-11-08 | 2022-03-18 | 岛津企业管理(中国)有限公司 | 一种基于质谱成像技术的肺癌分型判断系统 |
| CN114199980B (zh) * | 2021-11-08 | 2024-02-20 | 岛津企业管理(中国)有限公司 | 一种基于质谱成像技术的肺癌分型判断系统 |
Also Published As
| Publication number | Publication date |
|---|---|
| WO2012153964A3 (ko) | 2013-03-21 |
| KR101384693B1 (ko) | 2014-04-14 |
| KR20130140845A (ko) | 2013-12-24 |
Similar Documents
| Publication | Publication Date | Title |
|---|---|---|
| CN109884302B (zh) | 基于代谢组学和人工智能技术的肺癌早期诊断标志物及其应用 | |
| WO2012153964A2 (ko) | 지질 프로파일을 이용한 비소세포성 폐암의 조직학적 분류를 위한 정보를 제공하는 방법 | |
| Guo et al. | Tissue imaging and serum lipidomic profiling for screening potential biomarkers of thyroid tumors by matrix-assisted laser desorption/ionization-Fourier transform ion cyclotron resonance mass spectrometry | |
| EP1982349B1 (en) | Chemical noise reduction for mass spectrometry | |
| CN109946390B (zh) | 一种肺癌诊断标志物组合及应用 | |
| EP1763061B1 (en) | MALDI sample plate imaging workstation | |
| Oezdemir et al. | Proteomic tissue profiling for the improvement of grading of noninvasive papillary urothelial neoplasia | |
| Ocak et al. | Mass spectrometry–based proteomic profiling of lung cancer | |
| US10197576B2 (en) | Mass spectrometry imaging with substance identification | |
| Flatley et al. | MALDI mass spectrometry in prostate cancer biomarker discovery | |
| WO2011072130A1 (en) | Methods for diagnosing or monitoring for recurrence of prostate cancer | |
| EP3460470A1 (en) | Method for monitoring the quality of mass spectrometric imaging preparation workflows | |
| Wu et al. | Identification of serum biomarkers for ovarian cancer using MALDI–TOF-MS combined with magnetic beads | |
| CN114839298A (zh) | 一种用于检测结直肠癌或腺瘤的生物标志物及其方法 | |
| Jeon et al. | Histology‐directed matrix‐assisted laser desorption/ionization analysis reveals tissue origin and p53 status of primary liver cancers | |
| CN116577403A (zh) | 一种外泌体的分离检测方法及应用 | |
| Kim et al. | Low C24‐OH and C22‐OH sulfatides in human renal cell carcinoma | |
| CN112964807B (zh) | 乙肝慢加急性肝衰竭预后的代谢标记物及其筛选方法 | |
| Buszewska‐Forajta et al. | Tissue sample preparations for preclinical research determined by molecular imaging mass spectrometry using matrix‐assisted laser desorption/ionization | |
| Wu et al. | Exploring the expression bar code of SAA variants for gastric cancer detection | |
| CN113466370A (zh) | 一种用于食管鳞癌早期筛查的标志物及检测试剂盒 | |
| KR101408217B1 (ko) | 질량분석패턴을 이용한 원발성간내담도암 및 전이성간암의 감별법 | |
| Pyatnitskiy et al. | Identification of differential signs of squamous cell lung carcinoma by means of the mass spectrometry profiling of blood plasma | |
| JP4921302B2 (ja) | 質量分析システム | |
| Sogno et al. | Surface‐activated chemical ionization–electrospray ionization source improves biomarker discovery with mass spectrometry |
Legal Events
| Date | Code | Title | Description |
|---|---|---|---|
| 121 | Ep: the epo has been informed by wipo that ep was designated in this application |
Ref document number: 12782752 Country of ref document: EP Kind code of ref document: A2 |
|
| ENP | Entry into the national phase |
Ref document number: 20137025091 Country of ref document: KR Kind code of ref document: A |
|
| NENP | Non-entry into the national phase |
Ref country code: DE |
|
| 32PN | Ep: public notification in the ep bulletin as address of the adressee cannot be established |
Free format text: NOTING OF LOSS OF RIGHTS PURSUANT TO RULE 112(1) EPC |
|
| 122 | Ep: pct application non-entry in european phase |
Ref document number: 12782752 Country of ref document: EP Kind code of ref document: A2 |