WO2012081209A1 - 渋滞予測方法 - Google Patents
渋滞予測方法 Download PDFInfo
- Publication number
- WO2012081209A1 WO2012081209A1 PCT/JP2011/006880 JP2011006880W WO2012081209A1 WO 2012081209 A1 WO2012081209 A1 WO 2012081209A1 JP 2011006880 W JP2011006880 W JP 2011006880W WO 2012081209 A1 WO2012081209 A1 WO 2012081209A1
- Authority
- WO
- WIPO (PCT)
- Prior art keywords
- vehicle
- inter
- distribution
- traffic jam
- region
- Prior art date
- Legal status (The legal status is an assumption and is not a legal conclusion. Google has not performed a legal analysis and makes no representation as to the accuracy of the status listed.)
- Ceased
Links
Images




Classifications
-
- G—PHYSICS
- G08—SIGNALLING
- G08G—TRAFFIC CONTROL SYSTEMS
- G08G1/00—Traffic control systems for road vehicles
- G08G1/01—Detecting movement of traffic to be counted or controlled
- G08G1/0104—Measuring and analyzing of parameters relative to traffic conditions
- G08G1/0125—Traffic data processing
- G08G1/0133—Traffic data processing for classifying traffic situation
-
- G—PHYSICS
- G08—SIGNALLING
- G08G—TRAFFIC CONTROL SYSTEMS
- G08G1/00—Traffic control systems for road vehicles
-
- G—PHYSICS
- G08—SIGNALLING
- G08G—TRAFFIC CONTROL SYSTEMS
- G08G1/00—Traffic control systems for road vehicles
- G08G1/01—Detecting movement of traffic to be counted or controlled
- G08G1/0104—Measuring and analyzing of parameters relative to traffic conditions
- G08G1/0108—Measuring and analyzing of parameters relative to traffic conditions based on the source of data
- G08G1/0112—Measuring and analyzing of parameters relative to traffic conditions based on the source of data from the vehicle, e.g. floating car data [FCD]
Definitions
- the present invention relates to a traffic jam prediction method, and more specifically to a method for traffic jam prediction from the acceleration of the host vehicle and the inter-vehicle distance from other vehicles.
- Patent Document 1 the vehicle density of other vehicles existing within a predetermined distance in front and behind the host vehicle is calculated from the detection result of the radar device, and the running state of the host vehicle is determined to be congested using the vehicle density. It is described that it is determined whether or not it can be a cause of occurrence.
- an object of the present invention is to provide a traffic jam prediction method capable of appropriately improving the traffic jam prediction accuracy and useful for avoiding or eliminating the traffic jam.
- the present invention includes a step of detecting an acceleration of the host vehicle, a step of calculating a power spectrum corresponding to the frequency from a frequency analysis of the detected acceleration, a single regression line of the power spectrum is calculated, and the unit in a predetermined frequency range is calculated. Calculating the maximum value of the change in the slope of the regression line as the maximum value of the slope, detecting the inter-vehicle distance between the host vehicle and the preceding vehicle, and using the distribution estimation method based on the detected inter-vehicle distance, Estimating the vehicle distribution from the correlation between the minimum covariance value and the slope maximum value, estimating the vehicle group distribution from the estimated inter-vehicle distance distribution, A traffic jam prediction method including a step of performing traffic jam prediction based on the method.
- the traffic jam prediction is performed based on the vehicle group distribution estimated from the correlation between the maximum slope value obtained from the acceleration spectrum of the host vehicle and the minimum covariance value obtained from the inter-vehicle distance density.
- the accuracy can be improved.
- the step of performing the traffic jam prediction includes identifying a region where the vehicle group variation is large and a region where the vehicle group variation is small in the vehicle group distribution, and determining whether there is a boundary region between the two regions. Including.
- the presence / absence of a boundary region (transition region) of a vehicle group change is used as a criterion for predicting traffic jams in real time, so that traffic jams are timely and effective before traffic jams occur and proceed. Prediction becomes possible.
- the boundary region corresponds to a critical region between a free flow region where the possibility of congestion is low and a mixed flow region where braking and acceleration of the vehicle are mixed.
- the critical area as a judgment criterion (boundary calculation) for traffic jam prediction
- real-time traffic jam prediction that is useful not only for traffic jam avoidance but also for traffic jam resolution is possible.
- FIG. 7B shows the boundary calculation for patterning the critical region.
- the step of estimating the forward vehicle group distribution includes creating a correlation map between the logarithm of the minimum covariance value and the logarithm of the slope maximum value.
- a correlation map between the logarithm of the minimum value of the covariance value of the inter-vehicle distance and the logarithm of the slope maximum value of the acceleration spectrum can be obtained in real time, so that a critical region that occurs in offline (statistical) prediction Since the time delay in the vicinity can be minimized, the prediction accuracy can be improved.
- real-time processing is possible because the phase transition property of traffic flow is taken into account, and prediction accuracy is improved compared to offline prediction.
- FIG. 4 shows an acceleration spectrum according to one embodiment of the present invention.
- FIG. 6 is a diagram illustrating a probability density distribution according to an embodiment of the present invention.
- FIG. 6 is a diagram schematically showing a covariance value ⁇ k according to an embodiment of the present invention. It is an image (concept) figure of the correlation map of inclination maximum value and covariance minimum value according to one Example of this invention. It is a figure which shows the relationship between traffic density and traffic volume.
- 6 is a correlation map between the logarithm of the minimum covariance value for the inter-vehicle distance distribution and the logarithm of the slope maximum value for the acceleration spectrum according to one embodiment of the present invention.
- 4 is a flowchart of traffic jam prediction according to an embodiment of the present invention.
- FIG. 1 is a block diagram showing a configuration of a traffic jam prediction device 10 for carrying out a traffic jam prediction method according to an embodiment of the present invention.
- the traffic jam prediction device 10 is mounted on a vehicle.
- the traffic jam prediction device 10 can be mounted on a vehicle as one device or as part of another device.
- the traffic jam prediction device 10 includes a vehicle speed sensor 11, a radar device 12, a navigation device 13, a processing device 14, a switch 15, various actuators 16, a speaker 17, a display 18, and a communication device 19.
- the processing device 14 may be incorporated in the navigation device 13.
- the speaker 17 and the display 18 may use corresponding functions provided in the navigation device 13.
- the vehicle speed sensor 11 detects the acceleration of the host vehicle and sends a detection signal to the processing device 14.
- the radar device 12 divides a predetermined detection target region set around the host vehicle into a plurality of angle regions, and transmits an electromagnetic wave such as an infrared laser or millimeter wave while scanning each angle region. .
- the radar device 12 receives a reflection signal (electromagnetic wave) from an object in the detection target region and sends the reflection signal to the processing device 14.
- the navigation device 13 receives a positioning signal such as a GPS signal, and calculates the current position of the host vehicle from the positioning signal.
- the navigation device 13 can also calculate the current position of the host vehicle from the acceleration and yaw rate detected by the vehicle speed sensor 11 and the yaw rate sensor (not shown) using autonomous navigation.
- the navigation device 13 includes map data and has a function of outputting the current position of the host vehicle, route information to a destination, traffic jam information, and the like on a map to be displayed.
- the processing device 14 includes a frequency analysis unit 31, a single regression line calculation unit 32, a large slope calculation unit 33, a reflection point detection unit 34, another vehicle detection unit 35, an inter-vehicle distance detection unit 36, an inter-vehicle distance distribution estimation unit 37, A minimum variance calculation unit 38, a correlation map creation unit 40, a traffic jam prediction unit 41, a travel control unit 42, a notification control unit 43, and a communication control unit 44 are provided.
- the function of each block is realized by a computer (CPU) included in the processing device 14. Details of the function of each block will be described later.
- the processing device 14 has, for example, an A / D conversion circuit that converts an input analog signal into a digital signal, a central processing unit (CPU) that performs various arithmetic processing, and a CPU that stores data when performing arithmetic operations. It includes a RAM to be used, a ROM for storing programs to be executed by the CPU and data to be used (including tables and maps), an output circuit for outputting a drive signal for the speaker 17, a display signal for the display 18, and the like.
- CPU central processing unit
- the switch 15 outputs various signals related to the traveling control of the host vehicle to the processing device 14.
- the various signals include, for example, accelerator pedal and brake pedal operation (position) signals, various signals related to automatic travel control (ACC) (control start, control stop, target vehicle speed, inter-vehicle distance, and the like).
- ACC automatic travel control
- the various actuators 16 are used as a general term for a plurality of actuators, and include, for example, a throttle actuator, a brake actuator, a steering actuator, and the like.
- the communication device 19 communicates with another vehicle or a server device (not shown) or a relay station (not shown) by wireless communication under the control of the communication control unit 44, and the traffic jam prediction result output from the traffic jam prediction unit 41 Position information is transmitted in association with each other, or correspondence information between a traffic jam prediction result and position information is received from another vehicle or the like. The acquired information is sent to the notification control unit 43 or the travel control unit 42 via the communication control unit 44.
- the frequency analysis unit 31 performs frequency analysis on the acceleration of the host vehicle detected by the vehicle speed sensor 11 and calculates a power spectrum.
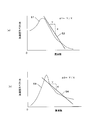
- FIG. 2 shows examples of power spectra in two different traveling states (a) and (b). In FIG. 2, acceleration spectra 51 and 53 corresponding to frequencies are illustrated as power spectra.
- the single regression line calculation unit 32 performs a single regression analysis on the obtained power spectrum and calculates a single regression line.
- the straight lines indicated by reference numerals 52 and 54 are simple regression lines obtained for the acceleration spectra 51 and 53, respectively.
- the slope maximum value calculation unit 33 calculates the slope maximum value from the obtained single regression line.
- the inclinations ⁇ 1 and ⁇ 2 at (a) and (b) are obtained.
- , etc.) obtained from the difference ⁇ is obtained.
- the obtained maximum value is stored in a memory (RAM or the like) in the processing device 14 as a tilt maximum value.
- the reflection point detector 34 detects the position of the reflection point (object) from the reflection signal detected by the radar device 12.
- the other vehicle detection unit 35 is based on the position information of the reflection points output from the reflection point detection unit 34, and at least one or more vehicles present in the vicinity of the host vehicle from the distance between adjacent reflection points, the distribution state of the reflection points, and the like. Detect other vehicles.
- the inter-vehicle distance detection unit 36 detects the inter-vehicle distance between the host vehicle and the other vehicle from the other vehicle information detected by the reflection point detection unit 34, and outputs the result together with the detected number of other vehicles.
- the inter-vehicle distance distribution estimation unit 37 estimates the inter-vehicle distance distribution from the information on the inter-vehicle distance and the number of vehicles output from the inter-vehicle distance detection unit 36.
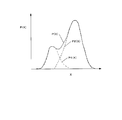
- the inter-vehicle distance distribution estimation will be described with reference to FIG. FIG. 3 shows a probability density distribution.
- a Gaussian distribution Apply probability density distribution.
- the vehicle group can be regarded as a distribution obtained by linearly combining two Gaussian distributions. That is, as shown in FIG. 3, a probability function P (X) representing the entire distribution can be obtained as the sum (superposition) of the probability functions P1 (X) and P2 (X) representing the two Gaussian distributions. .
- ⁇ k is an expected value (average value) and represents a position having the highest density.
- ⁇ k is a covariance value (matrix), and represents distortion of the distribution, that is, how the density decreases in which direction away from the expected value.
- ⁇ k is a mixing coefficient (mixing ratio) of the Gaussian distribution, and represents a ratio (0 ⁇ ⁇ k ⁇ 1) of how much each Gaussian distribution contributes.
- the mixing coefficient ⁇ k can be regarded as one probability.
- the covariance minimum value calculation unit 38 performs calculation using variational Bayes or the like in order to obtain a parameter (covariance) that maximizes the likelihood function obtained from the above-described P (X), for example.
- a covariance value ⁇ k is calculated for each Gaussian distribution.
- the covariance minimum value calculation unit 38 then calculates the minimum value of the plurality of covariance values ⁇ k obtained for each Gaussian distribution P (X).
- Figure 4 is a diagram schematically representing the covariance value sigma k.
- the graph 56 representing the covariance value ⁇ k is a sharp graph at delta ( ⁇ ) 0, and there is no fluctuation of the vehicle group, that is, the vehicle is in a traveling state in which the inter-vehicle distance is substantially constant. It suggests.
- FIG. 4B two graphs are obtained: a graph 57 having a peak at ⁇ 1 in a region where delta ( ⁇ ) is negative and a graph 58 having a peak at ⁇ 2 in a positive region.
- Both the graphs 57 and 58 have a predetermined fluctuation range ( ⁇ ), which indicates that there are fluctuations in the vehicle group, in other words, that there are a plurality of sets of cars having different inter-vehicle distances.
- ⁇ the minimum value of the covariance value sigma k is approximately zero (0) (a), the a ⁇ 1 the smaller the (b).
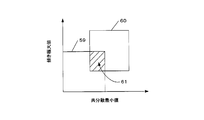
- FIG. 5 is an image (concept) diagram of a correlation map between the maximum slope value and the minimum covariance value.
- the horizontal (X) axis is the covariance minimum value X
- the vertical (Y) axis is the slope maximum value Y
- the correlation of the variables (X, Y) is mapped.
- Two areas indicated by reference numerals 59 and 60 are shown, and there is a boundary area 61 where these two areas overlap.
- the region 59 corresponds to a state where the covariance minimum value is relatively small and the variation of the vehicle group is small, in other words, a state where the inter-vehicle distance is relatively constant.
- the region 60 corresponds to a state where the covariance minimum value is relatively large and the variation of the vehicle group is large, in other words, a state where there are a plurality of sets of vehicles having different inter-vehicle distances.
- the boundary region 61 is a region where the variation of the vehicle group changes from a small state to a large state, and the present invention is characterized in that the state of the vehicle group corresponding to the boundary region 61 is quantitatively found and a traffic jam is predicted. There is.
- FIG. 6 is a diagram showing the relationship between traffic density and traffic volume.
- the horizontal (X) axis of the graph is a traffic density that means the number of vehicles existing within a predetermined distance from the host vehicle. The reciprocal of this traffic density corresponds to the inter-vehicle distance.
- the vertical (Y) axis is a traffic volume that means the number of vehicles passing through a predetermined position. It can be understood that FIG. 6 represents a traffic flow that means the flow of a vehicle.
- the traffic flow illustrated in FIG. 6 can be roughly divided into four states (areas).
- the first is a free flow state in which the possibility of traffic congestion is low, and here, it is possible to ensure a certain level of acceleration and inter-vehicle distance.
- the second is a mixed flow state in which the braking state and the acceleration state of the vehicle are mixed.
- This mixed flow state is the state before the transition to the congestion flow, and the degree of freedom of driving by the driver is reduced, and the traffic flow is reduced and the traffic density is increased (reduction of the inter-vehicle distance). It is in a state where the probability of transition is high.
- the third is a traffic flow state indicating a traffic jam.
- the fourth is a critical region which is a transition state that exists during the transition from the free flow state to the mixed flow state.
- This region is a state in which the traffic volume and the traffic density are higher than those in the free stream, and a transition is made to a mixed stream due to a decrease in the traffic volume and an increase in the traffic density (a reduction in the inter-vehicle distance).
- the critical region is sometimes called metastable flow or metastable flow.
- the region 59 in FIG. 5 includes the free flow and critical region in FIG. 6, and the region 60 in FIG. 5 includes the mixed flow and congestion flow states in FIG. 6.
- the boundary region in FIG. 5 is a boundary state including both the critical region and the mixed flow state in FIG. 6 and is referred to as a critical region boundary as shown in FIG.
- the purpose of the present invention is to quantitatively grasp the critical region including the boundary of the critical region and to prevent the occurrence of traffic congestion by suppressing the transition to the mixed flow state.
- FIG. 7 is a diagram showing a correlation map between the logarithm of the minimum covariance value for the inter-vehicle distance distribution and the logarithm of the maximum slope value for the acceleration spectrum.
- FIG. 7A is a simplified drawing of the traffic flow map of FIG. 6, and
- FIG. 7B shows a correlation map between the logarithm of the covariance minimum value and the logarithm of the slope maximum value.
- the logarithm of the covariance minimum value and the logarithm of the slope maximum value in (b) is the difference between the slope maximum value calculated by the slope maximum value calculation unit 33 and the covariance minimum value calculated by the covariance minimum value calculation unit 38. Calculated as a logarithmic value.
- FIG. 7B depicts the parameterization of the phase transition state in the critical region by a single vehicle.
- the region indicated by reference numeral 62 includes the critical region (a), and the region indicated by reference numeral 63 includes the state of the mixed flow (a).
- the line indicated by the reference numeral 64 is a critical line, and means a critical point where there is a high possibility that traffic congestion will occur if the critical line is exceeded.
- the boundary region 65 between the regions 62 and 63 corresponds to the boundary of the critical region immediately before the criticality 64.
- the correlation map illustrated in FIG. 7B is stored in a memory (RAM or the like) in the processing device 14.
- the traffic jam prediction unit 41 in FIG. 1 determines whether or not the boundary state of the critical region exists in the correlation map created by the correlation map creation unit 40, and if so, to prevent the transition to traffic jam Then, a control signal including a traffic jam prediction result is sent to the travel control unit 42, the notification control unit 43, and the communication control unit 44. As a result, it is possible to execute various controls, which will be described later, to prevent the transition to the mixed flow illustrated in FIG. 7, and as a result, it is possible to predict traffic jams that are useful not only for traffic jam avoidance but also for eliminating traffic jams. .
- the traffic jam prediction unit 41 outputs the traffic jam prediction result to the navigation device 13. Based on the traffic jam prediction result received from the traffic jam prediction unit 41 and the traffic jam prediction result predicted by the other vehicle output from the communication control unit 41, the navigation device 13 performs route search for the host vehicle to avoid the traffic jam, Route guidance can be performed.
- the travel control unit 42 includes a traffic jam prediction result output from the traffic jam prediction unit 41, a traffic jam generation prediction result predicted from another vehicle output from the communication control unit 44, various signals output from the switch 15, and a vehicle speed sensor. 11 is controlled by controlling various actuators based on the detection result of the acceleration of the host vehicle output from No. 11 and the detection result of the inter-vehicle distance output from the inter-vehicle distance detection unit 36. That is, for example, the traveling control unit 42 starts or stops execution of automatic traveling control (ACC) according to a signal output from the switch 15, and sets or changes the target vehicle speed and the target inter-vehicle distance in ACC.
- ACC automatic traveling control
- the notification control unit 43 performs notification control by the display unit 18 and the speaker 17 based on the traffic jam prediction result output from the traffic jam prediction unit 41 and the traffic jam generation prediction result predicted from another vehicle output from the communication control unit 44. Do it.
- the notification control unit 43 transmits a control signal for causing the display 18 to display “Decelerate and take the distance between the vehicles” or the like and to transmit the sound from the speaker 17 by voice.
- FIG. 8 is a flowchart of traffic jam prediction according to one embodiment of the present invention. The details of each step are as described above.
- step S10 the vehicle speed sensor 11 detects the acceleration of the host vehicle.
- step S11 an inter-vehicle distance from vehicles around the own vehicle is detected based on an output signal from the radar device 12 (blocks 34 to 36 in FIG. 1).
- step S12 acceleration spectrum single regression maximization is performed. Specifically, the above-described inclination maximum value is calculated (blocks 31 to 33 in FIG. 1).
- the covariance value is specified. Specifically, the above-described minimum covariance is calculated (blocks 37 and 38 in FIG. 1).
- step S14 the critical region is modeled. Specifically, a correlation map as illustrated in FIG. 7B is created (block 40 in FIG. 1).
- step S15 it is determined whether or not a critical region (and its boundary) exists. The critical region is a critical region illustrated in FIGS. 6 and 7A described above. If this determination is No, the process returns to steps S12 and S13 and the subsequent flow is repeated. If the determination is Yes, a traffic jam is predicted in the next step S16 (block 41 in FIG. 1). In step S17, various controls are performed according to the traffic jam prediction result (blocks 42 to 44 in FIG. 1).
- Traffic jam prediction device 14 Processing device 51, 53 Acceleration (power) spectrum 52, 54 Simple regression line 56, 57, 58 Covariance
Landscapes
- Physics & Mathematics (AREA)
- General Physics & Mathematics (AREA)
- Chemical & Material Sciences (AREA)
- Analytical Chemistry (AREA)
- Traffic Control Systems (AREA)
Abstract
Description

14 処理装置
51、53 加速度(パワー)スペクトル
52、54 単回帰直線
56、57、58 共分散
Claims (4)
- 自車両の加速度を検出するステップと、
検出した加速度の周波数分析から周波数に対応するパワースペクトルを算出するステップと、
算出したパワースペクトルの単回帰直線を演算し、所定周波数範囲での当該単回帰直線の傾きの変化量の極大値を傾き極大値として算出するステップと、
自車両と先行車両との車間距離を検出するステップと、
検出した車間距離から分布推定法を用いて、車間距離分布を推定するステップと、
推定された車間距離分布から共分散の最小値を算出するステップと、
前記共分散の最小値と前記傾き極大値との相関関係から前方の車群分布を推定するステップと、
前記車群分布に基づきリアルタイム渋滞予測をおこなうステップと、
を含む渋滞予測方法。 - 前記渋滞予測をおこなうステップは、前記車群分布において車群変動が大きい領域と車群変動が小さい領域を特定し、当該2つの領域の境界領域の有無を判定することを含む、請求項1に記載の渋滞予測方法。
- 前記境界領域は、渋滞が発生する可能性の低い自由流領域と車両の制動および加速が混合する混合流領域との間の臨界領域に相当する、請求項2に記載の渋滞予測方法。
- 前記車群分布を推定するステップは、前記共分散値の最小値の対数と前記傾き極大値の対数との相関マップを作成することを含む、請求項1~3のいずれかに記載の渋滞予測方法。
Priority Applications (4)
| Application Number | Priority Date | Filing Date | Title |
|---|---|---|---|
| CN201180059124.1A CN103262135B (zh) | 2010-12-15 | 2011-12-09 | 堵车预测方法 |
| BR112013014962A BR112013014962A2 (pt) | 2010-12-15 | 2011-12-09 | dispositivo e método de previsão de congestionamento de tráfego |
| JP2012548637A JP5555778B2 (ja) | 2010-12-15 | 2011-12-09 | 渋滞予測方法 |
| US13/991,609 US8731809B2 (en) | 2010-12-15 | 2011-12-09 | Traffic congestion prediction method |
Applications Claiming Priority (2)
| Application Number | Priority Date | Filing Date | Title |
|---|---|---|---|
| JP2010-278754 | 2010-12-15 | ||
| JP2010278754 | 2010-12-15 |
Publications (1)
| Publication Number | Publication Date |
|---|---|
| WO2012081209A1 true WO2012081209A1 (ja) | 2012-06-21 |
Family
ID=46244328
Family Applications (1)
| Application Number | Title | Priority Date | Filing Date |
|---|---|---|---|
| PCT/JP2011/006880 Ceased WO2012081209A1 (ja) | 2010-12-15 | 2011-12-09 | 渋滞予測方法 |
Country Status (5)
| Country | Link |
|---|---|
| US (1) | US8731809B2 (ja) |
| JP (1) | JP5555778B2 (ja) |
| CN (1) | CN103262135B (ja) |
| BR (1) | BR112013014962A2 (ja) |
| WO (1) | WO2012081209A1 (ja) |
Cited By (5)
| Publication number | Priority date | Publication date | Assignee | Title |
|---|---|---|---|---|
| JP2012128612A (ja) * | 2010-12-15 | 2012-07-05 | Honda Motor Co Ltd | 運転支援方法 |
| CN103065466A (zh) * | 2012-11-19 | 2013-04-24 | 北京世纪高通科技有限公司 | 一种交通异常状况的检测方法和装置 |
| CN104937647A (zh) * | 2013-03-08 | 2015-09-23 | 本田技研工业株式会社 | 交通拥堵预兆检测方法、程序及交通拥堵预兆检测装置 |
| JP2017041020A (ja) * | 2015-08-18 | 2017-02-23 | 富士通株式会社 | 走行区間評価方法、走行区間評価プログラム、及び走行区間評価装置 |
| JP2017068688A (ja) * | 2015-09-30 | 2017-04-06 | 株式会社東芝 | 車間距離検出装置、車間距離検出方法、およびプログラム |
Families Citing this family (27)
| Publication number | Priority date | Publication date | Assignee | Title |
|---|---|---|---|---|
| US8606512B1 (en) | 2007-05-10 | 2013-12-10 | Allstate Insurance Company | Route risk mitigation |
| US10096038B2 (en) | 2007-05-10 | 2018-10-09 | Allstate Insurance Company | Road segment safety rating system |
| US10157422B2 (en) | 2007-05-10 | 2018-12-18 | Allstate Insurance Company | Road segment safety rating |
| US9932033B2 (en) | 2007-05-10 | 2018-04-03 | Allstate Insurance Company | Route risk mitigation |
| JP5667944B2 (ja) * | 2011-08-11 | 2015-02-12 | 本田技研工業株式会社 | サーバ側渋滞解消走行支援方法 |
| JP5909401B2 (ja) * | 2012-04-04 | 2016-04-26 | 本田技研工業株式会社 | 渋滞予測方法 |
| US9582999B2 (en) * | 2013-10-31 | 2017-02-28 | Here Global B.V. | Traffic volume estimation |
| US10096067B1 (en) | 2014-01-24 | 2018-10-09 | Allstate Insurance Company | Reward system related to a vehicle-to-vehicle communication system |
| US9355423B1 (en) | 2014-01-24 | 2016-05-31 | Allstate Insurance Company | Reward system related to a vehicle-to-vehicle communication system |
| US9390451B1 (en) | 2014-01-24 | 2016-07-12 | Allstate Insurance Company | Insurance system related to a vehicle-to-vehicle communication system |
| US10803525B1 (en) | 2014-02-19 | 2020-10-13 | Allstate Insurance Company | Determining a property of an insurance policy based on the autonomous features of a vehicle |
| US10796369B1 (en) | 2014-02-19 | 2020-10-06 | Allstate Insurance Company | Determining a property of an insurance policy based on the level of autonomy of a vehicle |
| US10783587B1 (en) | 2014-02-19 | 2020-09-22 | Allstate Insurance Company | Determining a driver score based on the driver's response to autonomous features of a vehicle |
| US9940676B1 (en) | 2014-02-19 | 2018-04-10 | Allstate Insurance Company | Insurance system for analysis of autonomous driving |
| US10783586B1 (en) * | 2014-02-19 | 2020-09-22 | Allstate Insurance Company | Determining a property of an insurance policy based on the density of vehicles |
| WO2015178195A1 (ja) * | 2014-05-20 | 2015-11-26 | 本田技研工業株式会社 | 運転特性評価方法、プログラムおよび運転特性評価装置 |
| US9556792B2 (en) | 2014-10-17 | 2017-01-31 | Kohler, Co. | Dual compressor turbocharger |
| US10378549B2 (en) | 2014-10-17 | 2019-08-13 | Kohler Co. | Dual compressor turbocharger |
| TWI543896B (zh) | 2015-08-26 | 2016-08-01 | 財團法人工業技術研究院 | 通訊裝置、通訊系統與其相關之通訊方法 |
| US9483938B1 (en) | 2015-08-28 | 2016-11-01 | International Business Machines Corporation | Diagnostic system, method, and recording medium for signalized transportation networks |
| US10269075B2 (en) | 2016-02-02 | 2019-04-23 | Allstate Insurance Company | Subjective route risk mapping and mitigation |
| US10319221B2 (en) | 2016-11-04 | 2019-06-11 | Ford Global Technologies, Llc | Systems and methods for vehicular application of detected traffic flow |
| CN111583639B (zh) * | 2020-04-30 | 2021-05-14 | 山东交通学院 | 一种道路交通拥堵预警方法及系统 |
| CN113256973B (zh) * | 2021-05-11 | 2022-03-25 | 青岛海信网络科技股份有限公司 | 一种高峰开始时间预测方法、装置、设备及介质 |
| CN113920727B (zh) * | 2021-10-08 | 2023-11-07 | 温州大学 | 一种由施工引发道路拥堵的预测方法及系统 |
| CN119479317B (zh) * | 2025-01-15 | 2025-03-25 | 云南省交通科学研究院有限公司 | 一种道路交通异常状态监测分析方法、系统、终端及介质 |
| CN120274217B (zh) * | 2025-03-25 | 2026-02-24 | 国家石油天然气管网集团有限公司 | 管道风险监测系统和方法 |
Citations (3)
| Publication number | Priority date | Publication date | Assignee | Title |
|---|---|---|---|---|
| JP2002190090A (ja) * | 2000-10-13 | 2002-07-05 | Sumitomo Electric Ind Ltd | 交通流の異常検知装置及び方法(スペクトル) |
| JP2002342872A (ja) * | 2001-05-11 | 2002-11-29 | Sumitomo Electric Ind Ltd | 交通流の異常検知装置及び方法 |
| JP2009262862A (ja) * | 2008-04-28 | 2009-11-12 | Toyota Motor Corp | 走行制御装置及び走行制御方法 |
Family Cites Families (5)
| Publication number | Priority date | Publication date | Assignee | Title |
|---|---|---|---|---|
| JP4075026B2 (ja) * | 1998-12-03 | 2008-04-16 | マツダ株式会社 | 車両の障害物警報装置 |
| JP3363393B2 (ja) * | 1998-12-21 | 2003-01-08 | 千住金属工業株式会社 | 鉛フリーはんだ合金 |
| JP4342535B2 (ja) * | 2006-07-10 | 2009-10-14 | トヨタ自動車株式会社 | 渋滞度作成方法、渋滞度作成装置 |
| JP2009286274A (ja) | 2008-05-29 | 2009-12-10 | Toyota Motor Corp | 車両用運転支援装置 |
| CN101739820B (zh) * | 2009-11-19 | 2012-09-26 | 北京世纪高通科技有限公司 | 路况预测的方法及装置 |
-
2011
- 2011-12-09 US US13/991,609 patent/US8731809B2/en active Active
- 2011-12-09 BR BR112013014962A patent/BR112013014962A2/pt active Search and Examination
- 2011-12-09 WO PCT/JP2011/006880 patent/WO2012081209A1/ja not_active Ceased
- 2011-12-09 JP JP2012548637A patent/JP5555778B2/ja not_active Expired - Fee Related
- 2011-12-09 CN CN201180059124.1A patent/CN103262135B/zh not_active Expired - Fee Related
Patent Citations (3)
| Publication number | Priority date | Publication date | Assignee | Title |
|---|---|---|---|---|
| JP2002190090A (ja) * | 2000-10-13 | 2002-07-05 | Sumitomo Electric Ind Ltd | 交通流の異常検知装置及び方法(スペクトル) |
| JP2002342872A (ja) * | 2001-05-11 | 2002-11-29 | Sumitomo Electric Ind Ltd | 交通流の異常検知装置及び方法 |
| JP2009262862A (ja) * | 2008-04-28 | 2009-11-12 | Toyota Motor Corp | 走行制御装置及び走行制御方法 |
Cited By (8)
| Publication number | Priority date | Publication date | Assignee | Title |
|---|---|---|---|---|
| JP2012128612A (ja) * | 2010-12-15 | 2012-07-05 | Honda Motor Co Ltd | 運転支援方法 |
| CN103065466A (zh) * | 2012-11-19 | 2013-04-24 | 北京世纪高通科技有限公司 | 一种交通异常状况的检测方法和装置 |
| CN103065466B (zh) * | 2012-11-19 | 2015-01-21 | 北京世纪高通科技有限公司 | 一种交通异常状况的检测方法和装置 |
| CN104937647A (zh) * | 2013-03-08 | 2015-09-23 | 本田技研工业株式会社 | 交通拥堵预兆检测方法、程序及交通拥堵预兆检测装置 |
| US9646492B2 (en) | 2013-03-08 | 2017-05-09 | Honda Motor Co., Ltd. | Congestion sign detection method, program, and congestion sign detection device |
| CN104937647B (zh) * | 2013-03-08 | 2017-07-25 | 本田技研工业株式会社 | 交通拥堵预兆检测方法及交通拥堵预兆检测装置 |
| JP2017041020A (ja) * | 2015-08-18 | 2017-02-23 | 富士通株式会社 | 走行区間評価方法、走行区間評価プログラム、及び走行区間評価装置 |
| JP2017068688A (ja) * | 2015-09-30 | 2017-04-06 | 株式会社東芝 | 車間距離検出装置、車間距離検出方法、およびプログラム |
Also Published As
| Publication number | Publication date |
|---|---|
| US8731809B2 (en) | 2014-05-20 |
| US20130261944A1 (en) | 2013-10-03 |
| CN103262135A (zh) | 2013-08-21 |
| CN103262135B (zh) | 2015-02-25 |
| JPWO2012081209A1 (ja) | 2014-05-22 |
| JP5555778B2 (ja) | 2014-07-23 |
| BR112013014962A2 (pt) | 2016-09-13 |
Similar Documents
| Publication | Publication Date | Title |
|---|---|---|
| JP5555778B2 (ja) | 渋滞予測方法 | |
| JP5511984B2 (ja) | 車両の走行支援装置 | |
| JP5481557B2 (ja) | 渋滞予測方法 | |
| JP5460869B2 (ja) | 渋滞予測装置 | |
| JP5462945B2 (ja) | 渋滞予測表示方法 | |
| JP5667944B2 (ja) | サーバ側渋滞解消走行支援方法 | |
| JP5501209B2 (ja) | 車両の走行支援装置 | |
| JP5627531B2 (ja) | 運転支援装置 | |
| JP6350149B2 (ja) | 合流支援システム | |
| JP2013215067A (ja) | 電動車両走行支援システム | |
| JP5909144B2 (ja) | 車群解消システム | |
| JP5570961B2 (ja) | 渋滞予兆表示方法 | |
| JP2011118723A (ja) | 車両の衝突を回避するための装置 | |
| JP2013105379A (ja) | サーバ側渋滞解消走行支援方法 | |
| JP5450365B2 (ja) | 走行支援システム | |
| JP5104242B2 (ja) | 情報提供装置、情報提供システム、コンピュータプログラム及び情報提供方法 | |
| JP5909401B2 (ja) | 渋滞予測方法 | |
| JP2013104815A (ja) | ナビゲーション装置 | |
| JP5501208B2 (ja) | 運転支援方法 | |
| EP4716935A1 (en) | Information management device, information management method, and program |
Legal Events
| Date | Code | Title | Description |
|---|---|---|---|
| 121 | Ep: the epo has been informed by wipo that ep was designated in this application |
Ref document number: 11849240 Country of ref document: EP Kind code of ref document: A1 |
|
| WWE | Wipo information: entry into national phase |
Ref document number: 13991609 Country of ref document: US |
|
| ENP | Entry into the national phase |
Ref document number: 2012548637 Country of ref document: JP Kind code of ref document: A |
|
| NENP | Non-entry into the national phase |
Ref country code: DE |
|
| 122 | Ep: pct application non-entry in european phase |
Ref document number: 11849240 Country of ref document: EP Kind code of ref document: A1 |
|
| REG | Reference to national code |
Ref country code: BR Ref legal event code: B01A Ref document number: 112013014962 Country of ref document: BR |
|
| ENP | Entry into the national phase |
Ref document number: 112013014962 Country of ref document: BR Kind code of ref document: A2 Effective date: 20130614 |