WO2012074014A1 - 画像色推定方法、画像色推定装置、及び画像色推定プログラム - Google Patents
画像色推定方法、画像色推定装置、及び画像色推定プログラム Download PDFInfo
- Publication number
- WO2012074014A1 WO2012074014A1 PCT/JP2011/077687 JP2011077687W WO2012074014A1 WO 2012074014 A1 WO2012074014 A1 WO 2012074014A1 JP 2011077687 W JP2011077687 W JP 2011077687W WO 2012074014 A1 WO2012074014 A1 WO 2012074014A1
- Authority
- WO
- WIPO (PCT)
- Prior art keywords
- component
- value
- signal value
- display
- gradation
- Prior art date
- Legal status (The legal status is an assumption and is not a legal conclusion. Google has not performed a legal analysis and makes no representation as to the accuracy of the status listed.)
- Ceased
Links
Images







Classifications
-
- G—PHYSICS
- G09—EDUCATION; CRYPTOGRAPHY; DISPLAY; ADVERTISING; SEALS
- G09G—ARRANGEMENTS OR CIRCUITS FOR CONTROL OF INDICATING DEVICES USING STATIC MEANS TO PRESENT VARIABLE INFORMATION
- G09G5/00—Control arrangements or circuits for visual indicators common to cathode-ray tube indicators and other visual indicators
- G09G5/02—Control arrangements or circuits for visual indicators common to cathode-ray tube indicators and other visual indicators characterised by the way in which colour is displayed
-
- H—ELECTRICITY
- H04—ELECTRIC COMMUNICATION TECHNIQUE
- H04N—PICTORIAL COMMUNICATION, e.g. TELEVISION
- H04N1/00—Scanning, transmission or reproduction of documents or the like, e.g. facsimile transmission; Details thereof
- H04N1/46—Colour picture communication systems
- H04N1/56—Processing of colour picture signals
- H04N1/60—Colour correction or control
- H04N1/6027—Correction or control of colour gradation or colour contrast
-
- H—ELECTRICITY
- H04—ELECTRIC COMMUNICATION TECHNIQUE
- H04N—PICTORIAL COMMUNICATION, e.g. TELEVISION
- H04N1/00—Scanning, transmission or reproduction of documents or the like, e.g. facsimile transmission; Details thereof
- H04N1/46—Colour picture communication systems
- H04N1/56—Processing of colour picture signals
- H04N1/60—Colour correction or control
- H04N1/603—Colour correction or control controlled by characteristics of the picture signal generator or the picture reproducer
-
- H—ELECTRICITY
- H04—ELECTRIC COMMUNICATION TECHNIQUE
- H04N—PICTORIAL COMMUNICATION, e.g. TELEVISION
- H04N9/00—Details of colour television systems
- H04N9/64—Circuits for processing colour signals
- H04N9/67—Circuits for processing colour signals for matrixing
-
- G—PHYSICS
- G09—EDUCATION; CRYPTOGRAPHY; DISPLAY; ADVERTISING; SEALS
- G09G—ARRANGEMENTS OR CIRCUITS FOR CONTROL OF INDICATING DEVICES USING STATIC MEANS TO PRESENT VARIABLE INFORMATION
- G09G2320/00—Control of display operating conditions
- G09G2320/06—Adjustment of display parameters
- G09G2320/0693—Calibration of display systems
-
- G—PHYSICS
- G09—EDUCATION; CRYPTOGRAPHY; DISPLAY; ADVERTISING; SEALS
- G09G—ARRANGEMENTS OR CIRCUITS FOR CONTROL OF INDICATING DEVICES USING STATIC MEANS TO PRESENT VARIABLE INFORMATION
- G09G2360/00—Aspects of the architecture of display systems
- G09G2360/14—Detecting light within display terminals, e.g. using a single or a plurality of photosensors
- G09G2360/145—Detecting light within display terminals, e.g. using a single or a plurality of photosensors the light originating from the display screen
Definitions
- the present invention relates to an image color estimation method for estimating an image color displayed on an image display device such as a display, an image color estimation device for estimating an image color, and an image color estimation program for estimating an image color.
- Patent Document 1 describes a technique related to a display characteristic calibration method for calibrating display characteristics of a color display device.
- Patent Document 2 describes a technique related to a measurement method for measuring display characteristics of a display.
- Patent Document 3 describes a technique related to a system for creating a monitor profile. According to this technique, a monitor profile for performing high-accuracy correction according to the display characteristics of each monitor can be easily created.
- CMS color management system
- an image color estimation method capable of accurately estimating the image color of an image displayed on a display in which additive color mixture is not established and color tracking occurs, an image color estimation device for estimating an image color, and an image color
- An image color estimation program for estimating the image color is provided.
- An image color estimation method is an XYZ representing a device-independent color of an image displayed on a display from RGB color system gradation values (R, G, B) input to the display.
- the second display characteristic is to set two invariant components of the gradation values (R, G, B) to fixed values and change the remaining variable components.
- each component of the image color is expressed as the sum of the output image signal value (Rs, Gs, Bs) and the offset value (Ro, Go, Bo).
- the offset value is calculated based on the first display characteristic, the second display characteristic, and the gradation values (R, G, B). The output image signal values (Rs, Gs, Bs) can be corrected using this offset value. Therefore, even in a display in which additive color mixture is not established and color tracking occurs, the image color displayed on the display is accurately estimated based on the gradation values (R, G, B) input to the display. can do.
- the offset value (Ro, Go, Bo) is a function of the gradation value (R, G, B), and the following equation (1); The function shown in FIG.
- C1 represents a first component selected from the components of gradation values (R, G, B).
- C2 represents a second component different from the first component selected from the components of the gradation values (R, G, B).
- C3 represents a third component different from the first component and the second component selected from the components of the gradation values (R, G, B).
- ⁇ Cs indicates a numerical value calculated based on a first display characteristic when the first component is an invariable component and the second component is a variable component.
- ⁇ C's indicates a numerical value calculated based on another first display characteristic when the first component is an invariable component and the third component is a variable component.
- the coefficient ⁇ indicates a coefficient of an approximate function that approximates one second display characteristic.
- the coefficient ⁇ represents a coefficient of an approximate function that approximates another second display characteristic.
- the component corresponding to the first component of the output image signal value (Rs, Gs, Bs) when only the first component is turned on, the first component, and the second component And the component corresponding to the first component of the output image signal value (Rs, Gs, Bs) when the component is turned on can be calculated by the first term of the above equation (1).
- the component corresponding to the first component of the output image signal values (Rs, Gs, Bs) when only the first component is turned on, and the first component and the third component are turned on.
- the difference from the component corresponding to the first component of the output image signal value (Rs, Gs, Bs) can be calculated by the second term of the above equation (1).
- the offset value of the 1st component which considered two differences can be computed. Therefore, even in a display in which additive color mixture is not established and color tracking occurs, the image color displayed on the display is accurately estimated based on the gradation values (R, G, B) input to the display. can do.
- the fourth step further includes correction using a zero bias value, and the zero bias value is input to the display as a gradation value (R, G, B) in which each component is zero.
- the measured value (Xk, Yk, Zk) of the XYZ color system displayed on the display may be used. According to this, when the gradation value (R, G, B) is zero in the display, the image color displayed on the display in the portion where the offset of the component of the image color exists can be estimated with higher accuracy. .
- An image color estimation apparatus represents a device-independent color of an image displayed on a display from RGB color system gradation values (R, G, B) input to the display.
- An image color estimation device for estimating an XYZ color system signal value (XYZ), based on a first display characteristic and a gradation value (R, G, B), an RGB color system signal value ( Rs, Gs, Bs), a signal value component (Rs, Gs) based on the first display characteristic, the second display characteristic, and the gradation value (R, G, B).
- the second display characteristic is a case where two invariant components are set to fixed values among gradation values (R, G, B) and the remaining variable components are changed.
- each component of the image color is expressed as the sum of the output image signal value (Rs, Gs, Bs) and the offset value (Ro, Go, Bo).
- the offset value is calculated based on the first display characteristic, the second display characteristic, and the gradation values (R, G, B). The output image signal values (Rs, Gs, Bs) can be corrected using this offset value. Therefore, even in a display in which additive color mixture is not established and color tracking occurs, the image color displayed on the display is accurately estimated based on the gradation values (R, G, B) input to the display. can do.
- An image color estimation program represents device-independent colors of an image displayed on a display from RGB color system gradation values (R, G, B) input to the display.
- An image color estimation program for estimating a signal value (XYZ) of an XYZ color system, the computer using an RGB color system based on a first display characteristic and a gradation value (R, G, B) Based on the signal value calculation unit for calculating the signal value (Rs, Gs, Bs), the first display characteristic, the second display characteristic, and the gradation value (R, G, B), the component ( Rs, Gs, Bs), an offset value calculator for calculating an offset value (Ro, Go, Bo) corresponding to each of the values, and adding the offset value (Ro, Go, Bo) to the signal value (Rs, Gs, Bs) As a result, correction signal values (Rc, c, Bc) and a signal value conversion unit that converts the correction signal value (Rc, Gc, Bc) into
- the first display characteristic is that when at least one of the gradation values (R, G, B) is a variable component, the variable component of the gradation value (R, G, B) and the signal value ( Rs, Gs, Bs) is a relationship with the component corresponding to the variable component
- the second display characteristic is that the two invariant components of the gradation values (R, G, B) are set to fixed values and the rest Is a relationship between the variable component of the gradation value (R, G, B) and the component corresponding to the invariant component of the signal value (Rs, Gs, Bs).
- each component of the image color is expressed as the sum of the output image signal value (Rs, Gs, Bs) and the offset value (Ro, Go, Bo).
- the offset value is calculated based on the first display characteristic, the second display characteristic, and the gradation values (R, G, B). The output image signal values (Rs, Gs, Bs) can be corrected using this offset value. Therefore, even in a display in which additive color mixture is not established and color tracking occurs, the image color displayed on the display is accurately estimated based on the gradation values (R, G, B) input to the display. can do.
- additive color mixture is not established, and the image color of the image displayed on the display where color tracking occurs can be estimated with high accuracy.
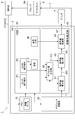
- FIG. 1 shows one Embodiment of the image color estimation apparatus for performing the image color estimation method which concerns on this invention.
- It is a block diagram which shows the functional structure of the image processing apparatus for performing the image color estimation method of 1st Embodiment.
- It is a flowchart for demonstrating the image color estimation method of 1st Embodiment.
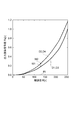
- It is a figure for demonstrating a 1st display characteristic.
- It is a figure for demonstrating a 1st display characteristic.
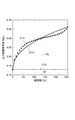
- It is a figure for demonstrating a 2nd display characteristic.
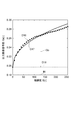
- It is a figure for demonstrating a 2nd display characteristic.
- It is a figure for demonstrating a 2nd display characteristic.
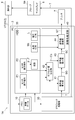
- FIG. 1 is a diagram illustrating a configuration of an information processing apparatus (image color estimation apparatus) 1 that executes an image color estimation program that implements the image color estimation method according to the first embodiment.
- the information processing apparatus 1 includes a personal computer 3 (hereinafter referred to as “PC”), a display 5, a printer 7, and a colorimeter 9.
- the information processing apparatus 1 has a function of accurately estimating the image color displayed on the display 5.
- the estimated image color data is output to a printer 7 capable of colorimetric printing. As a result, the information processing apparatus 1 can accurately match the image color of the image displayed on the display 5 with the color of the printed matter printed by the printer 7.
- FIG. 2 is a block diagram showing a functional configuration of the information processing apparatus 1.
- the information processing apparatus 1 executes the image color estimation method of the first embodiment.
- the PC 3 includes a memory 10 in which image data is stored, a graphic processing unit 20, a hard disk drive 30 (hereinafter referred to as “HDD”), and an image color estimation unit 40.
- the memory 10 has a function of storing image data.
- the color of the image data is represented as gradation data of the RGB color system.
- the gradation value T of this image data is assumed to be (R, G, B).
- R represents a component of a red gradation value T.
- G indicates a component of a green gradation value T.
- B represents a component of a blue tone value T.
- the graphic processing unit 20 is connected to the memory 10 and the image color estimation unit 40.
- the graphic processing unit 20 is connected to the display 5.
- the graphic processing unit 20 edits the image data on the memory 10 in response to the operation of the input device by the operator.
- the graphic processing unit 20 outputs the image data to the display 5 to display an image.
- the graphic processing unit 20 has a function of outputting the image data on the memory 10 to the printer 7 through the image color estimating unit 40 and printing the image.
- the graphic processor 20 has a function of outputting reference image data.
- the reference image data is displayed on the display 5 when a first display characteristic P1 and a second display characteristic P2 described later are acquired.
- the graphic processing unit 20 has a function of calculating a coefficient ⁇ and a coefficient ⁇ described later.
- the graphic processing unit 20 is a functional component that is partially or entirely realized by software.
- the HDD 30 is configured to be referred to from the image color estimation unit 40.
- the HDD 30 stores a first display characteristic P1, a second display characteristic P2, a coefficient ⁇ , a coefficient ⁇ , and a conversion matrix M.
- the first display characteristic P1 and the second display characteristic P2 represent the correlation between the gradation value T (R, G, B) of the image data and the signal value SG (Rs, Gs, Bs). is there.
- the gradation value T (R, G, B) is image data input to the display 5 from the graphic processing unit 20.
- the signal value SG (Rs, Gs, Bs) is a signal value of an actual image displayed on the display 5 based on the input image data.
- the coefficient ⁇ and the coefficient ⁇ are coefficients for calculating an approximate curve of the second display characteristic P2.
- the conversion matrix M is a matrix for converting RGB values of the RGB color system into tristimulus values (XYZ) of the XYZ color system.
- the image color estimation unit 40 is connected to the HDD 30, the graphic processing unit 20, and the printer 7.
- the image color estimation unit 40 includes a signal value calculation unit 41, an offset value calculation unit 42, a signal value correction unit 43, and a signal value conversion unit 44.
- the image color estimation unit 40 has a function of estimating the image color displayed on the display 5. The image color is estimated based on the image data input to the display 5 from the graphic processing unit 20. Further, the image color estimation unit 40 has a function of outputting a signal value (XYZ) corresponding to the estimated color to the printer 7.
- the image color estimation unit 40 is a functional component that is partially or entirely realized by software.
- the signal value calculation unit 41 is connected to the graphic processing unit 20, the signal value correction unit 43, and the HDD 30.
- the signal value calculation unit 41 has a function of calculating a signal value SG (Rs, Gs, Bs).
- the signal value SG (Rs, Gs, Bs) is calculated based on the gradation value T (R, G, B) that is image data and the first display characteristic P1. Further, the signal value calculation unit 41 has a function of outputting the signal value SG (Rs, Gs, Bs) to the signal value correction unit 43.
- the offset value calculation unit 42 is connected to the graphic processing unit 20, the HDD 30, and the signal value correction unit 43.
- the offset value calculation unit 42 has a function of calculating an offset value Co (Ro, Go, Bo).
- the offset value Co (Ro, Go, Bo) includes a gradation value T (R, G, B) that is image data, a first display characteristic P1, a second display characteristic P2, a coefficient ⁇ , It is calculated based on the coefficient ⁇ . Further, the offset value calculation unit 42 has a function of outputting the offset value Co (Ro, Go, Bo) to the signal value correction unit 43.
- the signal value correction unit 43 is connected to the signal value calculation unit 41, the offset value calculation unit 42, and the signal value conversion unit 44.
- the signal value correction unit 43 has a function of calculating a correction signal value SC (Rc, Gc, Bc).
- the correction signal value SC (Rc, Gc, Bc) is calculated based on the signal value SG (Rs, Gs, Bs) and the offset value Co (Ro, Go, Bo). Further, the signal value correction unit 43 has a function of outputting the correction signal value SC (Rc, Gc, Bc) to the signal value conversion unit 44.
- the signal value conversion unit 44 is connected to the signal value correction unit 43, the HDD 30, and the printer 7.
- the signal value conversion unit 44 has a function of converting the correction signal value SC (Rc, Gc, Bc) of the XYZ color system into the correction signal value ST (Xc, Yc, Zc).
- the correction signal value SC (Rc, Gc, Bc) is converted into the correction signal value ST (Xc, Yc, Zc) using the conversion matrix M.
- the signal value conversion unit 44 has a function of outputting the correction signal value ST (Xc, Yc, Zc) to the printer 7.
- the display 5 is connected to the graphic processing unit 20 of the PC 3.
- the display 5 is a device that displays image data.
- the printer 7 is connected to the image color estimation unit 40 of the PC 3.
- the printer 7 is a device that outputs image data as a printed matter.
- the printer 7 has a function capable of realizing colorimetric color reproduction. In colorimetric color reproduction, the signal value (Xp, Yp, Zp) of the printed image and the signal value VT (Xs, Ys, Zs) of the image displayed on the display 5 are the same. Color reproduction.
- the colorimeter 9 is connected to the PC 3.
- the colorimeter 9 includes a probe 9 a that is applied to the display screen of the display 5.
- the colorimeter 9 is a device that obtains measurement values (measurement signal values VT) of an XYZ color system of an image displayed on the screen by placing the probe 9a on the display 5.
- measurement values VT measurement signal values
- a colorimeter for a light source such as a display colorimeter can be suitably used.
- FIG. 3 is a flowchart showing a process of acquiring the display characteristic P.
- the display characteristic P is created by the following process.
- the graphic processing unit 20 generates image data.
- the graphic processing unit 20 inputs the gradation value T1 (R, G, B), which is the generated image data, to the display 5 and displays an image composed of one color on the display 5 (S101).
- the gradation value is represented by a numerical range of 0 to 255 (8 bits), but may be represented by another numerical range such as 0 to 1023 (10 bits).
- the probe 9a of the colorimeter 9 is applied to the screen of the display 5, and the measurement signal value VT1 (Xs, Ys, Zs) of the image displayed on the screen is acquired (S102). .
- the measurement signal value VT1 (Xs, Ys, Zs) is input from the colorimeter 9 to the PC 3.
- the average of the measurement signal values VT1 may be calculated by applying the probe 9a to a plurality of locations on the screen.
- the measurement signal value VT1 (Xs, Ys, Zs) is converted into an output image signal value SG1 (Rs, Gs, Bs) using the following equation (2) (S103).
- the graphic processing unit 20 associates the gradation value T1 (R, G, B) and the output image signal value SG1 (Rs, Gs, Bs) and stores them in the memory 10 (S104). Subsequently, the graphic processing unit 20 changes the image data input to the display 5 and repeats the processing from S101. That is, the graphic processing unit 20 outputs the image data of the next gradation value T2 (R, G, B) to the display 5 and displays the image on the display 5 (S101). Then, the measurement signal value VT2 (Xs, Ys, Zs) is acquired by the above-described processing (S102).
- the acquired measurement signal value VT2 (Xs, Ys, Zs) is converted into an output image signal value SG2 (Rs, Gs, Bs) (S103). Then, the graphic processing unit 20 associates the gradation value T2 (R, G, B) and the output image signal value SG2 (Rs, Gs, Bs) and stores them in the memory 10 (S104).
- the above-described processing is repeated n times, which is a predetermined number of times, from the gradation value T1 (R, G, B) to the gradation value Tn (R, G, B) (S105).
- n times which is a predetermined number of times, from the gradation value T1 (R, G, B) to the gradation value Tn (R, G, B) (S105).
- the graphic processing unit 20 inputs the obtained n sets of correlations as display characteristics P to the HDD 20 and stores them as a database file (S106).
- the acquired display characteristics P include a first display characteristic and a second display characteristic.
- the first display characteristic is a characteristic indicating a relationship between a variable component of the gradation value T (R, G, B) and a component corresponding to the variable component of the output image signal value SG (Rs, Gs, Bs).
- the variable component of the gradation value T (R, G, B) is at least one component among the gradation values T (R, G, B).
- the first display characteristic includes a first display characteristic P1R (representing a relationship between R of the gradation value T (R, G, B) and Rs of the output image signal value SG (Rs, Gs, Bs).
- R of the gradation value T (R, G, B) is a variable component.
- the first display characteristic includes a first display characteristic P1G indicating a relationship between G of the gradation value T (R, G, B) and Gs of the output image signal value SG (Rs, Gs, Bs). (See FIG. 5).
- G of the gradation value T (R, G, B) is a variable component.
- the first display characteristic includes a first display characteristic P1B indicating a relationship between B of the gradation value T (R, G, B) and Bs of the output image signal value SG (Rs, Gs, Bs). (See FIG. 6).
- B of the gradation value T (R, G, B) is a variable component.
- the first display characteristic P1R is a relationship between the component R of the gradation value T (R, G, B) and the component Rs of the output image signal value SG (Rs, Gs, Bs).
- the gradation value T (R, G, B) is a gradation value input to the display 5.
- the output image signal value SG (Rs, Gs, Bs) is an output image signal value displayed on the display 5.
- the first display characteristic P1R includes characteristics under four input conditions indicating the relationship between the gradation value T (R, G, B) and the output image signal value SG (Rs, Gs, Bs). ing.
- the first display characteristic P1R includes a characteristic in the case where R of the gradation value T (R, G, B) is a variable component and G and B are invariable components (FIG. 4). D1). R of the gradation value T (R, G, B) is changed in the range of 0 to 255. Further, the first display characteristic P1R includes a characteristic when R and G of the gradation value T (R, G, B) are variable components and B is an invariant component (FIG. 4). D2). R and G of the gradation value T (R, G, B) are changed in the range of 0 to 255.
- the first display characteristic P1R includes a characteristic in the case where R and B of the gradation value T (R, G, B) are variable components and G is an invariant component (FIG. 4). D3). R and B of the gradation value T (R, G, B) are changed in the range of 0 to 255. Further, the first display characteristic P1R includes a characteristic in the case where R, G, and B of the gradation value T (R, G, B) are variable components (see D4 in FIG. 4). R, G, and B of the gradation value T (R, G, B) are changed in the range of 0 to 255.
- a curve D2 in FIG. 4 shows a relationship between R of the gradation value T (R, G, B) and Rs of the output image signal value SG (Rs, Gs, Bs).
- the first display characteristic P1G has a relationship between the component G of the gradation value T (R, G, B) and the component Gs of the output image signal value SG (Rs, Gs, Bs).
- the gradation value T (R, G, B) is a gradation value input to the display 5.
- the output image signal value SG (Rs, Gs, Bs) is an output image signal value displayed on the display 5.
- the first display characteristic P1G includes characteristics under four input conditions indicating the relationship between the gradation value T (R, G, B) and the output image signal value SG (Rs, Gs, Bs). ing.
- the first display characteristic P1G includes a characteristic in the case where G of the gradation value T (R, G, B) is a variable component and R and B are invariant components (FIG. 5). D5). G of the gradation value T (R, G, B) is changed in the range of 0 to 255. Further, the first display characteristic P1G includes a characteristic in the case where G and B of the gradation values T (R, G, B) are variable components and R is an invariant component (FIG. 5). D6). G and B of the gradation value T (R, G, B) are changed in the range of 0 to 255.
- the first display characteristic P1G includes a characteristic in the case where R and G of the gradation value T (R, G, B) are variable components and B is an invariant component (FIG. 5). D7). R and G of the gradation value T (R, G, B) are changed in the range of 0 to 255. Further, the first display characteristic P1G includes a characteristic in the case where R, G, and B of the gradation value T (R, G, B) are variable components (see D8 in FIG. 5). R, G, and B of the gradation value T (R, G, B) are changed in the range of 0 to 255.
- a curve D6 in FIG. 5 shows a relationship between G of the gradation value T (R, G, B) and Gs of the output image signal value SG (Rs, Gs, Bs).
- the first display characteristic P1B is a relationship between the component B of the gradation value T (R, G, B) and the component Bs of the output image signal value SG (Rs, Gs, Bs).
- the gradation value T (R, G, B) is a gradation value input to the display 5.
- the output image signal value SG (Rs, Gs, Bs) is an output image signal value displayed on the display 5.
- the first display characteristic P1B includes characteristics under four input conditions indicating the relationship between the gradation value T (R, G, B) and the output image signal value SG (Rs, Gs, Bs). ing.
- the first display characteristic P1B includes a characteristic when B of the gradation value T (R, G, B) is a variable component and R and G are invariant components (FIG. 6). D9). B of the gradation value T (R, G, B) is changed in the range of 0 to 255. Further, the first display characteristic P1B includes a characteristic in the case where R and B of the gradation value T (R, G, B) are variable components and G is an invariant component (FIG. 6). D10). R and B of the gradation value T (R, G, B) are changed in the range of 0 to 255.
- the first display characteristic P1B includes a characteristic when G and B of the gradation values T (R, G, B) are variable components and R is an invariant component (FIG. 6). D11). G and B of the gradation value T (R, G, B) are changed in the range of 0 to 255. Furthermore, the first display characteristic P1B includes a characteristic in the case where R, G, and B of the gradation value T (R, G, B) are variable components (see D12 in FIG. 6). R, G, and B of the gradation value T (R, G, B) are changed in the range of 0 to 255.
- a curve D10 in FIG. 6 shows a relationship between B of the gradation value T (R, G, B) and Bs of the output image signal value SG (Rs, Gs, Bs).
- the range of the variable component when acquiring the first display characteristics P1R, P1G, and P1B is set to 0 to 255, but this range is an example.
- the range of the variable component is not limited to the above-described range of 0 to 255, and may be another range.
- the range of the variable component may be 0 to 1023.
- the second display characteristic is a characteristic indicating the relationship between the variable component of the gradation value T (R, G, B) and the component corresponding to the invariant component of the output image signal value SG (Rs, Gs, Bs). It is. This characteristic is acquired by setting two invariant components of the gradation value T (R, G, B) to fixed values and changing the remaining variable components.
- the second display characteristic includes, for example, a second display characteristic P2R indicating the relationship between G of the gradation value T (R, G, B) and Rs of the output image signal value SG (Rs, Gs, Bs).
- G of the gradation value T (R, G, B) is a variable component.
- the second display characteristic includes a second display characteristic P2G indicating a relationship between B of the gradation value T (R, G, B) and Gs of the output image signal value SG (Rs, Gs, Bs). (See FIG. 8).
- B of the gradation value T (R, G, B) is a variable component.
- the second display characteristic includes a second display characteristic P2B indicating a relationship between R of the gradation value T (R, G, B) and Bs of the output image signal value SG (Rs, Gs, Bs). (See FIG. 9).
- R of the gradation value T (R, G, B) is a variable component.
- the second display characteristic P2R is a relationship between the component G of the gradation value T (R, G, B) and the component Rs of the output image signal value SG (Rs, Gs, Bs). (See D13 in FIG. 7).
- R of the gradation value T (R, G, B) is fixed to 128, G is changed from 0 to 255, and B is fixed to 0. In this case, the value of the component G of the gradation value T (R, G, B).
- the second display characteristic P2G is a relationship between the component B of the gradation value T (R, G, B) and the component Gs of the output image signal value SG (Rs, Gs, Bs). (See D16 in FIG. 8).
- the component B of the gradation value T (R, G, B) is such that R of the gradation value T (R, G, B) is fixed to 0, G is fixed to 128, and B is changed from 0 to 255. Is the value of the component B of the gradation value T (R, G, B).
- the second display characteristic P2B is a relationship between the component R of the gradation value T (R, G, B) and the component Bs of the output image signal value SG (Rs, Gs, Bs). (See D19 in FIG. 9).
- the R of the gradation value T (R, G, B) is changed from 0 to 255, G is fixed to 0, and B is fixed to 128. This is the value of the component R of the gradation value T (R, G, B) in this case.
- the above-described second display characteristics P2R, P2G, and P2B are examples of the second display characteristics P2.
- the combination of the invariant component and the variable component selected from the gradation value T (R, G, B) may be a combination different from the combination shown in the second display characteristics P2R, P2G, P2B.
- the fixed values are 128 and 0, but may be fixed values different from 128 and 0.
- the graphic processing unit 20 calculates the coefficient ⁇ and the coefficient ⁇ based on the second display characteristic P2 when storing the second display characteristic P2 in the HDD 30.
- the coefficients ⁇ and ⁇ are constants for determining an approximate curve of the second display characteristic P2 as shown in FIGS. 7 to 9, for example.
- the coefficient ⁇ 1 is a constant for setting an approximate curve of the relationship between the component G of the gradation value T (R, G, B) and the component Rs of the output image signal value SG (Rs, Gs, Bs) ( (See D14 in FIG. 7).
- the coefficient ⁇ 1 is set so that the difference between the approximate curve (D14) and the actual display characteristic (D13) is small.
- the coefficient ⁇ 2 is a constant for setting an approximate curve of the relationship between the component B of the gradation value T (R, G, B) and the component Gs of the output image signal value SG (Rs, Gs, Bs) ( (See D17 in FIG. 8).
- the coefficient ⁇ 2 is set so that the difference between the approximate curve (D17) and the actual display characteristic (D16) is small.
- the coefficient ⁇ 3 is a constant for setting an approximate curve of the relationship between the component R of the gradation value T (R, G, B) and the component Bs of the output image signal value SG (Rs, Gs, Bs) ( (See D20 in FIG. 9).
- the coefficient ⁇ 3 is set so that the difference between the approximate curve (D20) and the actual display characteristic (D19) is small.
- the coefficient ⁇ 1 is a constant for setting an approximate curve of the relationship between the component B of the gradation value T (R, G, B) and the component Rs of the output image signal value SG (Rs, Gs, Bs). is there.
- the coefficient ⁇ 2 is a constant for setting an approximate curve of the relationship between the component R of the gradation value T (R, G, B) and the component Gs of the output image signal value SG (Rs, Gs, Bs).
- the coefficient ⁇ 3 is a constant for setting an approximate curve of the relationship between the component G of the gradation value T (R, G, B) and the component Bs of the output image signal value SG (Rs, Gs, Bs).
- the first display characteristic P1, the second display characteristic P2, the coefficient ⁇ , and the coefficient ⁇ may be acquired by the operator using the image color estimation device 1 immediately after the display 5 is introduced. , May be acquired regularly. Moreover, you may acquire every time before starting work.
- image data composed of one color of the gradation values T1 (R, G, B) to Tn (R, G, B) is sequentially displayed on the display 5 one by one.
- a color chart combining image data of gradation values T1 (R, G, B) to Tn (R, G, B) is displayed on one screen, and a measurement signal value is displayed for each color chart.
- Display characteristics P may be acquired by measuring VT (Xs, Ys, Zs).
- first display characteristic P1 and the second display characteristic P2 may be represented by measured values obtained from input values of 0 to 255. Further, the first display characteristic P1 and the second display characteristic P2 may be represented by an approximate function created based on a measured value obtained by inputting only a predetermined condition from among input values of 0 to 255.
- FIG. 10 is a flowchart showing the steps of the image color estimation method.
- the output image signal value SG (Rs, Gs, Bs) is calculated (S121).
- the output image signal value SG (Rs, Gs, Bs) corresponds to the gradation value T (Rt, Gt, Bt).
- This process is executed by the signal value calculation unit 41 (see FIG. 2).
- Rs corresponding to Rt is calculated.
- Rs is a component of the output image signal value SG when only red is lit with the value of Rt.
- a curve D1 that is the first display characteristic P1R regarding red is referred to.
- Rs associated with the value of Rt is searched on the curve D1.
- Gs corresponding to Gt is calculated.
- Gs is a component of the output image signal value SG when only green is lit with the value of Gt.
- Gs associated with the value of Gt is searched on the curve D5.
- Bs corresponding to Bt is calculated.
- Bs is a component of the output image signal value SG when only blue is lit with the value of Bt.
- Bs associated with the value of Bt is searched on the curve D9.
- ⁇ Second calculation step> Subsequently, based on the gradation value T (Rt, Gt, Bt), the offset value calculation unit 42 calculates an offset value Co (Ro, Go, Bo) (S122). This process is executed by the offset value calculation unit 42 (see FIG. 2).
- This offset value Co (Ro, Go, Bo) is calculated by the following equation (3).
- ⁇ Cs and ⁇ C ′s are functions of the gradation value T (Rt, Gt, Bt).
- C1, C2, and C3 are components of the gradation value T selected from the gradation values T (Rt, Gt, Bt). That is, the offset value Co (Ro, Go, Bo) is calculated as a value expressed by a function of the gradation value T (Rt, Gt, Bt).
- ⁇ Rs in the following equation (5) is a value when R is a first component that is an invariant component and G is a second component that is a variable component.
- ⁇ R ′s in the following formula (5) is a numerical value when R is a first component that is an invariant component and B is a third component that is a variable component.
- rg0 (Rt) is a component Rs of an output image signal value SG of an image displayed when image data is input to the display 5.
- R and G are Rt values
- B is zero.
- a curve D2 showing the display characteristics in which R and G are variable components among the display characteristics P relating to red.
- Rs. r00 (Rt) is a component of an output image signal value SG of an image displayed when image data is input to the display 5.
- R is a value of Rt.
- a curve D1 showing the display characteristics with red as a variable component among the display characteristics P relating to red.
- Rs. r00 (Rt) is searched.
- Rs. rg0 (Rt) is calculated.
- rgb (Rt) is a component of an output image signal value SG of an image displayed when image data is input to the display 5.
- R, G, and B are Rt values.
- a curve D4 showing display characteristics with R, G, and B as variable components is referred to.
- Rs. rgb (Rt) is searched.
- ⁇ Gs and ⁇ G ′s are expressed by the following formula (7).
- ⁇ Gs in the following formula (7) is a value when G is a first component that is an invariant component and B is a second component that is a variable component.
- ⁇ G ′s in the following formula (5) is a numerical value when G is a first component that is an invariant component and R is a third component that is a variable component.
- Gs are Gs.
- 0 gb (Gt) is a component Gs of an output image signal value SG of an image displayed when image data is input to the display 5.
- G and B are Gt values, and R is zero.
- D6 indicating a display characteristic in which G and B are variable components among the display characteristic P relating to green (see FIG. 5).
- Gs. 0 gb (Gt) is searched.
- Gs. 0g0 (Gt) is a component of an output image signal value SG of an image displayed when image data is input to the display 5.
- G is a value of Gt
- R and B are 0.
- a curve D5 indicating display characteristics with G as a variable component is referred to.
- Gs. 0g0 (Gt) is searched.
- Gs. 0 gb (Gt) to Gs. ⁇ Gs (Gt) is calculated by subtracting 0g0 (Gt).
- Gs. rgb (Gt) is a component of an output image signal value SG of an image displayed when image data is input to the display 5.
- R, G, and B are Gt values.
- a curve D8 indicating a display characteristic having R, G, and B as variable components is referred to.
- Gs. rgb (Gt) is searched.
- Gs. 0 gb (Gt) is obtained by a process similar to the process described above. And Gs. rgb (Gt) to Gs.
- ⁇ G ′s (Gt) is calculated.
- ⁇ G's (Gt) indicates a deviation of the green component Gs generated by lighting the green component and the red component at the same Gt value at the same time.
- ⁇ G ′s is 0.
- the coefficient ⁇ 2 is referred to. Thereby, since all the variables of the above formula (6) have been determined, Go is calculated.
- Bo is calculated.
- the said Formula (3) is represented like the following formula (8).
- ⁇ Bs and ⁇ B ′s are expressed by the following formula (9).
- ⁇ Bs in the following equation (9) is a value when B is a first component that is an invariant component and R is a second component that is a variable component.
- ⁇ B ′s in the following equation (5) is a numerical value when B is a first component that is an invariant component and G is a third component that is a variable component.
- Bs. r0b (Bt) is the component Bs of the output image signal value SG of the image displayed when the image data is input to the display 5.
- R and B are values of Bt
- G is zero.
- R and B are variable components among the display characteristics P relating to blue (see FIG. 6).
- Bs. r0b (Bt) is searched.
- Bs. 00b (Bt) is a component of an output image signal value SG of an image displayed when image data is input to the display 5.
- B is a value of Bt
- R and G are zero.
- a curve D9 indicating the display characteristic with B as a variable component is referred to.
- Bs. 00b (Bt) is searched.
- Bs. r0b (Bt) By subtracting 00b (Bt), ⁇ Bs (Bt) is calculated.
- Bs. rgb (Bt) is a component of an output image signal value SG of an image displayed when image data is input to the display 5.
- R, G, and B are Bt values.
- P2B relating to blue see FIG. 6
- a curve D12 indicating a display characteristic having R, G, and B as variable components is referred to.
- Bs. rgb (Bt) is searched.
- Bs. r0b (Bt) is obtained by the same process as described above.
- ⁇ B's (Bt) is calculated by subtracting r0b (Bt).
- ⁇ B ′s (Bt) indicates a deviation of the blue component Bs generated by lighting the blue component and the green component at the same value at the same time.
- ⁇ B ′s is 0.
- the coefficient ⁇ 3 is referred to.
- step S122 the offset value Co (Ro, Go, Bo) is calculated based on the formula (1), but the present invention is not limited to this method.
- the measured values D13, D16, and D19 shown in FIGS. 7 to 9 may be approximated by a regression curve, and the offset value Co (Ro, Go, Bo) may be calculated from the regression curve.
- the approximate expression in this case is different from the above expression (1).
- the image color displayed on the display 5 can be estimated with higher accuracy.
- the color difference of the image color estimated using the regression curve is about 1/4 to 1/5 of the color difference of the image color estimated using Equation (1).
- the signal value correction unit 43 calculates a correction value (correction signal value SC (Rc, Gc, Bc)) of the output image signal (S123).
- the correction signal value SC (Rc, Gc, Bc) includes the output image signal value SG (Rs, Gs, Bs) calculated in the first calculation step and the offset value Co (Ro) calculated in the second calculation step. , Go, Bo). This process is executed by the signal value correction unit 43 (see FIG. 2).
- the correction signal value SC (Rc, Gc, Bc) is calculated by the following equation (10).
- Rs, Gs, and Bs correspond to each component of the output image signal value SG (Rs, Gs, Bs) calculated by the signal value calculation unit 41.
- Ro, Go, and Bo correspond to the components of the offset value Co (Ro, Go, Bo) calculated by the offset value calculation unit 42.
- the correction signal value SC (Rc, Gc, Bc) is calculated by adding each component of the output image signal value SG and each component of the offset value Co.
- the correction signal value SC (Rc, Gc, Bc) is converted into a correction signal value ST (Xc, Yc, Zc) (S124).
- the correction signal value ST (Xc, Yc, Zc) is an XYZ color system signal value representing a device-independent color.
- This process is executed by the signal value converter 44 (see FIG. 2).
- the following formula (11) is used for the conversion.
- M is a transformation matrix and is represented by the following equation (12).
- the image color estimation unit 40 performs the following processing. First, an output image signal value SG (Rs, Gs, Bs) of the RGB color system is generated by the signal value calculation unit 41 based on the first display characteristic P1 and the gradation value T (R, G, B). Calculated. Next, the offset value calculation unit 42 uses the first display characteristic P1, the second display characteristic P2, and the gradation value T (R, G, B) based on the components (Rs, The calculation of the offset value Co (Ro, Go, Bo) corresponding to each of Gs, Bs) is calculated.
- the signal value correction unit 43 adds the offset value Co (Ro, Go, Bo) to the output image signal value SG (Rs, Gs, Bs), thereby correcting the RGB color system correction signal value SC (Rc, Gc, Bc) is calculated.
- the signal value conversion unit 44 converts the correction signal value SC (Rc, Gc, Bc) into the correction signal value ST (Xc, Yc, Zc) of the XYZ color system using the conversion matrix M.
- each component of the image color is expressed as the sum of the output image signal value SG (Rs, Gs, Bs) and the offset value Co (Ro, Go, Bo).
- each component of the image color is expressed as the sum of the output image signal value SG (Rs, Gs, Bs) and the offset value Co (Ro, Go, Bo). Yes.
- the output image signal value SG (Rs, Gs, Bs) when the RGB components are turned on simultaneously and the RGB components are turned on individually. This is different from the value obtained by synthesizing the output image signal value SG (Rs, Gs, Bs).
- this different amount is calculated based on the first display characteristic, the second display characteristic, and the gradation value T (R, G, B) as the offset value Co.
- the output image signal value SG (Rs, Gs, Bs) can be corrected using the offset value Co. Therefore, even in a display in which additive color mixture is not established and color tracking occurs, the image color displayed on the display is accurately determined based on the gradation value T (R, G, B) input to the display. Can be estimated.
- the component corresponding to the first component of the output image signal value SG (Rs, Gs, Bs) when only the first component is turned on and the first
- the difference between the component and the component corresponding to the first component of the output image signal value SG (Rs, Gs, Bs) when the component and the second component are turned on is expressed by the first term of the above equation (1). Can be calculated. Further, the component corresponding to the first component of the output image signal value SG (Rs, Gs, Bs) when only the first component is turned on, the first component, and the third component are turned on.
- the difference from the component corresponding to the first component of the output image signal value SG (Rs, Gs, Bs) in this case can be calculated by the second term of the above equation (1). Therefore, even in a display in which additive color mixture is not established and color tracking occurs, the image color displayed on the display is accurately determined based on the gradation value T (R, G, B) input to the display. Can be estimated.
- the offset value Co (Ro, Go, Bo) is calculated using approximate equations (Equations (3) to (9)).
- This approximate expression is a total of 9 graphs including 6 graphs shown in FIGS. 4 to 9 plus 3 graphs obtained from data obtained when the display 5 is turned on with all the RGB components at the same gradation. Based on two graphs. That is, this approximate expression is obtained based on the first value, the second value, and the third value.
- the first value is when two gradation values of the RGB signal are equal and constant (may be zero), and one gradation value of the RGB signal changes from zero to the maximum value.
- the second value is one of the three gradation levels when one gradation value of the RGB signal is a constant value (may be zero), and two gradation values of the RGB signal change from zero to the maximum value. This is the display color value for the combination of key values.
- the third value is the value of the display color when the three gradation values of the RGB signal are equal and change from zero to the maximum value.
- FIG. 11 shows an example of the configuration of an information processing apparatus 1A used in the image color estimation method according to the second embodiment.
- An information processing apparatus 1A shown in FIG. 11 stores a correction matrix L for correcting a zero bias value in the HDD 20 in addition to the configuration of the information processing apparatus 1 of the first embodiment shown in FIG.
- the processing from the first calculation step (S121) to the third calculation step (S123) shown in FIG. 10 is the same as the image processing method of the first embodiment described above. It is the same.
- a correction matrix L is created.
- the graphic processing unit 20 outputs the image data to the display 5.
- each component of the gradation value T (R, G, B) is all zero.
- the measurement signal value VT (Xk, Yk, Zk) is acquired by applying the probe 9a of the colorimeter 9 to the screen of the display 5. This measured value is input from the colorimeter 9 to the PC 3.
- Each component of this tristimulus value corresponds to each component of the correction matrix L. That is, in the case of the measurement signal value VT (Xk, Yk, Zk), the correction matrix L is the following equation (13).
- Mc is a conversion matrix including a correction component of zero bias value.
- an accurate correction signal value ST (Xc, Yc, Zc) of a display image is obtained. Therefore, by including the correction of the zero bias value, the image color displayed on the display 5 can be estimated with higher accuracy.
- Example 1 the image color estimated by using the method according to the present embodiment from the predetermined image data (R, G, B) and the image data (R, G, B) are output to the display 5 and are actually displayed.
- the color difference from the image color was confirmed.
- the color difference between the image color estimated from the predetermined image data (R, G, B) using the method according to the comparative example and the actually displayed image color was confirmed.
- an estimation method using SMM was selected. This SMM is used as standard in the ICC profile.
- four different liquid crystal displays were used.
- the gamma value of the liquid crystal display 5 is 2.2.
- the colorimeter 9 used was TOPCONSR-3AL1.
- the gamma value is a numerical value indicating the response characteristic of the gradation value T (R, G, B) of the image data.
- T gradation value
- the relationship between an input value and an output value is often not a linear function but a relationship approximate to an exponential function.
- the exponent of the power in this exponential function is called the gamma value.
- the information processing apparatus 1 was installed in a dark room and left for about 1 hour after turning on the power to stabilize the equipment.
- the color target was displayed on the entire screen of the liquid crystal display 5, and the output image signal value (Xs, Ys, Zs) at the center of the liquid crystal display 5 was measured using the colorimeter 9.
- the acquired data is 35937 colors in the sRGB color gamut.
- the measured output image signal values (Xs, Ys, Zs) were converted into RGB color system output image signal values SG (Rs, Gs, Bs) using the above equation (2).
- RGB color system output image signal values SG were calculated by the method according to this embodiment. Further, the output image signal value D (RpGpBp) of the RGB color system was calculated by the method according to the comparative example. Next, the color difference between the output image signal value SG (Rs, Gs, Bs) acquired by the colorimeter 9 and the output image signal value SG (Rs, Gs, Bs) calculated by the method according to the present embodiment is calculated. did. Further, the color difference between the output image signal value SG (Rs, Gs, Bs) acquired by the colorimeter 9 and the output image signal value D (RpGpBp) calculated by the method according to the comparative example was calculated.
- FIGS. 12 (a) to 12 (d) show the comparison results of the respective liquid crystal displays.
- FIG. 12A shows the result of the display A.
- FIG. 12B shows the result of the display B.
- FIG. 12C shows the result of the display C.
- FIG. 12D shows the result of the display D.
- the average value of the color difference was 4.80.
- the average value of color differences was 0.63.
- the maximum value of the color difference was 9.99.
- the maximum color difference is 1.47.
- the standard deviation of the color difference was 1.83, and when the method according to the present embodiment was used, the standard deviation of the color difference was 0.26. From this result, it was found that the method according to this embodiment can estimate the image color of the display with higher accuracy than the method according to the comparative example.
- the estimated value obtained by the method according to the present embodiment is the average of the color differences than the estimated value obtained by the method according to the comparative example. Good values were obtained for all of the values, maximum values, and standard deviations. It was also found that the average color difference between the image color estimated by the method according to this embodiment and the image color actually displayed on the display is 1.0 or less. Accordingly, it has been found that the method according to the present embodiment does not establish additive color mixing and can accurately estimate the image color displayed on the display where color tracking occurs.
- additive color mixture is not established, and the image color of the image displayed on the display where color tracking occurs can be estimated with high accuracy.
Landscapes
- Engineering & Computer Science (AREA)
- Multimedia (AREA)
- Signal Processing (AREA)
- Physics & Mathematics (AREA)
- Computer Hardware Design (AREA)
- General Physics & Mathematics (AREA)
- Theoretical Computer Science (AREA)
- Facsimile Image Signal Circuits (AREA)
- Color Image Communication Systems (AREA)
- Image Processing (AREA)
- Processing Of Color Television Signals (AREA)
Abstract
Description

まず、第1の実施形態について説明する。図1は、第1実施形態の画像色推定方法を実現する画像色推定プログラムを実行する情報処理装置(画像色推定装置)1の構成を示す図である。この情報処理装置1は、パーソナルコンピュータ3(以下「PC」という)、ディスプレイ5、プリンタ7、及び測色計9を備えている。この情報処理装置1は、ディスプレイ5に表示される画像色を精度良く推定する機能を有している。推定した画像色のデータは、測色的な印刷が可能なプリンタ7に出力される。これにより、情報処理装置1は、ディスプレイ5に表示された画像の画像色と、プリンタ7により印刷された印刷物の色とを精度良く一致させることができる。

階調値T(R,G,B)は、ディスプレイ5に入力される階調値である。出力画像信号値SG(Rs,Gs,Bs)は、ディスプレイ5に表示される出力画像信号値である。この第1の表示特性P1Rには、階調値T(R,G,B)と出力画像信号値SG(Rs,Gs,Bs)との関係を示す、4つの入力条件下における特性が含まれている。すなわち、第1の表示特性P1Rには、階調値T(R,G,B)のRを可変成分とし、GとBとを不変成分とした場合の特性が含まれている(図4のD1参照)。階調値T(R,G,B)のRは0~255の範囲で変化される。また、第1の表示特性P1Rには、階調値T(R,G,B)のRとGとを可変成分とし、Bを不変成分とした場合の特性が含まれている(図4のD2参照)。
階調値T(R,G,B)のRとGとは0~255の範囲で変化される。また、第1の表示特性P1Rには、階調値T(R,G,B)のRとBとを可変成分とし、Gを不変成分とした場合の特性が含まれている(図4のD3参照)。階調値T(R,G,B)のRとBとは0~255の範囲で変化される。更に、第1の表示特性P1Rには、階調値T(R,G,B)のRとGとBとを可変成分とした場合の特性が含まれている(図4のD4参照)。階調値T(R,G,B)のRとGとBとは0~255の範囲で変化される。
まず、出力画像信号値SG(Rs,Gs,Bs)を算出する(S121)。出力画像信号値SG(Rs,Gs,Bs)は、階調値T(Rt,Gt,Bt)に対応する。この処理は、信号値算出部41(図2参照)により実行される。まず、Rtに対応するRsを算出する。ここで、Rsは赤色のみをRtの値で点灯させた場合の出力画像信号値SGの成分である。赤色に関する第1の表示特性P1RであるカーブD1が参照される。次に、カーブD1上で、Rtの値に関連付けられたRsが検索される。
続いて、階調値T(Rt,Gt,Bt)を基に、オフセット値算出部42は、オフセット値Co(Ro,Go,Bo)を算出する(S122)。この処理は、オフセット値算出部42(図2参照)により実行される。このオフセット値Co(Ro,Go,Bo)は下記式(3)により算出される。ここで、ΔCs、ΔC’sは、階調値T(Rt,Gt,Bt)の関数である。C1、C2、C3は階調値T(Rt,Gt,Bt)から選択される階調値Tの成分である。すなわち、オフセット値Co(Ro,Go,Bo)は、階調値T(Rt,Gt,Bt)の関数で表現される値として算出される。






続いて、信号値補正部43は、出力画像信号の補正値(補正信号値SC(Rc,Gc,Bc))を算出する(S123)。補正信号値SC(Rc,Gc,Bc)は、第1の算出ステップで算出された出力画像信号値SG(Rs,Gs,Bs)と、第2の算出ステップで算出されたオフセット値Co(Ro,Go,Bo)とを基に算出される。この処理は、信号値補正部43(図2参照)により実行される。補正信号値SC(Rc,Gc,Bc)は、下記式(10)により算出される。

続いて、補正信号値SC(Rc,Gc,Bc)を、補正信号値ST(Xc,Yc,Zc)に変換する(S124)。補正信号値ST(Xc,Yc,Zc)は、デバイス非依存の色を表すXYZ表色系の信号値である。この処理は、信号値変換部44(図2参照)により実行される。変換には、下記式(11)が用いられる。ここで、Mは変換行列であり、下記式(12)により示される。この行列の要素は、階調値T(R,G,B)の成分が全て最高輝度(R=255、G=255、B=255)であるときの三刺激値(XYZ)である。上述の手順により、メモリ10に保存された画像データがディスプレイ5に表示された場合の画像色が推定される。


次に、第2実施形態について説明する。第2実施形態と、上述した第1実施形態とで異なる点は、第4のステップにおいて、補正信号値SC(Rc,Gc,Bc)に対して、XYZ表色系の補正信号値ST(Xc,Yc,Zc)に変換すると共に、ゼロバイアス値の補正を行う点である。

次に、補正信号値SC(Rc,Gc,Bc)をXYZ値に変換する処理と併せて、ゼロバイアス値の補正を行う。この処理は、信号値変換部44(図11参照)により実行される。変換には、下記式(14)が用いられる。ここで、Mcはゼロバイアス値の補正成分を含んだ変換行列である。Mcは下記式(15)により示される。この行列の要素は、出力画像信号値(XYZ)から、補正行列Lの各成分を減算したものである。この出力画像信号値(XYZ)は、階調値T(R,G,B)の成分が全て最高輝度(R=255、G=255、B=255)である。上述の手順により、ゼロバイアス補正がなされた画像色が算出される。


次に、所定の画像データ(R,G,B)から本実施形態に係る方法を用いて推定した画像色と、画像データ(R,G,B)をディスプレイ5に出力し、実際に表示された画像色との色差を確認した。また、所定の画像データ(R,G,B)から比較例に係る方法を用いて推定した画像色と、実際に表示された画像色との色差を確認した。比較例に係る方法として、SMMを用いて推定する方法を選択した。このSMMは、ICCプロファイルにおいて標準的に使用されている。また、評価にはそれぞれ異なる4台の液晶ディスプレイを用いた。この液晶ディスプレイ5のガンマ値は2.2である。また、測色計9は、TOPCONSR-3AL1を用いた。なお、ガンマ値とは、画像データの階調値T(R,G,B)の応答特性を示す数値をいう。画像表示装置では、入力値と出力値の関係は一次関数でなく、指数関数に近似した関係であることが多い。この指数関数におけるべき乗の指数をガンマ値という。
Claims (6)
- ディスプレイに入力されるRGB表色系の階調値(R,G,B)から、前記ディスプレイに表示される画像のデバイス非依存の色を表すXYZ表色系の信号値(XYZ)を推定する画像色推定方法であって、
第1の表示特性、及び前記階調値(R,G,B)に基づいて、RGB表色系の信号値(Rs,Gs,Bs)を算出する第1の算出ステップと、
前記第1の表示特性、第2の表示特性、及び前記階調値(R,G,B)に基づいて、前記信号値の成分(Rs,Gs,Bs)のそれぞれに対応するオフセット値(Ro,Go,Bo)を算出する第2の算出ステップと、
前記信号値(Rs,Gs,Bs)に前記オフセット値(Ro,Go,Bo)を加えることにより、RGB表色系の補正信号値(Rc,Gc,Bc)を算出する第3の算出ステップと、
前記補正信号値(Rc,Gc,Bc)を、変換行列を用いて、前記信号値(Xc,Yc,Zc)に変換する第4の算出ステップと、を含み、
前記第1の表示特性は、前記階調値(R,G,B)うち、少なくとも1つの成分を可変成分とした場合の、前記階調値(R,G,B)の前記可変成分と、前記信号値(Rs,Gs,Bs)の前記可変成分に対応する成分との関係であり、
前記第2の表示特性は、前記階調値(R,G,B)うち、2つの不変成分を固定値に設定し、残りの可変成分を変化させた場合の、前記階調値(R,G,B)の前記可変成分と、前記信号値(Rs,Gs,Bs)の前記不変成分に対応する成分との関係である、画像色推定方法。 - 前記オフセット値(Ro,Go,Bo)は、前記階調値(R,G,B)の関数である、請求項1に記載の画像色推定方法。
- 前記オフセット値(Ro,Go,Bo)は、下記式(1);

C2は階調値(R,G,B)の成分から選択される第1の成分とは別の第2の成分、
C3は階調値(R,G,B)の成分から選択される第1の成分及び第2の成分とは別の第3の成分、
ΔCsは前記第1の成分を前記不変成分とし、前記第2の成分を前記可変成分としたときの一の前記第1の表示特性に基づいて算出される数値、
ΔC’sは前記第1の成分を前記不変成分とし、前記第3の成分を前記可変成分としたときの他の前記第1の表示特性に基づいて算出される数値、
αは一の前記第2の表示特性を近似する近似関数の係数、
βは他の前記第2の表示特性を近似する近似関数の係数、に示す関数である、請求項2に記載の画像色推定方法。 - 前記第4のステップでは、更にゼロバイアス値を用いた補正を含み、
前記ゼロバイアス値は、各成分がゼロである前記階調値(R,G,B)を前記ディスプレイに入力した場合に、前記ディスプレイに表示されるXYZ表色系の信号値(Xk,Yk,Zk)である、請求項1~請求項3のいずれか一項に記載の画像色推定方法。 - ディスプレイに入力されるRGB表色系の階調値(R,G,B)から、前記ディスプレイに表示される画像のデバイス非依存の色を表すXYZ表色系の信号値(XYZ)を推定する画像色推定装置であって、
第1の表示特性、及び前記階調値(R,G,B)に基づいて、RGB表色系の信号値(Rs,Gs,Bs)を算出する信号値算出部と、
前記第1の表示特性、第2の表示特性、及び前記階調値(R,G,B)に基づいて、前記信号値の成分(Rs,Gs,Bs)のそれぞれに対応するオフセット値(Ro,Go,Bo)を算出するオフセット値算出部と、
前記信号値(Rs,Gs,Bs)に前記オフセット値(Ro,Go,Bo)を加えることにより、RGB表色系の補正信号値(Rc,Gc,Bc)を算出する信号値補正部と、
前記補正信号値(Rc,Gc,Bc)を、変換行列を用いて、前記信号値(Xc,Yc,Zc)に変換する信号値変換部と、を含み、
前記第1の表示特性は、前記階調値(R,G,B)うち、少なくとも1つの成分を可変成分とした場合の、前記階調値(R,G,B)の前記可変成分と、前記信号値(Rs,Gs,Bs)の前記可変成分に対応する成分との関係であり、
前記第2の表示特性は、前記階調値(R,G,B)うち、2つの不変成分を固定値に設定し、残りの可変成分を変化させた場合の、前記階調値(R,G,B)の前記可変成分と、前記信号値(Rs,Gs,Bs)の前記不変成分に対応する成分との関係である、画像色推定装置。 - ディスプレイに入力されるRGB表色系の階調値(R,G,B)から、前記ディスプレイに表示される画像のデバイス非依存の色を表すXYZ表色系の信号値(XYZ)を推定する画像色推定プログラムであって、
コンピュータを、
第1の表示特性、及び前記階調値(R,G,B)に基づいて、RGB表色系の信号値(Rs,Gs,Bs)を算出する信号値算出部と、
前記第1の表示特性、第2の表示特性、及び前記階調値(R,G,B)に基づいて、前記信号値の成分(Rs,Gs,Bs)のそれぞれに対応するオフセット値(Ro,Go,Bo)を算出するオフセット値算出部と、
前記信号値(Rs,Gs,Bs)に前記オフセット値(Ro,Go,Bo)を加えることにより、RGB表色系の補正信号値(Rc,Gc,Bc)を算出する信号値補正部と、
前記補正信号値(Rc,Gc,Bc)を、変換行列を用いて、前記信号値(Xc,Yc,Zc)に変換する信号値変換部として機能させ、
前記第1の表示特性は、前記階調値(R,G,B)うち、少なくとも1つの成分を可変成分とした場合の、前記階調値(R,G,B)の前記可変成分と、前記信号値(Rs,Gs,Bs)の前記可変成分に対応する成分との関係であり、
前記第2の表示特性は、前記階調値(R,G,B)うち、2つの不変成分を固定値に設定し、残りの可変成分を変化させた場合の、前記階調値(R,G,B)の前記可変成分と、前記信号値(Rs,Gs,Bs)の前記不変成分に対応する成分との関係である、画像色推定プログラム。
Priority Applications (2)
| Application Number | Priority Date | Filing Date | Title |
|---|---|---|---|
| US13/989,978 US9311885B2 (en) | 2010-11-30 | 2011-11-30 | Image color estimation method, image color estimation device, and image color estimation program |
| JP2012546917A JP5825600B2 (ja) | 2010-11-30 | 2011-11-30 | 画像色推定方法、画像色推定装置、及び画像色推定プログラム |
Applications Claiming Priority (2)
| Application Number | Priority Date | Filing Date | Title |
|---|---|---|---|
| JP2010267389 | 2010-11-30 | ||
| JP2010-267389 | 2010-11-30 |
Publications (1)
| Publication Number | Publication Date |
|---|---|
| WO2012074014A1 true WO2012074014A1 (ja) | 2012-06-07 |
Family
ID=46171941
Family Applications (1)
| Application Number | Title | Priority Date | Filing Date |
|---|---|---|---|
| PCT/JP2011/077687 Ceased WO2012074014A1 (ja) | 2010-11-30 | 2011-11-30 | 画像色推定方法、画像色推定装置、及び画像色推定プログラム |
Country Status (3)
| Country | Link |
|---|---|
| US (1) | US9311885B2 (ja) |
| JP (1) | JP5825600B2 (ja) |
| WO (1) | WO2012074014A1 (ja) |
Families Citing this family (1)
| Publication number | Priority date | Publication date | Assignee | Title |
|---|---|---|---|---|
| KR102349384B1 (ko) * | 2017-03-15 | 2022-01-11 | 삼성전자주식회사 | 투명 디스플레이 장치, 그 제어 방법 및 컴퓨터 판독가능 기록 매체 |
Citations (2)
| Publication number | Priority date | Publication date | Assignee | Title |
|---|---|---|---|---|
| JPH08294009A (ja) * | 1995-04-20 | 1996-11-05 | Canon Inc | 画像処理装置及びその方法、及びシステム |
| JP2008515340A (ja) * | 2004-10-01 | 2008-05-08 | キヤノン株式会社 | プロジェクタのカラーキャラクタリゼーション |
Family Cites Families (9)
| Publication number | Priority date | Publication date | Assignee | Title |
|---|---|---|---|---|
| WO2001015129A1 (en) | 1999-08-25 | 2001-03-01 | Fujitsu Limited | Display measuring method and profile preparing method |
| US6844881B1 (en) * | 2002-03-29 | 2005-01-18 | Apple Computer, Inc. | Method and apparatus for improved color correction |
| US20060050079A1 (en) * | 2002-10-31 | 2006-03-09 | Moshe Ben-Chorin | System and method of selective adjustment of a color display |
| JP3751621B2 (ja) | 2003-10-23 | 2006-03-01 | 株式会社ナナオ | 表示特性較正方法、表示特性較正装置及びコンピュータプログラム |
| CN100533543C (zh) * | 2003-12-12 | 2009-08-26 | 松下电器产业株式会社 | 彩色图像显示装置、色变换装置、色彩模拟装置及方法 |
| JP2005208982A (ja) | 2004-01-23 | 2005-08-04 | Dainippon Printing Co Ltd | モニタプロファイル作成システム、プログラム及び記録媒体 |
| US7668365B2 (en) * | 2004-03-08 | 2010-02-23 | Seiko Epson Corporation | Determination of main object on image and improvement of image quality according to main object |
| US9330630B2 (en) * | 2008-08-30 | 2016-05-03 | Sharp Laboratories Of America, Inc. | Methods and systems for display source light management with rate change control |
| JP2010281888A (ja) * | 2009-06-02 | 2010-12-16 | Seiko Epson Corp | 集積回路装置、電気光学装置及び電子機器 |
-
2011
- 2011-11-30 JP JP2012546917A patent/JP5825600B2/ja not_active Expired - Fee Related
- 2011-11-30 US US13/989,978 patent/US9311885B2/en not_active Expired - Fee Related
- 2011-11-30 WO PCT/JP2011/077687 patent/WO2012074014A1/ja not_active Ceased
Patent Citations (2)
| Publication number | Priority date | Publication date | Assignee | Title |
|---|---|---|---|---|
| JPH08294009A (ja) * | 1995-04-20 | 1996-11-05 | Canon Inc | 画像処理装置及びその方法、及びシステム |
| JP2008515340A (ja) * | 2004-10-01 | 2008-05-08 | キヤノン株式会社 | プロジェクタのカラーキャラクタリゼーション |
Non-Patent Citations (2)
| Title |
|---|
| NOBUHIKO TAMURA ET AL.: "Calibration of LCD Colorimetry Considering Channel Interaction", THE JOURNAL OF THE INSTITUTE OF IMAGE INFORMATION AND TELEVISION ENGINEERS, vol. 56, no. 8, 2002, pages 1315 - 1320 * |
| TOSHIYUKI WAKEBE ET AL.: "Color Reproduction Method Reducing Reproduction Error Induced by Color Tracking, Device Drift and Imperfect Additivity", IEICE TECHNICAL REPORT, vol. 105, no. 617, 17 February 2006 (2006-02-17), pages 37 - 40 * |
Also Published As
| Publication number | Publication date |
|---|---|
| JP5825600B2 (ja) | 2015-12-02 |
| JPWO2012074014A1 (ja) | 2014-05-19 |
| US20130328911A1 (en) | 2013-12-12 |
| US9311885B2 (en) | 2016-04-12 |
Similar Documents
| Publication | Publication Date | Title |
|---|---|---|
| CN100583945C (zh) | 图像处理装置、图像处理方法 | |
| JP6108933B2 (ja) | キャリブレーション装置及びその制御方法 | |
| JP4623137B2 (ja) | 色処理装置、方法及びプログラム | |
| JP5037311B2 (ja) | カラー再現システム及び方法 | |
| US20100309218A1 (en) | Method for color calibration and device using the same | |
| JP2012023627A (ja) | 色変換係数生成装置、色再現特性修正装置及びプログラム | |
| CN115035835B (zh) | 一种屏幕色域的校准方法及其装置 | |
| US20070139678A1 (en) | Profile creating apparatus, profile creating program storage medium, and image output apparatus | |
| CN102511050B (zh) | 用于优化显示器配置文件的方法 | |
| KR20070043535A (ko) | 모니터의 색특성을 보정하는 방법 및 장치 | |
| WO1999056088A1 (en) | Method to estimate the white point on a display device | |
| JP4938669B2 (ja) | 色処理方法およびその装置 | |
| US8687013B2 (en) | Method, apparatus and system for providing a color device characterization with a quality evaluation | |
| JP5825600B2 (ja) | 画像色推定方法、画像色推定装置、及び画像色推定プログラム | |
| JP2008177783A (ja) | 色変換装置及びプログラム | |
| US7847986B2 (en) | Multiband color management | |
| JP3815542B2 (ja) | 色変換装置、色変換係数算出装置、色変換方法、及び色変換係数算出方法 | |
| JP2011205467A (ja) | 色処理装置及びプログラム | |
| JP2002247396A (ja) | プリンターの色補正方法及びこの装置 | |
| WO2007083717A1 (ja) | 色変換マトリクス作成方法及び色変換方法 | |
| JP2011197428A (ja) | 階調補正装置、ディスプレイおよび階調補正方法 | |
| JPH11298746A (ja) | 色信号変換テーブル作成方法および色信号変換方法 | |
| JP6753238B2 (ja) | 指標表示装置および指標表示プログラム | |
| JP5651663B2 (ja) | 3dlut生成方法、3dlut生成装置及びコンピュータプログラム | |
| JP2006217377A (ja) | ディスプレイ較正方法及びディスプレイ較正用プログラム |
Legal Events
| Date | Code | Title | Description |
|---|---|---|---|
| 121 | Ep: the epo has been informed by wipo that ep was designated in this application |
Ref document number: 11844987 Country of ref document: EP Kind code of ref document: A1 |
|
| ENP | Entry into the national phase |
Ref document number: 2012546917 Country of ref document: JP Kind code of ref document: A |
|
| NENP | Non-entry into the national phase |
Ref country code: DE |
|
| WWE | Wipo information: entry into national phase |
Ref document number: 13989978 Country of ref document: US |
|
| 122 | Ep: pct application non-entry in european phase |
Ref document number: 11844987 Country of ref document: EP Kind code of ref document: A1 |